
Abstract
Objectives:
This study aims to introduce a prediction model based on a machine learning approach as an efficient solution for prediction purposes to better prognosis and increase CRC survival.
Methods:
In the current retrospective study, we used the data of 1062 CRC cases to analyse and establish a prediction model for the 5-year CRC survival. The machine learning algorithms were used to develop prediction models, including random Forest, XG-Boost, bagging, logistic regression, support vector machine, artificial neural network, decision tree, and K-nearest neighbours.
Results:
The current study revealed that the XG-Boost with AU-ROC of 0.906 and 0.813 for internal and external conditions gave us better insight into predictability and generalizability than other algorithms.
Conclusion:
XG-Boost can be utilised as a knowledge source for implementing intelligent systems as an assistive tool for clinical decision-making in healthcare settings to improve prognosis and increase CRC survival through various clinical solutions that doctors can achieve.
Highlights
• Machine learning algorithms were leveraged to establish prediction models for the 5-year survival of CRC.
• A combination of pathological, laboratory, therapy, socioeconomics, and lifestyle factors was used to predict this topic.
• XG-Boost is a satisfactory model for predicting the 5-year survival of CRC.
• The pathological and therapy factors are remarkable for prediction on this topic.
• This study demonstrated a favourable generalizability of the XG-Boost model in different clinical environments.
Introduction
Colorectal cancer (CRC) is the development and growth of tumour masses as abnormal cells in any region from the colon to the rectum.1,2 This cancer type, with 1 400 000 and roughly 700 000 deaths, is considered the third most prevalent and fourth cause of mortality among other cancers worldwide.3-5 As a primary concern of public health, CRC, with 135 430 and 50 260 rates related to new cases and death, is regarded as the third most common cancer and the second cause of death in the USA.6,7 This disease is increasing in developing countries, especially those achieving the Western lifestyle.8,9 Also, despite the increasing trends of CRC in incidence and mortality rate in low and middle-income countries, it is stable or in the downward state in high-income ones.10,11
CRC accounts for the third most common cancer in Iran and is considered the fourth most prevalent cancer in men after stomach, bladder, and prostate and the second in women following breast cancer.12,13 This disease constitutes 10% and 9.4% of cancer incidence and death, respectively, reaching 3.2 million cases globally by 2040.14,15 This sharp escalation is due to the increase in the population of older adults and human development.15,16 It’s demonstrated that the CRC has an ascending incidence trend in Iran.12,17 The GLOBOCAN announced that the CRC incidence will double in Iran before 2040.18,19
One way to evaluate the efficiency of the healthcare measures for disease control and the effects of various treatment plans is by estimating CRC survival. 20 The 5-year CRC survival has different amounts between nations globally; for example, this rate is less than 8% in African countries to 64%-65% in South Korea and the USA. Also, The 5-year CRC survival ranges from 27% to 85% in different points of Iran.9,21,22 The 5-year CRC survival has increased from 37.9% in 1998-2002 to 78.6% in recent years due to the early detection of this disease in the localised tumour condition. 23 Also, the current plan for CRC prognosis uses the classic Tumor, Node, and Metastasis staging classification system, so we require a more accurate and efficient prediction model to provide better insight into the prognosis and increase the treatment efficiency. 24
So far, machine learning (ML) techniques have gained competency in establishing efficient prediction models with high accuracy in various aspects of medicine.25,26 They have shown more potential in prediction aims than other methods, such as deep learning, especially when dealing with routine clinical data, despite images, signals, or videos. 27 Also, they have demonstrated more efficient and accurate survival predictability associated with cancer diseases, and they have been introduced as an alternative and convenient way to some conventional statistical methods, such as Cox, for prediction purposes even without prior knowledge of data. 28 As mentioned, developing a prediction model based on the prognostic factors has a significant role in promoting clinical solutions such as treatment strategies by early prediction prognosis of this disease at an earlier stage. Therefore, the current study aims to establish a prediction model based on machine learning to predict the 5-year CRC survival based on the prognostic factors to a better prognosis and clinical efficiency and then increase CRC survival among patients.
Methods
Community of study and database characteristics
As a data-driven and retrospective of the current study, the community research comprised CRC-confirmed cases referred to Masoud Clinical Center in Tehran City from January 2018 to December 2023. During 6 years of referral, the data of 1062 CRC cases were stored in one database. Six hundred sixty-one and 401 cases were associated with the non-survived and survived instances, respectively. The surviving cases were patients who had the CRC-positive diagnosis in their records at that centre and were alive 5 years after the primary diagnosis. On the contrary, the non-survived cases had similar characteristics but died after 5 years.
Database preprocessing
In the current study, we first prepared the current database to establish the optimal prediction model for CRC survival. First, any duplicate and noisy data were removed from the study. Second, we confronted the missing values in cases in the database. We had two scenarios for the missing values: 1-for the instances with more than 5% missing values, we excluded these cases from the study to prevent bias in further analysis. The rationale for using this amount for deleting the cases was associated with two factors: The current database had almost complete data, and considering this amount didn’t challenge our database with losing a high case omission rate. Also, with this low amount considered for case omission, the characteristics of the original database would be more preserved. 2-If the lost data in cases were less than 5%, we leveraged the mode of each value associated with the corresponding feature to fill in the missing values.
Input and outcome variables
The prognostic factors included in the current database were categorised into demographic factors, including age, sex, place of residence, Body Mass Index (BMI), lifestyle factors such as smoking and alcohol consumption, personal history of diabetes and hypertension, familial history of CRC, therapy factors such as surgery, chemotherapy, radiotherapy, and hormonotherapy, pathological factors including, tumor stage, tumor recurrence, tumor differentiation, lymphovascular invasion, perineural invasion, tumor location, and laboratory factors such as hemoglobin and white blood cells (WBC) count. The outcome variable was the 5-year survival status of CRC patients categorised into two situations of survived and non-survived, specified as 0 and 1 codes in the current database, respectively.
Feature selection
Before performing the ML process, we leveraged the feature selection (FS) technique. FS is defined as eliminating irrelevant features to clean and increase the quality of the database. 29 It is beneficial in preventing the overfitting of the ML algorithms, enhancing the speed of calculations, increasing the accuracy of algorithms, better understating the data, and improving generalisation. 30 In the current study, we used binary logistic regression (BLR) as a combinatory correlation analysis and weighting by Gini Index (GI) score to obtain the best prognostic factors influencing the 5-year CRC survival. The P < .05 was considered to select the best factors. We put the GI = 0.5 as a threshold to select the factors based on the GI. In other words, the factors with GI ⩽ 0.5 (more robust classification of cases by variable) were considered influential factors in predicting the 5-year CRC survival among patients. On the contrary, the factors obtained GI > 0.5 (weaker classification of cases by variable) were excluded from the data analysis and ML model building.
Model establishment and assessment
We leveraged chosen ML algorithms to build the prediction models for the 5-year CRC survival. In this respect, the algorithms of Random Forest (RF), XG-Boost, bagging, logistic regression (LR), Support Vector Machine (SVM), Artificial Neural Networks (ANN), Decision Tree (DT), and K-nearest Neighbors (KNN) were utilised to establish the prediction models. These ML algorithms were leveraged due to their high applicability and favourable performance for prediction purposes, as demonstrated in other biomedical research.31,32 The performance of the chosen algorithms was evaluated by using the positive predictive value (PPV) (equation (1)), negative predictive value (NPV) (equation (2)), sensitivity (equation (3)), specificity (equation (4)), accuracy (equation (5)), F-Score (equation (6)), and the Area Under the Receiver Operator Characteristics (AU-ROC). In equations, the TP and TN refer to non-survived and survived cases correctly categorised by the ML algorithms. FN and FP are these cases that are incorrectly classified.
The Grid search method was used to adjust the ML algorithms’ hyperparameters during the learning process. In this method, each algorithm is tested manually using different ranges of hyperparameter values, and the best algorithm is chosen based on the best combination of values, possessing higher performance. We used the K-fold cross-validation as a data-splitting strategy for the learning process. In this strategy, the data are split into K sections. One section tests the algorithms’ performance, and (K-1) sections are used for training them. This process randomly occurs in K epochs, and the data are chosen randomly for training and testing processes in each epoch. The algorithms’ performance is equal to the average performance of epochs. The stratified K-fold cross-validation is more common considering the data imbalance based on the class distribution. This way, the data are sampled randomly based on the class distribution, which is crucial in reducing the bias created during the learning process. 33 In the current study, the (K = 10) was used to split the data as a widely used data-splitting strategy in other studies, 34 so the stratified 10-fold cross-validation is leveraged for testing and training purposes.


External validation assessment
In the current study, we used the external validation assessment to measure the generalizability and applicability of our prediction model in other clinical settings. We used 108 CRC cases from the Imam Khomeini Hospital in Sari City to evaluate the generalizability. Among these CRC cases, 68 and 40 cases were associated with non-survived and survived instances, respectively. To assess the generalizability of the algorithm, we used the classifiability metrics of TP, FP, FN, and TN, as well as the AU-ROC in the internal and external modes. Moreover, we highlighted the importance of the prognostic factors in the internal and external modes. In this regard, we used the relative importance of the two modes (RI) obtained by the ML algorithm.
Result
Database preparation and sample characteristics
First, by identifying the duplicate cases belonging to one patient with the same ID in the current database, eight cases were removed from the study, including two and six cases associated with the survived and non-survived cases. Second, 11 cases, including 4 and 7 cases belonging to survived and non-survived patients with more than 5% missing data, were excluded from the current study. The lost data of 31 cases with less than 5% missing data were filled by the mode of the values of the corresponding feature. Finally, the 1043 CRC cases were included in the current study. Among these cases, 648 and 395 belonged to the non-survived and survived cases, respectively. The statistical characteristics of the cases included in the data analysis are presented in Table 1. The difference between the two survived and non-survived groups is given by the Chi-square (P < .05).
Characteristics of cases included in the analysis.

Kilogram/metre. **per microliter.
According to Table 1, the prognostic factors including age, BMI, smoking, diabetes, hypertension, familial history of CRC, surgery, chemotherapy, radiotherapy, hormonotherapy, tumor stage, tumor recurrence, tumor differentiation, lymphovascular invasion, perineural invasion, tumor location, hemoglobin level, and WBC obtained difference between the survived and non-survived cases at P < .05. On the contrary, the sex, place of residence, and alcohol consumption didn’t significantly differ between the two groups.
Feature selection
The results of feature selection based on the BLR are presented in Table 2.
The BLR to screen important factors.

In Table 2, β implies the regression coefficient, OR is the odd ratio, and CI is the confidence interval. As this table shows, the factors including age (β = .563, OR = 1.248, 95% CI of OR = [1.113-1.684]), BMI(β = −.548, OR = 0.693, 95% CI of OR = [0.559-0.827]), smoking (β = .447, OR = 1.224, 95% CI of OR = [1.126-1.487]), diabetes (β = .281, OR = 1.095, 95% CI of OR = [1.07-1.113]), familial history of CRC (β = .552, OR = 1.288, 95% CI of OR = [1.201-1.455]), surgery (β = .761, OR = 1.453, 95% CI of OR = [1.394-2.217]), chemotherapy (β = .807, OR = 1.526, 95% CI of OR = [1.438-2.543]), radiotherapy (β = .61, OR = 1.399, 95% CI of OR = [1.296-1.984]), hormonotherapy (β = .221, OR = 1.069, 95% CI of OR = [1.05-1.1]), tumor stage (β = .746, OR = 1.427, 95% CI of OR = [1.334-1.761]), tumor recurrence (β = .597, OR = 1.303, 95% CI of OR = [1.206-1.829]), tumor differentiation (β = .664, OR = 1.474, 95% CI of OR = [1.328-1.683]), lymphovascular invasion (β = .499, OR = 1.266, 95% CI of OR = [1.201-1.384]), perineural invasion (β = .315, OR = 1.102, 95% CI of OR = [1.077-1.192]), tumor site (β = .689, OR = 1.494, 95% CI of OR = [1.399-1.548]), hemoglobin level (β = .577, OR = 1.295, 95% CI of OR = [1.202-1.384]), and WBC count (β = .621, OR = 1.374, 95% CI of OR = [1.284-1.475]) obtained the significant relationship with 5-year CRC survival (P < .05). On the contrary, the prognostic factors, including sex, place of residence, alcohol consumption, and hypertension, were excluded from further analysis.
Figure 1 shows the importance of prognostic factors based on the GI scoring technique.

Scoring the prognostic factors by using the GI score.
As Figure 1 shows, the factors including age (GI = 0.35), smoking (GI = 0.29), diabetes (GI = 0.47), familial history of CRC (GI = 0.37), surgery (GI = 0.25), chemotherapy (GI = 0.22), radiotherapy (GI = 0.29), hormonotherapy (GI = 0.33), tumor stage (GI = 0.17), tumor recurrence (GI = 0.26), tumor differentiation (GI = 0.24), lymphovascular invasion (GI = 0.18), perineural invasion (GI = 0.35), tumor location (GI = 0.26), hemoglobin level (GI = 0.33), and WBC count (GI = 0.39) were considered as the best factors for predicting the 5-year CRC survival by obtaining GI < 0.5. On the contrary, the factors including sex (GI = 0.64), place of residence (GI = 0.68), BMI (GI = 0.53), alcohol consumption (GI = 0.56), and hypertension (GI = 0.62) with GI > 0.5 were not considered as critical prognostic factors based on the GI.
Model development and assessment
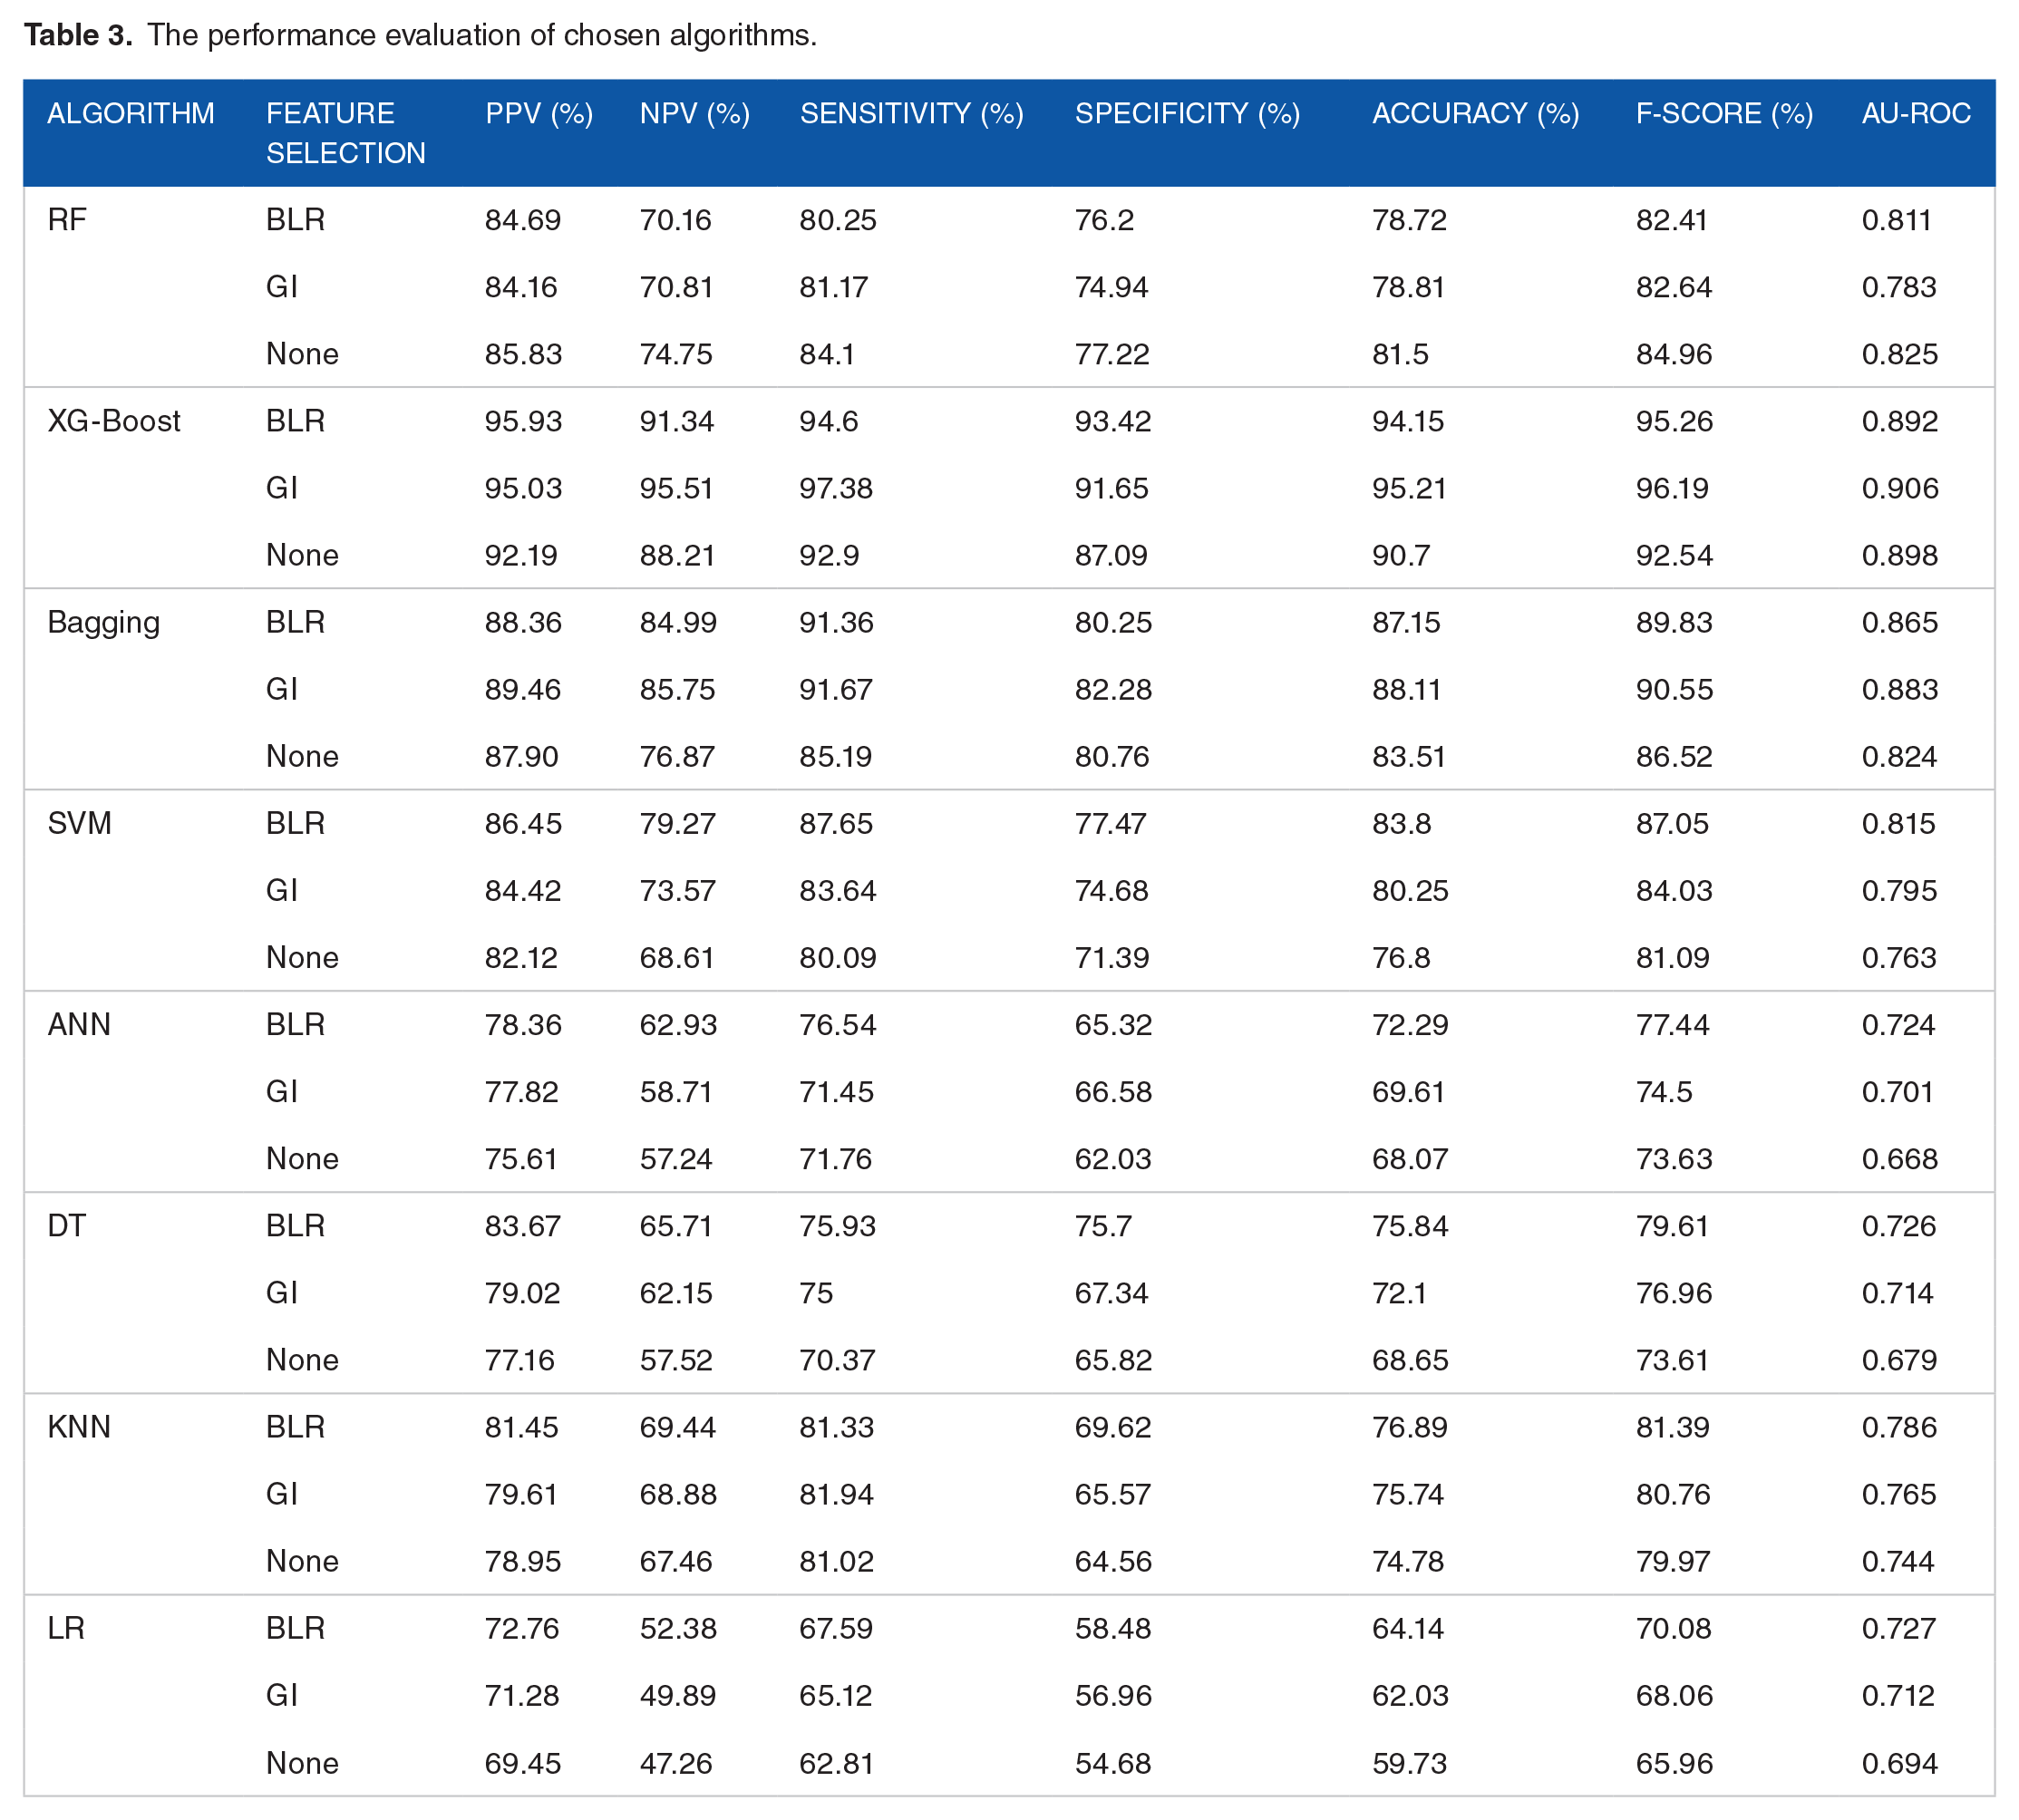
The results of the performance evaluation of chosen algorithms by using 10-fold cross-validation as a data splitting strategy with the optimised hyperparameters by the Grid search method in three conditions of all features, selected features by BLR, and features chosen by using the GI are presented in Tables 3 and 4, respectively.
The performance evaluation of chosen algorithms.
The hyperparameters optimised by Grid search.

Based on Tables 3 and 4, using the best-optimised hyperparameters, first, we compared the performance of algorithms in conditions and then determined the best one for prediction purposes. The RF with PPV of 85.83%, NPV of 74.75%, sensitivity of 84.1%, specificity of 77.22%, accuracy of 81.5%, F-score of 84.96%, and AU-ROC of 0.825 in the non-FS state obtained high performance than other states. XG-Boost with PPV of 95.93% and specificity of 93.42% in the BLR FS method and NPV of 95.51%, sensitivity of 97.38%, accuracy of 95.21%, F-score of 96.19%, and AU-ROC of 0.906 in the GI FS method outperformed other states.
Bagging with PPV of 89.46%, NPV of 85.75%, sensitivity of 91.67%, specificity of 82.28%, accuracy of 88.11%, F-score of 90.55% and AU-ROC of 0.883 in the GI FS method obtained higher performance than other states. SVM with PPV of 86.45%, NPV of 79.27%, sensitivity of 87.65%, specificity of 77.47%, accuracy of 83.8%, F-score of 87.05%, and AU-ROC of 0.815 with BLR FS method obtained better performance than other states. ANN with PPV of 78.36%, NPV of 62.93%, sensitivity of 76.54%, accuracy of 72.29%, F-Score of 77.44, AU-ROC of 0.724 in the BLR FS method, and specificity of 66.58 in the GI FS method achieved better-performing capability than other FS strategies. DT with PPV of 83.67%, NPV of 65.71%, sensitivity of 75.93%, specificity of 75.7%, accuracy of 75.84%, F-score of 79.61, and AU-ROC of 0.726 in the BLR FS method obtained better performance than others. KNN with PPV of 81.45%, NPV of 69.44%, specificity of 69.62%, accuracy of 76.89%, F-score of 81.39%, and AU-ROC of 0.786 in the BLR state and sensitivity of 81.94% in the GI FS method obtained better performance than other states for predicting the 5-year CRC survival.
Comparing the algorithms’ performance gave us insight into the XG-Boost with PPV of 95.93%, NPV of 95.51%, sensitivity of 97.38%, specificity of 93.42%, accuracy of 95.21%, F-score of 96.19%, and AU-ROC of 0.906 had the highest performance efficiency than other ML algorithms for predicting the 5-year CRC survival. On the contrary, the ANN with PPV of 75.61%, NPV of 57.24%, sensitivity of 71.45%, specificity of 62.03%, accuracy of 68.07%, and AU-ROC of 0.668 obtained the worst performance capability than other ML algorithms. The DT, with F-score of 73.61%, had the lowest performance in terms of this performance criterion. In addition, the LR with PPV of 72.76%, NPV of 52.38%, sensitivity of 67.59%, specificity of 58.48%, accuracy of 64.14%, F-Score of 70.08%, and AU-ROC of 0.727 in BLR-FS mode, PPV of 71.28%, NPV of 49.89%, sensitivity of 65.12%, specificity of 56.96%, accuracy of 62.03%, F-Score of 68.06%, and AU-ROC of 0.712 in GI mode, and PPV of 69.45%, NPV of 47.26%, sensitivity of 62.81%, specificity of 54.68%, accuracy of 59.73%, F-Score of 65.96%, and AU-ROC of 0.694 had the lowest performance than other ML in all states.
External validation test and feature assessment
As cited in the methods section, we tested our model’s performance capability to predict the 5-year CRC survival using unfamiliar data. Hence, we used the 108 CRC cases, including 68 and 40 cases associated with non-survived and survived instances, to demonstrate the best-performing model’s generalizability by feeding these data to the model. In this regard, the XG-Boost model was selected for external validity purposes. The results of classifying the external cases based on the TP, FP, FN, and TN in the XG-Boost in three conditions, including the BLR and GI as FS methods and XG-Boost without any FS, are presented in Table 5.
The results of the external cases classification.

Based on Table 5, The XG-Boost model with TP = 58, FN = 10, FP = 7, and TN = 33 using the BLR as FS method obtained a higher performance than other conditions. The second rank belonged to the XG-Boost with GI as FS with TP = 55, FN = 13, FP = 13, and TN = 27. The XG-Boost without FS gained the worst performance with TP = 51, FN = 17, FN = 17, and TN = 23 with more error-classified cases. The results of comparing the model’s predictability based on the AU-ROC curve are depicted in Figure 2.

The XG-Boost in internal and external validations.
Figure 2 shows that the XG-Boost with BLR as FS by AU-ROC of 0.813 obtained better predictability than other conditions (closer curve to the sensitivity vertices). The XG-Boost with GI as FS by AU-ROC of 0.787 obtained the second rank, and this model without any FS method with AU-ROC of 0.763 obtained the worst predictability. Generally, by comparing this curve between internal and external conditions, we comprehended that the performance reduction of the XG-Boost was almost 10% in AU-ROC, indicating the favourable generalizability in other clinical environments (The values of AU-ROC of XG-Boost in internal conditions were presented in Table 3). The XG-Boost with BLR as FS method was considered the best model and favourable generalizability for predicting the 5-year CRC survival in the current study. We used the BLR-XG-Boost model as the best-performing algorithm to assess the importance of each prognostic factor. Hence, we assessed their importance based on the Relative Importance (RI) gained by this model in the internal and external conditions. The results of scoring each prognostic factor based on the RI are shown in Figure 3.

The importance of prognostic factors in internal and external conditions.
According to Figure 3, almost all pathological factors obtained high importance. The pathological factors, including tumor differentiation (internal RI = 0.39, external RI = 0.41), tumor recurrence (internal RI = 0.44, external RI = 036), and lymphovascular invasion (internal RI = 0.43, external RI = 0.41) obtained higher importance than other pathological factors in terms of predicting 5-year survival. The therapy factors, including chemotherapy (internal RI = 0.48, external RI = 0.45) and surgery (internal RI = 0.45, external RI = 0.42), achieved more strength in predicting the 5-year survival than other prognostic factors. On the contrary, the age (internal RI = 0.15, external RI = 0.21) and BMI (internal RI = 0.18, external RI = 0.21) obtained less importance in this respect.
Discussion
In the current study, we intended to establish a prediction model for the 5-year CRC survival disease for a better prognosis, especially for the high-risk group of CRC patients with a poor prognosis, influencing the survival status. In this respect, we got assistance from one single-centred database containing prognostic factors with the help of the ML approach for effective and efficient predictability in various clinical situations. To achieve this aim, we first investigated the current database concerning any redundancy, noisy, and missing data to prepare it for data analysis. Next, we used two different strategies of the feature selection process to choose the best factors influencing the five-year CRC survival. After that, we used selected ML algorithms, including RF, XG-Boost, bagging, SVM, ANN, DT, LR, and KNN, to establish prediction models for predicting survival. We compared their performance to get the best ones in terms of predictive efficiency. Based on the best-performing trained algorithm, we used the external data cases to test the generalizability of the algorithm in other clinical environments. Also, the prognostic factors were assessed by using the best-performing algorithm in internal and external validations.
We had two feature selection strategies, including BLR and GI, as filtering methods to gain the best factors influencing the 5-year CRC survival. Based on the BLR, the factors including age, BMI, smoking, diabetes, familial history of CRC, surgery, chemotherapy, radiotherapy, hormonotherapy, tumor stage, tumor recurrence, tumor differentiation, lymphovascular invasion, perineural invasion, tumor location, hemoglobin level, and WBC were obtained as the essential factors to this aim. GI showed that the age, smoking, diabetes, familial history of CRC, surgery, chemotherapy, radiotherapy, hormonotherapy, tumor stage, tumor recurrence, tumor differentiation, lymphovascular invasion, perineural invasion, tumor location, hemoglobin level, and WBC count as best prognostic factors.
The current study gave us insight into the XG-Boost with PPV of 95.93%, NPV of 95.51%, sensitivity of 97.38%, specificity of 93.42%, accuracy of 95.21%, F-score of 96.19%, and AU-ROC of 0.906 obtained the best performance than others. Also, this algorithm with AU-ROC of 0.813 obtained favourable generalizability in predicting the 5-year CRC survival based on the external cases. Based on the XG-Boost, the prognostic factors, including tumor differentiation (internal RI = 0.39, external RI = 0.41), tumor recurrence (internal RI = 0.44, external RI = 036), lymphovascular invasion, chemotherapy (internal RI = 0.48, external RI = 0.45), and surgery (internal RI = 0.45, external RI = 0.42) were considered as the most important factors concerning 5-year CRC survival prediction. As shown, XG-Boost is an algorithm that has the potential to predict 5-year CRC survival. This algorithm could be considered an effective and efficient model for predicting 5-year CRC survival and be embedded as a knowledge base in intelligent systems, such as clinical decision support systems in clinical environments. The doctors in those settings could enter the CRC patients’ prognostic characteristics into the system and get the results of the CRC survival risk. Some clinical solutions, such as the early identification of CRC recurrence and interventional and non-interventional therapies, can be performed for high-risk patients. This way, the prognosis of these patients would be enhanced, and consequently, their survival would be increased.
So far, several studies have been conducted on CRC survival based on ML algorithms. Cardoso et al. used the ML technique to predict CRC patients’ survival. Based on their results, the XG-Boost with an AU-ROC of 0.857 obtained the best performance for prediction purposes. The clinical stage in their study was recognised as the best predictor of CRC survival. 35 In the current study, despite Cardoso’s study, which used more treatment factors, we focused more on both pathological and treatment factors. The pathological factors obtained higher competency than other factors for prediction purposes. Also, we tested the XG-Boost for external data cases, showing the favourable interoperability of the model in different clinical settings; this subject wasn’t considered in Cardoso’s study.
Yang et al. attempted to establish ML models to predict CRC survival using multi-omics data from the Cancer Genome Atlas (TCGA). They leveraged the bioinformatics analysis to omics data and then trained ML algorithms on these data. Their best-performing model obtained an AU-ROC of 0.755 with 10-fold cross-validation. 36 In the current study, leveraging the other factors, including the treatment, pathological, laboratory, demographic, and others, gave us better insight into the ML’s performance concerning CRC survival, even XG-Boost with an AU-ROC of 0.813 in the external validation state. Bibaault et al. built a prediction model for CRC survival based on the gradient-boosting algorithm using tumour characteristics, socioeconomics, and lifestyle factors. In their study, the model obtained an AU-ROC of 0.84 for prediction. In the current study, we focused more on pathological factors and concluded that they significantly enhance predictability. Also, our results indicated that the XG-Boost model with the AU-ROC of 0.906 and 0.813 for internal and external validation conditions performed more effectively in predicting 5-year CRC survival and usability in other clinical environments. 37
Achilonu et al. used ML and statistical approaches to predict CRC recurrence and patient survival. They showed that the ANN with an AU-ROC of 0.82 had better performance capability for predicting survival than other ML approaches. Also, their study recognised the factors, including histology, as the best factor influencing survival. 38 In the current study, similar to Achilonu’s study, pathological factors gained more importance than other factors, especially sociodemographic ones. Despite Achilonu’s study, we used more pathological and therapy factors, and in this condition, the performance of our ML model with an AU-ROC of 0.906 was more favourable than Achilonu’s study.
Pourhoseingholi compared ensemble and non-ensemble ML techniques for predicting the five-year CRC survival. In this respect, some prognostic factors, including tumour characteristics and therapy factors, were used to establish prediction models. Their study demonstrated that the voting algorithm with an AU-ROC of 0.96 is the best-performing model for predicting survival. 39 In this study, we focused more on pathological data and weren’t satisfied only by TNM data and the performance gained by internal data cases. Hence, the external data were used to test the prediction model’s generalizability and demonstrate our prediction model’s clinical usability in other clinical environments. BalajiVicharapu’s study used pathological, laboratory, and lifestyle factors to build a prediction model for this topic. The RF with AU-ROC of nearly 0.82 obtained better performance than other ML techniques. 40 The treatment factors such as performing surgery, radiotherapy, and chemotherapy are crucial prognostic factors in this respect, and in BalajiVicharapu’s study, they weren’t considered.
In the current study, despite the previous ones, we attempted to use the combinations of prognostic factors, including pathological factors in addition to TNM data, laboratory data, therapy factors, socioeconomics, and lifestyle, to establish a prediction model for the 5-year CRC survival. Also, we used the external data to test the current prediction model’s performance ability in other clinical environments, which was lacking in the previous studies. These testing scenarios gave us insight into the XG-Boost, which has favourable performance in different environments, assuring the clinical usability of the prediction model in other clinical centres.
Limitation
Despite the mentioned benefits, the current study had some limitations. First, we used the database from one clinical centre, which may somewhat influence the generalizability of the current prediction model. Second, we used some preprocessing steps to adapt the current database to establish prediction models that affect the model’s accuracy and generalizability. Despite this limitation, the external performance of the current prediction model was favourable, indicating low bias in the prediction performance (almost a 10% reduction in AU-ROC value). Third, the current study didn’t consider some factors, including genomic data and tumour markers, due to a lack of information in the database. Fourth, we had limitations in leveraging essential factors that may not be considered due to this study’s retrospective nature. Fifth, one critical step in estimating the bias of the prediction model is leveraging the external validation cohort. This way, we can assess the clinical usability and generalizability of the model to other clinical settings. Although we used this method for this aim, the samples used for this work were almost small, which may not give us a complete insight into the generalizability of the prediction model.
Conclusion
An effective and efficient prediction of CRC survival can potentially enhance CRC patients’ prognosis. This study demonstrated that XG-Boost with an AU-ROC of 0.906 can better prognosis and increase CRC survival. The model can be leveraged as a knowledge source to establish an efficient prediction system to achieve this aim.
Future Directions
For future studies, we recommend using more data from several centres for better predictability and generalizability, using actual data to fill in missing values instead of preprocessing steps to enhance the generalizability of the prediction models. The inclusion of some factors, including genomic data and tumour markers, may influence the performance to some extent, so we recommend using these factors for more enhanced survival predictability. We also suggest using a cohort study to investigate all aspects of the research and the other essential factors that should be included. Leveraging more clinical data from more clinical centres for external validity is indispensable to assess the bias and increase the prediction model’s generalizability more confidently, and it should be considered.
Footnotes
Acknowledgements
We thank the people and specialists who assisted us in all steps of this study.
Author Contribution
R.N. performed the writing, review, and editing of this manuscript.
Declaration Of Conflicting Interests:
The author(s) declared no potential conflicts of interest with respect to the research, authorship, and/or publication of this article.
Funding:
The author(s) received no financial support for the research, authorship, and/or publication of this article.
Availability of Data and Materials
The research data are available from the corresponding author upon reasonable request.
Ethics Approval and Consent to Participate
This study was approved by the Ethics Committee of Tehran University of Medical Sciences (TUMS) (No: IR.TUMS.SPH.REC.1398.191). Due to the retrospective nature of this study, it’s waived from the informed consent.
Consent for Publication
Not applicable