
Abstract
Prostaglandin-endoperoxide synthase-2 (PTGS2) plays a pivotal role in inflammation and carcinogenesis in human breast cancer. Our aim of the study is to find the prognostic value of PTGS2 in breast cancer. We conducted a multiomic analysis to determine whether PTGS2 functions as a prognostic biomarker in human breast cancer. We explored PTGS2 mRNA expressions using different public bioinformatics portals. Oncomine, Serial Analysis of Gene Expression (SAGE), GEPIA, ULCAN, PrognoScan database, Kaplan-Meier Plotter, bc-GenExMiner, USC XENA, and Cytoscape/STRING DB were used to identify the prognostic roles of PTGS2 in breast cancer. Based on the clinicopathological analysis, decreased PTGS2 expressions correlated positively with older age, lymph node status, the human epidermal growth factor receptor 2 (HER2) status (P < .0001), estrogen receptor (ER+) expression (P < .0001) Luminal A (P < .0001), and Luminal B (P < .0001). Interestingly, progesterone receptor (PR) (P < .0001) negative showed a high expression of PTGS2. Prostaglandin-endoperoxide synthase-2 was downregulated in breast cancer tissues than in normal tissues. In the PrognoScan database and, Kaplan-Meier Scanner, downregulated expressions of PTGS2 associated with poor overall survival (OS), relapse-free survival (RFS), and distant metastasis-free survival. The methylation levels were significantly higher in the Luminal B subtype. Through oncomine coexpressed gene analysis, we found a positive correlation between PTGS2 and interleukin-6 (IL-6) expression in breast cancer tissues. These results indicate that downregulated expressions of PTGS2 can be used as a promising prognostic biomarker and Luminal B hyper methylation may play an important role in the development of breast cancers. However, to clarify our results, extensive study is required.
Keywords
Introduction
Breast cancer is the most common cancer among Korean women, as indicated by the Central Cancer Registry Program. 1 The worldwide incidence of breast cancer has increased rapidly. 1 Prostaglandin-endoperoxide synthase 2 (PTGS2), which encodes the cyclooxygenase-2 (COX-2) enzyme, is involved in inflammation and has been associated with breast cancer.2,3 Cyclooxygenase-2 promotes tumor growth, invasion, and metastasis in breast cancer 4 and is up-regulated in human breast cancer. 5 Even though there are vast advancements in screenings, treatments, and diagnostic procedures, the rate of prognosis is very weak. Therefore, searching for a unique and particular prognostic biomarker for breast cancer patients is crucial.
Cyclooxygenase-2 has been considered a prognostic marker in breast cancer, although its implication in breast cancer remains the subject of extensive examination. 6 Cyclooxygenase-2 plays significant role in progression of various cancers such as lung carcinoma, colon, and breast cancers. 7 Also, there is a study which suggests that COX2 protein is highly expressed in triple-negative breast cancers stating its role in breast cancer advancement.7,8 Studies on COX-2 expression in breast cancer are relatively limited, so the application of PTGS2-mediated therapy in a big clinical trials and setting is still in its nascent stages, and the application of its expression patterns as a prognostic marker for the breast cancers is questionable. 9 Here, we also provide an extremely illustrated guide through several web-based oncogenic portals. Users will discover a range of information on cancer types and subtypes of cancer, cancer molecular pathways, and cancer-related genes of concern through portals (Figure 1). Herein, we examined the significance of PTGS2 expression in breast cancer using several online bioinformatics platforms and tools. To determine whether PTGS2 high or low expressions can be considered as a biomarker for breast cancer, we analyzed it at different parameters such as expression levels, roles, and prognostic values in breast cancers by all currently possibly available genes expression data. Taken together, our findings indicate that low expression of PTGS2 may be used as a unique prognostic biomarker for breast cancer.
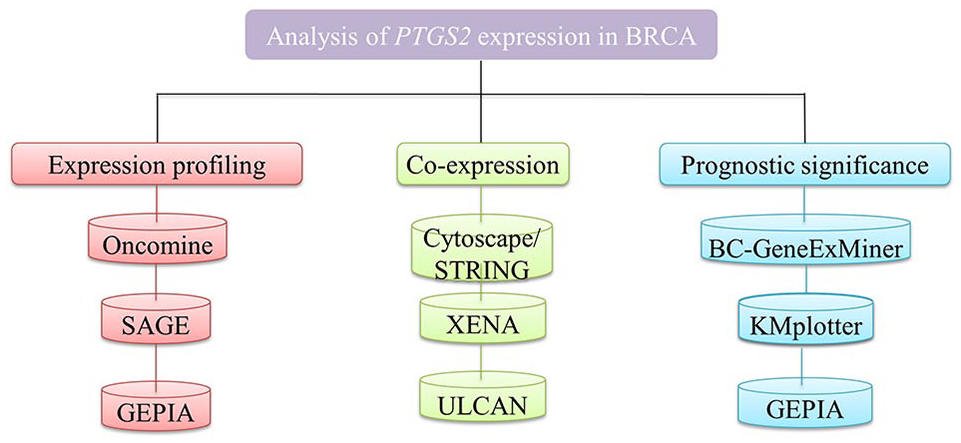
The outline of this study.
Material and Methods
SAGE and Oncomine database analysis
Online repositories, including Serial Analysis of Gene Expression (SAGE) and Oncomine, analyzed the expression profile of PTGS2. First, to analyze PTGS2 mRNA expression, we used SAGE data in 14 normal human tissues, and its corresponding cancer tissues using SAGE anatomical Viewer the expression pattern of PTGS2 was shown. The Oncomine database (DB; https://www.oncomine.org/resource/login.html) is a web-based data mining platform that incorporates 264 independent data sets and aims to collect, standardize, analyze, and deliver transcriptomic cancer data for biomedical research. 10 Then we analyzed PTGS2 expression levels in breast cancer by Oncomine DB. The expression fold change of PTGS2 was obtained in clinical cancer tissues as opposed to normal controls as the parameters of P-value 1e−4, fold-change 2, and gene ranking in the top 10%. And oncomine DB was also used for the coexpression profile of the PTGS2 gene in breast cancer and which was shown as a heat map.
GEPIA DB analysis
Gene expression profiling interactive analysis (GEPIA, http://gepia.cancer-pku.cn/). This is an excellent platform for RNA sequencing data. The use of various transcripts across all cancer types can be analyzed, users have freedom to select their interest of subtype for further analysis, or compare various subtypes for expression and survival. 11 The GEPIA boxplot has been used in different types of cancers for evaluating tumor tissue and normal tissue differential expression of PTGS2 and for stage-wise expression of PTGS2.
UCSC cancer genomics browser analysis
UCSC cancer genomics browser is an online evaluation platform for public and private, multiomic and clinical/phenotype data. This online platform offers the users whole-genome and pathway-oriented analysis of genome-wide experimental measurements for individual and sample sets as genome heat maps. 12 This browser is not limited only for cancer analysis, but genome-wide high-throughput data are readily available. The heat map and correlation between PTGS2 and IL-6 were verified and evaluated by data mining in The Cancer Genome Atlas (TCGA)-GBM using the UCSC Xena browser (http://xena.ucsc.edu/). Also, the methylation status of PTGS2 was subsequently investigated using the UCSC Xena browser.
Breast cancer gene-expression miner, version 4.2 analysis
Breast Cancer Gene-Expression Miner, version 4.2 (bc-GenExMiner v4.2) (http://bcgenex.centregauducheau.fr/BC-GEM/GEM-Accueil.php?js=1). 13 A user-friendly, web-based framework based on finding from DNA microarrays to enhance the efficacy of the gene prognostic analysis. bc-GenExMiner has been developed as a web-based tool including reliable MySQL DB. For survival analyses R statistical software and its packages has been used. And it has also been used to investigate the relationship between PTGS2 expression and clinicopathological parameters in human breast cancer patients.
Kaplan-Meier plotter [breast cancer]
A public platform tool, Kaplan-Meier plotter, used HGU133 Plus 2.0 array data from 10 461 cancer samples to analyze the effect of 54 675 genes on their survival. Out of these samples, 5143 were alone from breast cancer patients. The main purpose of this tool is to conduct biomarker evolution-based analysis based on meta-analysis. The correlation and association between PTGS2 and patient’s survival were analyzed using the Kaplan-Meier plotter (http://kmplot.com/analysis/). The method divides patient samples into pair of classes and evaluates the prognostic importance of a specific gene according to different quantiles of biomarker expression. Kaplan-Meier survival plots were built to compare the 2 patient groups and calculate the log-rank P value and the hazard ratio, with confidence intervals of 95%. A cutoff was selected between high-expression and low-expression classes, where P values obtained from the log-rank test were reduced.
PrognoScan analysis
PrognoScan (http://dna00.bio.kyutech.ac.jp/PrognoScan/) 14 is a DB that is used for the meta-analysis of the prognostic importance of various genes. This online platform aims to examine the relationship between gene expression and patient prognosis through a wide variety of cancer microarray data. We used this tool to analyze the correlation between PTGS2 expression and survival in breast cancer types.
UALCAN analysis
UALCAN is a comprehensive, easy-to-use, and interactive web resource for analysis of OMICS cancer data. 15 UALCAN (http://ualcan.path.uab.edu/) is a website for online analysis and mining of cancer data. It is based mainly on the analysis of relevant cancer data in the TCGA DB. It can help us to perform biomarker identification, expression profiling, and survival analysis for related genes. We can query related information in other DBs through related links.
PPI network and ranking analysis
The Search Tool for the Retrieval of Interacting Genes (STRING) is a biological DB for prediction of protein-protein interactions (PPIs). The interactions were investigated using STRING and combined score of genes >0.9 were defined. 16 Subsequently, Cytoscape (version 3.6.1; http://cytoscape.org/) was used to develop the PPI network that were identified. And a Cytoscape plugin, cytohubba was used with the default parameters to get ranking of the degree method. 17
Statistical analysis
Survival curves were built using 2 inline public platforms such as Kaplan-Meier plotters PrognoScan, all results are displayed with P values obtained from a log-rank test. The levels of significance (P values) of the Oncomine and heat map data were determined by the programs used for the analyses. An unpaired t-test was performed to analyze 2 groups (normal vs cancer). Overall survival (OS) was defined as the time from the primary breast cancer diagnosis to death from any cause. Survival rates were calculated using the Kaplan-Meier method, and groups were compared with the log-rank test. The P values of log-rank <0.05 were considered significant.
Results
PTGS2 expression in human cancers
To determine the role of PTGS2 in breast cancer, we used 2 platforms SAGE Digital Gene Expression Display visualization tools and Oncomine DB to compare its transcription levels in cancer tissues and normal tissues and Oncomine DB. The different threshold parameters, without adjusting any filter settings, were as per following: P value, .01; fold change, 2; and gene ranking, 10%. Using these settings, we found that PTGS2 was overexpressed in some cancer tissues relatively to their normal tissue expression levels and was underexpressed in others (Figure 2A). Next, by oncomine analysis, the expression profile of PTGS2 in breast cancer was analyzed (Figure 2B). Statistically, a significant difference was found in 42 studies, 13 studies showed higher PTGS2 expression in tumor tissues in 7 kinds of cancers, whereas 13 studies had low PTGS2 expression in breast cancer (Figure 2B). Therefore, we chose breast cancer among other cancer in which PTGS2 expression was lower than normal in tissues, we opted it for further systematic expression and prognosis analysis. Also, GEPIA platform was used to assess the comprehensive median expression of PTGS2 across 30 different cancers (Figure 2C). Prostaglandin-endoperoxide synthase-2 expression is up-regulated in certain cancer types including bladder, lung, lymphoma, and prostate cancers. The average expression of PTGS2 was higher in cancer tissues than in the normal tissues in the analysis using the GEPIA DB. Whereas, PTGS2 expression is lower in cancer tissues than in normal tissues. As described in Table 1 the expression of PTGS2 in histological subtypes of breast cancer, we found that the expression was significantly lower in all histological subtypes but in more and less extends, such as the most lower expression is in mucinous breast, invasive breast carcinoma, invasive ductal breast carcinoma, invasive lobular breast carcinoma, ductal breast carcinoma, intraductal cribriform breast adenocarcinoma, male breast carcinoma, and mixed lobular and ductal breast carcinoma respectively (Table 1). Prostaglandin-endoperoxide synthase-2 analyzes for breast cancer are listed in greater detail below.

Transcription levels of PTGS2 in different types of cancer. Transcription levels of PTGS2 in different types of cancer (SAGE database and Oncomine, TGCA). (A) Expression profile for PTGS2 in human breast cancer performed by the SAGE. (B). Expression of PTGS2 in different types of cancers. This graphic generated by Oncomine indicates the numbers of data sets with statistically significant (P < .01) mRNA overexpression (red) or low-expression (blue) of PTGS2 (different types of cancer vs corresponding normal tissue). The threshold was designed with the following parameters: P value of 1E−4, fold change of 2, and gene ranking of 10%. (C) The gene expression profile across all tumor samples and paired normal tissues. The height of bar represents the median expression of certain tumor type or normal tissue.
PTGS2 expression in subtypes of breast cancer.

IDC, invasive ductal carcinoma; ILC, invasive lobular carcinoma; PTGS2, prostaglandin-endoperoxide synthase-2; TCGA, The Cancer Genome Atlas.
PTGS2 expression in breast cancer
We analyzed the expression of PTGS2 in breast cancer using the GEPIA DB. We put PTGS2 as a query in the DB to get its expression pattern. We got a quality expression profile over all tumor tissues and with their paired normal tissues. This analysis demonstrated that PTGS2 was underexpressed in tumor tissues and overexpressed in normal tissues (Figure 3A). To confirm the PTGS2 expression results in stages on breast cancer, the results denote that PTGS2 overexpression was found to be a strong negative prognostic in breast cancer stage I and II but significantly decreased its expression as the stage advances (Figure 3B). The precise examination carried out here was able to evaluate the mRNA expression status PTGS2 over breast cancer types. The PTGS2 expression was affirmed by numerous platforms and DBs; hence these results can be considered true and reliable. These results with respect with PTGS2 expression are validated and argued with previous research. Like, COX2 overexpression is considered a poor prognostic factor which gives chance for COX2 inhibitor selection of treatment in Stage III breast cancer.18,19 Overexpressed COX-2 and prostaglandin E2 (PGE2) are known for worst prognosis in human breast cancers.19,20 In contrast, our analysis showing that PTGS2 is underexpressed in breast cancer. Elevated PGE2 components, COX2 have been reported in many of the breast cancers and also it has been seen in many laboratory experiments on murine. 18 Many reports on mammary tumor cells reports PGE2 play an important role in many factors which controls growth, metastasis, also immune response in breast cancer.18,20 These results showing the dysregulation of PTGS2 can potentially be translated into clinical practice. Therefore, we next explored the degree at which PTGS2 expression is associated with prognosis.

Trans.cription levels of PTGS2 in breast cancer: (A) the expression of PTGS2 in breast cancer according to TCGA database (GEPIA-http://gepia.cancer-pku.cn/index.html). (B) Stage-wise expression of PTGS2 in breast cancer according to TCGA database (GEPIA-http://gepia.cancer-pku.cn/index.html).
Correlation between PTGS2 expression and clinicopathological parameters of breast cancer
Moreover, we have also explored the connection among PTGS2 expression and diverse clinicopathological parameters in patients with breast cancer using bc-GenExMiner (Figure 4; Table 2). Our results are noteworthy, suggested that there were significant differences between the ⩽51- and >51-year age group (>51-year group P = .0001). The nodal status also showed significant differences between the positive and negative groups (−, + nodal status: P = .0001;). Estrogen receptor (ER), progesterone receptor (PR) status, and HER2 status were discovered to be positively linked to low PTGS2 expression. (ER status: P < .0001; PR status: P < .0001 HER2 status: P < .0001). Prostaglandin-endoperoxide synthase-2 was negatively correlated in basal-like when compared with their counterparts (triple-negative status: P < .0001). The low PTGS2 expressions linked to older age, lymph node status, the human epidermal growth factor receptor 2 (HER2) status, ER+ positivity. Surprisingly, PR negative has significant high expression, suggesting further analysis in future. These results demonstrated that low PTGS2 expression may play prognostic role breast cancer patients.

Relationship between expression of PTGS2 and various clinicopathological parameters of breast cancer: (A) boxplot of PTGS2 expression according to age, (B) boxplot of PTGS2 expression according to nodal status, (C) boxplot of PTGS2 expression according to ER, (D) boxplot of PTGS2 expression according to PR, (E) boxplot of PTGS2 expression according to HER2, (F) boxplot of PTGS2 expression according to basal-like status, (G) boxplot of PTGS2 expression according to triple-negative status, and (H) boxplot of PTGS2 expression according triple-negative and basal like.
Clinicopathological relationship of PTGS2 mRNA expression in breast cancer.

ER, estrogen receptor; HER2, human epidermal growth factor receptor 2; PR, progesterone receptor; PTGS2, prostaglandin-endoperoxide synthase-2; TNBC, triple-negative breast cancer.
Prognostic significance of the PTGS2 in breast cancer
Further, we attempted to explore the relationship between PTGS2 gene expression pattern and its prognostic role, we applied PrognoScan, and Kaplan-Meier plotter online platforms. Our results correlated with our previous results hence proving its role in prognosis. (Figure 5A to C), Kaplan-Meier and PrognoScan analysis for survival according to low PTGS2 expression in breast cancer showed significantly reduced OS, we determined that lower expression of PTGS2 indicated poorer relapse-free survival (RFS, P = .0026), low distant metastasis-free survival (DMFS, P = .007). All these findings indicate that the low PTGS2 expression may indicate a predictor of poor prognosis in breast cancer patients.

Relationship between PTGS2 mRNA expression and clinical outcomes in breast cancer patients (PrognoScan Database and Kaplan-Meier Scanner) (A and B). The survival curve comparing the patient with high (red) and low (blue) expression of PTGS2 was plotted from PrognoScan database (http://dna00.bio.kyutech.ac.jp/PrognoScan/) in breast cancer patients. The threshold of COX P value < .05. (C) The survival curve comparing the patient with high (red) and low (blue) expression of PTGS2 was plotted from Kaplan-Meier Scanner (https://kmplot.com/analysis/index.php?p=service&start=1) in TCGA breast cancer patients. The threshold of COX P value < .05.
Coexpression profile of PTGS2 and protein-protein network in breast cancer
The Oncomine DB gives an important list of coexpressed genes. Coexpression analysis showed that PTGS2 was significantly coexpressed IL-6 (0.505), SLC2A3, (0.505). We determined the coexpression profile of PTGS2 with 12 624 genes across 286 samples (Figure 6A) among which IL-6 was a top correlated gene. In literature, it is mentioned that interleukin-6 (IL-6) which may have originated from mesenchymal stromal cells originated from breast cancer that may be responsible for carcinogenesis affecting the growth and prognosis of breast cancer.21,22 Another study reported that a statistically strong association has been found between the exprerssion of SLCA2A3 mRNA expression and the status of ER and PR status in breast cancers. 23 Data mining in bc-GenExMiner 4.0 confirmed a positive correlation between PTGS2 and IL-6 expression (Figure 6B). We verified this positive association using UCSC Xena to examine the breast cancer data in the TCGA DB (http://xena.ucsc.edu/) (Figure 6C and D). These results indicate that the PTGS2 might be closely linked to the IL-6 signaling pathway in breast cancer; therefore, the results presented here, in conjunction with those from of previous research, provide ample evidence that expression of PTGS2 may be involved in the development and prognosis of breast cancer by associating with coexpressed genes.

Coexpression genes of PTGS2: (A) coexpression genes of PTGS2 were analyzed using Oncomine, (B) relationships of PTGS2 and IL-6 in breast cancer were analyzed using bc-GenExMiner, version 4.0, and (C) the heat map of PTGS2 mRNA and IL-6 mRNA expression across PAM50 breast cancer subtypes in TCGA database. Data were analyzed using UCSC Xena.
Next, we analyze PPI; studies have shown that PPIs are key occasions in cellular mechanisms that prepare downstream signaling and eventually, influencing cellular processes, including cell development and division; PPI often plays key role in signing.24,25 PGE2 is the main product of COX2 series which activates components of the WNT signaling system. 26 Cyclooxygenase-2 induces breast cancer stem cells via EP4/PI3K/AKT/NOTCH/WNT axis. 26 Therefore, the regulation of PTGS2 by other interacting partners warrants further investigation. To identify the PPIs involving PTGS2, we used the String DB. String DB gives analysis on coexpression, pathways, shared protein domains, co-localization, and genetic interactions. We chose the dominant functional protein partners of PTGS2 from these results, as mentioned below, for further analysis. The predicted protein partners of PTGS2 along with their respective genes are these: glutathion-dependent prostaglandin E Synthase (PTGES), arachidonate 5-lipoxygenase (ALOX5); interleukin 1 beta (IL1B), prostaglandin-H2 D-isomerase (PTDGS), prostaglandin-H2 D-isomerase (PTGES), arachidonate 15-lipoxygenase (ALOX15), interleukin 8 (CXCL8), prostaglandin I2 synthase (PTGIS), cytochrome P450 2E1 (CYP2E1; Figure 7). Hence, these anticipated interacting partners of PTGS2 may be involved in the signaling pathways of PTGS2-mediated cancer progression and prognosis.

Correlation between PTGS2 mRNA expression and promoter methylation in breast cancer. Correlation between PTGS2 mRNA expression and promoter methylation in breast cancer (TCGA data): (A) heat map of PTGS2 expression and DNA methylation status retrieved from UCSC Xena web (https://xenabrowser.net/heatmap/). (B) Promoter methylation level of the PTGS2 gene in breast cancer tissue compared to their normal tissue. The box plot was retrieved from UALCAN web (http://ualcan.path.uab.edu/index.html). (C) Promoter methylation level of the PTGS2 gene in breast cancer subtypes. The box plot was retrieved from UALCAN.
Methylation status of PTGS2 in breast cancer
Methylation, a modification of proteins and nucleic acids, has been studied in terms of prognostic assessment of various kind of cancer, such as liver, cervical, and ovarian cancer. 26 In the previous research, the effect of the methylation of the PTGS2 promoter on breast cancer has been inspected. 27 We analyzed the methylation of the PTGS2 gene promoter using UCSC Xena and UALCAN, a portal to facilitate gene expression and survival analyses for tumor subgroups (Figure 8A and B). The level of methylation of the PTGS2 promoter was significantly higher in cancer tissues than in normal tissues (Figure 8B). It was hyper methylated in stage Luminal B type subtype then HER2 and TNBC (Figure 8C).
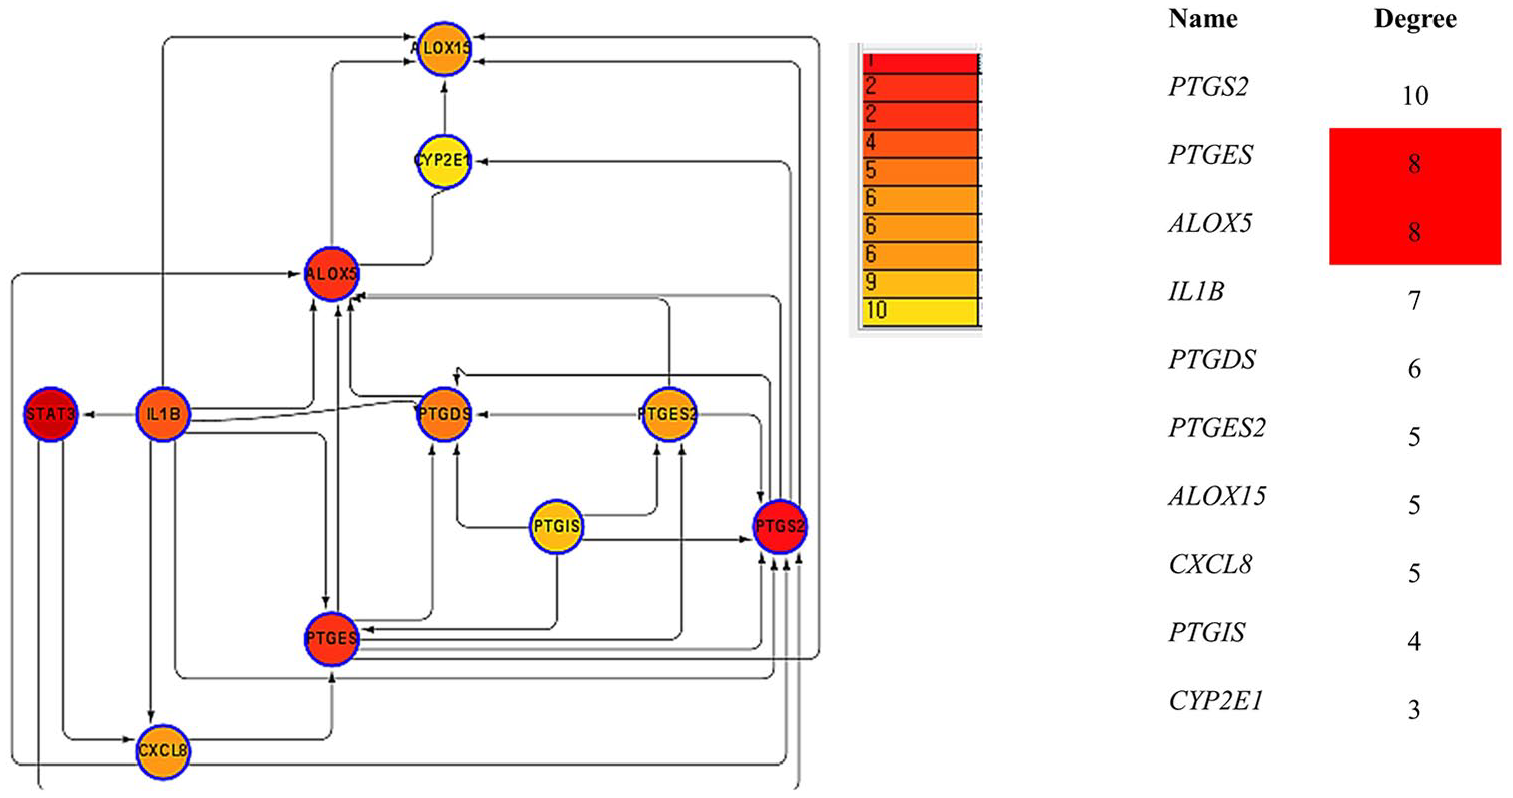
Identification of known and predicted structural proteins essential for PTGS2 function. Interacting nodes are displayed in red-colored circles using Cytoscape/String, version 10.0. Predicted functional partners of PTGS2 are shown based on peer-reviewed published data and curated database entries. (String, version 10 [http://string-db.org]).
Discussion
Elevated PTGS2 expression has been associated with large tumor size, high histologic grade, negative hormone receptor status, high proliferation rate, high p53 expression, and HER2 amplification, along with axillary node metastases and ductal type of histology. 28 The COX2 selective compounds which eliminate the ratio of human breast cancer in ladies and such compounds also reduced the risk of relapse and rate of death in woman with breast cancer.5,29 Therefore, to know the important role of PTGS2 as a biomarker of breast cancer prognosis, herein, we carried out a systematic statistical data analysis of a variety of gene expression data sets with really described distinguishing parameters between normal and cancer tissues. To the best of our knowledge, this can be a first multiomic study showing the function of low-expression PTGS2 in breast cancer development.
In previous study, PTGS2 overexpression is considerably related to luminal B and triple-negative types of breast cancer.29,30 Breast cancer metastasis was seen mediating by an increased expression levels of a set of genes, such as COX-2, and cetuximab drug seen reducing the increased COX2 expression levels. 31 We initiated analysis by determining the expression levels of PTGS2 in different cancers. The expression levels of PTGS2 in different cancers were determined using the SAGE Digital expression display that showed a difference in the expression of PTGS2 in cancer and normal groups. Next, Oncomine analysis revealed that the expression of PTGS2 in breast cancer tissues was consistently lower in cancer tissues than in normal tissues. Moreover, a negative association between PTGS2 expression and ER, PR, and HER2 status was found. Prognostic significance of PTGS2 was analyzed using the Kaplan-Meier Plotter, and PrognoScan DBs showed that low expression of PTGS2 indicated poor RFS, OS, and DMFS. These results clearly indicate that low expression of PTGS2 in breast cancer can be a promising prognostic marker in breast cancer. Our bioinformatics study (Figure 1) provides a reliable integrated analysis of the PTGS2 expression pattern, prognostic value, and potential regulatory mechanisms in breast cancer.
In previous research on a retrospective cohort of 446 breast carcinomas treated in the adjuvant setting in that study, they analyzed COX-2 expression in laboratory experiments such as real-time qualitative polymerase chain reaction (RT-qPCR), and their analysis results got an inverse correlation between COX-2 expression, hormones statuses such as ER and PR. 32 In this study, ER and PR status were discovered to be positively associated with PTGS2 expression (ER status: P < .0001; PR status: P < .0001). The mechanism by which PTGS2 is up-regulated in breast cancers is unknown. 33 In endocrine therapy for breast cancer ER and PR seems to be shown important prognostic marker and has a predictive ability. 34 Many previous studies suggest that ER—and PR+ have worst prognosis hence suggesting important role of ER and PR.34,35 Interestingly, in our clinicopathological parameters analysis, PR-negative status shows high expression which is contradicting with other parameter results which has significant low expressions, this demands further detailed evaluation in regarding their signaling pathways, we may get the clue of their expression pattern. One possibility is that COX-2 expression is associated with factors of poor prognosis, for example, negative hormone receptor status 36 cancer cells become more active in expressing COX-2 than normal cells. 37 It has been seen that p53 and HER2 gene inactivation are concerned within the induction of COX-2. 38 However, we also observed significant association between PTGS2 and HER2 expression patterns. The relationship between HER2 gene amplification and PTGS2 elevated expression has been a subject of controversy. 39
To know the prognostic value of PTGS2, we next evaluated the relation among expression levels and OS of PTGS2 in breast cancers. And it was determined using Kaplan-Meier plotter and PrognoScan. In general, low PTGS2 mRNA expressions was linked with poor survival in breast cancer. Our results are contradicting with previously published studies. Such as, 10 studies evaluated the relationship between COX-2 overexpression and OS of BC patients, indicating high COX-2 expression significantly predicts poor OS of patients with breast cancer. 40 Similarly, the under expression of PTGS2 was also significantly associated with poor disease-free survival (DFS) and RFS in breast cancer. Based on these results, PTGS2 be a valuable prognostic biomarker of breast cancer and can be a therapeutic target for breast cancer patients in future clinical trials. Although, more studies are required to analyze the specific molecular mechanism of PTGS2 of low-expression facilitating breast cancer growth and metastasis.
Next, we assessed the coexpression analysis of PTGS2 on breast cancer and to understand their coexpressing genes, we analyzed coexpression analysis through oncomine portal. Among all coexpressed genes, IL-6 was a top-most coexpressed gene. Overexpression of IL-6. The cytokine IL-6 higher expressions have been resent in various tumors microenvironment also in breast cancer. 19 Tumor cells and tumor-associated fibroblasts are the major sources of IL-6 secretion in the tumor microenvironment. 18 Interleukin 6 acts as both a proinflammatory cytokine and an anti-inflammatory myokine which is a major mediator of the inflammatory reaction and plays an important function in the pathophysiology of cancer.2,41,42 Coexpression analysis may also provide important clues for examination of the mechanisms of PTGS2. Among all coexpressed genes, IL-6 was a top-most coexpressed gene. In a previous study on serum level of IL-6, their results proved that IL-6 is a negative prognostic marker in breast cancer patients.18,19 Next, we examined the methylation status of PTGS2 to evaluate the extent of their effect on the respective gene expression. Also, its subsequent effect on patient survival in breast cancer. Previous studies suggest that by regulating gene stability and transcript, cancer progression, and prognosis is related to DNA methylation. 43 In this study, the methylation level of the promoter of the PTGS2 gene was found to be increased in breast tumor tissues. It has been reported previously that the methylation frequency of genes with methylation patterns associated with the molecular subtypes was significantly higher in luminal B tumors than the other subtypes. 44 Our study supports with this study, hyper methylation in luminal B was reported. The resulting methylation status which is consistent with the expression data of PTGS2, which suggests that it can be a biomarker in breast cancer. Furthermore, we examined PPIs of PTGS2. For example, higher amplifications and interactions were majorly seen in these proteins PTGES, ALOX5, IL1B, PTGDS, PTGES, and PTGS2-centered gene set. Therefore, this functional enrichment suggests us a combined function of PTGS2 and these genes, which can give us a major link among PTGS2 and its interacting proteins. Here, we conclude that the effect of PTGS2 on breast cancer progression and prognosis may be more evident when linked with their coexpressed genes, such as IL-6. This can be a topic for future research.
Summing up, low mRNA expression levels of PTGS2 can be a biomarker and a novel therapeutic target for breast cancer. Systematic bioinformatics evaluations with Oncomine, SAGE, the Kaplan-Meier Plotter, PrognoScan, String DB UALCAN, GEPIA, suggesting PTGS2 role in cancer progression. Furthermore, by querying the DBs used in this study, researchers can explore the signaling pathways analysis of PTGS2 in breast cancer or other diseases.
Remarks
This study will facilitate and access the interpretation of multidimensional oncogenesis-related data. Various multiomic analytic platforms lead to a greater understanding of the molecular cause and epidemiology of cancer that will potentially facilitate the transition of genomic expertise into clinical practice. 45 Also, we have shown explicitly how to navigate through many web-based public oncology portals that were made to facilitate exploration by researchers and scientists from different cancer-related fields. Descriptions of the specific portals prepared based on their 2018 versions are summarized in Table 3.
Main characteristic of the selected oncogenic portals.

Abbreviation: GEPIA, gene expression profiling interactive analysis.
Footnotes
Funding:
The author(s) disclosed receipt of the following financial support for the research, authorship, and/or publication of this article: This paper was supported by Konkuk University 2018.
Declaration of conflicting interests:
The author(s) declared no potential conflicts of interest with respect to the research, authorship, and/or publication of this article.
Author Contributions
M.S. was responsible for the research, organization of the database, analysis of data, and writing the manuscript. R.H.R., K.S.P., A.H., and S.E.N. organized the database. Y.B.Y. and Y.-H.Y. contributed to the analysis of data and writing the manuscript. I.J.Y. contributed to the conception of the research and analysis of data.