
Abstract
Background:
Molecular epidemiology has shown the presence of four genotypes circulating across Africa, a paucity of data exists regarding phylogeography of the African Yellow fever (YF) genotypes. The need to fill this gap with spatiotemporal data from continuous YF outbreaks in Africa conceptualized this study; which aims to investigate the most recent transmission events and directional spread of yellow fever virus (YFV) using updated genomic sequence data.
Methods:
Yellow fever sequence data was utilized along with epidemiologic data from outbreaks in Africa, to analyze the case/fatality distribution and genetic diversity. Phylodynamic and phylogeographic were utilized to investigate ancestral history, virus population dynamics, and geographic dispersal of yellow fever across Africa.
Results:
There was a sharp increase in laboratory confirmed cases after year 2015, with Nigeria and the Democratic Republic of Congo having the highest numbers of cases. Phylogeny of the YF genotypes followed a previously reported pattern with distinct geographic clustering. Historical dispersal of YFV was discovered to have occurred from West into Central/East Africa, with recent introductions occurring in West Africa.
Conclusions:
We have shown the continuous circulation of YF in Africa, with distinct genotype distributions within the west and central African sub-regions. We have also shown the potential contribution of African genotypes, in the historical dispersal of yellow fever. We advocate for expanded and integrated molecular surveillance of YFV and other Arboviruses in Africa.
Introduction
Yellow fever virus (YFV) is the causative agent for yellow fever, a viral illness that affects mainly the liver, and may cause serious complications including hemorrhage and death. 1 Yellow fever virus was first isolated from the blood of a Ghanaian man called Asibi in 1927. 2 It is a member of the family Flaviviridea, genus Orthovlavirus, along with dengue virus, West Nile virus, and Japanese encephalitis virus. It is an enveloped virus with a single-stranded positive-sense RNA genome of 9 to 13 kb size, that encodes a single polyprotein that is cleaved into three structural proteins, envelope (E), precursor membrane/membrane (prM/M), and capsid proteins (C) and seven non-structural proteins, NS1, NS2A, NS2B, NS3, NS4A, NS4B, and NS5. 3 Yellow fever is an arthropod borne infection, maintained by the mosquito vectors Aedes aegypti, and Aedes albopticus. 4 There are two major vectorial cycles of YF, the sylvatic also known as Jungle YF maintained in non-human primates (NHP) by the mosquito Heamgogus spp, 5 the second cycle is the urban cycle where humans are the primary host and are transmitted by the peri-urban mosquito Aedes aegypti. 4
Yellow fever virus has one serotype, but phylogenetic analysis has identified seven genotypes West Africa genotype I, West African genotype II, East Africa genotype, Central Africa genotype, Angolan genotype, South America genotype I and South America genotype II.6,7 Previous genetic analysis has shown that these genotypes are geographically defined, 8 as have been reported for other viruses.9 -11 Previous reports have also shown the likelihood of YFV originating from around East Africa before emerging in West Africa. Also, the majority of the studies carried out in Africa are directed towards outbreak investigation and genotype identification, 8 only very few studies investigated the spatio-temporal dynamics of YF in Africa.8,12 In a previous study, West African YF sequences were shown to be more divergent with evidence of adaptive evolution to the sylvatic environment. 12 In another study, the phylogeography of YF showed stable viral population demography, regional confinement of genotypes, and zoonotic spillovers from the sylvatic outbreaks in Africa. 13 Outbreaks of YF continue to occur despite the availability of vaccines and mass deployment to high-risk regions in various African countries. 14 One of the largest historical outbreaks of YF occurred in Nigeria in 1987, affecting mainly Benue and Oyo States, with 805 cases and 419 deaths. 15 Another notable outbreak occurred in Ethiopia in 2013 with 141 cases and 43 deaths. 16 Other notable outbreaks include, a large outbreak in Angola in 2016 which resulted in the importation of YF into China. 17 This remains the only travel-based importation of YF into any country. More recent occurrences, include a series of outbreaks occurring between 2017 and 2022 in four different states in Nigeria, totaling 287 confirmed cases,18,19 and a recent outbreak in Senegal in 2020 with 542 suspected cases and 15 laboratory confirmed cases. 20 There have also been reports of silent infections occurring in Nigeria, an example is a report among patients presenting with pyrexia of unknown origin. 21 In 2017 after a massive outbreak of YFV in Angola, the World Health Organization (WHO) launched a program to eliminate yellow fever (EYE). The program is to span between 2017 to 2026, and its main objectives are to protect people at risk; prevent international spread, and contain outbreaks rapidly (https://www.who.int/initiatives/eye-strategy).
The continuous reports of outbreaks of YF virus in different parts of Africa, despite the implementation of mass vaccination campaigns, call for attention and motivated the conceptualization of this study. The current study was designed to explore the relationship between YF outbreak cases and genomic sequence diversity in the emergence of continuous outbreaks in Africa; and explore the historical transmission events, and geographic dispersal of YFV genotypes using updated genomic data.
Methods
Data curation
Data relating to all reported outbreaks of yellow fever virus infections were collected after database search. The databases that were searched include PubMed, Scopus, and Google Scholar. Supplementary Table 1 shows the list of Outbreaks with the corresponding articles they were reported in. Partial YF, E gene sequences from Africa were downloaded from GenBank, along with sequences recovered a Chinese outbreak in 2016 caused by the Angolan YF outbreak which spread to China through international air travel. 17 This was done with the help of the NCBI Virus database (https://www.ncbi.nlm.nih.gov/labs/virus/vssi/#/). The dataset consisted of genome sequences of all archived E gene sequences from Africa, along with whole genome sequences deposited in GenBank, the E gene was selected because it represents the most frequently and consistently sequenced gene region for YF virus. In addition to the sequence data, metadata was also extracted such as sample source, year of isolation, and Country Location of isolation.
Demographic analysis
The number of reported cases and subsequent deaths of infected individuals according to Country and year, were retrieved from the published reports of YF outbreaks in Africa. This data was tabulated and visualized on a global map using R Studio (https://www.r-project.org). A map of the various countries where the YF data were collected is shown in Supplemental Figure 1. A bar chart representing African YF cases and deaths according to year of occurrence and Country was also generated in R studio (https://www.r-project.org).
Phylogenetic analysis
Partial genome sequences downloaded from GenBank were aligned using MAFFTv7.222 (FF-NS-2 algorithm) following default settings. 22 The dataset consisted of genome sequences from Africa available in GenBank as of February 1st, 2023, along with representative sequences from Southern America (n = 220). Maximum likelihood phylogenetic analysis was performed using the general time reversible nucleotide substitution model after automatic model testing with gamma distributed rate variation GTR-Γ 23 with 1000 bootstrap replicates using IQ-tree software. 24 The pairwise amino acid distances of the African YF sequences were analyzed along with the prototype vaccine Asibi strain (GenBank No: AY640589.1) using MEGA 7. 25
Phylogeography and evolutionary analysis
Evolutionary analysis was carried out on African YF strains, using a Bayesian evolutionary approach with Markov Chain Monte Carlo (MCMC) implemented in BEAST version 2.5. 26 The strength of the temporal clock signal of the dataset was tested by logistic regression of root-to-tip genetic distances against the year of sampling analysis using TempEst v 1.5. 27 For the MCMC analysis, a total of 110 YFV partial E gene sequences of 280 nucleotides in length were aligned, consisting of 91 African sequences and 19 Chinese sequences from the travel associated YF importation in 2016. A list of the sequences used for the analysis is contained in Supplementary Table 2. Further analysis was done using the strict clock with coalescent Bayesian Skyline prior. The MCMC chain was set at 100 000 000 states with a 10% burn-in, results were visualized in Tracer version 1.8. (http://tree.bio.ed.ac.uk/software/tracer/). Bayesian Skyride analysis was carried out to visualize the epidemic evolutionary history using Tracer v 1.8. (http://tree.bio.ed.ac.uk/software/tracer/).
The geographic coordinates of the locations of isolation of the African YF sequences were retrieved with the help of online internet servers. A phylogeographic tree with discrete traits was constructed using the African YF sequences and their geographic coordinates in latitude and longitude using a Bayesian stochastic search variable selection (BSSVS) model implemented in BEAST 2.5. 26 The resulting tree was annotated in TreeAnnotator after discarding a 10% burn-in. In addition, a continuous phylogeographic tree was also constructed for major African YF genotypes, according to their regions of circulation, WA-I/II, and EA-1/EA-II-Angolan genotypes, using a similar approach for the discrete tree except that a continuous tree trait was selected in creating the BEAST XML file in Beauty. 26 The resulting MCC trees were visualized in ggtree. 28 All resulting MCC trees are shown in Supplemental Figure 2.
Geographic dispersal
The transmission histories and geographic dispersal were constructed based on a discrete phylogeographic model using BEAST 2.5, the resulting Phylogeographic tree was utilized as input to analyze the dispersal history using SPREAD 4. 29 Continuous phylogeographic trees constructed in BEAST 2.5 were also utilized to analyze the continuous phylogeographic dispersal of the African YFV sequences according to their sub-regional origins as described in the previous section using SPREAD 4. 29
Results
Yellow fever outbreak demography
African yellow fever demography was re-evaluated with updated data from recent literature.14,23 To ensure consistency with the genomic data presented, only outbreaks reported before the year 2021 were included in the current analysis. Our results also included data from some silent outbreaks identified from molecular detection from patients with pyrexia of unknown origin in Nigeria. 21 From our analysis, Nigeria was shown to be the country with the highest number of active YF cases throughout the study duration, with Ethiopia having the least number of YF cases (Figure 1A(a) and (b)). The case fatality distribution shows that high mortality rates were recorded between 1984 and 1987 (Figure 1B(a) and (b)), with the majority of cases arising from Nigeria, Angola, and Ghana (Supplemental Table 1). The majority of the YF sequences were derived from human blood samples, particularly the more recent sequences from the years 2002 to 2020. A significant proportion of the YF sequences derived from year 1945 to 1990 and sequences from entomologic surveillance in Senegal in 2000 were of mosquito origin, consisting of various species of mosquitoes, a distribution of the host origin of the sequences (Supplemental Figure 3).

A(a) Geographic distribution of YF virus cases across Africa, color intensity is representative of the number of confirmed YF cases in each country and is displayed as a color gradient by the side of the map. A(b) Geographic distribution of YF virus deaths in Africa, color intensity is representative of the number of confirmed YF deaths in each country and is displayed as a color gradient. B(a) Bar charts showing the number of confirmed yellow fever cases from 1970 to 2021 according to country. The legend is color-coded to represent the various countries where outbreaks occurred. B(b) Bar charts showing the number of confirmed yellow fever deaths from 1970 to 2021 according to country. The legend is color-coded to represent the various countries where outbreaks occurred.
Phylogeography and evolution
Phylogenetic analysis of global YF virus strains (Figure 2A), revealed that the African viruses clustered within the four major genotypes West African genotype I (WA-I), West African genotype II (WA-II), East African genotype (EA), Angolan genotype/East African genotype II (EA-II). The majority of the African strains fell under the WA-II, while WA-I had the lowest number of viral sequences (Figure 2A). One limitation of our phylogenetic analysis was our inability to analyze the complete E gene sequence because only partial genome sequencing of the E gene region was conducted on the majority of the early YFV sequences submitted to GenBank. To address this challenge, we utilized the best fitting maximum likelihood model after model testing using a model finder in IQtree. 24 To further address the challenge of the limitation posed by the partial E gene analysis, we selected a limited amount of full YFV sequences and constructed a similar phylogenetic tree alongside a limited amount of the partial E gene sequences to demonstrate the reliability of the phylogenetic clustering and the degree of statistical reliability of the various genotype node supports. A consistent clustering pattern was observed in our analysis (Figure 2B). There was a strict geo-diversification of the various genotypes from our study, shown by continental clustering of the isolates. This was demonstrated by African isolates clustering within the African genotypes and the South American isolates clustering within the South American genotypes. The amino acid divergence of the African YF partial E gene sequences ranged between 0% and 5.9%, with the recently isolated West African genotypes displaying very low diversity, while the older East African genotypes had between 1.2% and 5.9% (Supplementary Table 3).

(A) Maximum likelihood tree of African yellow fever isolates along with some global reference sequences. The clades representing the various genotypes are shown as colored rings, and the bootstrap values are shown as circles around the ancestral nodes with the sizes of the circles representing the percentage bootstrap values. The root of the tree is at the mid-point. The legend represents the various global YF genotypes. (B) Phylogenetic trees of matching partial YF virus E gene sequences A, and complete YF genome sequences B, matching sequences are highlighted in colored labels and connected by dashed lines. The horizontal bars represent identified African genotypes.
The root-to-tip distance for the African YF sequences showed a positive signal, with R 2 = 0.11 (Figure 3A). The MCC tree of the African YF sequences showed a similar diversification with the maximum likelihood phylogenetic tree in Figure 2A with Senegalese sequences being the most abundant and diversely distributed within both WA-I and WA-II genotype sub-clades (Figure 3B). The evolutionary rate of the African YF viruses was 2.08 × 10⁻⁴, 98% HPD (8.48 × 10⁻⁵ − 3.41 × 10⁻³) substitutions/site/year. The time-calibrated MCC tree also showed ancestral divergence times for each ancestral node with the earliest ancestor dating back as the year 1140. The WA-I genotype had a time to most recent ancestor (TMRCA) of 1845, 95% HPD (1795-1890), while WA-II had a TMRCA of 1852, 95% HPD (1790-1910). The EA genotype on the other hand had a TMRCA of 1760, 95% HPD (1655-1850), and EA-II 1940, 95% HPD (1900-1970). The viral population size of the African sequences had no population growth between 1930 and 1970 but exhibited a state of equilibrium, a sharp decline in effective viral population size was observed between 1980 to the most recent sampling date (Supplemental Figure 4).
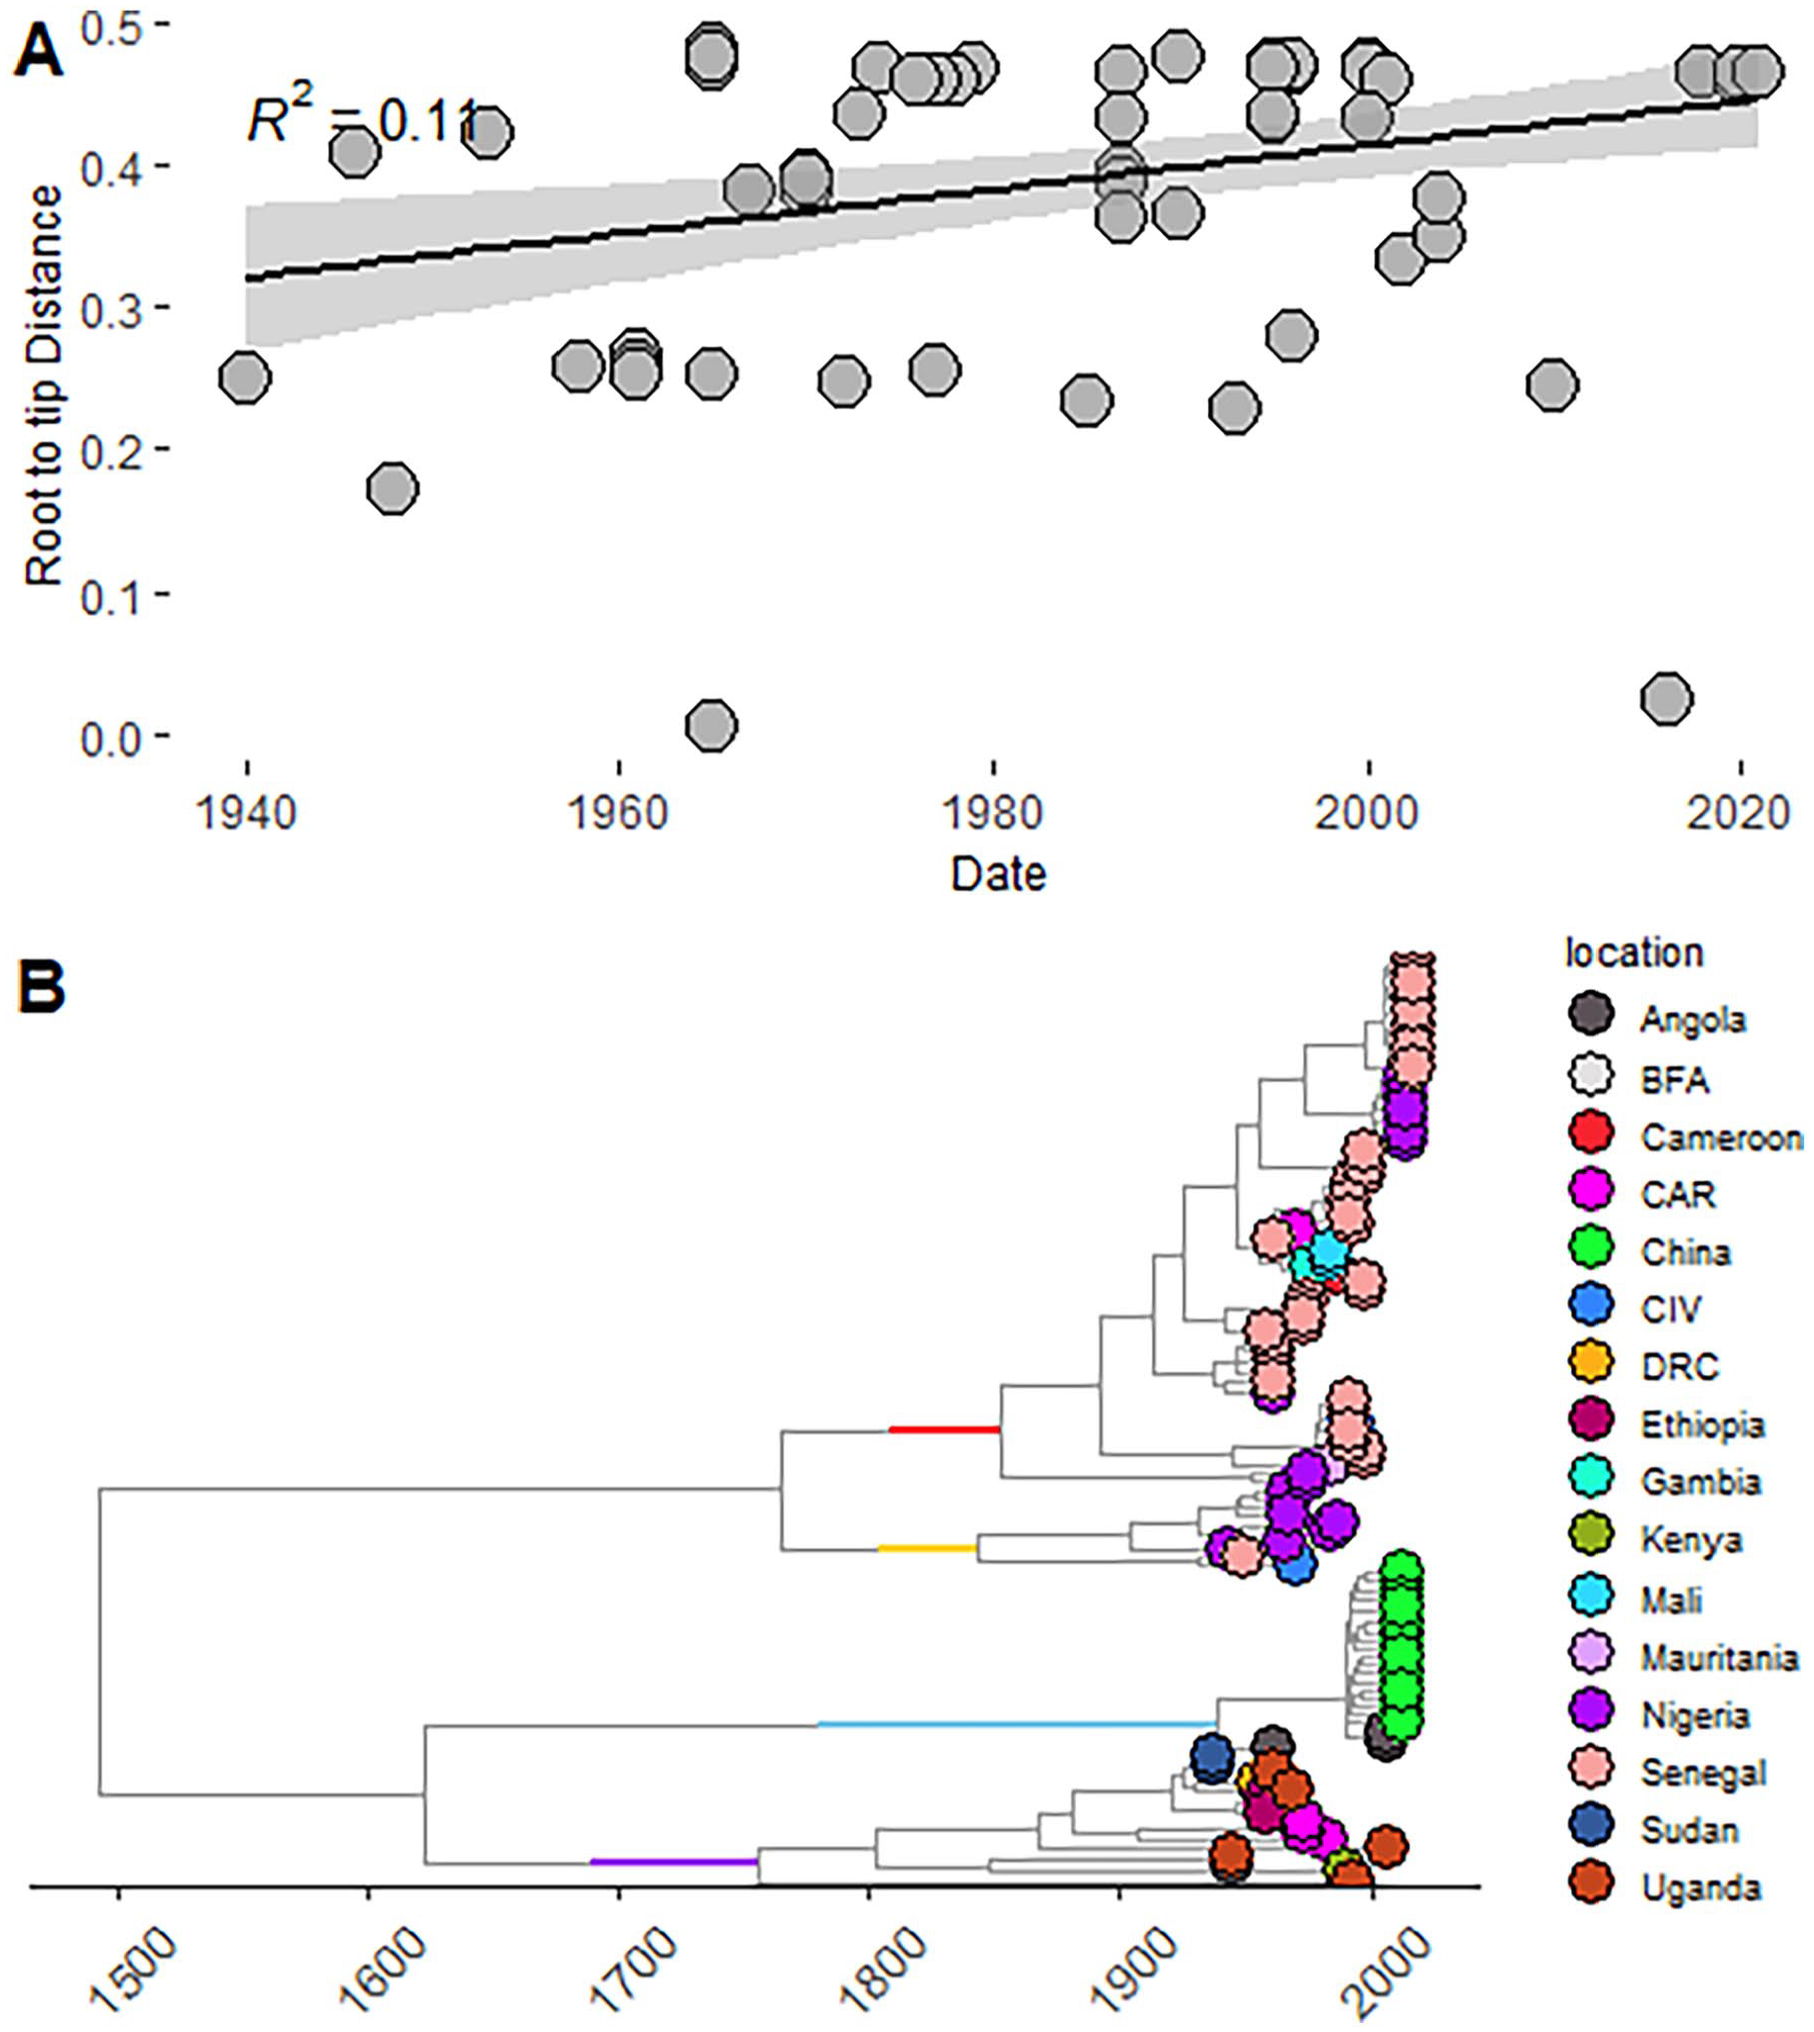
(A) Root-to-tip regression analysis of African yellow fever sequences, represented by a scatterplot with a regression line of best fit, shaded portion of the line is the 95% posterior probability. (B) Time-resolved phylogeographic tree of African yellow virus E gene sequences, showing the various countries of origin as tips. The genotypes are represented by color bars at the ancestral nodes of each genotype in the tree. The red bar represents West African genotype II (WAII), the yellow bar represents WA, the sky-blue bar represents the Angolan genotype, and the purple bar represents the East African genotype (EA).
Yellow fever virus geographic dispersal
We explored the pattern of geographic dispersal and viral circulation of the YF virus within Africa using both discrete and continuous phylogeographic reconstructions. The discrete model clearly showed major transmission routes between East and West Africa. West African countries of Senegal, Burkina Faso, and Mauritania all seemed to have outbound transmission linkages to other countries, majorly in East and Central Africa. The strongest transmission links visualized as the width of the connecting cords were seen between, Senegal and Democratic Republic of the Congo (DRC); Cote d’Ivoire and Angola, and between Mauritania and Angola (Figure 4). The phylogeographic movement seemed to be predominantly from West to East Africa, with only a few transition events moving out of East Africa to West African countries.

Spatiotemporal diffusion with discrete traits of the yellow fever virus in Africa after phylogeographic analysis, visualized as a chord plot with the thickness of the connecting chords representing the strength of the geographic linkages between the countries in Bayes Factor (BF).
For our continuous phylogeography, we ran independent analyses on each of the two prevailing genotypes of West Africa and East Africa, giving us two independent results. Our analysis was designed to identify specific viral introductions and spread events from historically endemic areas through time (Figure 5A and B). In Figure 5A the continuous spatial dispersal of YF West African genotypes (WAI and WAII), shows that between 1960 and 1980, YF fever spread from Senegal and Mali eastwards into countries such as Nigeria, Ghana, and as far as DRC (Figure 5A). There was also spread from Nigeria eastwards into Cote d’Ivoire showing some eastward movement as well. The most recently observed transmission route was, however, from Ghana into Cameroon and from Ghana back into Nigeria occurring between 1980 to 2021. For the East African genotypes (Figure 5B), it’s epicenter was around the DRC region, between 1750 and 1910. The genotype was spatially dispersed into major East and Central African countries such as Angola, Uganda, and Kenya. The most recent special movement of the EA genotype was upward from the DRC into Ethiopia and Sudan, between 1910 and 2010.

(A) Continuous phylogeography of West African yellow fever genotypes, shaded blue circles represent 80% highest posterior density interval of the respective nodes of the MCC tree. The directionality of the movements is a downward curve left to rightward movement; an upward curve is right to leftward movement. (B) Continuous phylogeography of East African/Angolan yellow fever genotypes, shaded blue circles represent 80% highest posterior density interval of the respective nodes of the MCC tree.
Discussion
General and molecular epidemiology
Yellow fever virus was first reported in America in the 15th century by Spanish conquerors, but historical and molecular evidence indicates that the virus first originated in Africa where it was imported into the Americas through the trans-Atlantic slave trade.10,30 Our data shows a fluctuating pattern of intermittent outbreaks with the highest cases occurring between 1986 and 1988 (Figure 1B). There was also an upsurge in cases from Angola in 2015, spreading to the Democratic Republic of Congo and Uganda in 2016. 17 Certain social drivers such as long-term conflict causing human population displacement may be responsible for this re-emergence in East Africa.
The molecular epidemiology of YF virus was consistent with previous reports.8,31,32 The African sequences maintained their geographically defined genotypes (Figure 2A), with an exception of a West African genotype II (WA-II) isolate reported from the Central African Republic GenBank accession number GU073130. This virus was isolated from a mosquito in 1974 in the Central African Republic, an indication that the WA-II genotype might have been circulating and maintained in the forests of CAR. The EA genotypes I and II were strictly maintained in their geographical region. The evolutionary rate of the African YFV in our study of 2.08 × 10⁻⁴ is slightly lower than that of a previous report in Africa of 2.8 × 10⁻⁴. 13 Our result is also lower than that of a study of Brazilian YF isolates of 3.1 × 10−4,33 but is consistent with that of Sall et al 32 which gave 2.10 × 10⁻⁴. This observation may be because the Brazilian study was conducted using complete YFV genome sequences with fewer samples than ours, while the study of Sall et al. 32 was done using partial E gene sequences, just our study. This observation highlights the fact that factors such as sample size and genome length can influence the statistical calculation of the evolutionary rate of RNA viruses. Thus, our evolutionary rate might not be entirely reflective of the actual evolutionary rate of YFV in Africa, but fairly represents the evolutionary rate of the E protein among African YF viruses.
Phylogeography and transmission dynamics
There is a paucity of data regarding the special epidemiology of Infectious agents in Africa, recent reports from West Africa have shown the significance of molecular biogeography and special epidemiology in tracking rapidly expanding infectious agents within West Africa.34 -37 Yellow fever phylogeography has consistently shown a distinct geographically bound diversification.8,33,38 Our present study supports this hypothesis with sub-regional clustering of the West African genotypes, East/Central African genotype and the Angolan genotype within their various sub-regions. The more recent sequences isolated from Nigeria in 2018, clustered within WA-II, having a common ancestral history as the other closely related isolates, and sharing the same sub-clade with isolates from Senegal, Cameroon, and Burkina Faso. This observation shows strict geographical conservation probably because the same genotype has established itself within the Forests and grasslands of Nigeria all the way to Senegal. 22 Previous studies have hypothesized that sustained epizootic transmission cycles within forested regions of Africa have led to YFV adaptation to its intermediate host NHP and its competent vector Heamagogous spp. 8 Also, the fact that humans act as accidental hosts, leaves little opportunity for intra-host evolution and diversity among the human population.8,15 Previous reports have identified key mutational features among African YF isolates that confer a positive selection pressure and may play a role in genotype emergence.12,35 The EA and the Angolan genotypes conformed with previously reported geographically defined diversity.8,32 The most recently identified strains from outbreaks in Angola and Uganda in 2015/2016 clustered within separate genotypes.
Discrete phylogeography showed linkages within both West Africa and East Africa and between both regions. This is an indication of sustained intra-regional transmission as well as trans-regional transmission resulting from constant human movement between West and Central Africa. This observation serves as evidence that YF transmission dynamics may be influenced by other factors asides from ecological and climatic events that may affect the forest/Savanah ecosystem as previously reported.39 -41 Continuous phylogeography revealed a gradual temporal spread among the genotypes within their regions of primary emergence. The WA genotypes seemed to have stronger migration events compared to the EA genotypes. The WA genotypes displayed an eastward movement cutting across more than four countries within the space of just 40 years from Senegal, Mali axis to Camerron as far east as Angola (Figure 5A). This very fast spread of the WA genotype may not be unconnected with the rich vegetation across the region and the successful adaptation of the principal insect vector Aedes egypti to the urban environment of the cities of West Africa. The EA genotype however displayed a much slower spread rate, with its spread event mainly localized within the Central/East African regions (Figure 5B). The EA/Angolan genotypes seemed to be restricted in their dispersal activity within the East/Central African region, although some northward movement was observed with spread events into Sudan and Ethiopia, these were just probably isolated occurrences arising from local outbreaks from Sylvatic/Sahvana YF cycle spillovers into human habitation areas. 16
Conclusion
This study reports the most current data on YF virus phylogeography and transmission dynamics. We have shown that the YF virus maintains a strict geographically bound lineage dispersal pattern, with major genotypes circulating within strict regional confines. We also report a major surge in reported laboratory confirmed cases majorly in East Africa, after the year 2015. There was also rapid expansion of the WA-II genotype in the last 4 years. Study limitations include poor genomic surveillance systems across Africa, resulting in a limited amount of YF sequence data available in open-source data banks. We, therefore, recommend expanded human and vectorial surveillance of YF outbreaks as well as other Arboviruses of public health importance. We also advocate for upscaling Molecular biology capabilities of existing public health labs both Nationally and regionally to enable rapid genomic sequencing and analysis of samples from Arboviral outbreaks such as YF to help in prevention of future epidemics and protect Africa from existing biological threats.
Supplemental Material
sj-docx-1-evb-10.1177_11769343241309247 – Supplemental material for Phylodynamic Investigation of Yellow Fever Virus Sheds New Insight on Geographic Dispersal Across Africa
Supplemental material, sj-docx-1-evb-10.1177_11769343241309247 for Phylodynamic Investigation of Yellow Fever Virus Sheds New Insight on Geographic Dispersal Across Africa by Babatunde Olanrewaju Motayo, Adewale Opayele, Paul Akiniyi Akinduti, Adedayo Omotayo Faneye and Isibor Patrick Omoregie in Evolutionary Bioinformatics
Supplemental Material
sj-docx-2-evb-10.1177_11769343241309247 – Supplemental material for Phylodynamic Investigation of Yellow Fever Virus Sheds New Insight on Geographic Dispersal Across Africa
Supplemental material, sj-docx-2-evb-10.1177_11769343241309247 for Phylodynamic Investigation of Yellow Fever Virus Sheds New Insight on Geographic Dispersal Across Africa by Babatunde Olanrewaju Motayo, Adewale Opayele, Paul Akiniyi Akinduti, Adedayo Omotayo Faneye and Isibor Patrick Omoregie in Evolutionary Bioinformatics
Supplemental Material
sj-docx-3-evb-10.1177_11769343241309247 – Supplemental material for Phylodynamic Investigation of Yellow Fever Virus Sheds New Insight on Geographic Dispersal Across Africa
Supplemental material, sj-docx-3-evb-10.1177_11769343241309247 for Phylodynamic Investigation of Yellow Fever Virus Sheds New Insight on Geographic Dispersal Across Africa by Babatunde Olanrewaju Motayo, Adewale Opayele, Paul Akiniyi Akinduti, Adedayo Omotayo Faneye and Isibor Patrick Omoregie in Evolutionary Bioinformatics
Supplemental Material
sj-docx-4-evb-10.1177_11769343241309247 – Supplemental material for Phylodynamic Investigation of Yellow Fever Virus Sheds New Insight on Geographic Dispersal Across Africa
Supplemental material, sj-docx-4-evb-10.1177_11769343241309247 for Phylodynamic Investigation of Yellow Fever Virus Sheds New Insight on Geographic Dispersal Across Africa by Babatunde Olanrewaju Motayo, Adewale Opayele, Paul Akiniyi Akinduti, Adedayo Omotayo Faneye and Isibor Patrick Omoregie in Evolutionary Bioinformatics
Supplemental Material
sj-docx-5-evb-10.1177_11769343241309247 – Supplemental material for Phylodynamic Investigation of Yellow Fever Virus Sheds New Insight on Geographic Dispersal Across Africa
Supplemental material, sj-docx-5-evb-10.1177_11769343241309247 for Phylodynamic Investigation of Yellow Fever Virus Sheds New Insight on Geographic Dispersal Across Africa by Babatunde Olanrewaju Motayo, Adewale Opayele, Paul Akiniyi Akinduti, Adedayo Omotayo Faneye and Isibor Patrick Omoregie in Evolutionary Bioinformatics
Supplemental Material
sj-docx-6-evb-10.1177_11769343241309247 – Supplemental material for Phylodynamic Investigation of Yellow Fever Virus Sheds New Insight on Geographic Dispersal Across Africa
Supplemental material, sj-docx-6-evb-10.1177_11769343241309247 for Phylodynamic Investigation of Yellow Fever Virus Sheds New Insight on Geographic Dispersal Across Africa by Babatunde Olanrewaju Motayo, Adewale Opayele, Paul Akiniyi Akinduti, Adedayo Omotayo Faneye and Isibor Patrick Omoregie in Evolutionary Bioinformatics
Supplemental Material
sj-xls-7-evb-10.1177_11769343241309247 – Supplemental material for Phylodynamic Investigation of Yellow Fever Virus Sheds New Insight on Geographic Dispersal Across Africa
Supplemental material, sj-xls-7-evb-10.1177_11769343241309247 for Phylodynamic Investigation of Yellow Fever Virus Sheds New Insight on Geographic Dispersal Across Africa by Babatunde Olanrewaju Motayo, Adewale Opayele, Paul Akiniyi Akinduti, Adedayo Omotayo Faneye and Isibor Patrick Omoregie in Evolutionary Bioinformatics
Footnotes
Author Contributions
Conceptualization, B.O.M.; Data curation: B.O.M., A.O., and P.A.A.; Formal analysis: B.O.M., and P.A.A.; Software: B.O.M.; Resources: B.O.M., A.O., and A.O.F.; Writting original draft: B.O.M.; Writting review and editting: B.O.M., A.O., P.A.A., A.O.F., and I.P.O.
Funding:
The author(s) received no financial support for the research, authorship, and/or publication of this article.
Declaration of conflicting interests:
The author(s) declared no potential conflicts of interest with respect to the research, authorship, and/or publication of this article.
Data Availability Statement
The data used in this study is freely available on GenBank and their information is also available as a supplementary table.
Supplemental Material
Supplemental material for this article is available online.
References
Supplementary Material
Please find the following supplemental material available below.
For Open Access articles published under a Creative Commons License, all supplemental material carries the same license as the article it is associated with.
For non-Open Access articles published, all supplemental material carries a non-exclusive license, and permission requests for re-use of supplemental material or any part of supplemental material shall be sent directly to the copyright owner as specified in the copyright notice associated with the article.