
Abstract
As phylogenomic approach becomes a common practice for constructing true bacterial phylogenies, it has become apparent that single molecular markers such as 16S ribosomal DNA often lead to misclassification of species. In this study, we present a program called Popmarker that uses the true species phylogeny and identifies a minimum set of molecular markers reflecting the bacterial evolution history and phylogenetic relationship at the resolution of populations. Popmarker ranks the proteome according to the correlation of whole species tree or subtree branch length against orthologous sequence distances. We demonstrate that 5 proteins of 2 top ranks achieve the same resolution as concatenation of 2203 single-copy orthologous genes and the right species classification as well as correct split of the 2 groups of
Keywords
Introduction
The phylogenetic relationships among species provide crucial information on evolution and divergence from a common ancestor. Comparing phenotypic traits or molecular features between species is only possible after an accurate species phylogeny is inferred. Thanks to high-throughput sequencing, phylogenies are built from complete genomes particularly in bacteria.1–4 However, the phylogeny needs to be revised each time as a new species is incorporated, and sometimes, a complete genome is not available. An alternative and more cost-effective way is to reconstruct the phylogeny by selecting represented marker genes that are homologs present in all species of interest which reflect true phylogenetic relationships. Ideally, the marker should delineate the relationship at the species or even subspecies level. The frequently used marker ribosomal DNA (rDNA) has a very limited resolution at the species level, so the focus has shifted to a combination of housekeeping genes5,6 or seeking new markers from genomic data to reconstruct the phylogenetic tree at species level.7–9 Currently, no study has focused on the population or subspecies level, which is important in population biology, especially in ecology of bacteria, owing to the challenge in isolation of individuals with highly undistinguished phenotypes and identification of them with enormously unknown genomes and interactions involved in the system.
In this study, we start to address this issue by developing a program Popmarker which aims to find a minimum set of marker genes to reconstruct the phylogenetic relationship with resolution of population levels. The advantages of our proposed method are as follows: (1) each orthologous gene is scored by sequence distance not by its gene tree topology to avoid the time-consuming in aligning sequences and reconstructing individual gene tree, (2) we attempt to resolve the phylogeny not only at species level but also at population level, (3) the reference species tree is reconstructed by phylogenomics using the concatenation of sequences of large number of single-copy orthologues identified by orthogroup inference programs, (4) Popmarker is flexible in identifying markers from protein or nucleotide sequences, and (5) because the identification of orthologous genes has been widely used in genome comparison or phylogenomics in many different lineages of tree of life,10–13 Popmarker can be inherently applied in any organism where its genome is available. We tested Popmarker in Vibrio where existing common marker genes lead to species misclassification and can only be resolved by phylogenomics and average nucleotide identity (ANI). We included Vibrio campbellii, Vibrio harveyi, Vibrio owensii, Vibrio jasicida, Vibrio rotiferianus, and Vibrio parahaemolyticus with >97% rDNA identity and with 85% to 91% ANI and 2 groups in V. campbellii with 96.4% ANI. 4 Popmarker is implemented by Python and available from https://github.com/chpngyu/Popmarker.
Materials and Methods
Test data sets
In this study, the bacterial genomes in the Harveyi clade of family Vibrionaceae (Supplementary Table S1) were downloaded from the National Center for Biotechnology Information database, and protein sequences were annotated by Prokka. 14 The data set consists of 48 strains from 6 species including V. harveyi (11 strains), V. campbellii (13 strains), V. owensii (8 strains), V. jasicida (7 strains), V. rotiferianus (3 strains), and V. parahaemolyticus (6 strains).
Overall workflow
A user has to provide gene or protein sequences from a group of species of interest. Popmarker contains 5 steps as follows:
Identify orthologous relationships of the provided proteome and calculate sequence distances between orthologous protein or gene pairs.
Construct a species phylogenetic tree using all orthologous sequences as a reference tree. This step is option if users use a predefined tree instead.
Rank proteins based on correlations between the species tree and sequence distances within the orthologous proteins (step 3.1) and/or between a subtree of some species of interest and the sequence distances of the orthologues in the subtree (step 3.2).
Reconstruct a phylogenetic tree (gene tree) using the top N proteins from the above rank.
Compare the gene tree with the species tree.
The overall commented workflow is shown in Figure 1, and the detailed methods are described as follows.

The Popmarker pipeline.
Identify orthologous relationships and calculate sequence similarities
First, users need to provide all available gene/protein sequences in a number of species of interest (say N species) and identify orthologous sequence families using orthologous prediction tools, such as OrthoMCL, 15 MultiParanoid, 16 and OrthoFinder. 17 In our pipeline, we provided a script, orthoships.py, to obtain 1-to-1 orthologous relationships from the result of OrthoFinder (v. 0.2.8) where an orthologous protein in an orthologous group has to be only 1 copy in a species, and all proteins in the orthologous group have to be in all the N species. Furthermore, for the later calculation of sequence similarity, all-to-all blastp were performed to obtain E-values and bit-scores between all orthologous genes. Conveniently, this is already performed in the first steps of orthologous prediction tools.
Construct species tree
The sequences in each orthologous group were aligned by MAFFT (v7.271) 18 with a local alignment option (localpair), and orthologous sequences were discarded if they have the alignment with more than 10% gaps. Based on the alignment of concatenation of the remaining orthologous sequences, a phylogenetic tree was generated using FastTree19,20 with 1000 resamples. The phylogenic tree (called the species tree) was used as a reference tree for later use and can be visualized by FigTree v1.4.2 (http://tree.bio.ed.ac.uk/software/figtree/).
Rank proteins by the correlations between species tree and sequence distances
To identify the genes which can provide the classification of taxon, we develop a method based on calculation of correlations between branch lengths of the species tree and sequence similarities of the orthologous genes. It contains 3 steps (Figure 2). First, for a given reference tree with N nodes (species or strains), a tree vector (T) was constructed as follows:

where i and j were 2 species in the tree, and d(i,j) was the summation of branch lengths between the 2 species. If the tree does not provide the branch lengths, it will be set to unit length. Second, for a set of orthologous genes (1-to-1 orthologous pairs among N species/strains; see above), a vector of sequence distance (S) between the orthologous pairs was constructed as follows:
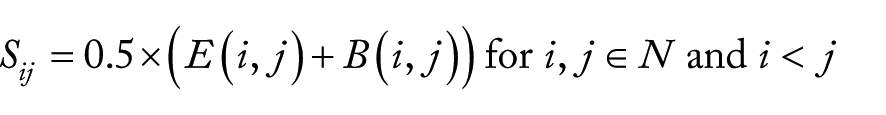
where E(i,j) was a normalized value by taking the natural logarithm of BLAST E-value (lnE) between an orthologous pair in species i and j. If the E-value was 0, we set it to 0.1 × (minimum nonzero E-value). The lnE was then normalized by (lnE − lnEmin)/(lnEmax − lnEmin), where lnEmax and lnEmin were the maximum and minimum lnE, respectively. For B(i,j), we normalized bit-score (bs) between the orthologous pair in species i and j by (bs − bsmax)/(bsmin − bsmax), where bsmax and bsmin were the maximum and minimum bit-scores, respectively. Note that the B(i,j) is 0 if the bs is maximum, and it is 1 if the bs is minimum. We transformed the maximum bit-score into 0 to indicate that the most similar sequences have a lowest distance, and adding the B(i,j) term will increase the discrimination of evolutionary distance if E-value is 0. Finally, we calculated the correlation between the tree vector (T) and the sequence vector (S) for each set of orthologous groups using Pearson correlation coefficient (PCC), Spearman rank-order correlation coefficient, and Kendall τ. The correlations were sorted by their P values and then the correlation values (if the P values were same). We called this as “Species Rank” and can be obtained by calling the script, rankgene.py, where users need to give a species tree, blast-all result, and 1-to-1 orthologous groups. The script also produces a “Clade Rank” if user gives another tree where some species require a higher resolution.
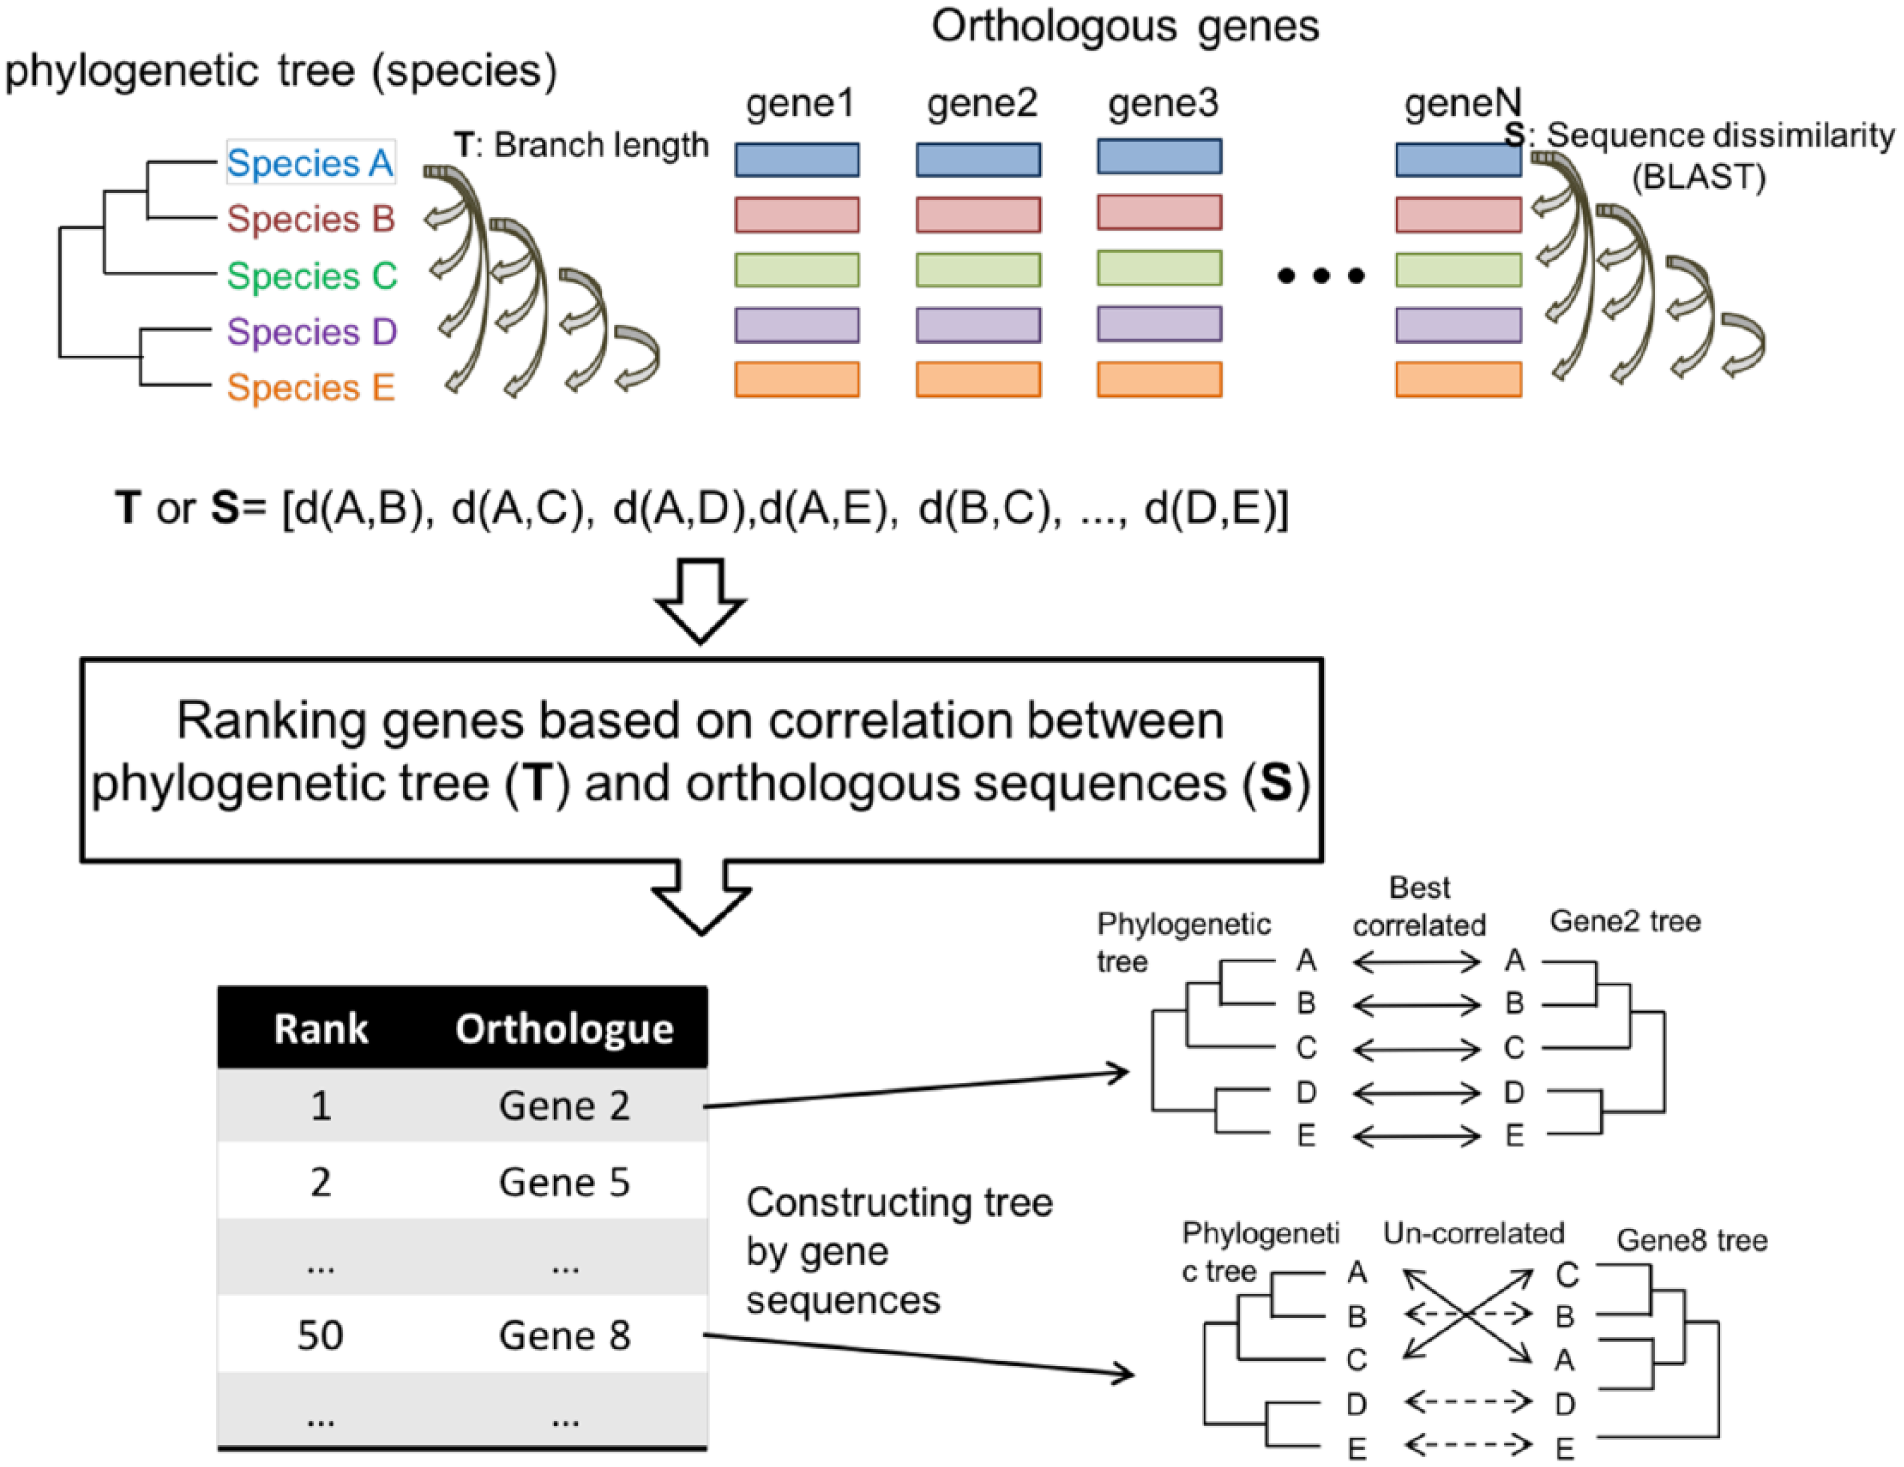
A schematic example for calculation the correlation between a species tree and orthologous sequences. A species tree comprising 5 species is shown at the upper left and each orthologous group of genes in the 5 species is shown in each column at the upper right. Two scenarios of tree comparisons with the species tree and reconstructed gene trees are shown at the bottom right based on the orthologous group of genes in the rank of top 1 (gene2) and top 50 (gene8), respectively.
Reconstruct a phylogenetic tree using the identified protein sequences
After the genes were chosen from top of Species Rank or combined Species Rank and Clade Rank, each orthologous genes among 48 strains were aligned independently using MAFFT (v7.271) 18 and were concatenated in order into a sequence for each species. FastTree was used to construct a tree (denoted as gene tree) from each alignment and compare it with the species tree. The script maketree.py was provided to reconstruct a gene tree by either given the genes from Species Rank or genes compared with Clade Rank.
Tree comparison
For evaluating the similarity between the gene tree and the species tree, the PCC was used for comparing the branch lengths (tree vector T) between both trees. The distance was defined by 1 PCC (treedist.py). The tree topology was also evaluated by computing the Robinson-Foulds distance between phylogenies using “multiPhylo” function from phytools package in R.21,22
Ranking genes associated with a phylogenetic tree using nucleotide sequences are also available. The above pipeline needs to replace all-to-all blastp with all-to-all blastn; genes are then sorted in Species Rank and Claded Rank, respectively, and the gene tree is reconstructed similar to the procedure using protein sequences.
Gene tree reconstructed using traditional molecular markers
As a comparison with the traditional molecular markers, the gene trees of 16S rDNA, recombinase A (recA), RNA polymerase α subunit (rpoA), glyceraldehyde-3-phosphate dehydrogenase α subunit (gapA), DNA gyrase β subunit (gyrB), and the concatenated sequences from these 5 genes were constructed by the same method as mentioned above. The gene tree was reconstructed using -nt option. For 16S rDNA, the homologous genes were identified by blastn search in all strains using 16S rDNA in Vca1114GL as reference. The orthologous gene of gyrB was identified by OrthoFinder. For the protein-coding housekeeping genes, as recA, rpoA, and gapA cannot be found in the all strains, blastp was used instead for finding the homologous genes (Supplementary Table S2).
Results
Identification of single-copy orthologues and construction of species tree
For illustrating the process, we used a total of 48 proteomes from 6 species, including 13 V. campbellii, 11 V. harveyi, 8 V. owensii, 7 V. jasicida, 3 V. rotiferianus, and 6 V. parahaemolyticus. As an accurate phylogenetic tree is the prerequisite for identification of molecular markers for a group species of interest, the beginning of Popmarker is to construct such phylogeny if the genome or proteome of each species are available. In the first step, the sequence distances between protein pairs were calculated by blastp and the orthologous relationships were identified by OrthoFinder. 17 A total of 2287 1-to-1 orthologous genes, ie, gene family of size 1 in each of the 48 strains, were identified. In the second step, the species phylogenetic tree was reconstructed by FastTree 19 using concatenated alignment sequences with 2203 of 2287 orthologous genes after excluding genes with more than 10% gaps. The phylogenetic tree classified 48 strains into 6 species and classified V. campbellii into 2 subgroups (Vc-Gr1 and Vc-Gr2) (Figure 3A). This tree will be referred as species tree throughout this study. In addition, the species tree has the same classifications as that in our previous study 4 (distance = 0.004 by treedist; K-score = 0.010 by Ktreedist) in which we identified 1729 orthologues genes by a different tool, OrthoMCL, 15 and reconstructed the phylogenetic tree using RAxML (v8.1.17). 23 Because both approaches give consistent results, results based on OrthoFinder and FastTree are used to demonstrate our method for the faster computing time. The topology of the whole species tree and the V. campbellii subgroup tree was used as 2 calibrations for evaluating the accuracy of our method.

Species tree and reconstructed gene trees: (A) a species tree using 2287 orthologous genes in 48 Vibrio harveyi clade, (B) a reconstructed gene tree using orthologous sequences of top gene group (eg, Vca1114GL_00502, a hypothetical protein, in Vibrio campbellii 1114GL) in the Species Rank with PCC metric, (C) a reconstructed gene tree using concatenated alignment of top 4 orthologous sequences in the Species Rank with PCC metric, and (D) a reconstructed gene tree using the orthologous sequences same to (C) and the top 12th group in the Vca-Clade Rank with PCC metric. PCC indicates Pearson correlation coefficient.
Ranking and selecting of marker genes
In the next step, 3 coefficient correlations (PCC, Spearman, and Kendall) were calculated between the branch lengths of strains in the species tree (T) and the sequence distances based on the scores of blastp (S) for each group of 1-to-1 orthologous genes. As orthologous gene whose sequence distance is correlated with the species tree can be a potential marker gene, all 1-to-1 orthologous gene families were ranked by their correlation values in descending order (PCC correlation as example in Supplementary Table S3).
In the fourth step, gene trees were reconstructed by concatenating the alignments of genes from Top1 to TopN (concatenating the first gene to the Nth gene from the Species Rank) to capture the evolutionary history of these species. We found that, using the first (Top1) genes by the PCC, Kendall, and Spearman methods, 48 strains can group into correct species classification (Figure 3B and Supplementary Figure S1). We found that the Top1 gene based on PCC (=0.989) is a hypothetical protein (eg, Vca1114GL_00502 in V. campbellii 1114GL) and the Top1 gene based on Kendall and Spearman gave a same gene responsible for tetratricopeptide repeat–containing protein YfgC precursor (eg, Vca1114GL_02775 in V. campbellii 1114GL). Unfortunately, the relationships between species groups inferred from either of these genes were inaccurate. For example, the gene tree reconstructed by the Top1 gene selected by the PCC method showed that V. owensii and V. jasicida were closer to V. harveyi than to V. campbellii, different from that of the species tree (Figure 3A and B). By including more genes, the phylogenetic trees reconstructed by the Top2 (ie, concatenated first and second genes), Top3, Top4, and Top5 in the Species Rank based on the 3 correlation methods showed the correct classification at the species level, ie, strains from the same species identified by species tree have formed monophyletic groups in the gene tree. Moreover, the phylogenetic relationships between species groups in the gene trees using Top2, Top3, Top4, or Top5 by the PCC method was the same as species tree, and, in some branches, the lower support values in the gene trees were improved when combining more genes (Figure 3C and Supplementary Figure S2).
Evaluating gene trees
Finally, the topologies of these reconstructed gene trees were evaluated by computing correlation distances between gene tree and species tree. The distance between the Top1 gene tree and species tree was 0.029 with using PCC (median = 0.146 of the distances between combinations of all the gene trees and the species trees). For Kendall, and Spearman methods, the distance was 0.051 because of the same Top1 gene. The correlation distance between the gene trees and species trees was dropped quickly to distance < 0.01 when the gene trees were reconstructed by Top5 or more genes in the top rank (Figure 4A). The gene trees selected from the PCC method outperformed than those from the Kendall or Spearman method according to either correlation distance or Robinson-Foulds distance (Figure 4A).

Comparison between reconstructed gene trees with the species tree. Tree distances (first y-axis: our method, second y-axis: Robinson-Foulds distance) between the species tree and the reconstructed gene trees are shown using 3 correlation metrics: PCC, Kendall τ, and Spearman. The gene trees are constructed by selecting varied orthologous groups in the ranks with respect to the species tree (A, C) or subtree of Vca clade (B, D). In the horizontal axis of (A) and (B), TopN indicates that the gene tree is constructed by sequences selected from the top N orthologous groups in the rank of species and Vca clade, respectively. In the horizontal axis of (C) and (D), TopN + 1 indicates that the gene tree is constructed by sequences selected from the top N orthologues in the Species Rank and the top most orthologous group in the Clade Rank where the group is also in the top 50 of the Species Rank.
Ranking genes at a specific clade level
We observed that the gene tree reconstructed from the Top5 genes accurately classified species and their relationship but not the subgroups of V. campbellii. This is true even if the top10 gees were used in the Species Rank (Figures 3B, 3C and 4B). To increase the resolution of the gene tree to classify the subgroups, a second rank (Clade Rank) was introduced by calculating the correlation between the V. campbellii subtree in the species tree and the sequence distance among the V. campbellii strains (step 3.2). To keep both the relationships among all species and V. campbellii subgroups, the protein with the highest rank in both Species Rank and Clade Rank was chosen. For example, phosphoethanolamine transferase (EptA; Vca1114GL_04704) in the PCC method showed the highest rank in both Species Rank and Clade Rank, and this protein was concatenated to the TopN proteins of Species Rank and the gene trees were reconstructed. However, the pheromone autoinducer 2 transporter (Vca1114GL_02777) was chosen in both Kendall and Spearman methods and was concatenated to the TopN proteins of Species Rank from Kendall and Spearman, respectively. The correlation distances between the gene trees and the species tree (Figure 4C) and that between V. campbellii subtree of the gene trees and V. campbellii subtree of the species tree (Figure 4D) showed that the performance of PCC is still better than the other 2 methods. The gene tree using combination of Top4 + 1 (EptA) from PCC has the lowest correlation distance of the subtree (Figures 3D and 4D). This gene tree (Figure 3D) not only shows correct evolutionary relationships among taxa with high support value (>97.3) but also shows correct 2 groups of the V. campbellii strains (Figure 3A).
Performance of Popmarker using nucleotide sequences
Based on the same algorithm, the nucleotide sequence similarity (from blastn) of the 2203 copy orthologous genes was also used for sorting the genes using Species Rank (Supplementary Table S4). The top gene in the Species Rank is guanosine triphosphate pyrophosphokinase (Vca1114GL_02482), and phylogeny constructed from this gene grouped each strain to the right species but wrong relationship between species (PCC distance = 0.97) (Supplementary Figure S3a). When using Top7 genes, the phylogeny reflects right species relationship (PCC distance = 0.45) (Supplementary Figure S3b). The distance between species tree and gene tree showed that the genes based on PCC have better performance (Supplementary Figure S4). We also used the well-known molecular markers, including 16S rDNA, recombinase A (recA), RNA polymerase α subunit (rpoA), glyceraldehyde-3-phosphate dehydrogenase α subunit (gapA), DNA gyrase β subunit (gyrB), to construct individual gene tree and construct a tree using concatenated sequences (Supplementary Figure S5). Species misclassifications were observed in all single gene trees except the gene tree of rpoA, which grouped strains into their own species but has incorrect relationships between species. For example, the tree reconstructed by 16S rDNA can distinguish the out-group (V. parahaemolyticus) but only cluster the V. harveyi strains as a monophyletic taxon. In recA gene tree, the strains of V. campbellii, V. owensii, and V. rotiferianus cannot be classified into monophyletic taxa. The gapA gene tree cannot classify V. campbellii, V. owensii, and V. harveyi. The gyrB gene tree cannot cluster the V. campbellii strains as monophyletic taxon. Even with the concatenated gene tree (16S rDNA -gapA-recA-rpoA) can cluster the strains into correct species, the relationship among species did not reflect the species phylogeny.
Discussion
We have provided a program to readily identify and allow users to switch to more robust markers when the species phylogenetic tree is revised. This is useful for molecular epidemiology to deal with frequently changed microbes. When choosing a set of genes to reconstruct the species tree using 3 correlation methods, the genes chosen by the PCC method have better performance compared with the other 2 nonparametric methods (Kendall and Spearman) because PCC considers the branch length in phylogenic tree and infers the evolutionary distance. Kendall and Spearman methods were still provided in our program as options.
We focused on a combination of marker genes that can correctly identify 2 populations in an often-misclassified Vibrio species. This classification is congruent with the species tree which was confirmed by genome ANI in the previous study. 4 These 5 genes identified by Popmarker provided better Vibrio species classification and relationship than current employed markers. 24 Analyzing these genes also helps us to understand the genomic event which led to specific phenotypic differences between different species/populations. For example, in the Species Rank from PCC, the func-tions of first to fifth proteins are, respectively, hypothetical protein (eg, Vca1114GL_00502), glutathione-dependent formaldehyde-activating enzyme (Vca1114GL_03935), helicase IV (Vca1114GL_04071), glutamate cysteine ligase (Vca1114GL_02510), and exonuclease (Vca1114GL_01026). It would be interesting to study the function of the first protein with an unknown function so far.
Although the application of phylogenetic markers other than 16S ribosomal RNA has been used in metagenomics, most of them focused on the higher taxon levels. We have shown that combining genes that reflect either the species level or population level can improve the resolution of the phylogenetic tree to the fine level of subspecies or population. Although still preliminary, the higher resolution at the population level is expected using minimum number of represented markers in getting updated species phylogenetic trees or reanalyzing the markers in studying different taxa. In the future, other genome features and rare genomic changes, such as gene order and insertions/deletions, will be included to capture both genetic diversities within and among species.
Footnotes
Peer review:
Two peer reviewers contributed to the peer review report. Reviewers’ reports totaled 985 words, excluding any confidential comments to the academic editor.
Funding:
The author(s) received no financial support for the research, authorship, and/or publication of this article.
Declaration of conflicting interests:
The author(s) declared no potential conflicts of interest with respect to the research, authorship, and/or publication of this article.
Author Contributions
H-MK, C-PY, and IJT designed the research and wrote the paper. H-MK and C-PY analyzed the data. H-MK and Y-CL plotted the figures. C-PY and IJT supervised the manuscript preparation. All authors discussed the results and commented on the manuscripts. H-MK and C-PY contributed equally to this work.
References
Supplementary Material
Please find the following supplemental material available below.
For Open Access articles published under a Creative Commons License, all supplemental material carries the same license as the article it is associated with.
For non-Open Access articles published, all supplemental material carries a non-exclusive license, and permission requests for re-use of supplemental material or any part of supplemental material shall be sent directly to the copyright owner as specified in the copyright notice associated with the article.