
Abstract
Lung adenocarcinoma (LUAD) is a tumor with high incidence. This study aimed to identify the central genes of LUAD. LUAD were analyzed by weighted gene co-expression network (WGCNA), and differentially expressed genes (DEGs) were identified. Samples were obtained from The Cancer Genome Atlas (TCGA) and Genotype Tissue Expression (GTEx) databases and included 515 LUAD samples and 347 normal samples. The WGCNA algorithm generated a total of 10 modules. The top 2 modules (MEturquoise and MEblue) with the highest correlation to LUAD were selected. Ten Hub genes (IL6, CDH1, PECAM1, SPP1, THBS1, HGF, SNCA, CDH5, CAV1, and DLC1) were screened in the intersecting genes of DEGs and WGCNA (MEturquoise and MEblue). Only SPP1 was correlated with LUAD poor survival, indicating that SPP1 may be a key Hub gene for LUAD. The competing endogenous RNA (ceRNA) network was constructed to analyze the regulatory relationship of Hub genes, and SPP1 may be directly regulated by 4 microRNAs (miRNAs) and indirectly regulated by 49 long noncoding RNAs (lncRNAs).
Background
According to the latest reports from the World Health Organization and international agency for research on cancer, lung cancer is the most common malignant tumor in humans, with the highest incidence (11.6%) and mortality (18.4%) among all cancer types. 1 Lung adenocarcinoma (LUAD) accounts for a high proportion of lung cancers. Advances in genomics have led to the development of targeted molecular agents, such as epidermal growth factor receptor tyrosine kinase inhibitors (EGFR TKIs) and anaplastic lymphoma kinase (ALK) inhibitors,2,3 which play an important role in the treatment of lung cancer. Further genomics research is necessary to identify key Hub genes in LUAD, which may help develop effective targeted agents.
Weighted gene co-expression network analysis (WGCNA) explores the relationship between genes and phenotypes. 4 It can be used to mine specific cancer-related modules and genes associated with specific features by converting gene expression data into co-expression modules to analyze signaling networks. 5 This can identify related genes and predict gene functions by analyzing key genes and identifying potential therapeutic targets and predictive biomarkers. 6 Wei et al 7 used WGCNA to identify modules that were highly correlated with LUAD. Yi et al 8 used WGCNA to identify genes associated with the occurrence and prognosis of LUAD. In recent years, WGCNA has been used extensively to screen important Hub genes from LUAD gene expression data.
In this study, mRNA expression data from LUAD samples downloaded from The Cancer Genome Atlas (TCGA) database were used as the experimental group, whereas normal samples from the Genotype Tissue Expression (GTEx) database were used as the normal group. Module-trait relationship correlation analysis in WGCNA was used to mine out modules highly correlated with LUAD, and the Hub genes were screened in the intersecting genes of DEGs and modules. The competing endogenous RNA (ceRNA) model is a novel regulatory mechanism between mRNA, microRNA (miRNA), and long noncoding RNA (lncRNA).9,10 To understand the regulatory relationship of Hub genes of LUAD, online prediction tools were used to predict miRNAs and lncRNAs for constructing a ceRNA network in LUAD. Experimental design (Figure 1).
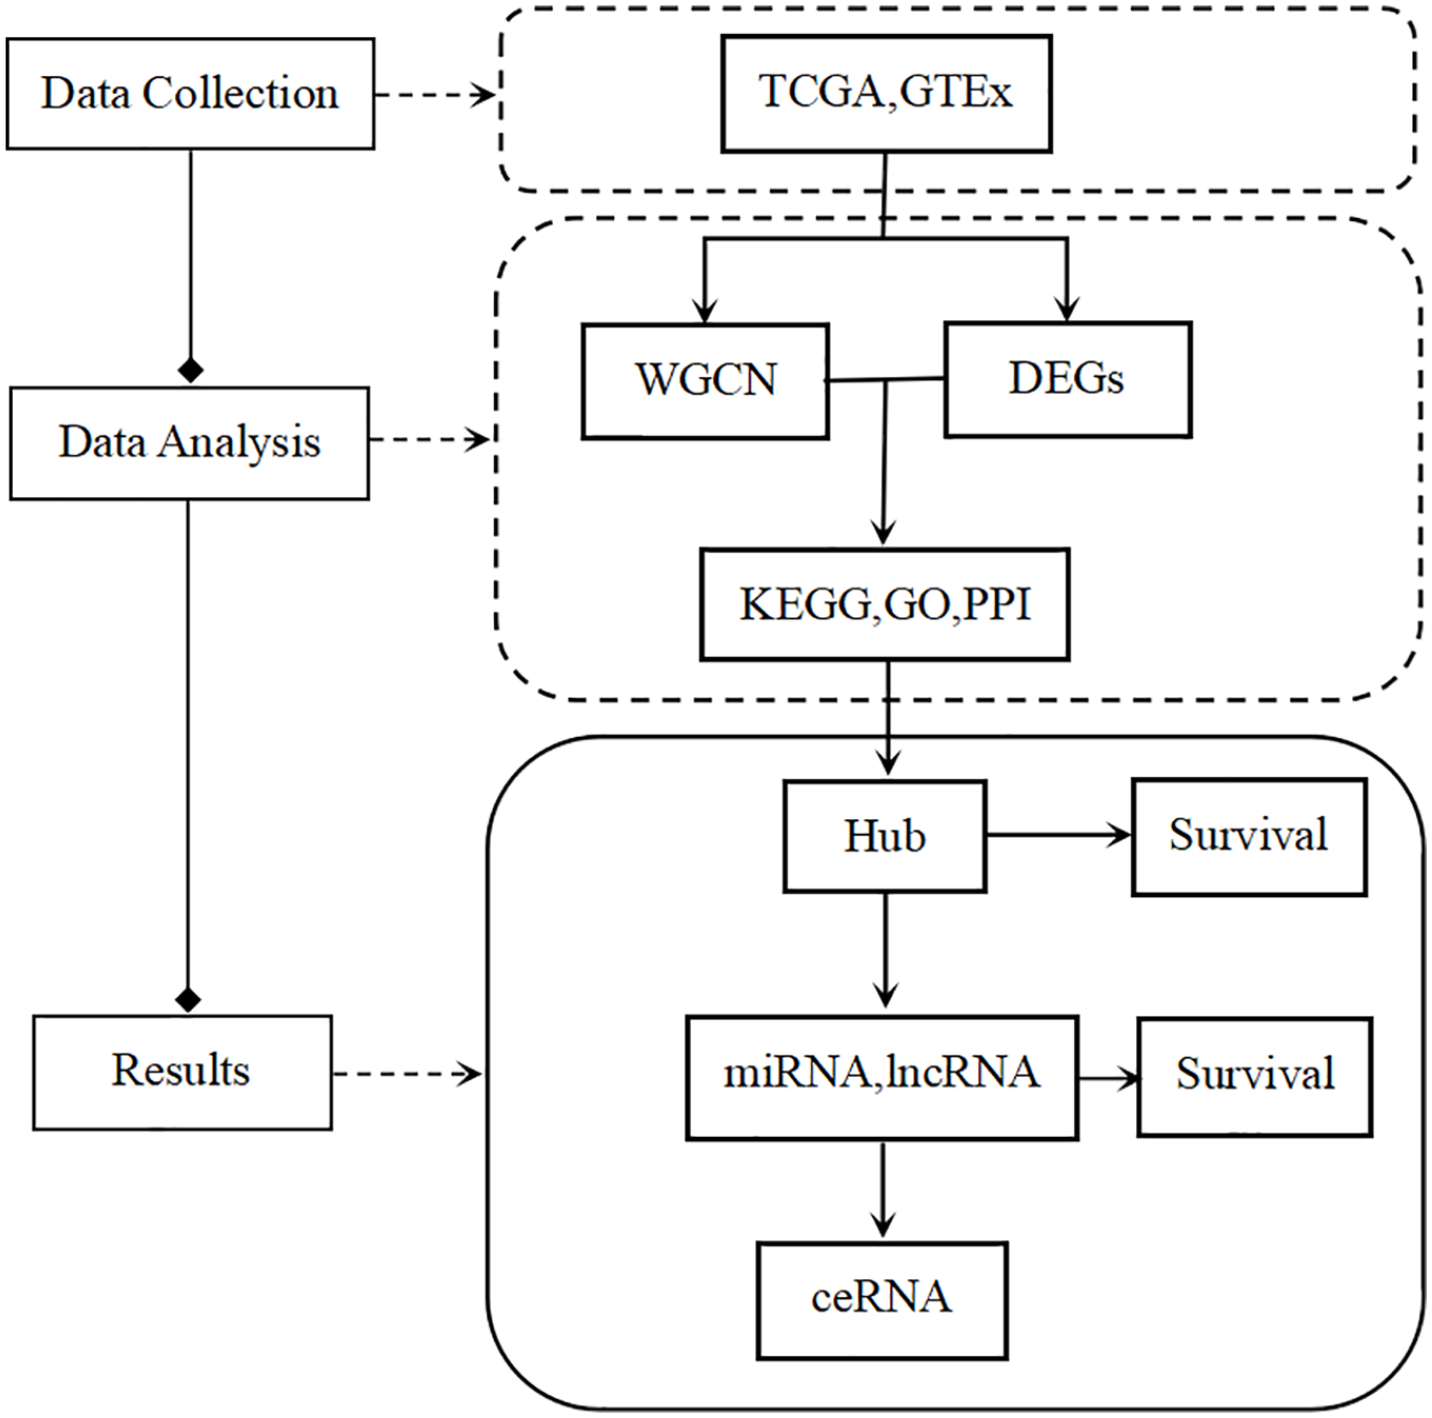
Experimental design.
Materials and methods
mRNA data collection
LUAD RNA expression data were downloaded from TCGA Pan-Cancer (PANCAN) of the UCSC Xena database (https://xenabrowser.net/datapages/). To increase the sample size of normal controls, RNA expression data of normal lung tissues were downloaded from GTEx of the UCSC Xena database (https://xenabrowser.net/datapages/). R software (version 4.0.2) was used to read transcripts per million (TPM) values for all samples and separate the LUAD mRNA. A total of 515 LUAD mRNA samples and 347 normal mRNA samples were identified. Because data were obtained from public databases, ethical approval was not necessary for this study.
DEGs screening
The R package Limma was used to compare the differences between the tumor and normal groups. The adjusted P ≤ .05 11 and log fold change (FC) ≥ 2 screening for up-regulated genes. The adjusted P ≤ .05 and log FC ≤ −2 screening for down-regulated genes. Log FC = log (tumor) – log (normal), where “tumor” is the mean of a gene expression in the tumor group, and “normal” is the mean of a gene expression in the normal group.
WGCNA analysis
The R package WGCNA(https://horvath.genetics.ucla.edu/html/Co-expressionNetwork/Rpackages/WGCNA/index.html) was used to analyze genes with TPM ⩾ 1. β values, as well as scale free R2, were adjusted as a soft-threshold index to construct a scale-free co-expression network. Closely connected genes in the network were clustered together to form a module. Modules are clusters of highly interconnected genes. In an unsigned co-expression network, modules correspond to clusters of genes with high absolute correlations. In a signed network, modules correspond to positively correlated genes. Average linkage hierarchical clustering with a dynamic cutting algorithm was used to generate modules under the conditions of a minimum cluster size of 50 and a height of 0.25. Module trait relationship correlation analysis was performed, and the modules with the highest correlation coefficient (r) with LUAD (tumor) were selected.
Functional enrichment analysis
We selected the intersection part of the modules with the highest correlation of WGCNA and DEGs, and the R package clusterprofiler was used for Kyoto Encyclopedia of Genes and Genomes (KEGG) and Gene Ontology (GO) analysis on this part of the gene set.
Constructing protein-protein interaction (PPI) networks
Intersecting genes were selected using the string database (https://string-db.org/) to construct the PPI network. The PPI pairs with a combined confidence score ⩾ 0.4 were visualized in the network. The Hub genes in the PPI network were identified by cytohubba, a plug-in for the Cytoscape software (version 3.7.2), which identified the top 10 Hub genes.
Hub gene survival analysis and construction of a ceRNA network
The R package RTCGA.clinical was used to download clinical information on LUAD, and the R package survival was used to perform survival analysis on Hub genes and to filter out Hub genes associated with significant survival differences. The Encori online prediction tool was used to predict miRNAs, and miRNAs were used to predict lncRNAs (http://starbase.sysu.edu.cn/index.php). To determine the clinical value of the predicted miRNAs and lncRNAs, survival analysis of miRNAs was performed using the OncomiR online tool, and miRNAs with a P-value ⩽.05 in LUAD were selected (http://www.oncomir.org/). The lncRNA Explorer online tool performed survival analysis on lncRNAs and selected lncRNAs with a P-value ⩽.05 in LUAD (https://lncar.renlab.org/explorer). The results were used to construct an mRNA-miRNA-lncRNA network.
Results
WGCNA results
The R package WGCNA was used to analyze genes (19 405 genes) with TPM ⩾ 1. The β-value was set at 12 (scale free R2 ≥ .90) and adjusted as a soft threshold index to construct a scale-free co-expression network according to the analysis (Figure 2), and the average linkage hierarchical clustering and a dynamic cutting algorithm were used to generate 10 modules. Each color represents a module, including MEred, MEblue, MEgreen, MEmagenta, MEpink, MEyellow, MEblack, MEbrown, MEturquoise, and MEgrey (Figure 3). For each module, the gene co-expression was summarized by the Eigengene 12 (The module eigengene (ME) is defined as the first principal component of a given module. It can be considered a representative of the gene expression profiles in a module). We choose 2 modules with the highest positive correlation and negative correlation to study, including MEturquoise (r = −0.7, 3449 genes) and MEblue (r = 0.6, 1820 genes).
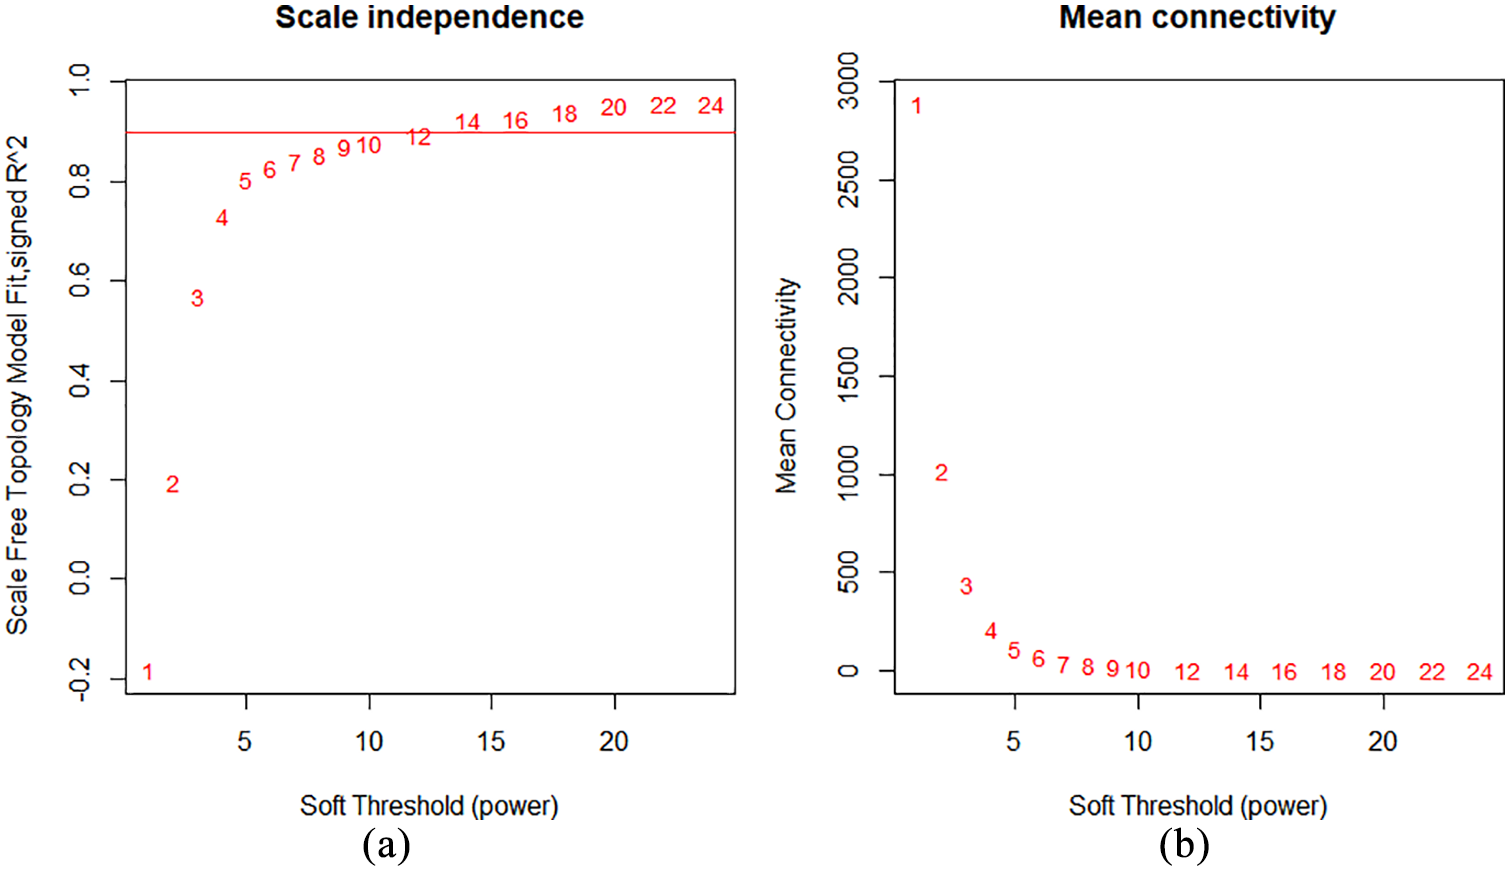
(a) Effects of power values on the scale independence of genes in co-expression modules for LUAD and (b) effects of power values on the average connectivity of genes in co-expression modules for LUAD.

The module-trait relationship is the result of the correlation between modules and tumors (LUAD) or normal. The different colors on the left represent different modules (MEred, MEblue, MEgreen, MEmagenta, MEpink, MEyellow, MEblack, MEbrown, MEturquoise, and MEgrey). The right side represents the scale of the correlation coefficient, r. Each column corresponds to a clinical characteristic (tumor or normal), and each cell contains the corresponding correlation. A negative value represents a negative correlation.
Intersecting genes of DEGs and WGCNA
DEGs analysis was performed using mRNA data (19 405 genes), and 822 up-regulated genes and 1696 down-regulated genes were screened following the set criteria (adjusted P ≤ .05 and log FC ≥ 2, adjusted P ≤ .05 and log FC ≤ −2). Next, we screened 169 up-regulated genes and 519 down-regulated genes from the intersection of DEGs and WGCNA with 2 modules (MEturquoise and MEblue), with 688 genes in total (Figure 4).
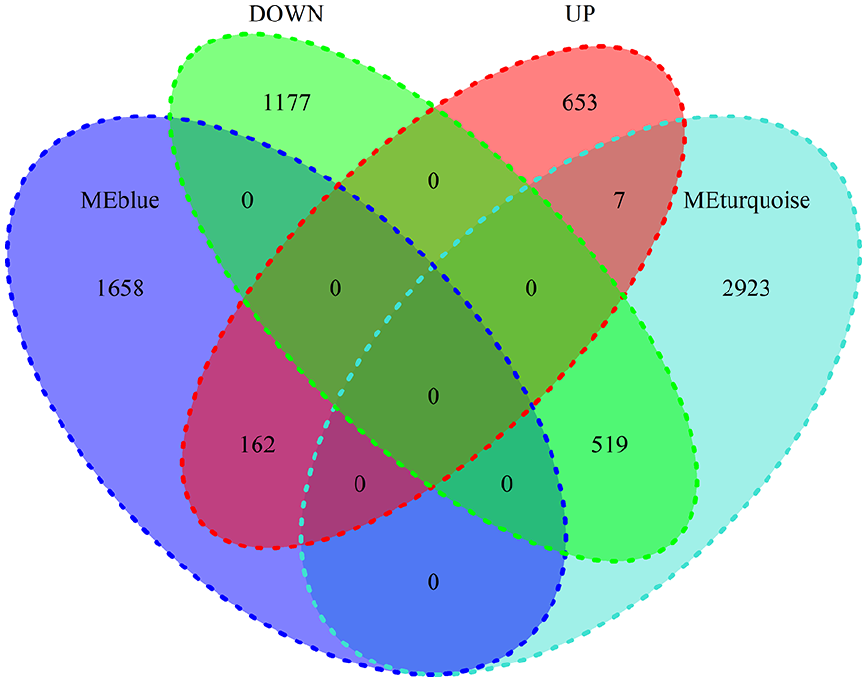
The intersection of the 4 gene clusters. “UP” denotes up-regulated genes, and “DOWN” denotes down-regulated genes. MEblue and MEturquoise are modules highly related to LUAD. The number represents the number of genes.
Enrichment analysis
GO/KEGG analysis was performed for the 688 genes. GO analysis showed that biological process (BP) was mainly enriched in extracellular matrix organization, structural organization. Cellular component (CC) was mainly enriched in collagen-containing extracellular matrix, cell-cell junction. Molecular function (MF) was mainly enriched in glycosaminoglycan binding and sulfur compound binding. The KEGG analysis showed enrichment in the PI3K/Akt signaling pathway (Figure 5a–d).

(a–d) Top 10 GO terms of the genes related to biological process (BP), cellular component (CC), and molecular function (MF), and correlated with cellular process, metabolism, signaling pathways, and organismal systems (KEGG).
PPI network and hub gene survival analysis
The top 10 hub genes (IL6, CDH1, PECAM1, SPP1, THBS1, HGF, SNCA, CDH5, CAV1, and DLC1) were selected from the above gene clusters (688 genes) (Figure 6). To determine which Hub genes had an impact on LUAD survival, survival analysis was performed for each Hub gene. Survival analysis for each Hub gene showed that only SPP1 had an impact on LUAD survival (P = .029) (Figure 7). P-values were calculated using the two-sided log-rank test.
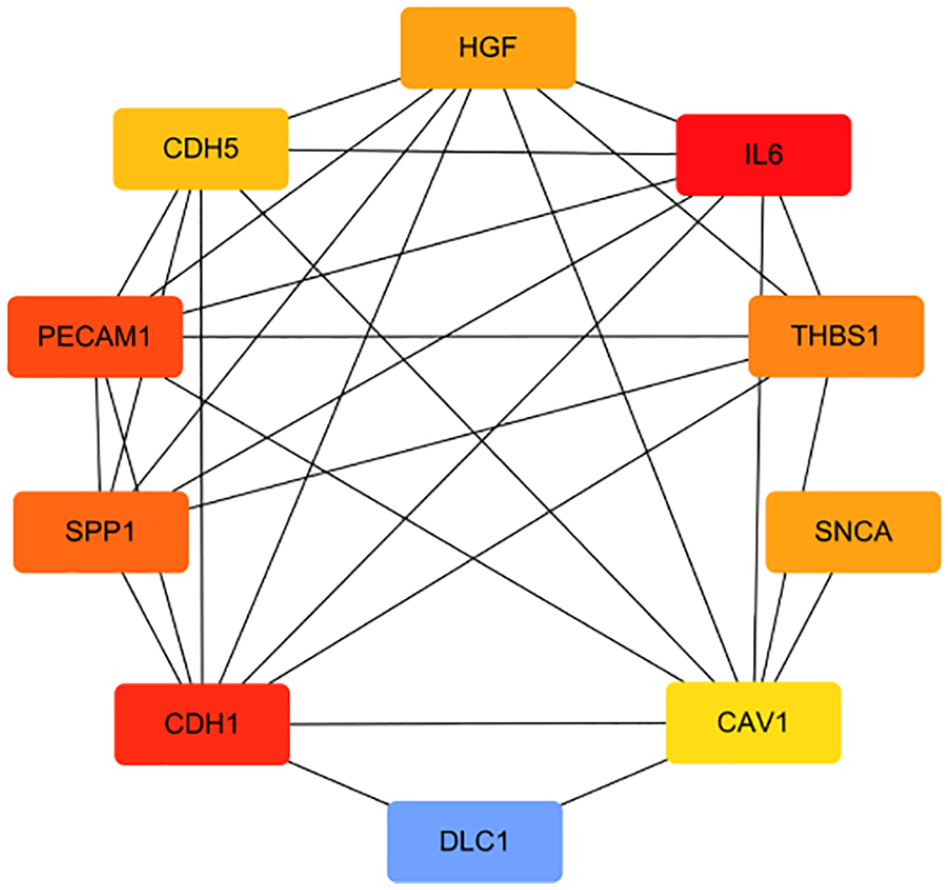
A total of 169 up-regulated genes and 519 down-regulated genes from the intersection of DEGs and WGCNA with 2 modules (MEturquoise and MEblue). The top 10 hub genes were selected from the above gene clusters (688 genes) and were displayed.

Survival analysis for each hub gene showed that only SPP1 had an impact on LUAD survival (P = .029). The expression level of SPP1 was divided into high expression and low expression according to the median. The different colored lines in the figure represent the overall survival outcome of different expression levels.
ceRNA network construction
Online prediction tools showed that SPP1 is regulated by 66 miRNAs, of which 4 were associated with LUAD survival (hsa-mir-125a-5p, hsa-mir-142-5p, hsa-mir-181c-5p, and hsa-mir-582-5p). We predicted 540 lncRNAs for the 4 miRNAs, among which 49 were associated with LUAD survival. A regulatory network consisting of 4 miRNAs and 49 lncRNAs was constructed (Figure 8).

The central oval represents SPP1, the V-shaped represents miRNA, and the rhomboid represents lncRNA.
Discussion
In this study, intersectional genes of DEGs and WGCNA were used for GO/KEGG analysis, screening Hub genes, identifying Hub genes for survival analysis, and only SPP1 among the 10 hub genes had an impact on LUAD survival, and we analyzed SPP1, and predicted miRNAs and lncRNAs, which were used for survival analysis. The cDNA sequence of the SPP1 gene contains a 67 BP 5′-UTR, a 415 BP 3′-UTR, and a 942 BP coding region encoding a 314 amino acid protein. 13 KEGG analysis showed that SPP1 is involved in the PI3K/Akt signaling pathway, and GO analysis showed that it is involved in extracellular matrix binding, structural organization, and integrin binding. SPP1 is also involved in promoting lung cancer cell proliferation 14 and inhibiting T cell activation, as well as mediating macrophage polarization associated with lung cancer cell immune escape. 15 It has been suggested that SPP1 is not associated with tumor progression 16 ; however, high expression of SPP1 is involved in the early development and prognosis of LUAD. Giopanou et al 17 generated a mouse model and concluded that SPP1 promotes early tumorigenesis by increasing the survival of KRAS mutant cells. Li et al 18 evaluated the association between SPP1 and its prognostic value, and the results showed that high SPP1 levels predicted poor LUAD survival by univariate Cox analysis (P = .017). Chiou et al 19 proposed that the combination of low expression of FSTL1 and high expression of SPP1 predicted a poor prognosis of lung cancer patients. SPP1 was suggested to serve as a biological marker20 -23 and risk factor 24 for LUAD prognosis. High expression of SPP1 affects the response to treatment in lung cancer. SPP1 increases the resistance to second-generation EGFR TKIs in lung cancer, and inhibition of SPP1 may be a therapeutic target to overcome afatinib resistance. 25 These findings together with the results of the present study suggest that SPP1 may be a key Hub gene for LUAD. SPP1 is also involved in the development of lung fibrosis, as well as in the metastatic invasion of osteosarcoma by affecting macrophage secretion 26 via upregulated expression. 27
To examine the regulatory relationship of SPP1 in ceRNAs, we constructed a ceRNA regulatory network for SPP1. Because the expression data of miRNAs and lncRNAs were insufficient, we chose miRNAs and lncRNAs in the form of online prediction and performed miRNA and lncRNA survival analysis. A large amount of data indicates that SPP1 may be a key central gene in LUAD, and SPP1 may be directly regulated by 4 miRNAs and indirectly regulated by 49 lncRNAs. However, the relationship between miRNA and lncRNA expression in LUAD and their roles was not determined in this study. Additional studies are necessary to clarify this issue.
Conclusions
Analysis of a large amount of data indicates that SPP1 may be a key central gene in LUAD, and SPP1 may be directly regulated by 4 miRNAs and indirectly regulated by 49 lncRNAs.
Footnotes
Author Contribution
Xuan Luo and Lei Feng designed the research study; WenBo Xu analyzed the data; XuJing Bai and MengNa Wu wrote the paper.
Declaration of conflicting interests:
The author(s) declared no potential conflicts of interest with respect to the research, authorship, and/or publication of this article.
Funding:
The author(s) received no financial support for the research, authorship, and/or publication of this article.
Ethical Approval
Because data were obtained from public databases, ethical approval was not necessary for this study.