
Abstract
Introns are highly variable in number and size. Sequence simulation is an effective method to elucidate intron evolution patterns. Previously, we have reported that introns are more likely to evolve through mutation-and-deletion (MD) rather than through mutation-and-insertion (MI). In the present study, we further studied evolution models by allowing insertion in the MD model and by allowing deletion in the MI model at various frequencies. It was found that all deletion-biased models with proper parameter settings could generate sequences with attributes matchable to 16 invertebrate introns from the microphthalmia transcription factor gene, whereas all insertion-biased models with any parameter settings failed to generate such sequences. We conclude that the examined invertebrate introns may have evolved from a longer ancestral sequence in a deletion-biased pattern. The constructed models are useful for studying the evolution of introns from other genes and/or from other taxonomic groups. (C++ scripts of all deletion- and insertion-biased models are available upon request.)
Introduction
The discovery that eukaryotic genes are interrupted by intron sequences is an important milestone of biological research.1-3 Soon after this discovery, the debate about early or late emergence of introns began and continues even today.4-6 The “introns-early” theory states that introns emerged early in ancestral prokaryotes and continuous intron sequence loss is the main event involved in evolution of prokaryotes and eukaryotes.7-10 This theory is supported by existence of intronless or intron-poor genomes in extant organisms.11,12 The “introns-late” theory posits that introns emerged late in ancestral eukaryotes and continuous intron gain is the main event involved in the evolution of eukaryotes.13,14 This theory is supported by the existence of a higher number and size of introns in more complex organisms.15,16 In the past decades, considerable evidence has been found to support the introns-early theory. For instance, ancestral eukaryotic genomes have a much higher intron density than extant eukaryotic genomes,17-21 and intron loss has occurred predominantly during the evolution of eukaryotic lineages.22-26 However, these findings are mainly based on the presence or absence of introns among the surveyed organisms. They constitute sufficient evidence merely for reduction in intron number during the evolution of eukaryotic genomes. For an intron that exists in all surveyed organisms, the reason of an increase in its size according to the complexity of the organism has not been clearly explained. This remains a challenging question against the introns-early theory.
Owing to the high variation of intron sequences, studies on intron size evolution have been confined within relatively small taxonomic groups. This is mainly because homology between intron sequences only exists among organisms that belong to the same order/family. Therefore, studies on intron size variation have been conducted only in a few lineages including fungi, nematodes, fruit flies, pigeons, peas, and a carnivorous plant genus,27-32 in which intron sizes have been found to change in a strong deletion-biased pattern. As no homologous intronic segments are available for examination of the presence or absence of a specific intronic segment, the study of size variation of an intron in organisms belonging to different phyla/classes requires novel approaches, such as sequence simulation. Previously, we have constructed evolutionary models to simulate the evolution of an intron in organisms from 7 classes of chordates. 33 We found that introns in various chordate species could evolve from a longer ancestral sequence through base deletion, and the existence of longer introns in higher organisms could be attributed to a lower efficiency in base deletion. In the present study, the same approach was used to simulate the evolution of an intron from 16 invertebrate species using re-constructed deletion- and insertion-biased evolution models. Testing results from the execution of all re-constructed evolution models suggested that the surveyed invertebrate introns were evolved in a deletion-biased pattern as well.
Materials and Methods
Invertebrate introns and their attributes
In invertebrates, the coding sequence for bHLH (basic helix-loop-helix) motif of the microphthalmia transcription factor (MITF) has a conserved phase 1 intron in the basic region. This intron has 259 to 3104 base pairs (bp) in the 16 species selected to represent different phyla/classes of invertebrates (Table 1). These invertebrate introns are considered to evolve from a common ancestral sequence, because each invertebrate species has only 1 MITF gene and the nucleotides flanking this intron are highly conserved (Figure 1). Therefore, they are eligible targets for this study which focused on simulation of intron evolution from one common ancestral sequence.
Sixteen species selected to represent different phylum/class of invertebrates.


Partial structure of microphthalmia transcription factor (MITF) gene in invertebrate.
The multiple sequence alignment obtained using Muscle program 34 has very few conserved sites among these introns (Supplemental Figure S1), based on which no sequence insertion or deletion can be identified. Accordingly, the phylogenetic tree constructed using MEGA 5.2 software 35 has very low bootstrap values at branching nodes (Figure 2), based on which no clear evolutionary inference can be made. Therefore, sequence simulation was conducted toward these introns by following the method described in our previous report. 33 These 16 invertebrate introns were found to have an LMSA (size of multiple sequence alignment) value of 3434 bp, an RT92+G+I (ratio of transition to transversion under the Tamura 3 parameter model 36 with gamma distribution and invariant sites) value of 1.95, a D̅ (overall mean distance) value of 1.425, an SED̅ (standard error of the overall mean distance) value of 0.119, and a TSML (topology score of the constructed ML tree) of 32.

Phylogenetic tree of 16 invertebrate introns.
Design of evolution models
In our previous report, 33 mutation-and-deletion (MD) and mutation-and-insertion (MI) models were designed to simulate consecutive deletion and consecutive insertion events, respectively. In the present work, we introduced an insertion event in the MD model and a deletion event in the MI model at various frequencies to construct deletion- and insertion-biased models, respectively. For example, the MD90/10 model allows for 90% chances of base deletion and 10% chances of base insertion, while the MI90/10 model allows for 90% chances of base insertion and 10% chances of base deletion. Overall, 6 deletion- and 6 insertion-biased models were constructed. They are designated as MD100, MD90/10, MD80/20, MD70/30, MD60/40, MD55/45, MI100, MI90/10, MI80/20, MI70/30, MI60/40, and MI55/45. All models were constructed using the C++ computational language.
Simulation of intron evolution
Each of the above-mentioned constructed evolution models was first tested using factors and levels designed in accordance with the L16(4*5) orthogonal table (Table 2). For model testing, the phylogenetic tree of the 16 invertebrate introns (Figure 2) was referenced to determine the evolution steps for all 16 sequences intended for generation. Based on statistical analysis of the results of the orthogonal test, further tests were conducted against each model to confirm whether the model-generated sequences had attributes that matched the 16 invertebrate introns. Please refer to our previous report 33 for detailed operational procedures.
Factor and level design for testing evolution models using L16 (4*5) orthogonal table.
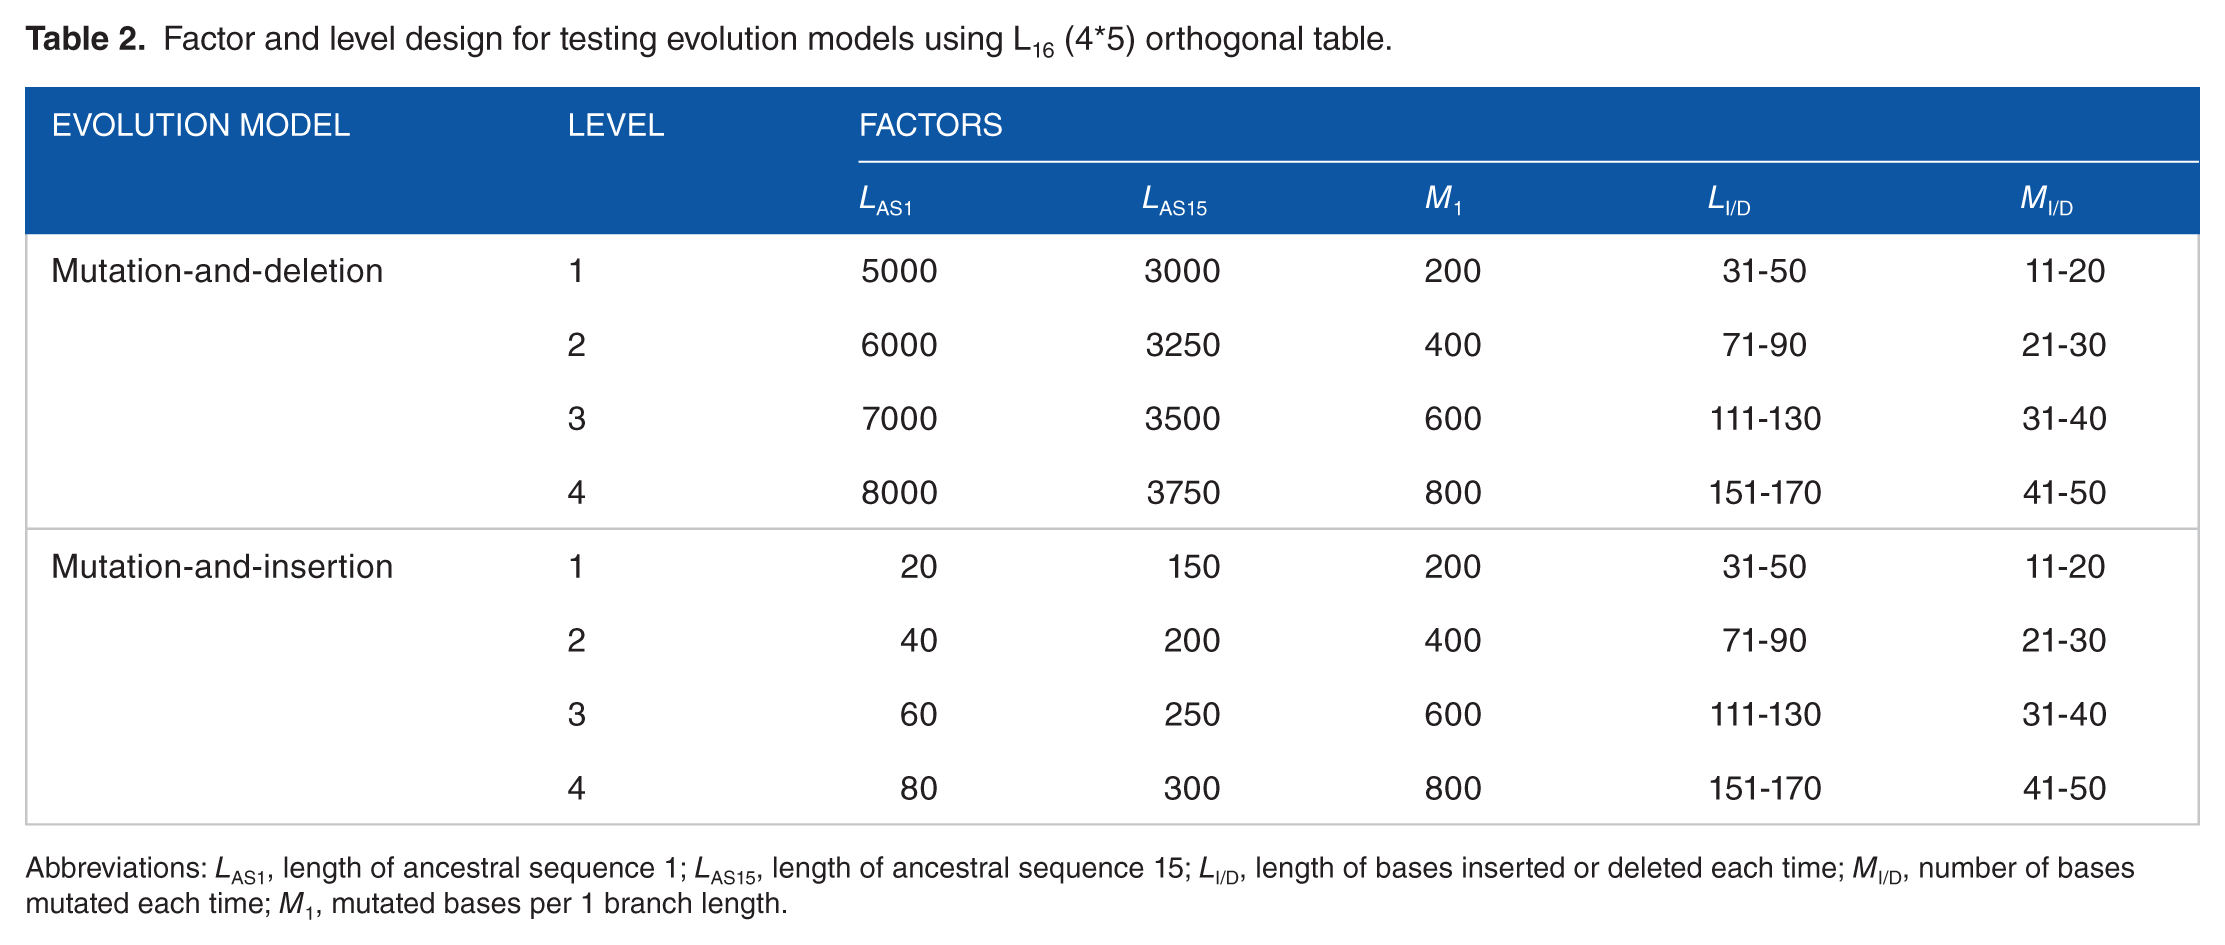
Abbreviations: LAS1, length of ancestral sequence 1; LAS15, length of ancestral sequence 15; LI/D, length of bases inserted or deleted each time; MI/D, number of bases mutated each time; M1, mutated bases per 1 branch length.
R value of the constructed models
The transition to transversion ratio (R) was set to 2.0 in all deletion- and insertion-biased models because the R value of the 16 invertebrate introns was 1.95, as determined by model testing using the MEGA 5.2 software.
Statistical analysis
The SPSS software (version 17.0) was used to perform all statistical analyses as described in our previous report. 33
Results
Testing of deletion-biased models
The orthogonal tests (test nos. 1 to 16) for each deletion-biased model were repeated 10 times to obtain average attribute values of the model-generated sequences. Thereafter, the model parameters were optimized to perform more tests (test nos. 17 to 24) according to the statistical analysis results of the orthogonal test. The results of orthogonal tests for all deletion-biased models are listed in Supplemental Tables S1 to S6. The effects of the model parameters on the attributes of the model-generated sequences are shown in Supplemental Figures S2 to S7, and the results of parameter optimization are listed in Supplemental Tables S7 to S12. By progressively adjusting parameter values, each deletion-biased model generated sequences with attributes that were not significantly different (P > 0.1) with the 16 invertebrate introns (Table 3, upper half). However, the optimal value of a specific parameter varied considerably with the evolution model. For instance, the optimal M1 (mutated bases per 1 branch size) for models with less than 20% insertion frequency was 1200 bp, while that for models with 30%, 40%, and 45% insertion frequencies were 600, 200, and 800 bp, respectively. Additionally, the optimal LI/D (size of bases inserted or deleted each time) for models with less than 30% insertion frequency was below 50 bp, whereas that for models with 40% and 45% insertion frequency was above 111 bp. Although the optimal values for specific parameters were markedly different, a fine-adjusted combination of parameter values could always allow the deletion-biased models to generate sequences with attributes matched to the 16 invertebrate introns (Table 3, upper half). Therefore, we conclude that the surveyed invertebrate introns may have evolved from longer ancestral sequences (e.g., 5000 to 8000 base pairs) in a deletion-biased pattern.
Attributes of sequences generated from MD and MI models using optimized parameters.

Abbreviations: D̅, overall mean distance; LAS1, length of ancestral sequence 1; LAS15, length of ancestral sequence 15; LI/D, length of bases inserted or deleted each time; LMSA, length of multiple sequence alignment; MI/D, number of bases mutated each time; M1, mutated bases per 1 branch length; RT92+G+I, ratio of transition to transversion under Tamura 3 parameter model with gamma distribution and invariant sites; SED̅, standard error of the overall mean distance; SIIs, sixteen invertebrate introns; TSML, topology score of the constructed ML tree.
This table lists the test result of No. 24 for each model. Please refer to Supplemental Tables S7 to S12 and S19 to S24 for test results of No. 17 to 23 of all evolution models. Attributes of SIIs are obtained from allowing each of the sequence to mutate by only one base.
Data are presented as mean ± standard deviation (n = 10).
*, ** and *** indicate significant difference from independent t-test compared to SIIs at P < .1, P < .05 and P < .01 level, respectively.
Testing of insertion-biased models
The orthogonal tests (test nos. 1 to 16) for each insertion-biased model were repeated 10 times to obtain average attribute values of the model-generated sequences. Then, the model parameters were optimized to perform more tests (test nos. 17-24) according to the statistical analysis results of the orthogonal test. The results of orthogonal tests for all insertion-biased models are listed in Supplemental Tables S13 to S18. The effects of the model parameters on the attributes of the model-generated sequences are shown in Supplemental Figures S8 to S13, and the results of parameter optimization are listed in Supplemental Tables S19 to S24. By progressively adjusting parameter values, all insertion-biased models failed to generate sequences with attributes matched to the 16 invertebrate introns. Specifically, D̅ (overall mean distance) of the model-generated sequences was always significantly higher (P < .01) than that of invertebrate introns (Table 3, lower half). In case that our orthogonal tests did not investigate the correlations between factors, the efficiency of parameter optimization might be lowered to some extent. Therefore, apart from the tests listed in Supplemental Tables S19 to S24, additional tests were conducted against each insertion-biased model using different parameter settings. However, all these tests provided negative results. Therefore, we conclude that the surveyed invertebrate introns may not have evolved from a shorter ancestral sequence (e.g., less than 80 base pairs) in an insertion-biased pattern.
Discussion
Owing to a high variability in the number and size of introns, their evolution remains poorly understood. Intron variability results from multiple evolutionary events including intron gain, intron loss, intron slippage, DNA recombination, DNA transposition, and horizontal gene transfer.15,37-40 While reduction in intron number has been observed during genome evolution in many eukaryotic lineages,17-26 reduction of intron size has only been observed during genome evolution of organisms from different families/genera27-32 and from different classes. 33 Our present work extends the study on intron size variation in organisms from different metazoan phyla. Theoretically, the evolution models established in this study can be used to test whether introns from other taxonomic groups evolve in a deletion- or insertion-biased pattern, because the phylogenetic tree formed by introns of interest is only referenced for setting model parameters. While the overall trend of intron evolution is toward the loss of bases (i.e., shortening of introns), a question arises on intron length; why are introns longer in higher organisms compared to those in lower organisms? In our opinion, this is because lower organisms are more efficient in shortening introns. This is possible because, in general, lower organisms are reproduced more frequently than higher organisms; thus, they have more opportunities for genome reorganization.41,42 However, further investigations are needed to compare the intron-shortening efficiency between lower and higher organisms.
While deletion-biased patterns are followed by intron evolution in certain eukaryotic lineages, the ratio of deletion to insertion may vary considerably among different organisms. It is 3- and 6-fold higher among nematode and avian species, respectively.28,30 It ranges from 1.2 to 9.0 in all deletion-biased models of the present study. Since all these models are proficient in simulating the evolution of the 16 invertebrate introns, we suggest that the intron deletion efficiency may be remarkably different among these invertebrate species. However, such differences can also result from certain inadequacies in designing evolution models. After examining our model designs, we conclude that they can be improved in 2 aspects. First, we may consider the effect of insertion/deletion on the phyletic clade formation of each intron. Second, we may use different sizes for stepwise insertion/deletion in simulation of the evolution of each intron. It is anticipated that the newly designed models will narrow the range of deletion to insertion bias to simulate the evolution of these invertebrate introns.
The deletion-biased evolution leads to the shortening of an intron but does not lead to its removal. It is advantageous in retaining functional introns and improving gene expression efficiency. Retention of a long intron lowers gene expression efficiency because it consumes substantial energy in both transcription and post-transcriptional processes. However, intron removal may lead to loss of important functional elements because an intron may be able to stimulate gene expression, regulate protein isoform formation, maintain RNA stability, or improve translation efficiency.43-46 Therefore, in cases where an intron has an important regulatory function, 47 its shortening would be preferable compared to its complete removal. This probably explains the reason of maintenance of many introns in certain genes.
Footnotes
Funding:
The author(s) disclosed receipt of the following financial support for the research, authorship, and/or publication of this article: This study was supported by the National Natural Science Foundation of China (Nos. 31872425 and 31861143051).
Declaration of conflicting interests:
The author(s) declared no potential conflicts of interest with respect to the research, authorship, and/or publication of this article.
Author Contributions
J-MM and LY performed the analysis. J-MM and YW wrote the manuscript with input from all authors. YW designed and constructed the models. YW, QY, and K-PC proposed and conceived the study. All authors approved the final version of the manuscript.
Supplemental Material
Supplemental material for this article is available online.
References
Supplementary Material
Please find the following supplemental material available below.
For Open Access articles published under a Creative Commons License, all supplemental material carries the same license as the article it is associated with.
For non-Open Access articles published, all supplemental material carries a non-exclusive license, and permission requests for re-use of supplemental material or any part of supplemental material shall be sent directly to the copyright owner as specified in the copyright notice associated with the article.