
Abstract
Protein domains can be regarded as sections of protein sequences capable of folding independently and performing specific functions. In addition to amino-acid level changes, protein sequences can also evolve through domain shuffling events such as domain insertion, deletion, or duplication. The evolution of protein domains can be studied by tracking domain changes in a selected set of species with known phylogenetic relationships. Here, we conduct such an analysis by defining domains as “features” or “descriptors,” and considering the species (target + outgroup) as instances or data-points in a data matrix. We then look for features (domains) that are significantly different between the target species and the outgroup species. We study the domain changes in 2 large, distinct groups of plant species: legumes (Fabaceae) and grasses (Poaceae), with respect to selected outgroup species. We evaluate 4 types of domain feature matrices: domain content, domain duplication, domain abundance, and domain versatility. The 4 types of domain feature matrices attempt to capture different aspects of domain changes through which the protein sequences may evolve—that is, via gain or loss of domains, increase or decrease in the copy number of domains along the sequences, expansion or contraction of domains, or through changes in the number of adjacent domain partners. All the feature matrices were analyzed using feature selection techniques and statistical tests to select protein domains that have significant different feature values in legumes and grasses. We report the biological functions of the top selected domains from the analysis of all the feature matrices. In addition, we also perform domain-centric gene ontology (dcGO) enrichment analysis on all selected domains from all 4 feature matrices to study the gene ontology terms associated with the significantly evolving domains in legumes and grasses. Domain content analysis revealed a striking loss of protein domains from the Fanconi anemia (FA) pathway, the pathway responsible for the repair of interstrand DNA crosslinks. The abundance analysis of domains found in legumes revealed an increase in glutathione synthase enzyme, an antioxidant required from nitrogen fixation, and a decrease in xanthine oxidizing enzymes, a phenomenon confirmed by previous studies. In grasses, the abundance analysis showed increases in domains related to gene silencing which could be due to polyploidy or due to enhanced response to viral infection. We provide a docker container that can be used to perform this analysis workflow on any user-defined sets of species, available at https://cloud.docker.com/u/akshayayadav/repository/docker/akshayayadav/protein-domain-evolution-project.
Keywords
Introduction
Protein domains are independent evolutionary units of proteins that enable proteins to evolve in a modular fashion through domain insertion, deletion, duplication, or substitution, in addition to evolution through point mutations.1,2 In this ability of protein domains to fold and function independently of other domains, they can be considered as “lego bricks” that can be recombined in various ways to build new proteins.3,4 Small proteins are usually made up of just one domain, whereas large proteins are formed by combinations of multiple domains. 5 Roughly two-thirds of the prokaryotic proteins and four-fifths of the eukaryotic proteins are multidomain proteins that are formed through recombination of 2 or more domains.6,7 The “combinability” of domains makes them prime candidates for studying evolution—both of proteins and species. For example, protein domains have been used to study evolution on genome-wide and species-wide scales by examining the protein-domain content of the species.8-10 Protein-domain content is defined by the presence or absence of protein domains in complete genomes of the species. The importance of protein domains in studying evolution can be verified from the ability of protein-domain content in reconstructing the phylogeny of life, in comparison to trees obtained from standard phylogenetic and phylogenomic approaches that utilize information from molecular markers, gene content, and gene order. 10
In this study, we examine the domain combinations present in 2 groups of plant species—the legumes (Fabaceae) and grasses (Poaceae), treating the protein domains as species “features” that may be present or absent in the focal species. Accordingly, a data matrix was defined with rows representing species, columns representing the protein domains, and the cells containing domain feature values for the respective species. We used standard feature selection and statistical testing techniques to identify protein domains that differ between the target set of species and their respective outgroups.
Gain or loss of particular domains in a group of species can provide a means of understanding trait evolution in those species.11,12 Protein domains can duplicate locally, giving significantly different counts of certain domains. This may provide some useful information about functions associated with those domains.13,14 Counts of protein domains can also increase or decrease along with the proteins that they comprise. 15 Finally, “versatile” domains can partner with multiple different domains; and versatility values can be used to study the evolution of associated functions.3,16,17 We evaluated domain evolution using these types of domain feature matrices: domain content, duplication, abundance, and versatility.
We used 2 types of statistical methods: mutual-information (MI) and nonparametric statistical tests. MI measures mutual dependence between 2 random variables by quantifying the amount of information communicated about one random variable from another random variable. 18 MI has been routinely used for selecting meaningful features, in classification and pattern recognition problems.19-21 Here, we used MI to quantify the mutual dependence between domain feature values and the classification between target and outgroup species. We also employed tests for significance of differences in domain feature values between the target and outgroup species. We applied Fisher’s exact tests 22 for feature matrices containing discrete values, and Wilcoxon rank-sum tests 23 for feature matrices containing continuous values.
Material and Methods
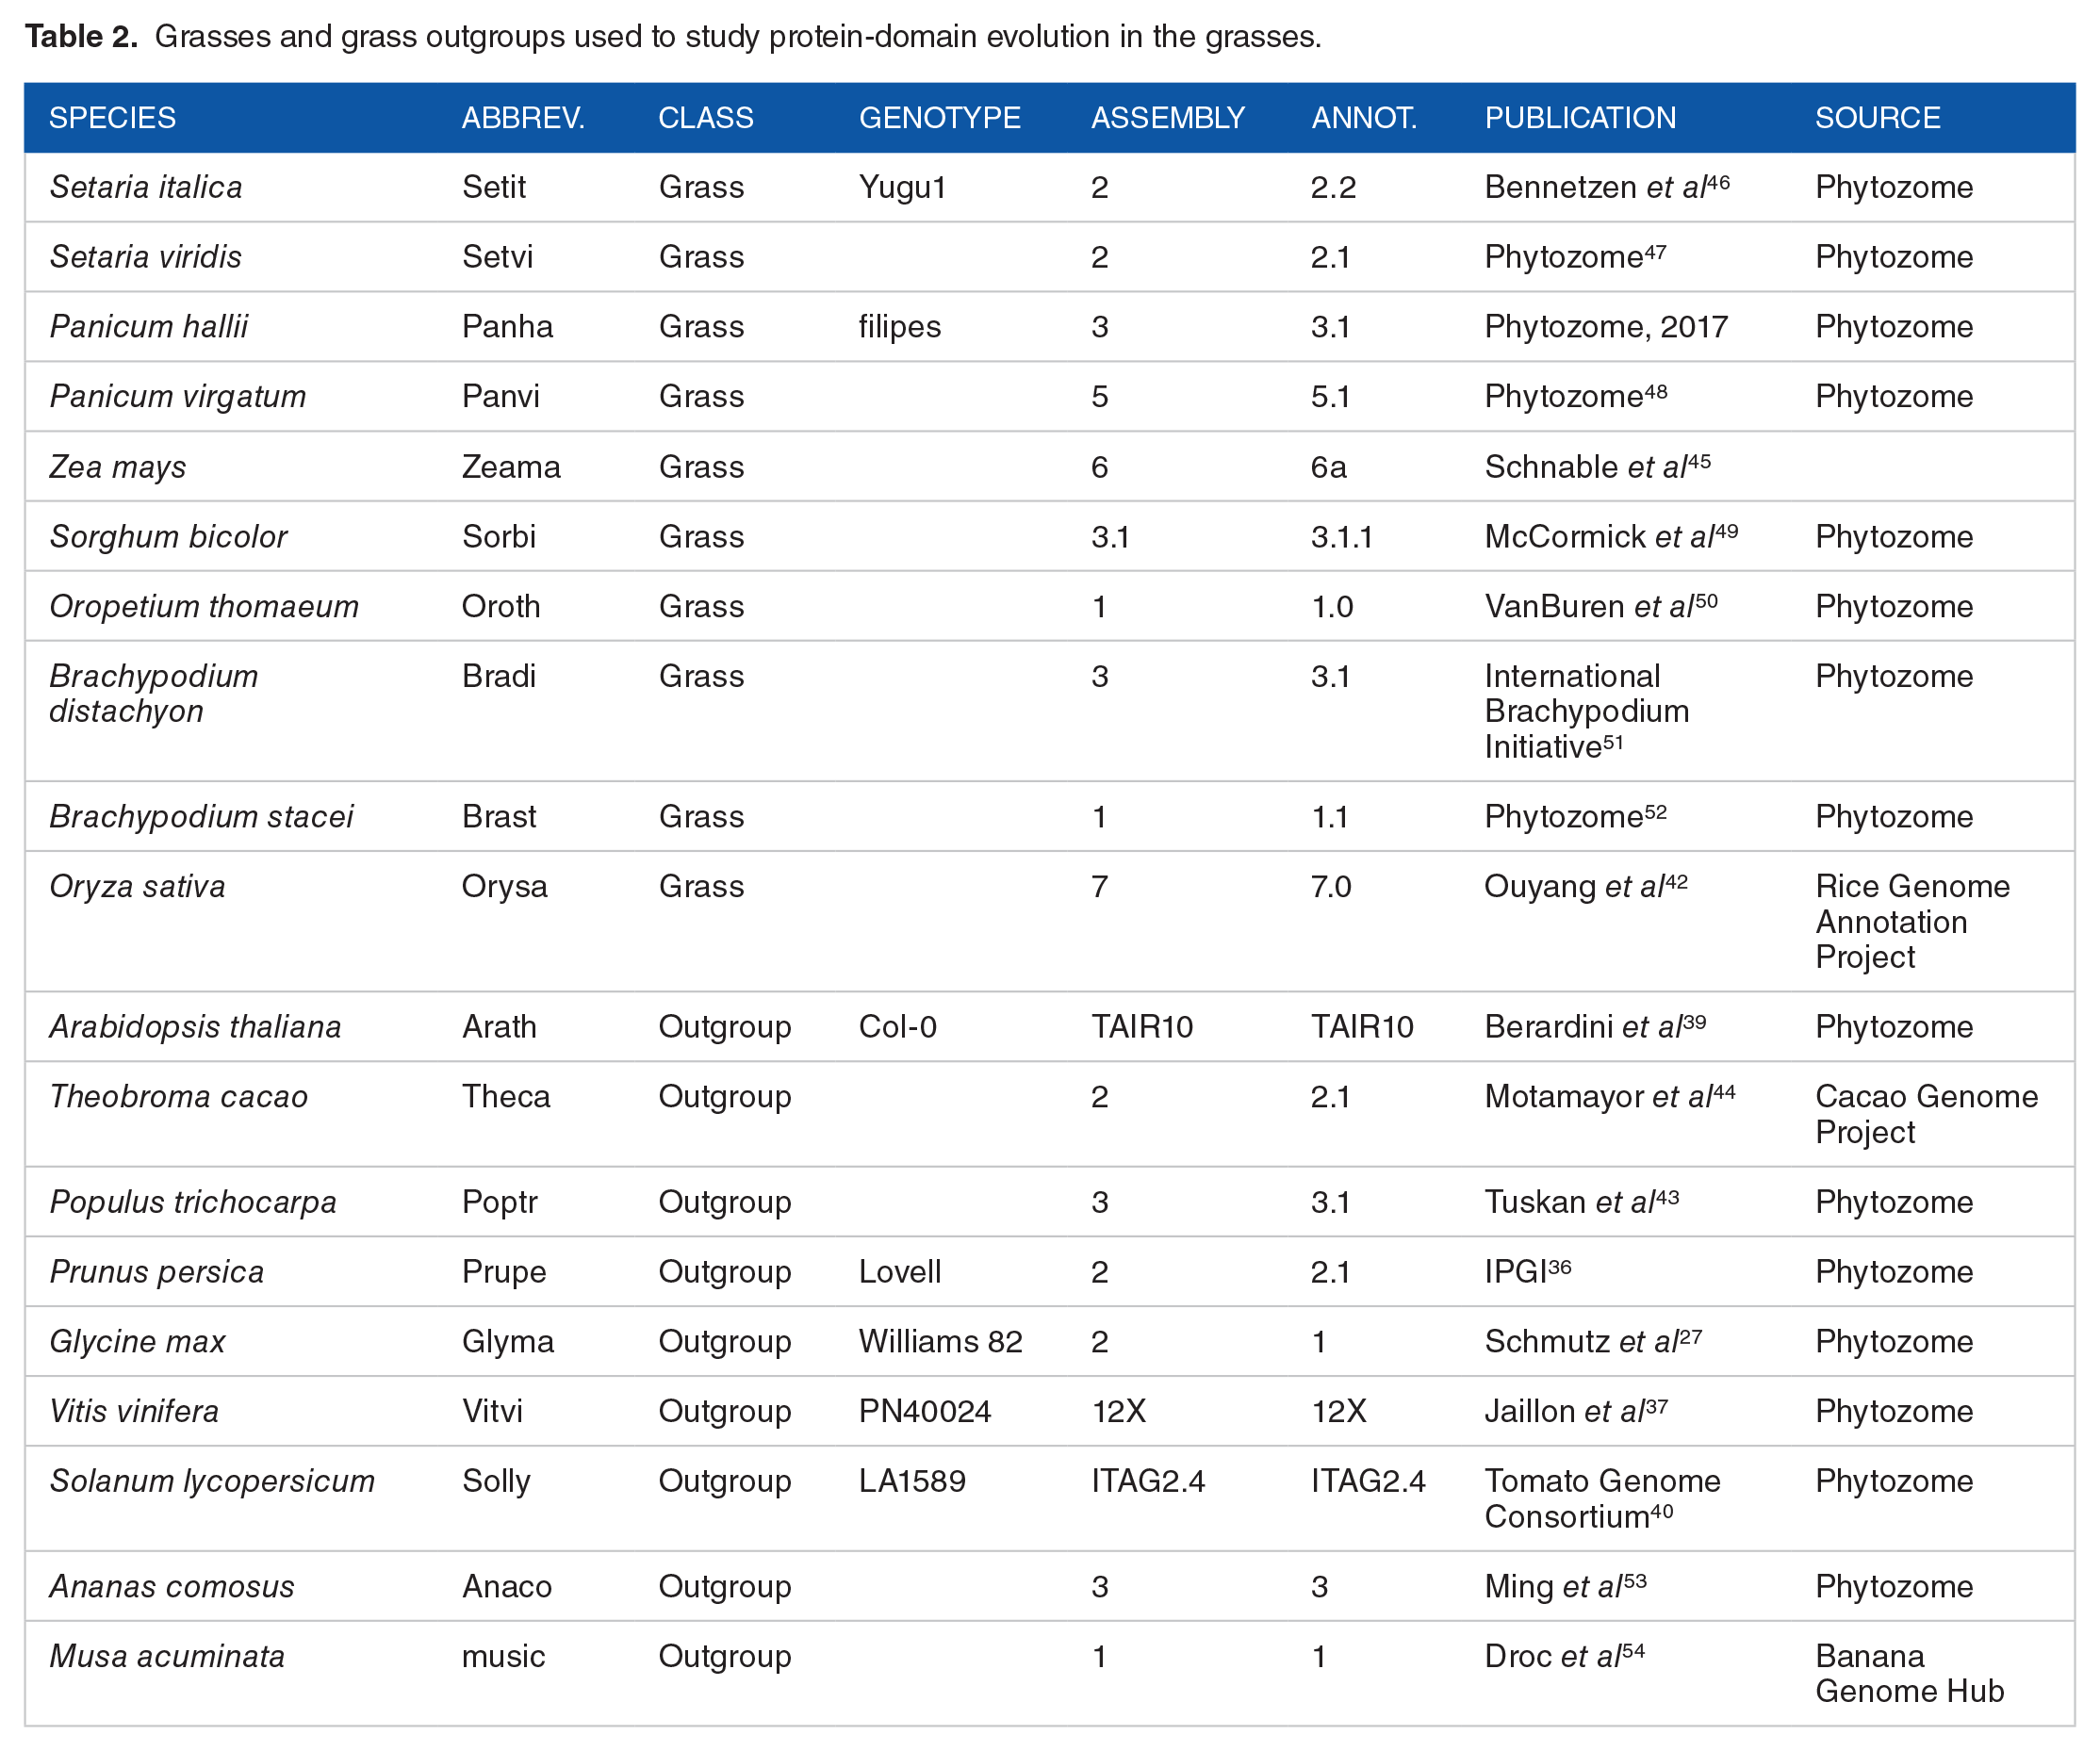
We used 2 sets of plant species to study the species-level changes in protein-domain characteristics for a given set of target species (Figures 1 and 2). The first set consisted of 14 legumes (from the Papilionoideae subfamily within the legume/Fabaceae family), and 10 outgroup species defined concerning the legumes (Table 1).24-45 The second set consisted of 10 grass species (Poaceae) and 9 outgroup species defined concerning the grasses (Table 2).27,36,37,39,40,42-54

Phylogeny of legumes with legume outgroups (left) and table (right) showing the 4 types of domain changes analyzed in this study using example domains mentioned in the second row of the table.

Phylogeny of grasses with grass outgroups (left) and table (right) showing the 4 types of domain changes analyzed in this study using example domains mentioned in the second row of the table.
Legumes and legume outgroups used to study protein-domain evolution in the legumes.

Grasses and grass outgroups used to study protein-domain evolution in the grasses.
All target proteomes from legumes and grasses, together with their respective outgroup proteomes, were searched against domain Hidden Markov Models (HMMs) from the Pfam database (release 32) 55 to assign domains to the protein sequences. The pfam_scan.pl script 56 was used to assign domains to proteomes, which internally uses the hmmscan program from the HMMER package. 57 Subsequently, the domain assignments from target proteomes and their respective outgroup proteomes were used to calculate the 4 types of domain feature matrices.
Calculation of domain feature matrices
The domain content matrix was calculated to represent the presence or absence of domains in target and outgroup species. Columns of the content matrix represent individual Pfam domains and rows represent species. Each cell was assigned a value of “1” if the corresponding domain was detected in the species, else the cell was a value of “0.” Columns with domains that were present in all the target and outgroup species were uninformative and therefore removed.
The domain duplication matrix contains the most frequent copy number of each Pfam domain in species, which was calculated as the modal value of list all possible copy counts of that domain in the corresponding species. The modal value of the list was added to each domain column and corresponding species row. Columns with constant duplication values across all the species (target + outgroup) were removed from the matrix. Also, columns with domain duplication values ⩽1 across all the rows were removed.
The domain abundance matrix was built to represent the abundance value of protein domains in target and outgroup species. Here, we define the abundance value of each domain in each species as the proportion of protein sequences from the entire proteome that contains the domain. The abundance value of each domain in each species is calculated using the inverse domain frequency (IDF) function (equation 1) which is inspired by the inverse document frequency function used in text mining and natural language processing (NLP) applications

where N(S) is the total number of proteins in species “S” and N(S, d) is the number of proteins containing domain “d” in species “S”
The domain versatility matrix was calculated to represent the changes in the versatility values of the domains across the species. Versatility value (equation 2) for a given domain and species combination was calculated as the reciprocal of the number of domains immediately adjacent to the given domain in protein sequences in the corresponding species. Here too, the columns with constant versatility values across all species (target + outgroup) were removed from the matrix

where F(S, d) is the number of different domains adjacent to domain “d” in species “S”
Finally, an additional “species label” column containing value “1” for target species and “0” for outgroup species was attached to all 4 domain feature matrices to represent the classification between target and outgroup species.
Statistical analysis of domain feature matrices
We applied 2 types of statistical analyses to the domain feature matrices. The MI function (equation 3) was used to calculate the MI score for each domain feature by comparing it against the species label column. The MI quantity measures how much information, on average, is communicated in the domain feature column about the classification between target and outgroup species (species label column). Feature columns of the duplication and abundance matrices were subjected to “L2” normalization before application of MI scoring. The L2 normalization technique modifies the column values such that in each column, the sum of the squares will always have a maximum value of 1

We also tested feature columns for significance, calculating P values to measure the difference in domain feature values between target and outgroup species. We used Fisher’s exact test to evaluate feature columns from the duplication and versatility matrices. Fisher’s exact test was applied to contingency tables built using the discrete values from each domain column and the species labels. The dimensions of the contingency tables, in case of the content matrix, were always 2 × 2 because each domain column can have only 2 possible values for each species row—whereas, in case of duplication and versatility matrices, the dimensions were r × 2, where “r” is the number of discrete values observed in the corresponding domain column. The Wilcoxon rank-sum test was applied for significance testing of the domain abundance matrix due to the continuous values of the domain features. The P values obtained for domains were corrected for multiple testing using the false discovery rate (FDR) method. 58 The FDR-adjusted P values were reported for the domains.
Results
All 4 types of domain feature matrices were calculated for 2 sets of plants—the first containing 14 legume and 10 outgroup species, and the second containing 10 grass and 9 outgroup species. For all feature matrices, we applied MI scoring and significance testing.
Domain content analysis
In legumes and grasses, 13 and 55 domains, respectively, showed significant presence/absence differences relative to their respective outgroups. The results show a loss of 12 domains and gain of the SHNi-TPR domain in legumes and loss of 33 domains and gain of 22 domains in grasses. The Pfam domains showing the most significant gain or loss in legumes and grasses are listed in Tables 3 and 4. The gained SHNi-TPR domain in the legumes contains an interrupted form of the TPR repeat. The SHNi-TPR family includes proteins such as Sim3 (yeast), NASP(Human) and N1/N2(Xenopus), which are responsible for delivering histone proteins such as H3 to centromeric chromatin. 59 Most of the missing domains in legumes are parts of multidomain proteins found in the Fanconi anemia (FA) pathway. The FA pathway is responsible for maintaining chromosomal stability through the repair of interstrand DNA crosslinks in a replication-dependent manner. 60 Most of the proteins in the FA pathway form a core complex known as the FA core complex which is responsible for the ubiquitination of FANCD2 and FANCI proteins. 61 Both the proteins are then localized to the site of DNA repair along with few other proteins. The FANCI is a multidomain protein made up of 5 domains: FANCI_S2, FANCI_S1, FANCI_HD1, FANCI_HD2, and FANCI_S4. All the 5 FANCI domains are missing in legumes, which means that the entire FANCI protein is lost in legumes. In addition, FANCD2-binding FA_FANCE domain 62 and the C-terminal domain of FANCL protein (FANCL_C domain) are also missing in legumes. The missing WD-3 domain belongs to the family of WD-repeats region, which is approximately 100 residues long and is contained within the FANCL protein, the putative E3 ubiquitin ligase subunit of the FA core complex (p. 40). 63 The only protein involved in the FA pathway that is present in legumes is the single domain FANCD2 nuclease containing the FancD2 domain. 64 In addition to the domains from the FA pathway, the thiopurine-S-methyltransferase (TPMT) domain was also detected as lost from the legumes. This is a cytosolic enzyme involved the catalysis of S-methylation of aromatic and heterocyclic sulfhydryl compounds, such as anticancer and immunosuppressive thiopurines. 65
Domains gained or lost in legumes concerning legume outgroups (top 11 by MI score).

Abbreviations: MI, mutual information; FDR, false discovery rate.
Domains gained or lost in grasses concerning grass outgroups (top 10 by MI score).

Abbreviations: MI, mutual information; FDR, false discovery rate.
Among the top 10 protein domains in grasses, 6 were detected as gained and 4 were detected as lost concerning the grass outgroups. There were 3 domains with unknown functions—DUF1618, DUF1719, DUF1110, and 3 domains with known functions—P_C, Glutenin_hmw, MFS18, that were detected as present in grasses. The P_C domain is present at the C terminus of plant P proteins. The P proteins in maize act as transcriptional regulators of enzymes involved in a red phlobaphene pigment-producing arm of the flavonoid biosynthesis pathway.66,67 The domain Glutenin_hmw is the high molecular subunit of glutenin protein responsible for the elastic properties of gluten. The elastomeric glutenin proteins form a network that can withstand significant deformations without breaking, and return to the original conformation when the stress is removed—the property important for making dough. 68 The male flower specific protein 18 (MFS18) domain found in the MFS18 protein in maize is rich in glycine, proline, and serine. The MFS18 mRNA is found to accumulate in a vascular bundle in the glumes, anther walls, paleas, and lemmas of mature florets. 69
The 4 domains Mur_ligase, SEO_N, SEO_C, and ACCA, were among the top 10 domains detected as lost in most grasses concerning the selected outgroups. The Mur_ligase domain is the catalytic domain found in the Mur ligase family of enzymes that catalyze the successive steps in the synthesis of peptidoglycan. 70 The SEO_N and SEO_C in domains are respectively found at the N and C terminus of sieve element occlusion (SEO) proteins also known as phloem proteins or forisomes. These phloem proteins remain associated with cisternae of the endoplasmic reticulum of the sieve elements after differentiation and provide rapid protection against wounding of sieve tubes by forming a gel-like mass. 71 The ACCA domain is the alpha isoform of the carboxyltransferase subunit of Acetyl Co-A carboxylase enzyme. The ACCA domain is known to play an important role in the production of Malonyl-CoA in fatty acid synthesis. 72
Domain duplication analysis
Application of MI-scoring and Fisher’s exact tests on domain features of duplication matrices revealed a single domain (of unknown function) in legumes and 8 types of domains in grasses that were significantly different (FDR ⩽ 0.05) in their copy numbers as compared to the copy numbers observed in their respective outgroup sets. The domain DUF812 is present in 1 copy in all legume sequences except Medicago, and in 2 copies in all outgroups except rice and maize (MI score = 0.519444; FDR = 0.000993). Among the 8 significantly different domains in grasses (Table 5), 4 of the domains have increased in copy numbers and 4 have decreased in copy numbers. The domains DUF775, SPX, zf-PARP, and FANCF are present in 2 copies in most grass sequences and 1 copy in most outgroup sequences. The SPX domain is a 180 residue-long protein domain found at the N-terminus of a family of proteins involved in G-protein-associated signal transduction.73-75 The zf-PARP domain resides at the amino-terminal region of Poly (ADP-ribose) polymerase protein, which is an important regulatory component in the cellular response to DNA damage. This domain is known to act as a DNA nick sensor. 76 The FANCF domain is present in the FA group F protein involved in FA DNA repair pathway. Inactivation of the FANCF protein induced by methylation may play an important role in the occurrence of ovarian cancers. 77
Domains with significant differences in copy numbers between grasses and grass outgroups (top 10 by MI score).
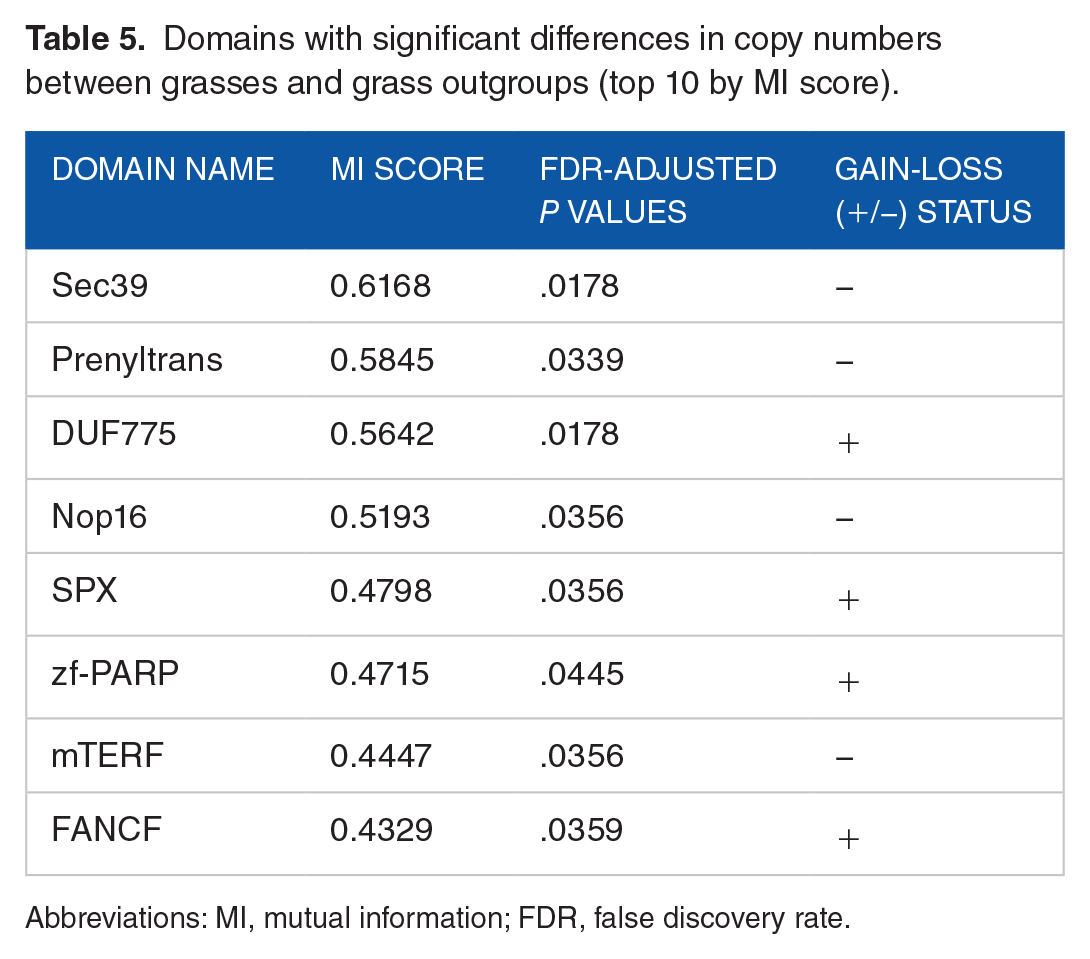
Abbreviations: MI, mutual information; FDR, false discovery rate.
The domains Sec39, Prenyltrans, Nop16, and mTERF show a decrease in copy numbers, with 2, 2, 3 to 5, and 2 copies in most of the outgroup species and 1, 1, 1 to 3 and 1 copies, respectively, in most grasses. The Sec39 domain is a part of “secretory pathway protein 39,” which is involved in ER-Golgi transport.78,79 The Prenyltrans domain-containing enzymes are responsible for the transfer of allylic prenyl groups to acceptor molecules.80,81 The Nop16 domain is part of a protein involved in ribosome biogenesis. 82 The mTERF protein domain is a part of the “mitochondrial transcription termination factor” (mTERF) protein, containing 3 leucine zipper motifs, and known to bind to the DNA. 83
Domain abundance analysis
The analysis of domain abundance matrices revealed 111 domains in legumes and 497 domains in grasses that have expanded or contracted significantly (FDR ⩽ 0.05), as compared to their respective outgroup sets. In the legumes relative to outgroups, 51 domains have expanded significantly in abundance and 60 domains have contracted. In the grasses, 196 domains have expanded significantly in abundance and 301 domains have contracted. The top 10 significantly expanded or contracted domains in legumes and grasses are listed in Tables 6 and 7.
Domains with significant differences in abundance values between legumes and legume outgroups (top 10 by MI score).

Abbreviations: MI, mutual information; FDR, false discovery rate.
Domains with significant difference in abundance values between grasses and grass outgroups (top 11 by MI score).

Abbreviations: MI, mutual information; FDR, false discovery rate.
Among the top 10 domains showing expansions or contractions in abundance in the legumes, the ThylakoidFormat, GST_C_6, DUF726, FERM_M, DAO_C, Aa_trans, and SURNod19 domains have expanded, and the Tmemb_14, DUF724, and DUF563 domains have contracted. The thylakoid formation protein (ThylakoidFormat) domain is present in the outer plastid membrane and the stroma. This protein is known to have roles in sugar signaling, chloroplast and leaf development, and vesicle-mediated thylakoid membrane biogenesis. 84 The C-terminal domain of Glutathione-S-transferase (GST_C_6) is known to conjugate reduced glutathione to auxin-regulated proteins in plants. 85 The FERM_M domain is the middle domain of FERM protein and is involved in localizing proteins from cytosol to plasma membrane. 86 The DAO_C domain is present at the C-terminal region of alpha-glycerophosphate oxidase enzyme. The transmembrane region of amino-acid transporter protein (Aa_trans) is found in many amino-acid transporters like the amino-butyric acid (GABA) transporter. 87
The Tmemb_14 domain is the only one among the 10 domains in Table 6 to have contracted in legumes. This domain belongs to a family of uncharacterized short transmembrane proteins.
Among the top 11 domains in grasses to have expanded or contracted in abundance relative to outgroups, only 3 have expanded—specifically, sequences containing the E1_FCCH, TruD, and Peptidase_C12 domains have increased in abundance the grasses. The E1_FCCH domain is found in the E1 family of ubiquitin-activating enzymes, 88 which is involved in protein degradation cascades. The tRNA-pseudouridine synthase D (TruD) protein is involved in the synthesis of pseudouridine from uracil-13 in transfer RNAs. The Peptidase_C12 domain, also known as a Ubiquitin C-terminal hydrolase, is a deubiquitination enzyme involved in hydrolysis of adducts from the C-terminus of ubiquitin. 89
Sequences containing the Kelch_6, NT-C2, HD-ZIP_N, DUF1442, TK, SNARE, Pec_lyase_C, and Pectinesterase domains have decreased in proportion in grasses. The Kelch (Kelch_6) motif contains about 50 amino acids and is found in a variety of proteins with diverse functions including functions related to actin dynamics and cell adhesion. 90 The N-terminal C2 (NT-C2) domain is found in plant proteins involved in the regulation of rhizobium-directed polar growth and intracellular movement of chloroplasts in response to blue light. 91 The HD-ZIP_N domain is present at the N-terminal of plant homeobox-leucine zipper protein which is known to regulate interfascicular fiber differentiation in Arabidopsis. 92 The thymidine kinase (TK) domain is a phosphotransferase enzyme (EC 2.7.1.21) that catalyzes the transfer of a single phosphate group from adenosine triphosphate (ATP) to thymidine and is required for DNA synthesis in cell division. The SNARE domain acts as a module for protein-protein interaction in the assembly of SNARE machinery, which in turn mediates membrane fusion events in eukaryotic cells. 93 The Pec_lyase_C domain is a part of the Pectate Lyase enzyme (EC 4.2.2.2), which is known to be involved in maceration and soft rotting of plant tissue and pectin degradation during pollen tube growth.94,95 The Pectinesterase domain is a cell-wall-associated enzyme (EC 3.1.1.11) involved in cell-wall modification and breakdown. 96
Domain versatility analysis
The analysis of domain versatility matrices revealed a single domain in legumes and 12 domains (Table 8) in grasses with significantly increased or decreased versatility values with respect to their outgroup sets. In legumes, the zf-UDP domain co-occurs with 2 to 4 different domains but partners with only one other domain in all outgroup species except maize (FDR-adjusted P value = .0019). The zf-UDP domain is a RING/U-box type zinc-binding domain frequently found in the catalytic subunit of cellulose synthase enzyme (EC: 2.4.1.12). This enzyme catalyzes the addition of glucose to the growing cellulose from UDP-glucose.
Domains with significant differences in versatility values between grasses and grass outgroups.

Abbreviations: MI, mutual information; FDR, false discovery rate.
The CG-1, Jacalin, and zf-CCHC domains have all gained additional domain partners in grasses as compared to their outgroups. The most prominent of the 3, the CG-1 domain, co-occurs with 2 domains in outgroups but partners with 3 to 4 domains in grasses. Similarly, Jacalin and zf-CCHC domains also have gained 2 to 5 additional domain partners in grasses. The CG-1 domains are highly conserved, 130 amino acid long DNA-binding protein domains associated with light signal transduction 97 and calmodulin-binding transcriptional activators containing ankyrin motifs. 98 The Jacalin domain is a mannose-binding lectin domain with a beta-prism fold. 99 The zinc knuckle (zf-CCHC) domain is a zinc-binding motif composed of the CX2CX4HX4C motif (where X can be any amino acid).
Among the protein domains that have lost domain partners in grasses as compared to the outgroups, the Mur_ligase_M domain has the highest MI score value. This is the middle domain found adjacent to the N-terminal Mur_ligase domain in grass outgroups but has lost the N-terminal partner in grasses (as found in the domain content analysis). The zf-met, DOMON, WRC, and RPN13_C domains also have lost, respectively, 2 to 3, 1 to 3, 1 to 2, and 2 to 3 adjacent domain partners in grasses. The zf-met domain is another zinc-finger domain, containing the CxxCx(12)Hx(6)H motif, and is associated with RNA binding. The DOMON domain is 110 to 125 residues long and is found in heme- and sugar-binding proteins. 100 The WRC domain is known for containing the conserved Trp-Arg-Cys motif, along with a putative nuclear localization signal and a zinc-finger motif with involvement in DNA binding. The RPN13_C domain is an all-helical C-terminal domain that forms a binding surface for ubiquitin-receptor proteins for deubiquitination.101,102
Domain-centric gene ontology enrichment analysis
To check if the significantly evolving domains (FDR ⩽ 0.05), selected from an analysis of feature matrices, map to any particular gene ontology (GO) terms, we used “dcGO,” the domain-centric ontology database that provides associations between GO terms and protein domains from Pfam. 103 The GO enrichment analysis was performed on domain lists obtained from the content, duplication, abundance, and versatility matrices from both the species sets, to check for significantly enriched GO terms from the 3 GO subontologies: biological process (BP), cellular component (CC), and molecular function (MF).
GO enrichment analysis was performed for the 13 domains from legumes and 55 domains from grasses, that were identified from the analysis of content matrices. Separate enrichment analyses were performed for domains that were detected as gained in target species and domains that were detected as lost in the target species. No GO term enrichment was found for the single SHNi-TPR domain that was gained in legumes concerning the legume outgroups. However, for the 12 domains that seem to have been lost in legumes, weak enrichment (Z score = 2.86, FDR = 1.93e−02) was observed for the highly general CC term “nuclear lumen” (GO:0031981). In grasses, weak enrichment for 3 highly general BP terms was found (Table 9) for the 22 domains that seem to be gained concerning the grass outgroup. Again, no GO term enrichments were found for the 33 domains that were detected as lost in grasses concerning their outgroups.
Enriched GO terms from protein domains that were detected as gained in grasses as compared to grass outgroups.

Abbreviation: FDR, false discovery rate.
As a single domain of unknown function (DUF812) was detected as significantly different in terms of copy number in legumes versus legume outgroups, from the analysis of domain duplication matrices, no enrichment of GO terms was observed in legumes. Similarly, in grasses, the 4 protein domains that show an increase in copy numbers and 4 domains that show a decrease in copy numbers did not contain any enriched GO categories.
In domain-centric GO analyses of domains showing significant increase in abundance values, in legumes, enrichment of 3 BP terms and 5 CC terms (Table 10) was found. There is enrichment in biological metabolic processes involving glycosyl compounds (GO:1901659, FDR = 4.80e−03), ribonucleosides (GO:0009119, FDR = 1.39e−02), and isoprenoids (GO:0008299, FDR = 1.39e−02), with involvement in organelle membranes (GO:0098805, FDR = 1.27e−03).
Enriched GO terms from protein domains that show significant increase in abundance values in legumes as compared to legume outgroups.

Abbreviation: FDR, false discovery rate.
GO analyses of domains that showed significant decrease in abundance values between legumes and legume outgroups found enrichment of 10 BP terms and 11 MF terms (Table 11). Among the BP terms, strongest enrichment was found for purine nucleobase metabolic process (GO:0006144, FDR = 9.85e−07) and hydrogen peroxide metabolic process (GO:0042743, FDR = 1.25e−03). Among the MF terms, very strong enrichment was observed for specific MF terms such as xanthine dehydrogenase activity (GO:0004854, FDR = 8.10e−10), oxidoreductase activity, acting on CH or CH2 groups, oxygen as acceptor (GO:0016727, FDR = 8.10e−10), oxidoreductase activity, acting on the aldehyde or oxo group of donors, oxygen as acceptor (GO:0016623, FDR = 8.10e−10), molybdopterin cofactor binding (GO:0043546, FDR = 8.10e−10) and 2 iron, 2 sulfur cluster binding (GO:0051537, 8.25e−08).
Enriched GO terms from protein domains that show significant decrease in abundance values in legumes as compared to legume outgroups.

Abbreviation: FDR, false discovery rate.
In grasses, GO enrichments of 16 BP, 5 CC, and 4 MF terms were found for domains that showed significant increase in abundance values in comparison to the abundance values in grass outgroups (Table 12). Strongest enrichment was observed for specific BP term chromatin silencing (GO:0006342, FDR = 2.02e−05) with relatively moderate enrichments for BPs including protein unfolding (GO:0043335, FDR = 4.26e−03), negative regulation of translational initiation (GO:0045947, FDR = 4.12e−03), positive regulation of nuclear-transcribed mRNA poly(A) tail shortening (GO:0060213, FDR = 4.26e−03), miRNA-mediated inhibition of translation (GO:0035278, FDR = 5.63e−03), small RNA loading onto RISC (GO:0070922, FDR = 5.87e−03), production of siRNA involved in RNA interference (GO:0030422, 7.51e−03), mRNA cleavage (GO:0006379, FDR = 7.51e−03) and pre-miRNA processing (GO:0031054, FDR = 7.51e−03). Enrichments in the CC terms correlated with the BP terms, with general and specific CCs like polysome (GO:0005844, FDR = 8.05e−03), RNAi effector complex (GO:0031332, FDR = 2.93e−03), microribonucleoprotein complex (GO:0035068, FDR = 2.93e−03), RISC-loading complex (GO:0070578, FDR = 2.93e−03) and mRNA cap-binding complex (GO:0005845, FDR = 3.23e−03) showing moderate enrichments. In addition to BP and CC terms, enrichment for specific MF terms such as endoribonuclease activity, cleaving siRNA-paired mRNA (GO:0070551, FDR = 2.06e−04), diphosphotransferase activity (GO:0016778, 3.14e−04) and RNA 7-methylguanosine cap binding (GO:0000340, FDR = 8.12e−04) was found, with strongest enrichment observed for MF involving ubiquitin-activating enzyme activity (GO:0004839, FDR = 2.87e−05).
Enriched GO terms from protein domains that show significant increase in abundance values in grasses as compared to grasses outgroups.

Abbreviations: FDR, false discovery rate; RISC, RNA-induced silencing complex.
For domains that showed significant decrease in abundance value in grasses, GO enrichment for 6 BP and 2 MF terms were observed (Table 13). Among the BP terms, there was moderate enrichments for the specific process, acetyl-CoA metabolic process (GO:0006084, FDR = 2.61e−03) and 2 highly specific processes, namely cellular response to azide (GO:0097185, FDR = 5.64e−03) and cellular response to copper ion starvation (GO:0035874, FDR = 5.64e−03).
Enriched GO terms from protein domains that show significant decrease in abundance values in grasses as compared to grasses outgroups.

Abbreviation: FDR, false discovery rate.
Finally, the domain-centric GO-enrichment analyses of domains that have significant different versatility values in legumes and grasses concerning their outgroup species did not show enrichment of GO terms from any of the 3 subontologies.
Discussion
In this study, we describe evolutionary patterns in species from 2 large plant families: legumes and grasses, by tracking changes in their species-level protein-domain characteristics relative to selected outgroup species. We analyzed 4 types of domain characteristics to study gain and loss of domains, changes in duplication counts of domains along the sequences, expansion and contraction of domains, and changes in the partnering tendency of domains.
The work presents a generic framework for studying evolution of a chosen set of target species using protein domains as a unit of evolution instead of entire protein sequences. The feature-selection techniques used in data science and machine learning like the MI and statistical tests like Fisher’s exact test and Wilcoxon rank-sum test can be used to select or filter-out significantly evolving domains in the target set of species relative to an outgroup set of species, which can be mapped to gain/loss or increase/decrease of particular biological functions in the target species. We have also containerized this entire analysis workflow inside a docker container which can be downloaded from the following URL: https://cloud.docker.com/u/akshayayadav/repository/docker/akshayayadav/protein-domain-evolution-project. The container is designed to accept user-defined set of target and outgroup proteomes along with the Pfam domain database and output domain sets for all 4 feature categories that have significantly different domain feature values (FDR ⩽ 0.05) in target species as compared to the outgroup species.
It should be noted that the FDR-adjusted P values assigned to the domains by the statistical tests could be underestimated due to the statistical dependence between species in the target and outgroup set. In other words, even though the species are evolving independently, they are not statistically independent units, which could result in higher Type I error while testing the significance of the difference in values for domains, between the target species and outgroup species. Therefore, we recommend using the MI score, instead of the FDR-adjusted P values, as the primary indicator for detecting differential evolution of domains between the target and outgroup set of species.
Domain content analysis in legumes shows a striking loss of protein domains from FA pathway, the pathway which is responsible for the repair of interstrand DNA crosslinks. The FA pathway consists of a core complex that ubiquitinates the FANCD2-FANCI complex, which then localizes to the site of DNA repair. It seems that all the proteins from FA core complex and the FANCI protein, except the FANCD2 nuclease, are lost in the legumes. Although one of the repair proteins (FANCD2) is present in legumes, the core complex protein (FANCL) that monoubiquitinates the FANCD2, is absent. As ubiquitination of the FANCD2 60 is an indispensable part of the DNA repair process, this could mean that legumes might have lost the ability to repair interstrand DNA crosslinks or that the FA-mediated repair of interstrand DNA crosslinks is carried out without the ubiquitination of FANCD2. In grasses, domains showing gains include those involved in flavonoid biosynthesis (well-studied in maize), as well as structural proteins found in gluten and male florets. The domains that were detected as lost in grasses are involved in functions such as peptidoglycan biosynthesis, wound repair in sieve tubes, and fatty acid synthesis. Fatty acid synthesis may be reduced in the sampled monocots, due to relatively greater production of carbohydrates in grass seeds, and the differences in sieve tube structure in monocots as compared to dicots. 104
Analyses of duplication feature matrices revealed a single domain of unknown function to have significantly decreased in copy number in legumes sequences. In grasses, an increase in copy number of domains such zf-PARP and FANCF shows the evolution of enhanced DNA repair mechanisms because both the domains are involved in the detection of DNA nicks and interstrand DNA crosslinks, respectively. On the contrary, domains with functions related to ER-Golgi transport, enzymatic transfer of prenyl groups, and termination of mitochondrial transcription were found to be decreased in copy numbers. A study on the role of plastidic protein BELAYA SMERT (BSM) of the mitochondrial transcription termination family in embryogenesis and postembryonic development in plant cells shows that proteins from this family are not essential for cell viability in monocotyledonous grasses 105 thus explaining the decreased copy number of the mTERF domain in grasses.
Domains with significantly increased abundance values in legumes were found to be associated with functions involving Thylakoid formation, Glutathione metabolism, and enriched with GO terms related to biosynthetic/metabolic processes involving glycosyl compounds, ribonucleosides, and isoprenoids. For domains that showed significant decrease in abundance values in legumes, GO terms related to specific BPs and MFs involving oxidation of purine nucleobase xanthine were found to be significantly enriched. A study on xanthine oxidizing enzymes isolated from leaves of legumes confirms that these oxidoreductases do not react with molecular oxygen and are essentially dehydrogenases. 106 The decrease in abundance of domains involved in purine catabolism may also be attributed to the availability of fixed nitrogen and remobilization of nitrogen from breaking down purine rings is no longer required. 107 In grasses, domains showing significant increase in abundance values revealed domains involved in functions related to gene silencing with GO terms such as chromatin silencing, regulation of translational initiation, protein unfolding, micro/si-RNA-mediated gene regulation, showing significant enrichment. The micro-RNA-related enrichments could be attributed to the regulation of floral organ genes in grasses such as rice and maize influencing various features of flower structure. 108 An increase in gene-silencing-related domains could also be attributed to polyploidy in grasses 109 or enhanced response to viral infection. 110 On the contrary, domains with significant decrease in abundance values, in grasses, showed involvement in functions such as cell adhesion, intracellular chloroplast movement, interfascicular fiber differentiation, DNA synthesis, and pectin metabolism with enrichment of GO terms such as acetyl-CoA metabolism and response to azide.
Finally, the increase in the versatility of the zinc-binding domain in legumes could be related to root nodule symbiosis and compound leaf morphology. Nitrogen fixation through root nodule symbiosis is one of the salient features in legumes and studies have shown the involvement of nodule-specific zinc-binding domain-containing proteins in symbiosis establishment and nodule function. 111 The zinc-finger domain-containing transcription factor has also been shown to be involved in trifoliate compound leaf morphology in Medicago truncatula. 112 In grasses, increased versatility of DNA-binding domain involved in ultraviolet (UV)-light-related signal transduction, and calmodulin-binding could be due to an increase in the number of proteins involved in abiotic stress tolerance. 113 The increase in the versatility of the Jacalin domain also suggests increased adaptation of grasses to stressful environments. 114
This method can be effectively used to study characteristic biological functions/processes for a selected group of species by filtering out protein domains that seem to have differently evolved in the group, with respect to an outgroup set of species. By closely studying the most significantly evolved protein domains and GO terms associated with significantly evolved protein domains, we might be able to explain the molecular mechanisms responsible for characteristic biological features observed in our target group of species.
Footnotes
Funding:
The author(s) disclosed receipt of the following financial support for the research, authorship, and/or publication of this article: This research was supported in part by the NSF project “Federated Plant Database Initiative for the Legumes,” award #1444806, and by the US Department of Agriculture, Agricultural Research Service, project 5030-21000-069-00D. Mention of trade names or commercial products in this publication is solely for the purpose of providing specific information and does not imply recommendation or endorsement by the US Department of Agriculture. USDA is an equal opportunity provider and employer.
Declaration of conflicting interests:
The author(s) declared no potential conflicts of interest with respect to the research, authorship, and/or publication of this article.
Author Contributions
AY concieved and designed the research and analysis, and drafted the manuscript. SC and DFB supervised the analysis. All authors read, edited, and approved the manuscript.