
Abstract
The focus of this study was the computational analysis of hepatitis B virus (HBV) genotype D subgenotype D1 in Pakistan, China, and India. In total, 54 complete genome sequences of HBV genotype D subgenotype D1 were downloaded from National Center for Biotechnology Information (NCBI). Of these, 6 complete genome sequences were from Pakistan, 14 were from China, and 34 were from India. Sequence alignment showed less than 4% divergence in these sequences. C and X genes showed divergence of less than 3%. Comparison over the S gene showed more than 97% similarity among the nucleotide sequences of genotype D subgenotype D1. The identity and similarity matrix of 54 nucleotide sequences of HBV genotype D subgenotype D1 from Pakistan, China, and India revealed more than 93% identity and 93% similarity. Phylogenetic analysis highlighted that complete genome isolates of HBV circulating in Pakistan had the closest evolutionary relationship with its neighboring countries China and India. China’s (HQ833466) and Pakistan’s (AB583680.1) isolates shared the same ancestor. Gene structure analysis showed that “P” gene exons were the longest, about three-fourth of the genome size, whereas gene “S” had the second longest coding regions with 2 exons and 1 intron. However, “C” and “X” genes had 1 smallest exon. X proteins had proven role in spreading of the HBV infection diseases. For HBx analysis, 1 X protein sequence of HBV genotype D subgenotype D1 belonging to each country was obtained. Homology models of the 3 X proteins generated using SWISS-MODEL revealed GMQE (Global Model Quality Estimation) = 0.1. Global and local quality estimate scores including Z-scores for Qualitative Model Energy Analysis (QMEAN) C-beta, all-atom, solvation, and torsion energy scores were similar indicating good quality, accuracy, and reliability of the predicted models. Three-dimensional (3D) visualization showed similar structures and Ramachandran plots showed a high percentage of protein residues into the favorable region for X protein models.
Keywords
Introduction
Hepatitis B virus (HBV) is double-stranded DNA virus and belongs to the Hepadnaviridae virus family, a species of the Orthohepadnavirus genus. The HBV whole genome sequence is approximately 3200 base pairs long, which has partly spherical DNA duplex molecule. Zigzag shape of the viral DNA is chiefly sustained through 5′ cohesive ends. 1
Hepatitis B virus is categorized into 4 serotypes (adr, adw, ayr, ayw) divided on the basis of antigenic epitopes existent on its envelope proteins. The classification of serotypes is based on 1 shared determinant (a) plus 2 mutual exclusive determinant pairs’ combination from (d/y and w/r). Hepatitis B virus has 10 genotypes represented by alphabets A, B, C, D, E, F, G, H, I, and J and about 40 subgenotypes, which are not evenly distributed in different geographic regions of the world. Genotype is categorized based on more than 8% difference in the genome sequences of a virus. New subgenotypes are recognized by 4% to 8% nucleotide mutations in the sequences.1,2 There are 4 open reading frames (ORFs; P, S, C, X) in the HBV complete genome. 3
Genotypes of HBV are dispersed in the world roughly because of various geographic factors. 1 Genotype D is leading in Southern Europe and Turkey, Albania, Pakistan, Iran, India, and Brazil.4,5 A total of 9 subgenotypes (D1-D9) have been identified for HBV genotype D. 6 In Pakistan and India, HBV genotype D subgenotype D1 is widespread.7–11
Various features such as HBV genotype, viral load, and specific viral mutations are important while predicting clinical consequences. 12 Studies have been conducted on substantial variation and the amount of resemblance in genotypes and subgenotypes.13,14
This study focuses on the computational analysis of variations, evolutionary relationship, gene structure analysis, and X protein sequence analysis of complete genome sequences of HBV genotype D subgenotype D1 from Pakistan, China, and India. Clinical inferences of resemblance or disparities within the same genotype and subgenotype of HBV genomes are also implicated. The study of mutations inside the similar genotypes illustrates the progression of disease and helps in suggesting better clinical treatments.
Materials and Methods
Pattern of circulation of HBV genotypes and subgenotype is summarized in Table 1. Table 1 describes the geographic distribution of HBV genotypes and subgenotypes worldwide.
Geographic distribution of hepatitis B virus genotypes and subgenotypes worldwide.

Data acquisition
Whole genome sequences were downloaded from National Center for Biotechnology Information (NCBI). Table 2 shows the details of accession numbers along with the country of a particular nucleotide sequence. There are a total of 54 sequences used in this study (34 from India, 14 from China, and 6 from Pakistan).
Accession numbers of DNA/genome sequences used in this study.

Tools for computational analyses
ClustalW was used for generating multiple sequence alignment using the MEGA-X platform as it provides statistically improved accurate alignments. The percent identity and similarity among the nucleotide sequences of 54 HBV complete genomes were determined by conducting a pairwise comparison of the sequences using IVistMSA. 15 MEGA software was used for reconstructing the phylogenetic tree. For visualization of various gene features, especially visualizing position as well as composition of introns, exons, and conserved regions, Gene Structure Display Server (GSDS 2.0) was used. SWISS-MODEL was used for the visualization and analysis of X protein structure homology modeling. Ramachandran plots were used for showing the percentage of protein residues into the favorable region.
Results and Discussion
Sequence alignment
For multiple sequence alignment, ClustalW was used from the MEGA-X platform, to generate multiple sequence alignment of the reported sequences of HBV genotype D subgenotype D1 (Figure 1).
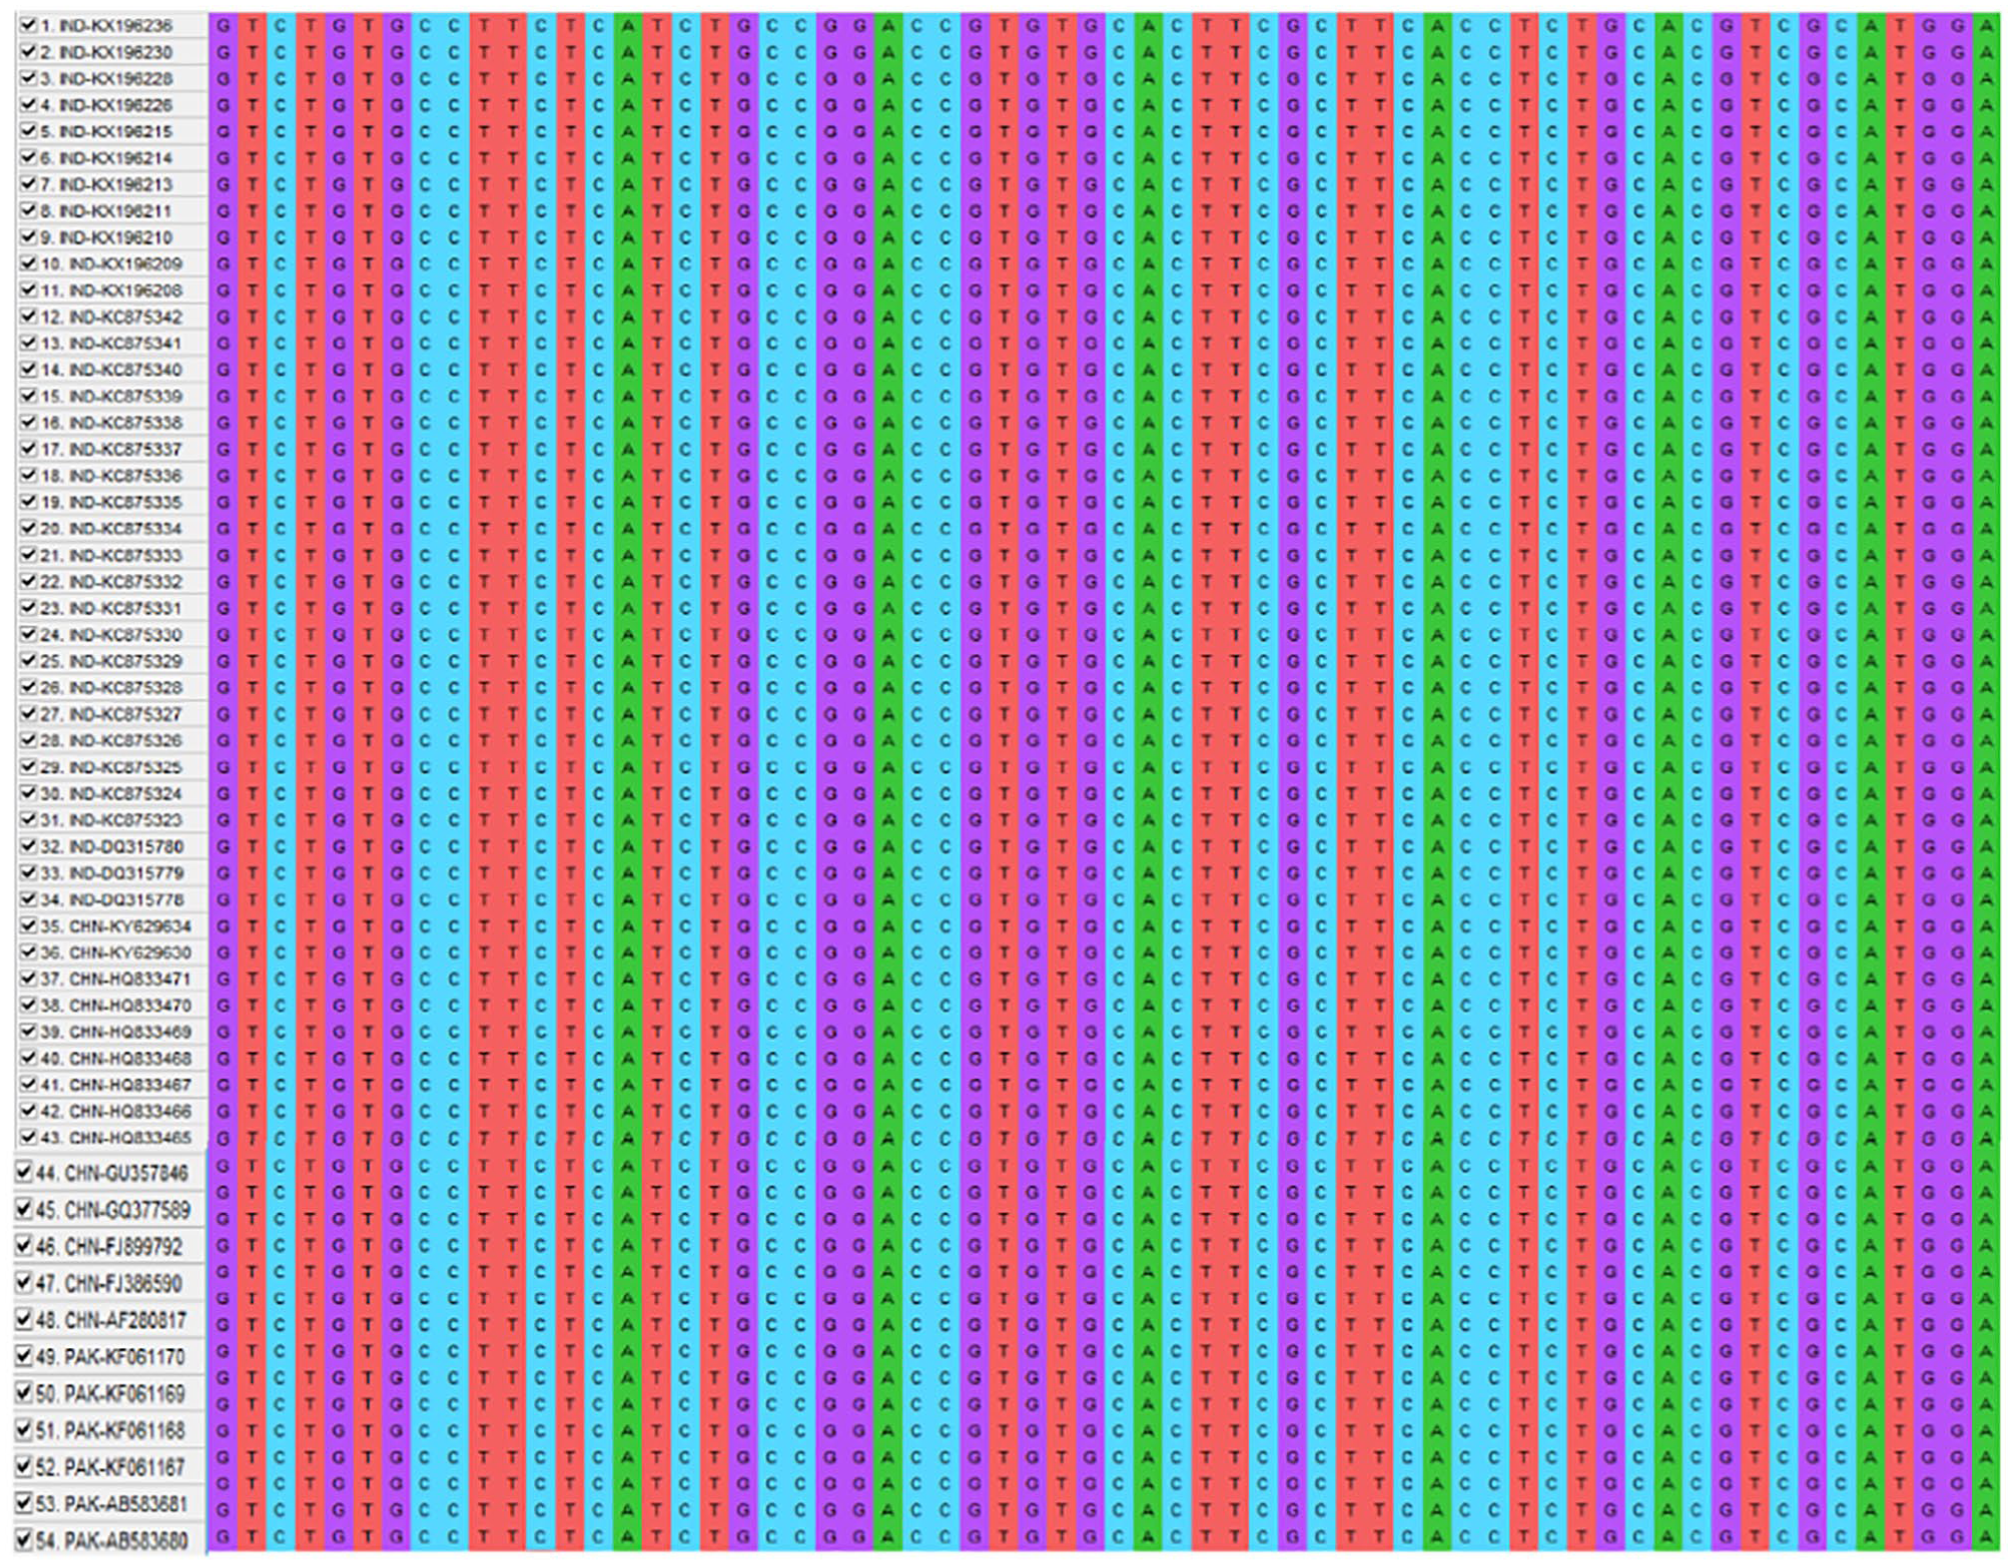
Multiple sequence alignment for 54 HBV genotype D subgenotype D1 isolates from Pakistan, India, and China. Here it is shown that full genomes of HBV genotype D subgenotype D1 showed no more than 4% to 5% divergence, very high similarity index, and no chance of new possible subgenotype.
Results showed that complete nucleotide sequences of Pakistan were very similar to the data reported from India and China. Comparison of full genomes of HBV genotype D subgenotype D1 showed no more than 4% to 5% divergence. Comparison concluded that C and X genes showed divergence of less than 3%. However, the comparison over the S gene showed that the similarity ratio to genotype D subgenotype D1 was 98%.7,8,11–13 Consistent with previous studies, sequence analysis exposed the potential of similarity within HBV genotype D subgenotype D1 and fewer chances for a new subgenotype of HBV. In addition, similar results to this analysis were observed from the phylogenetic analysis of the entire BV genome genotype D subgenotype D1.
Percent identity and similarity among the nucleotide sequences of 54 HBV complete genomes
Percentage identity among the 54 nucleotide sequences of HBV genotype D subgenotype D1 from Pakistan, China, and India was more than 93% (Figure 2), whereas percent similarity was also more than 93% (Figure 3). 15 Nucleotide sequences from Pakistan had the highest percent identity of 98% as well as 98% similarity, whereas sequences from China had 93% percent identity and 93% similarity. Likewise, percent identity as well as percent similarity for Indian Isolates was more than 92%. This trend was also maintained for nucleotide sequence identity and sequence similarity of isolates from Pakistan when comparing with the isolates from China. 15 Sequences from Pakistan and China had the highest percent identity 94% and percent similarity 94%. Sequences from Pakistan and India had 93% identity as well similarity. Likewise, sequences from China and India had more than 92% identity as well similarity (Figures 2 and 3).

Identity matrix for 54 HBV genotype D subgenotype D1 isolates from Pakistan, India, and China. HBV indicates hepatitis B virus.

Similarity matrix for 54 HBV genotype D subgenotype D1 isolates from Pakistan, India, and China. HBV indicates hepatitis B virus.
Phylogenetic analyses
Genotype D is thought to be the oldest type because it was initially broadly distributed in the whole region of Asia. 15 High level of predominance of genotype D may likely be related with the ancient civilization history in Asia.15–17 Similar genotypes of HBV have evolutionary relationship and sequences of similar genotypes are used to describe terrestrial migration of HBV-infected subjects.17,18 The scenario could be that people who acquired HBV genotype D prior to their migration might have transferred the HBV during the course of time from one generation to the other after their geographical migration. Horizontal gene transfer (HGT) also referred to as lateral transfer of genetic material among organisms is a principle mechanism of genetic evolution and adaptation in pathogens, especially HBV. Horizontal gene transfer is detected using algorithms relying on strong phylogenetic signals. On the opposite, a robust phylogeny in HBV genomes suggests considerable evidence of HGT.18–20 In our study, the detection of HGT was obvious as it focused on genomes of similar subgenotype from 3 neighboring countries Pakistan, China, and India, having nucleotide composition nearly identical.
Phylogenetic tree constructed using the neighbor-joining method was based on the alignment of 54 HBV genotype D subgenotype D1 whole genome sequences selected from Pakistan, India, and China. The bootstrap values from 1000 pseudoreplicates for major lineages within the tree were calculated and shown as percentages. Substitution type was nucleotide and the substitution model was based on “No. of differences.” These mentioned analyses were effectively performed by means of the MEGA (Molecular Evolutionary Genetics Analysis) software program. The distance analysis revealed that the difference in the distance of AB583680.1 (Pakistan) and HQ833466 (China) is .00382 showing close evolutionary relation within subgenotype D1, indicating that both these subgenomes share a common ancestor. Our findings were in agreement with studies of Kitrinos et al 21 conducted regarding the age of civilization concluding that HBV belonging to the same genotype was assumed to have an evolutionary relationship. 21
Phylogenetic tree and synteny analysis showed a highly preserved order of genes in all selected genomes (Figure 4). Hence, potential evidence of HGT and distance analysis suggested that HBV genotype D subgenotype D1 that circulated in Pakistan, India, and China was in concordance showing a strong evolutionary relationship.

Phylogenetic analysis of whole genomes of HBV genotype D (subgenotype D1) for 54 selected sequences from Pakistan, India, and China. The distance analysis revealed the differences from the distance of AB583680.1 (Pakistan) and HQ833466 (China), probability of substitution P = .00382 showing close evolutionary relation within subgenotype D1, indicating that both these subgenomes share a common ancestor. HBV indicates hepatitis B virus.
Gene structure analysis
Gene structure analysis always assists users in visualizing gene structure and annotated features. 22 To check the structural differences among different subtypes of India, Pakistan and China, gene structure analysis was performed by using GSDS 2.0. Our results showed sequence similarities among all sequences. All isolates showed conserved sequences in 5 and 3 UTRs as shown in the (Figure 5).

(A, B) Gene structure analysis of HBV genotype D subgenotype D1. Gene structure analysis in this figure indicates that “P” gene has the largest coding region and the shortest intron, whereas gene “S” has the second largest coding regions. However, both “C” and “X” genes have 1 smaller exon compared with the prolonged intron where gene “C” has a large coding region compared with gene “X.” HBV indicates hepatitis B virus.
These analyses indicated that HBV genotype D subgenotype D1 sequences among Pakistan, India, and China have similar gene structures except a few sequences that have some extra nucleotides; otherwise, the positions of exon and intron were somehow identical. There were 4 genes in a complete genome of HBV genotype D subgenotype D1. These were labeled as C, P, S, and X genes.23–25 Gene structure analysis of the selected sequences in most of the cases revealed that the positions of exon and intron in each gene are almost identical and consistent. There were few reported sequences from Pakistan, China, and India having few insertions as well as deletions; hence, a minor difference in the length of whole genome sequences resulted in longer exons for some sequences.
Gene structure analysis of all the selected genome sequences of HBV genotype D subgenotype D1, as shown clearly in Figure 5, indicates that the coding region of “P” gene is the longest and contains 2 longest exons comprising more than 75% of the gene interspersed by 1 shortest intron approximately less than 25% of “P” gene. Then gene “S” has the second longest coding regions with 2 exons and 1 large intron with the size ratios of 40% and 60%, respectively, for coding and noncoding regions of the “S” gene. However, “C” and “X” genes have 1 smaller exon and 1 prolonged intron where “C” has a larger coding region almost 20% of its gene size as compared with gene “X” having even less than 20% coding region of its gene size.
Protein structure analysis
From previous research, it became clear that there has been a greater similarity index present within the studied areas and protein sequences. SWISS-MODEL was used for protein structure analysis. And 4 ORFs of HBV genome can encode 7 types of different proteins. P ORF encodes the polymerase proteins, PreC/C ORF encodes capsid proteins, S ORF encodes large (L) surface proteins, middle (M) surface proteins, and small (S) surface proteins, and X gene produces X protein. 26 Protein structure prediction and homology modeling can be performed on the polymerase protein, large surface, middle S, S, pre-core/core, X proteins, and envelope proteins of the selected gene sequences.26–28 At NCBI, we have many coding regions CDS against each of the selected genome sequence. Each CDS has a protein translation given with its unique protein ID. 28 The protein analysis was performed using these protein IDs (Table 3).
Protein IDs of X protein sequences of HBV genotype D subgenotype D1 used in protein structure analysis.
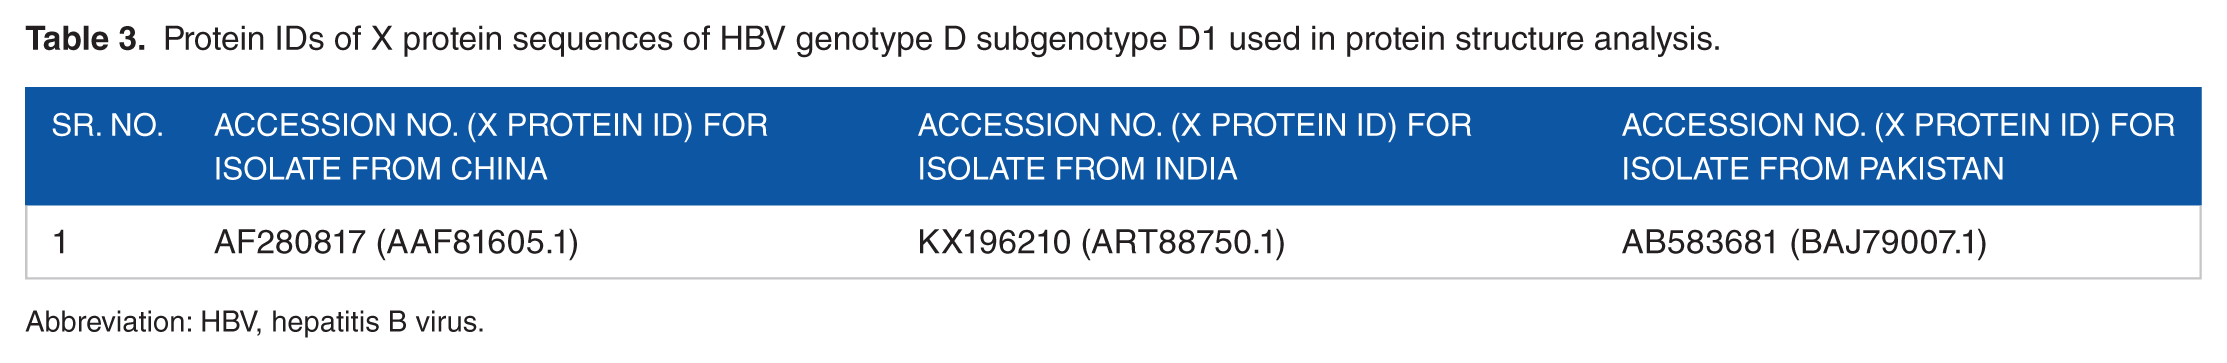
Abbreviation: HBV, hepatitis B virus.
Table 3 has 3 protein IDs selected 1 from each country used for the protein structure analysis. We had used X proteins for homology modeling against each complete genome sequence of HBV genotype D subgenotype D1.
Reason for selecting only X proteins among various numbers of proteins was that HBx has proven to be of significant importance in HBV infection. 29 X proteins play a fundamental role in HBV infections. HBx affects transcription, cell cycle progress, apoptosis, degradation of protein, and chromosomal stability in the HBV-infected host. HBx causes cellular alterations either directly or indirectly by inducing large increases in intracellular reactive oxygen species (ROS). HBx is partially liable for 10 000 times growth in intracellular ROS during chronic HBV infection. HBx can confine to the mitochondria consequently decreasing the potential of the mitochondrial membrane and inducing high release of ROS. Reactive oxygen species instigates about 20 types of DNA damage.29,30 Another reason was to avoid redundancy because most of the similar kind of proteins had similar structural features and our analysis would become extraordinarily graphical and lengthy containing similar looking figures. Hence, we selected only one of the most important types of protein among all available proteins for visualizing its features and structures.
X protein structure analysis (HBx) using SWISS-MODEL
Quality estimates of the model of HBx of a Pakistan isolate showed the highest Qualitative Model Energy Analysis (QMEAN) scores (Figure 6). Figure 6A shows the three-dimensional (3D) structure of X protein. 28 Z-score plot in Figure 6B showed the high reliability of the selected model with values of QMEAN = −1.04. Z-score for all-atom pairwise energy was −0.32, solvation energy = −0.58, C-beta interaction energy score was −0.61, and torsion angle energy Z-score was −0.92.28. Figure 6C shows a graph for local quality estimates showing predicted local similarity of the selected protein sequence to the target sequence. 28 Figure 6D shows the comparison of normalized QMEAN score with nonredundant set of Protein Data Bank (PDB) structure.28–30 From the Ramachandran plot in Figure 9, it can clearly be seen that the generated model for X protein has a high percentage of protein residues into the favorable region. Ramachandran plots are normally composed of 4 quadrants or regions. The determination of secondary structure of proteins’ favorable region in our study means the largest region in Ramachandran graph having favorable confirmations of atoms showing structurally allowed conformations for beta strand. 30
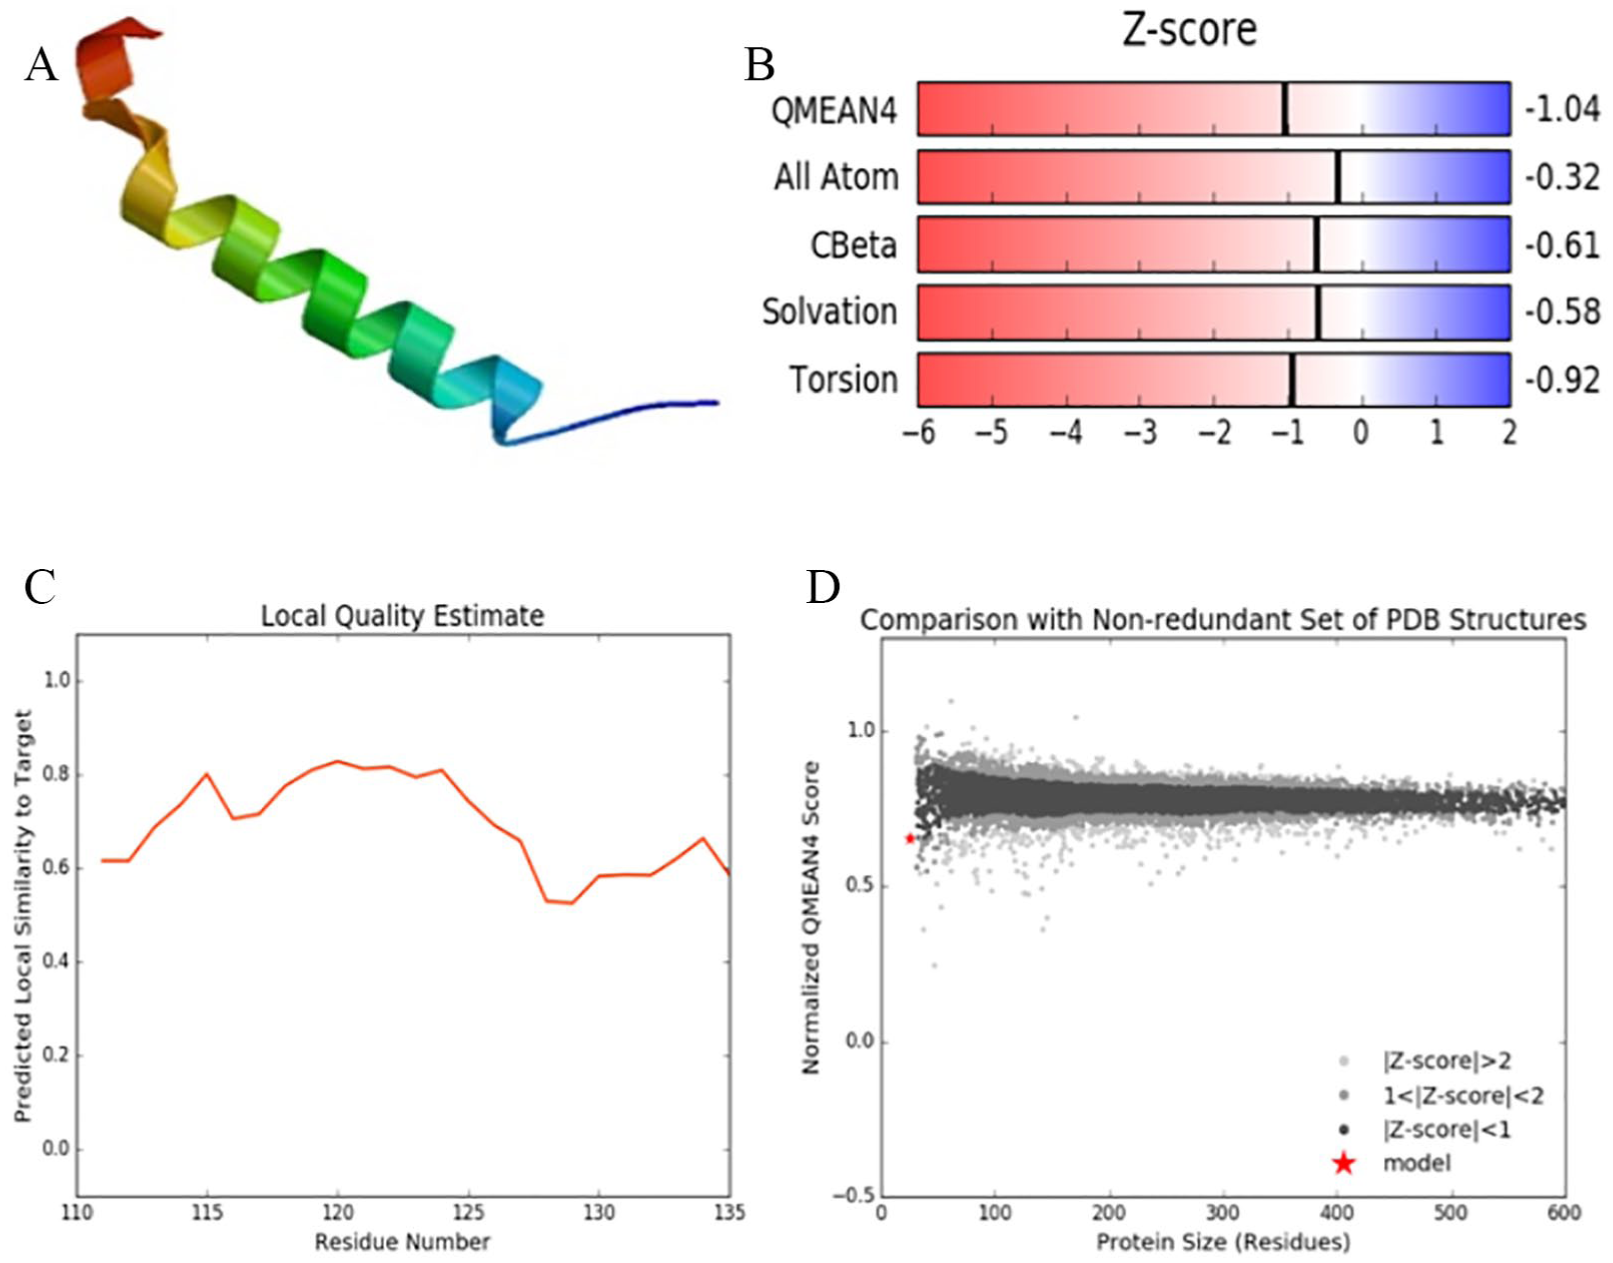
HBx analysis of protein ID BAJ79007.1 HBV genotype D subgenotype D1 accession no. AB583681 isolate from Pakistan: (A) 3D visualization of HBx, (B) Z-score estimates of the generated model, (C) local quality estimate graph, and (D) comparison with the nonredundant set of PDB structures. HBV indicates hepatitis B virus; PDB, Protein Data Bank.
It is also clear from Figure 9A to C that all 3 HBx models share almost identical Ramachandran plots having a high percentage of protein residues in exactly the same region in all 3 scenarios. Similar results were observed for X protein analysis of HBV in a study by Sharav et al. 30 Comprehensive details about the template sequence used to generate the homology model are given in Table 4.
Analysis of the template sequence and the generated homology model for the isolate from Pakistan.

Abbreviation: GMQE, Global Model Quality Estimation.
The high-resolution reference structure was experimentally studied using X-ray crystallography for the investigation of all quality estimate scores including Z-scores and all other terms (Table 4). BLAST algorithm was used for comparison of the selected as well as target sequences. A GMQE (Global Model Quality Estimation) score of 0.10 showed the accuracy of the model with respect to the target template.
Similar experiments were repeated for 2 other X proteins from HBV genotype D subgenotype D1 isolates from China and India as shown in Figures 7 and 8, respectively. Similarly, Tables 5 and 6 show comprehensive details about the HBx analysis of the Chinese isolate and the isolate from India, respectively. We can see that the sequence identity for strains from Pakistan and India is 80%, whereas for the Chinese strain sequence the identity with the template sequence is 92%. All 3 sequences share a common GMQE score of 0.01. Similarly, the sequence similarity for the strains from Pakistan and India is 0.57, whereas for the Chinese strain the similarity ratio is 0.60. For all 3 protein sequences, BLAST was used for comparison with the target template and X-ray crystallography was used in the calculation of quality estimate scores for homology models.
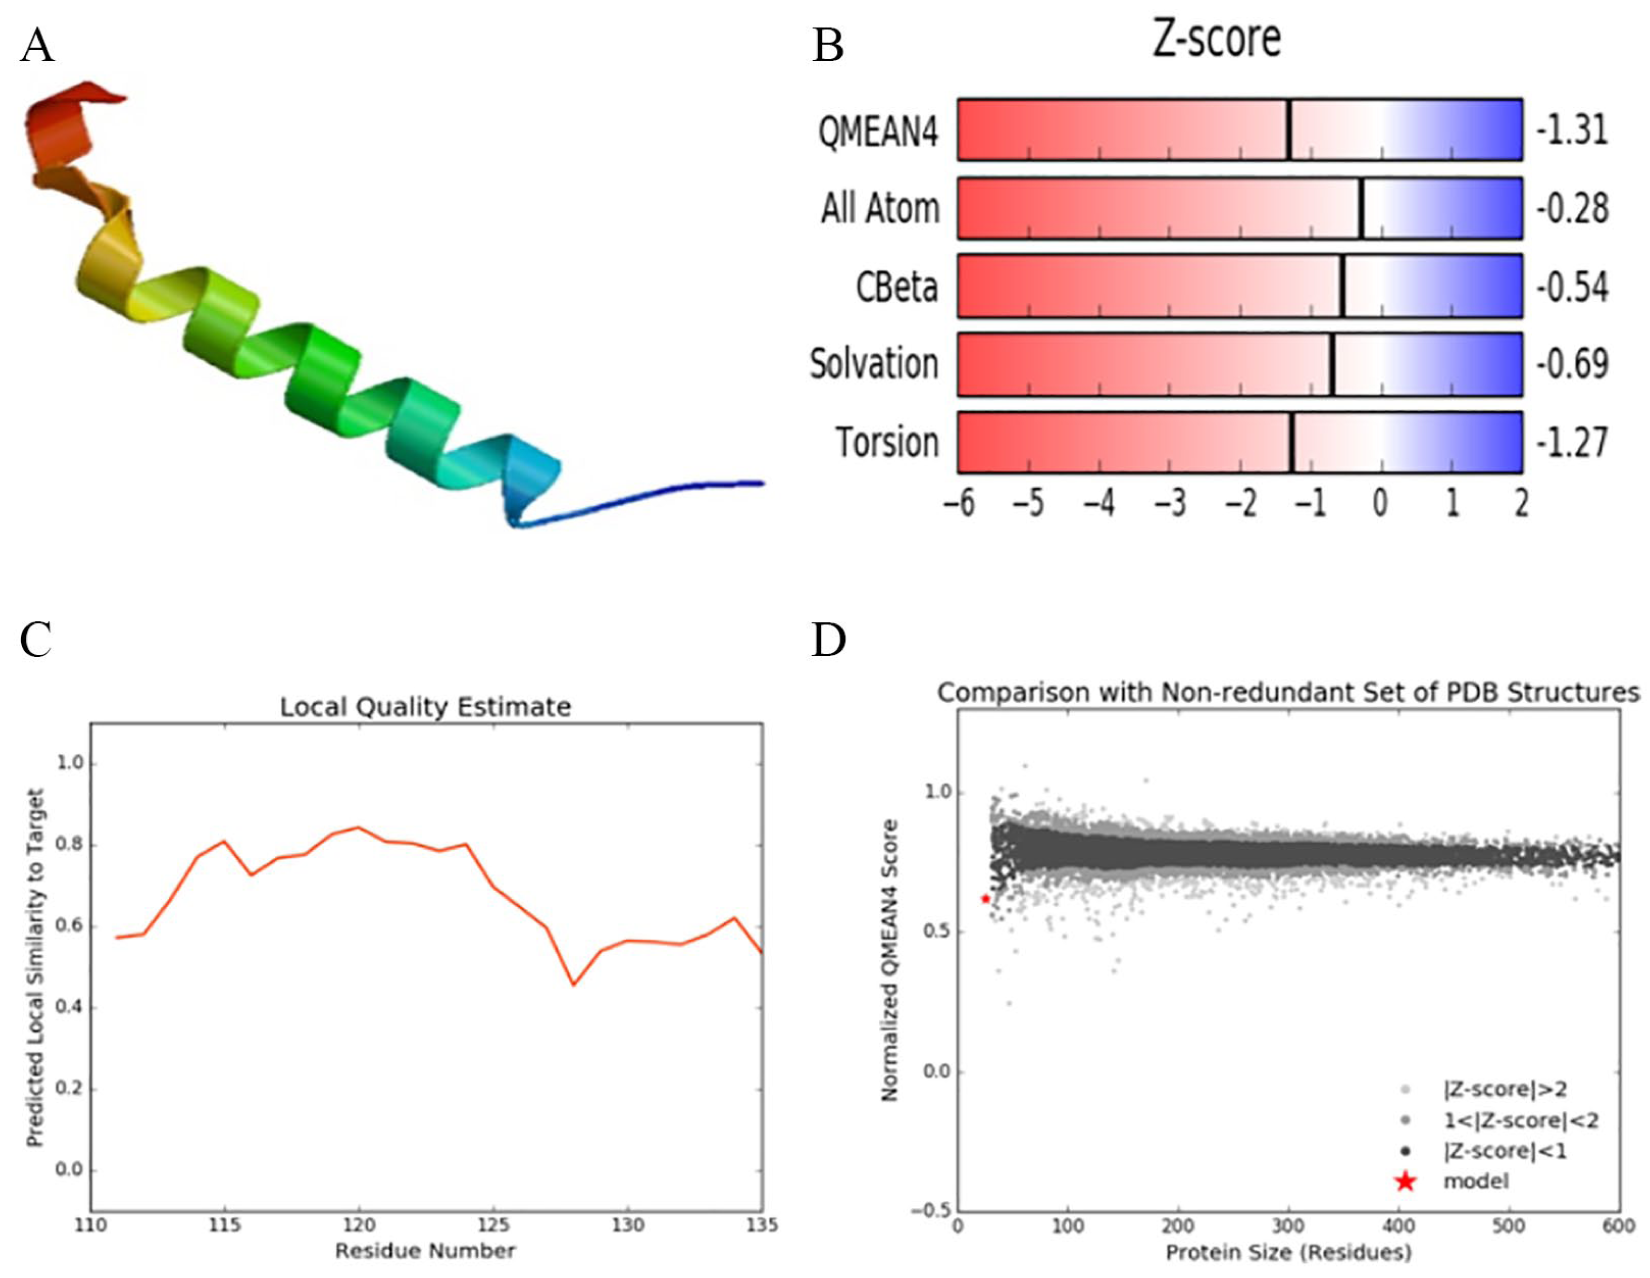
HBx analysis of protein ID (AAF81605.1) HBV genotype D subgenotype D1 accession no. AF280817 isolate from China: (A) 3D visualization of HBx, (B) Z-score estimates of the generated model, (C) local quality estimate graph, and (D) comparison with the nonredundant set of PDB structures. HBV indicates hepatitis B virus; PDB, Protein Data Bank.

HBx analysis of protein ID ART88750.1 HBV genotype D subgenotype D1 accession no. KX196210 isolate from India: (A) 3D visualization of HBx, (B) Z-score estimates of the generated model, (C) local quality estimate graph, and (D) comparison with the nonredundant set of PDB structures. HBV indicates hepatitis B virus; PDB, Protein Data Bank.
Analysis of the template sequence and the generated homology model for the isolate from China.

Abbreviation: GMQE, Global Model Quality Estimation.
Analysis of the template sequence and the generated homology model for the isolate from India.

Abbreviation: GMQE, Global Model Quality Estimation.
Similarly, the Ramachandran plot in Figure 9A is for the Chinese isolate, that in Figure 9B is for the isolate from India, and that in Figure 9C is for the Pakistani isolate. Similar results were also found in previous studies. 30
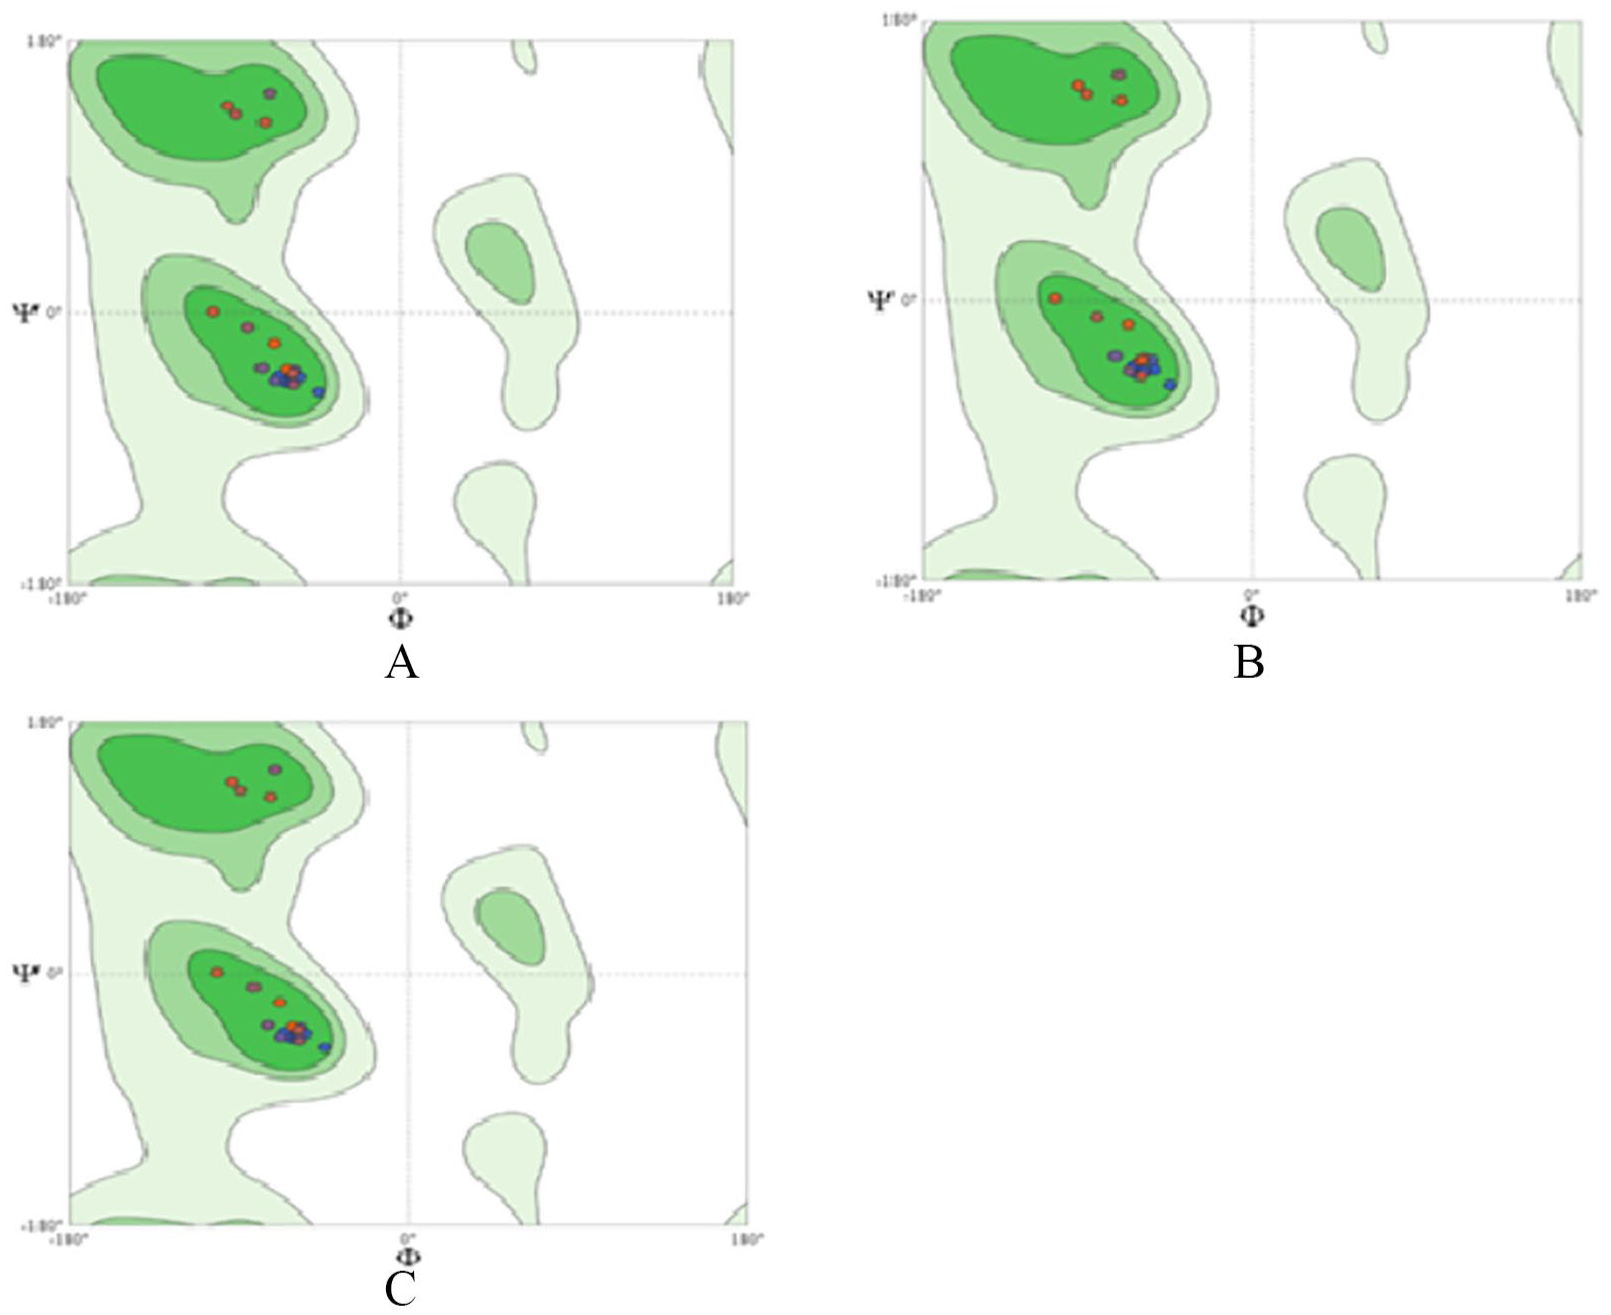
Ramachandran plot of X proteins from 3 different HBV isolates: (A) X protein ID: AAF81605.1 of the selected isolate from China AF280817; (B) X protein ID: ART88750 from the selected isolate from India KX196210; and (C) Ramachandran plot of HBx protein ID: BAJ79007.1 from AB583681, a selected isolate from Pakistan. HBV indicates hepatitis B virus.
Analysis of the template sequence and the generated homology model for the isolate from China is summarized in Table 5.
Figure 7 and Table 5 show the detailed quality estimate scores of the X protein homology model of the HBV genotype D subgenotype D1 isolate from China using SWISS-MODEL Server.
Figure 8 and Table 6 show the detailed quality estimate scores of the X protein homology model of the HBV genotype D subgenotype D1 isolate from India using SWISS-MODEL Server.
It is clearly revealed that HBx from the Pakistani and Indian isolates share an identical model, and all quality estimates including Z-scores for QMEAN C-beta, all-atom, solvation, and torsion energy scores are similar. However, HBx from the Chinese isolate has QMEAN4 = −1.31 and GMQE = 0.1 for all 3 X proteins (Figure 7 and Table 5).
Pakistani and Indian isolates share identical values (QMEAN = −1.04) in the homology models and the Chinese isolate has minor differences in QMEAN = −1.31 and other quality estimate scores using the same target template. The difference in values has no significant impact as individual input sequence is aligned here with the target template for homology protein modeling and a GMQE score of 0.01 for all 3 sequences shows equal expected accuracy of the generated models. Moreover, whole genome sequence analysis and gene structure analysis also confirm about 2% to 3% of difference in overall selected genomes. We should note that a QMEAN score around zero shows a great deal of agreement between the model structure and experimental structures of similar size. A score of −4.0 and less indicates that the models have low quality. Here, in our case, a minute difference in QMEAN indicates that despite minor differences the X proteins of all 3 studied genomes share similar structural features.
Conclusions
This study observed a close evolutionary relationship among the nucleotide sequences of HBV genotype D subgenotype D1 from China, Pakistan, and India. Identity matrix and similarity matrix revealed overall 93% similarity among all the selected nucleotide sequences. In our phylogenetic analysis, the distance analysis clearly revealed that the isolate AB583680.1 from Pakistan and HQ833466 from China are the closest regarding difference per distance that showed the strongest evolutionary relation. Hence, representing both these genomes shared the same ancestor. From sequence alignment and gene structure analysis, it became clear that only the comparison between the C and X genes showed a very less divergence of less than 3%. Likewise, comparison over the S gene analysis showed that resemblance to genotype D subgenotype D1 is 97% to 98%. This study showed no more than 4% to 5% divergence, in reported sequences from Pakistan, India, and China. However, the comparison over the S gene showed the similarity ratio of 97% to 98% among the nucleotide sequences of genotype D subgenotype D1. Sequence analysis revealed the high potential of similarity index within HBV genotype D subgenotype D1 and suggested fewer chances for a new subgenotype of HBV. Results of the gene structure analysis showed sequence similarities among all sequences. All the isolates showed conserved sequences in 5′ and 3′ UTRS indicating that HBV genotype D subgenotype D1 sequences from Pakistan, India, and China have similar gene structures. There are 4 genes (P, S, C, X) and P has the largest coding region in HBV genotype D subgenotype D1 complete genome. The structure analysis and homology models of HBx showed that all X proteins have similar features GMQE = 0.1 for each of the 3 selected X proteins in their homology models. All the resulting models had high global and local quality estimate scores including Z-scores for QMEAN C-beta, all-atom, solvation, and torsion energy scores, which were similar indicating good quality, accuracy, and reliability of the predicted models. 3D visualization using SWISS-MODEL also showed a high similarity among protein structures of all the selected X protein sequences. Although the occurrence rate of HBV genotype D subgenotype D1 is dissimilar in China, Pakistan, and India, the frequency of variation is less than 5%. The computational analysis of HBV genotype D subtype D1 showed that there is same ancestor for some isolates circulating in China, India and Pakistan.
Footnotes
Acknowledgements
We recognize substantial support of Higher Education Commission of Pakistan and Virtual University of Pakistan.
Funding:
The author(s) received no financial support for the research, authorship, and/or publication of this article.
Declaration of Conflicting Interests:
The author(s) declared no potential conflicts of interest with respect to the research, authorship, and/or publication of this article.
Author Contributions
MB and MTP conceived and designed the experiments, analyzed the data, and wrote the first draft of the manuscript. MB performed the experiments. MTP, AA, and MEB made critical revisions and approved the final version. All authors agree with the manuscript results and conclusions and reviewed and approved the final manuscript.