
Abstract
Malaysian Mahseer (Tor tambroides) is considered as a good prospect for aquaculture in Malaysia. However, knowledge about Malaysian Mahseer-associated sperm microbiota is still limited, although some studies reported that sperm-related bacteria are a factor in the decline of sperm quality, as sperm may become the carrier of pathogenic bacteria to the egg. The goal of this study was to evaluate the sperm microbiota associated with Malaysian Mahseer from 3 different locations (Universiti Malaysia Terengganu [UMT], Ajil, and Pahang) using polymerase chain reaction denaturing gradient gel electrophoresis (PCR-DGGE) fingerprinting and to compare location differences by cluster analysis. Our results showed that the UMT sample had different sperm microbiota composition and a different trend in its relationship with sperm quality. Correlation analysis showed a relationship between bacterial diversity and sperm quality. Phylogenetic analysis indicated that sperm microbiota was composed of diverse phyla, including Proteobacteria, Firmicutes, and Actinobacteria. Interestingly, bacteria such as Salinisphaera sp., Pelomonas sp., and Staphylococcus spp. were detected in all the locations, suggesting that these bacteria are indigenous bacterial members of the Malaysian Mahseer sperm microbiota, although their function is still unclear.
Keywords
Introduction
Malaysian Mahseer (Tor tambroides Bleeker), locally known as kelah or empurau, are a group of cyprinids that are important in Asia as they are highly valued for game, food, and as ornamental fish. 1 Nevertheless, Malaysian Mahseer are now considered threatened species in the wild due to environmental degradation2,3 and great interest has been generated for the propagation of Malaysian Mahseer for conservation and aquaculture purposes. 4 The current research of Malaysian Mahseer is focused on biological diversity, reproductive biology, culture, growth, and genetics.2,5–8 On the other hand, the availability of the broodstock is a major problem for the commercialization of this species for aquaculture industry. Sperm quality is correlated to the broodstock condition and seasonal variation. Tor species in the natural habitats spawn only during the rainy monsoon season. 2 On the other hand, Chew et al 3 suggested that captive T tambroides are able to spawn year round without showing any distinctive peak breeding season and several times in a year; however, there is no study on the Mahseer male broodstock condition in captivity.
In some species, the presence of bacteria in sperm microbiota affects the sperm during spermatogenesis or sperm maturation. In insects, development of sperm in alpha-proteobacterium Wolbachia environments led to feminization in isopods, parthenogenesis in hymenopteran wasps, and male killing in Coleoptera, Drosophila, and Lepidoptera. 9 In Drosophila simulans, when Wolbachia is present in sperm microbiota, bacterial-induced modification of the sperm resulted in cytoplasmic incompatibility, where a cross between infected males and uninfected females resulted in few to no offspring, whereas the reciprocal crosses were fully fertile. 10 In contrast, the role of intracellular bacteria in the process of spermatogenesis or its effect on sperm quality in fish is still unclear, therefore increasing the importance of our study. Unlike the case for gut microbiota, there are few studies on the detection of bacteria in sperm/spermatophore in aquatic animals, even though bacteria are closely related with all life stages of marine organisms. 11 Boonthai et al 12 showed the influence of 2 inoculated freshwater fish pathogenic bacteria (Aeromonas hydrophila and Pseudomonas fluorescens) on silver barb sperm motility, sperm viability, and sperm morphology during cryopreservation. In addition, Flavobacterium psychrophilum, which is a cold-water disease, was transferred from male seminal fluid to the egg during fertilization. 13 This suggests that bacterial prevalence has an impact on sperm mortality during storage, although studies about the effect of bacteria in sperm quality have not yet been reported. Therefore, we evaluated the Malaysian Mahseer sperm-associated microbiota collected from 3 different broodstock locations. Information on sperm-related microbiota might reveal the role of bacteria in the aggregation of sperm and sperm mortality. This information might also be useful to identify probiotic bacteria for the improvement of sperm quality.
Materials and Methods
Collection of Malaysian Mahseer sperm
Sperm samples of Malaysian Mahseer were randomly collected from 3 locations: Hatchery Kelah at Universiti Malaysia Terengganu (UMT), Kuala Terengganu (5°24′11.39″ N, 103°05′9.60″ E), Ajil, Terengganu (4°53′15.173″ N, 103°2′24.529″ E), and Kuantan, Pahang (3°47′39.811″ N, 103°16′0.174″ E). Sperm was collected from 3 male broodstock (N = 3) at each location and anesthetized using 0.04% of clove oil and sterilized by spraying of 95% ethanol at fish abdominal area before sperm collection. The body weights (BWs) of the selected brooders were 2.34 ± 0.16, 0.47 ± 0.13, and 1.13 ± 0.26 kg for the UMT, Ajil, and Pahang samples, respectively. The total lengths (TLs) of the selected brooders were 59 ± 1.0, 35 ± 3.1, and 46 ± 2.6 cm for the UMT, Ajil, and Pahang samples, respectively.
Sperm sample was then collected from males by gentle abdominal pressure 14 and put into a sterile 1.5-mL microcentrifuge tube. Then, the sperm samples were immediately transferred to the laboratory and further experiments were performed.
Sperm quality evaluation
One microliter of sperm was transferred into the upper part/wall of a 1.5-mL centrifuge tube that contained 999 µL of freshwater. The sperm was then mixed into freshwater and, immediately, 8 µL of the mixture was transferred into slide glass for observation under microscope at 20× magnification. The sperm motility was recorded using video camera (Dino eye) using Dino capture 2.0 software (version 1.4.3) starting from the time sperm was mixed with the activation solution (freshwater). The sperm motility videos were then analyzed manually to determine percent motility. At least n = 50 sperm were observed for each video recording during each sperm motility evaluation.
Sperm concentration (cells/mL) was estimated by diluting sperm with the extender solution at a final milt-to-extender dilution ratio of 1:9999 µL and counting the number of sperm in a hemocytometer chamber (Thoma Neu; chamber volume 0.00025 mm3) under a phase contrast microscope. In each instance, 5 chambers were counted. 15
Bacterial genomic DNA extraction and polymerase chain reaction amplification of 16S rDNA
Each sperm sample was suspended with sterile phosphate buffered saline (PBS; pH 7.4, Invitrogen, San Diego, USA) and sonicated using an ultrasound sonicator for 5 minutes to detach sperm-attached bacteria, and then sperm-related bacteria were collected using centrifugation at 14 000×g for 10 minutes. The sperm-associated bacterial DNA was purified with the Promega DNA Purification system (Promega, Madison, WI, USA) according to the manufacturer’s protocol. All bacterial genome DNA extracts were then analyzed on a 1.5% agarose gel at 100 V for 30 minutes. Thereafter, to obtain fingerprints of sperm microbiota in the different samples, universal bacterial primers 27F and 1492R were used initially, and the products were used as a template in a subsequent nested polymerase chain reaction (PCR). In the nested PCR, bacterial 16S rDNA primer set 338F with 40-bp GC clamp and 907R 16 were used to amplify the V3-V5 region of 16S rDNA. The PCR reaction mixture (40 µL final volume) contained 1.25 U TaKaRa Ex Taq polymerase (TaKaRa Bio, Shiga, Japan), 1× PCR buffer, 200 µM for each dNTP, and 10 pmol for each primer. Amplification was performed using Kyratec SuperCycler SC300 Thermal Cycler. Amplification was conducted using a touch-down PCR using the following cycle conditions: initial denaturation at 95°C for 4 minutes, 20 cycles of denaturation at 95°C for 30 seconds, annealing temperature of 65°C for 30 seconds with a decreasing temperature of 0.5°C at every cycle, and extension at 72°C for 90 seconds, followed by 15 cycles of 95°C for 30 seconds, 55°C for 30 seconds, and 72°C for 90 seconds, and final extension at 72°C for 7 minutes. The PCR product (5 µL), mixed with loading dye (5 µL PCR product:1 µL loading dye), was analyzed by electrophoresis in 1.5% (w/v) agarose gel at 100 V for 30 minutes and visualized using SYBR Safe DNA gel stain 0.05 (µL/mL) (Invitrogen).
Denaturing gradient gel electrophoresis
Denaturing gradient gel electrophoresis (DGGE) fingerprinting analysis was performed in 6% (v/w) polyacrylamide gel with 35% to 55% gradient of urea and formamide in 1× Tris-acetate-EDTA (TAE) buffer. A total of 20 µL of each PCR sample was loaded into each well and electrophoresis was initiated by pre-running for 20 minutes at 60 V and subsequently run at a constant voltage of 150 V for 7 hours at 60°C using the C.B.S Scientifix Model DGGE-2401 (C.B.S. Scientifix, Del Mar, CA, USA). Thereafter, the gels were stained for 1 hour in SYBR Safe DNA gel stain (Invitrogen, Thermo Fisher Scientific, Waltham, MA, USA), washed for 10 minutes, and photographed using Omega Lum G Imaging System (Aplegen, San Francisco, CA, USA). The DNA from unique band was retrieved by elution of the excised band into 20 µL of sterile double-distilled water (ddw) at 4°C overnight. Then 1 µL of eluted DNA was amplified using the same primers without GC clamp. A total of 30 µL of PCR reaction mixture contained the following: sterile ddw, master mix (MyTaq Mix, Bioline, London, UK), primers (each 0.2 mM), and 1 µL of eluted DNA. After a 4-minute initial denaturation at 95°C, the reaction mixture was run for 30 cycles based on the following condition: 95°C for 0.5 minutes, 56°C for 0.5 minutes, and 72°C for 1.5 minutes followed by 72°C for 7 minutes. Thereafter, all PCR products were analyzed on 1.5% agarose gel for 30 minutes at 100 V.
Sequencing and biodiversity analysis
PCR amplicon products from re-amplification of eluted DGGE gel bands were purified and sequenced in an external laboratory (FIRST BASE LABORATORIES SDN BHD, Selangor, Malaysia). The obtained chromatograms of DNA sequences were analyzed using Chromas 2.6.2 software (Technelysium, Brisbane, QLD, Australia). Then, all sequences were checked for chimeric sequences using a chimeric sequence detection software Decipher. 17 Homology searches were performed using sequences of −550 nucleotides, and close relatives were assigned by GenBank database through National Center for Biotechnology Information (NCBI) using BLAST program (https://blast.ncbi.nlm.nih.gov/Blast.cgi). Multiple alignments were conducted using MEGA version 7. 18 A phylogenetic tree was constructed using the Neighbor-joining analysis function of MEGA version 7 with 1000 replicates in bootstrap analysis. Distances were estimated with Jukes-Cantor correction. Thereafter, 3 alpha diversity indices (Margalef species richness, Simpson diversity index, and Shannon-Wiener index) and cluster analysis to compare the bacterial communities based on Bray-Curtis dissimilarity index were analyzed using PAST program version 3.15. 19
Statistical analysis
All data were presented as mean ± standard error in the table. Data analysis was performed using one-way analysis of variance (ANOVA) to determine the significance between the sperm quality and sperm microbiota from different locations using SPSS (version 18). Correlation was analyzed based on Pearson correlations using R version 3.5.1 with R Studio v. 1.1.45 (https://www.r-project.org/; https://www.rstudio.com/).
Nucleotide sequence accession numbers
The 16S rDNA sequences of the DGGE bands obtained in this study have been deposited to DDBJ/EMBL/GenBank under Accession No. MK779776-MK779795.
Results
Sperm quality and biodiversity of sperm microbiota
The results of sperm quality (sperm motility and concentration) and biodiversity index of the sperm microbiota in samples from different locations based on DGGE fingerprinting result (Figure 1) are presented in Table 1. The Pahang sample showed the highest sperm quality (sperm motility and concentration) and the UMT sample shows the lowest sperm quality, although there were no significant differences (P > .05) among the samples. On the other hand, the biodiversity index of the Ajil sample showed the highest values in the location sample, although there was no significant difference (P > .05) among the samples from each location (Table 1).

Denaturing gradient gel electrophoresis (DGGE) profile of PCR products of the V3-V5 region of 16S rDNA from Malaysian Mahseer sperm samples from different locations. Triplicates of samples were prepared for each location sample. PCR indicates polymerase chain reaction; UMT, Universiti Malaysia Terengganu.
Bacterial diversity and sperm quality of Malaysian Mahseer from different locations.
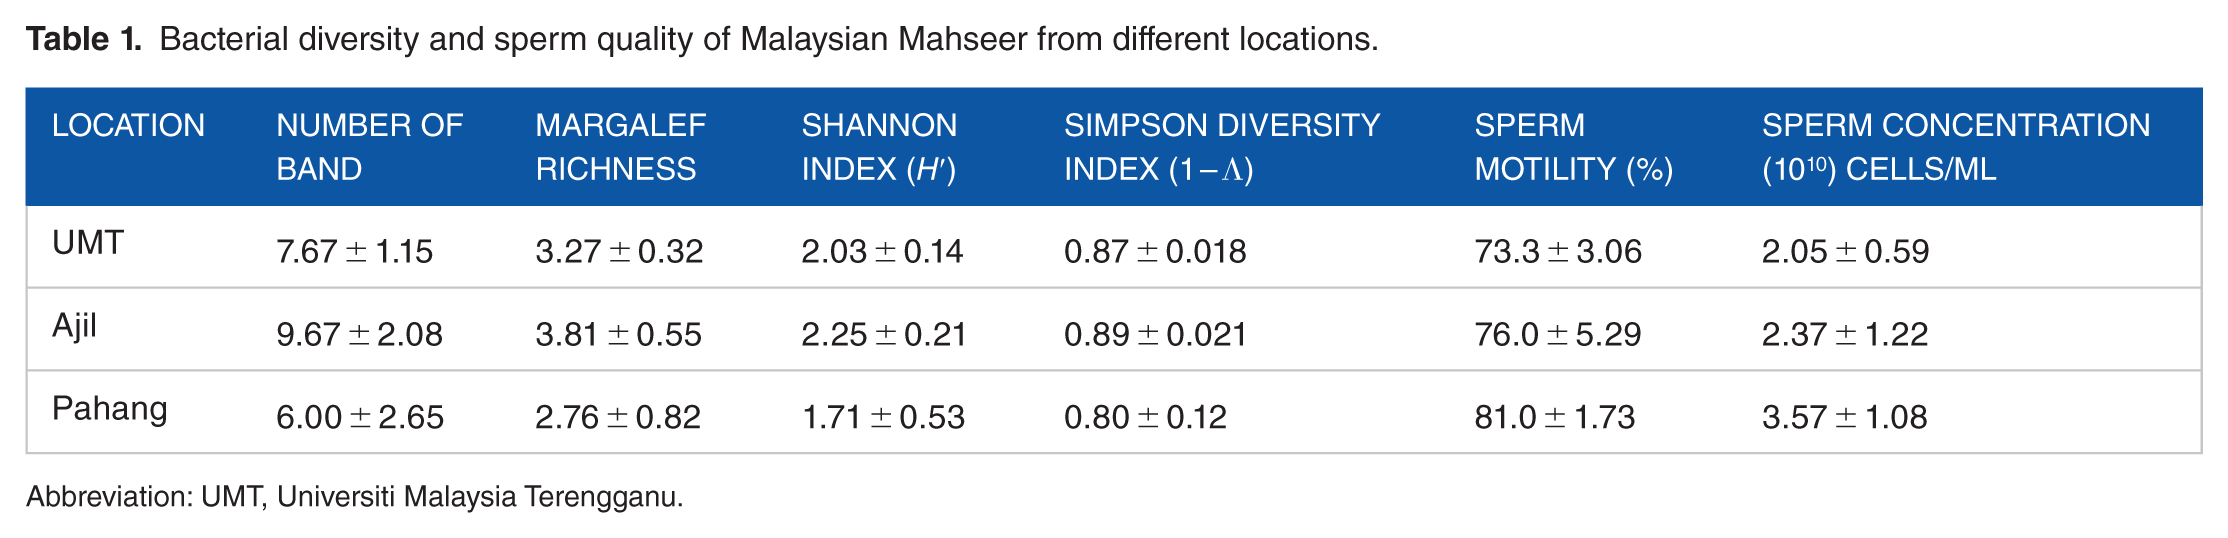
Abbreviation: UMT, Universiti Malaysia Terengganu.
DGGE fingerprinting, cluster analysis, and identification of sperm microbiota
To compare the structure of sperm microbiota from different locations, PCR-DGGE fingerprinting was conducted. In total, 21 unique bands (SPM1-20) were successfully excised and retrieved from DGGE gel (Figure 1). DGGE banding patterns and cluster analysis differed substantially between UMT and both Ajil and Pahang samples (Figures 1 and 2). Four bands (SPM 4, 10, 11, and 19) were found in samples from all locations. SPM 2, 3, 5, 6, 7, 16, 18, and 20 were found in either the Ajil and Pahang samples, the UMT and Ajil samples, or the UMT and Pahang samples. Eight bands (SPM 1, 8, 9, 12-15, and 17) were unique in each location sample (Supplemental Table 1). Partial 16S rDNA sequences (–550 bp) were assigned to their closest relatives based on comparison with the deposited sequences in GenBank database (Supplemental Table 1). The sequences of DGGE bands were diversely affiliated with α-Proteobacteria, β-Proteobacteria, γ-Proteobacteria, Bacilli, Bacteroidia, Cytophagia, Planctomycetia, and Actinobacteria (Figure 3). Bands SPM 3, 9, and 11 were closely related to the genus Staphylococcus, which belongs to Bacilli, and showed 95%, 99%, and 99% similarity, respectively. SPM 6, 7, and 12 were assigned to 1 genus of Sphingomonas spp. (α-Proteobacteria) with 99%, 95%, and 99% similarity, respectively. SPM 4, 5, and 10 were more than 98% similar to the genus Salinisphaera (γ-Proteobacteria), Caballeronia (β-Proteobacteria), and Pelomonas (β-Proteobacteria), respectively. SPM 2 was closely related to the genus Bacillus with 96% similarity, SPM 8 showed 98% similarity to Bacteroides sp., whereas SPM 14 and 15 were more than 95% similar to Mycobacterium sp. and Propionibacterium sp., respectively. SPM 20 was composed of the same cluster with Pseudonocardia sp. at 91% similarity. Six bands (SPM 1, 13, 16-19) were assigned as uncultivable bacteria with more than 98% similarity. Phylogenetic analysis showed that 3 of these uncultivable bacteria, SPM 1 and both SPM 17 and 18, were in the same cluster with the genus Flexibacter (Cytophagia) and Propionibacterium (Actinobacteria), respectively. SPM 13 was affiliated to Planctomycetia. Three uncultivable bacteria SPM 16, 18, and 19 were phylogenetically clustered as Actinobacteria.

Cluster dendrogram for comparison of sperm microbiota composition in samples from different locations based on PCR-DGGE fingerprinting profile using the Ward method. PCR-DGGE indicates polymerase chain reaction denaturing gradient gel electrophoresis; UMT, Universiti Malaysia Terengganu.
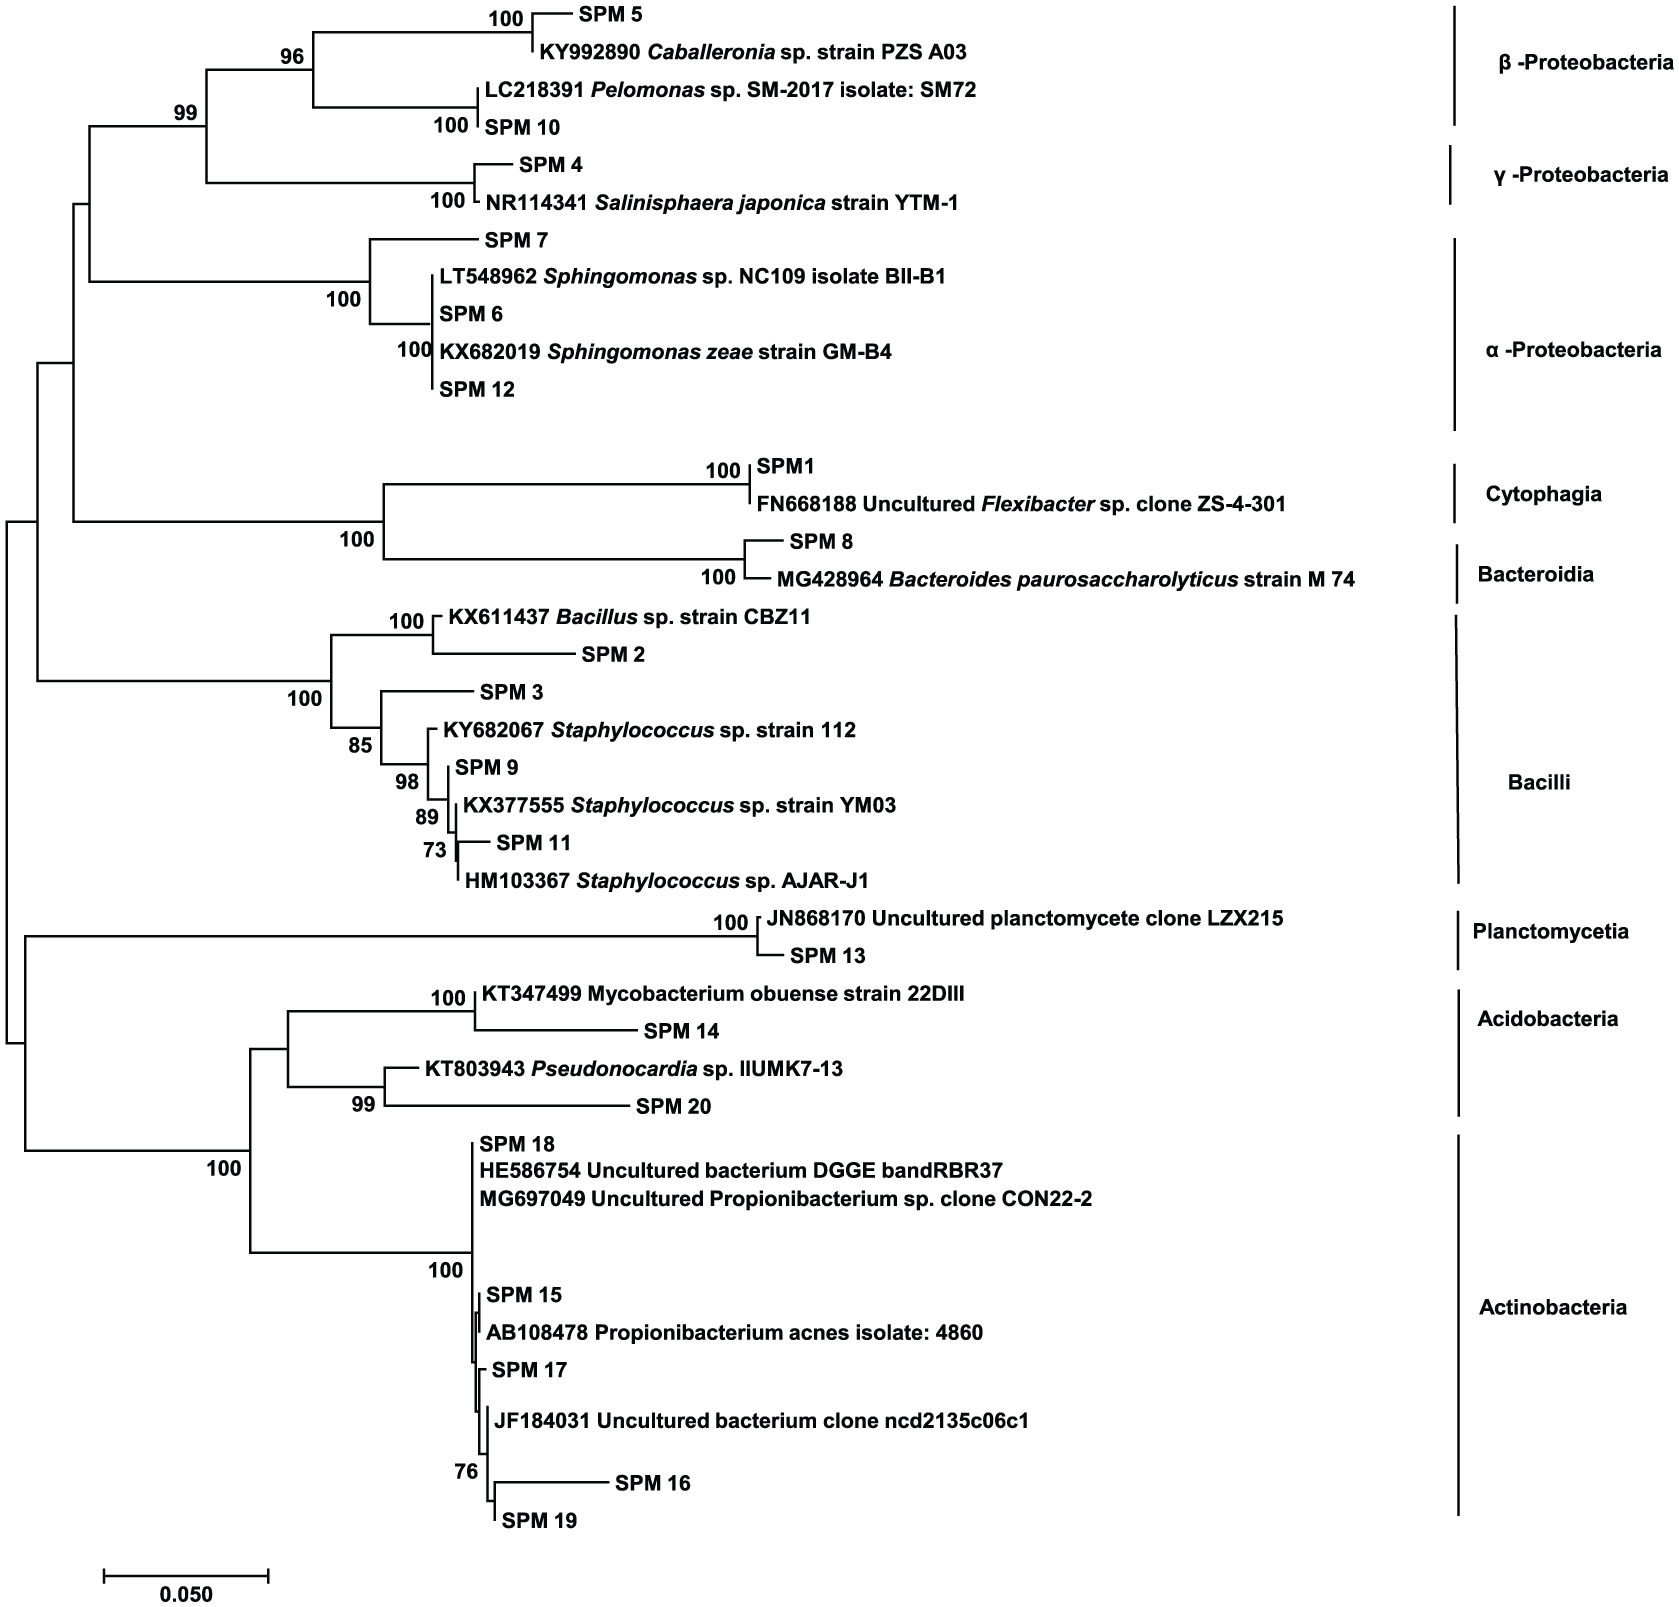
Neighbor-joining tree of partial 16S rDNA nucleotide sequence (ca. 550 bp) retrieved from DGGE bands shown in Figure 1. Bootstrap resampling was performed 1000 times. Bootstrap values above 70 are shown. DGGE indicates denaturing gradient gel electrophoresis.
There was a positive correlation between sperm motility and concentration in all location samples, albeit in various ranges (Figure 4). There was a positive correlation between bacterial biodiversity and sperm motility in the Ajil (0.98 as very strong) and Pahang (0.50 as moderate) samples, whereas the UMT sample had a moderately negative correlation (>–0.50 as moderate). On the other hand, in the case of bacterial diversity and sperm concentration, there was a strong negative correlation in the UMT and Pahang samples (>–0.70), whereas there was a positive moderate correlation in the Ajil sample.

Pearson correlation results among bacterial diversity, sperm motility, and sperm concentration in samples from different locations. No_B represents the number of DGGE band; Simp represents Simpson diversity index; Shan represents Shannon index; Marg represents Margalef richness; SM represents sperm motility; and SC represents sperm concentration. DGGE indicates denaturing gradient gel electrophoresis; UMT, Universiti Malaysia Terengganu.
Discussion
There are numerous studies of bacterial populations and their role in fish skin, gills, and the digestive tract, as well as internal organs such as the kidney, liver, and spleen. 20 To date, there are only a few reports on sperm-related bacteria, mainly from the perspective of biosafety, associated with the risk of pathogenic contamination during the semen preservation process.21–23 Loch and Faisal 24 suggested the possibility that fish sperm may be responsible for the transfer of fish pathogen, such as flavobacterial species, to fish egg during the process of fertilization. Similarly, in vitro insemination of cryopreserved sperm showed that bacteria present in cryopreserved sperm affected the fertilization capacity of sperm and was responsible for the bacterial transmission to embryos. 25 These results suggest the importance of revealing sperm microbiota composition and its relationship with sperm quality, as there is still a paucity of investigations on sperm microbiota. Boonthai et al 21 indicated that appropriate sperm collection methods could reduce sperm-related bacterial abundance; however, there was no significant difference in sperm quality. In this study, there was a correlation between bacterial diversity and sperm quality, and no known pathogenic bacteria, such as F psychrophilum, were found in any of the 3 different locations. Interestingly, there was a different correlation trend between the UMT sample and both the Ajil and Pahang samples. This might be due to the culture system, which for UMT is a closed circulation tank system, whereas for both Ajil and Pahang is an open pond culture system. In closed circulating systems, there is a disinfection process before water is introduced to the culture tanks, whereas in the pond system the water continuously flows through with no disinfection. Therefore, there is a higher possibility for the pond system to have greater bacterial diversity compared with the closed system. This is supported by Boonthai et al 26 who indicated that the main source of bacterial intrusion route to sperm seemed to be mainly culture water. However, we did not analyze culture-water-related microbiota and their environmental factors. Therefore, further research on the influence of different culture systems, including water quality and culture-water-related microbiota, on sperm quality and sperm microbiota is necessary.
There is only speculation on the role of intracellular bacteria on fish sperm, such as the novel theory that the bacteria Verrucomicrobia is responsible for the origin of the flagellum, as it contains tubulins, which are a prerequisite for flagellum formation. 27 Although spermatogenesis in fish is similar to that of other non-mammalian organisms, the control mechanisms are still unclear. In this study, sperm microbiota showed phylogenetic diversity, including Proteobacteria, Firmicutes, and Actinobacteria. Some bacteria, such as Pelomonas sp., Salinisphaera sp., and Staphylococcus sp., were detected in all locations, suggesting that Malaysian Mahseer sperm microbiota was predominantly composed of these bacterial species. Genus Pelomonas was detected from the gut of cobia, milkfish, and pompano, 28 and possessed cellulolytic and diazotrophic activity. 29 Interestingly, Sphingomonas spp. were found only in the pond culture system sperm samples. Both Sphingomonas spp. and Staphylococcus spp. have previously been found in Barbodes gonionotus sperm and sturgeon eggs as a result of contamination from culture water or other organs.26,30 Sphingomonas spp. was also found to be a core member related to fish skin microbiota.31,32 In addition, it is also known that Sphingomonas spp. has the ability to produce exopolysaccharide (EPS), which has various physicochemical properties, such as stability to extreme condition and suitability to various environmental applications, such as an enhancer of hydrocarbon biodegradation and bioemulsification. 33 There were some reports on fish-related Staphylococcus spp., which is a member of fish gut microbiota and has an important role in the contribution of the nutritional process, especially lipolytic aspect.34–36 All these data suggest that Pelomonas sp., Sphingomonas spp., and Staphylococcus spp. may play an important role in spermatogenesis in fish testis, even though the bacterial intrusion route is different. On the other hand, there is no report on the detection of Salinisphaera sp. from fish sperm, unlike Pelomonas sp., Sphingomonas spp., and Staphylococcus spp. Genus Salinisphaera inhabits brine water, such as marine and hypersaline environments, 37 and possessed esterase, which hydrolyzed the acyl group. 38 It is known that freshwater seminal plasma osmolarity is around 300 mOsmol kg−1, which is equal to 1% NaCl concentration. 39 The results suggest that Salinisphaera sp. is a core member of sperm microbiota, although further research is needed to unveil the role of these bacteria in sperm.
In our study, the sequence result of unique DGGE band showed the presence of 1 bacterial clone (Bacteroides sp.) from the UMT sample and Mycobacterium sp. from the Ajil sample. Moreover, Bacillus sp. and Caballeronia sp. were found in both the UMT and Pahang samples, whereas Pseudonocardia sp. was found in both UMT and Ajil. Bacillus spp. was previously found not only in fish skin and gut 32 but also in iodine-treated sturgeon eggs, 30 silver barb sperm, 20 and white shrimp sperm. 40 Genus Bacteroides, Mycobacterium, and Pseudonocardia are common bacteria in fish rearing systems.41,42 Caballeronia sp. is a member of β-Proteobacteria, which is a plant-associated non-pathogenic bacteria. 43 Moreover, both Bacillus sp. and Bacteroides sp. found in this study may be used as probiotics for the improvement of sperm quality, because these bacteria are antagonistic to pathogenic bacteria and/or positively affect the host immune response.44–46 Interestingly, we have not detected Aeromonas spp. in this study, although this species is commonly found in sperm of freshwater fish species as contamination from outside source.21,47,48 Moreover, genus Aeromonas is a ubiquitous species in freshwater ecosystem and a predominant species in the Malaysian Mahseer gut microbiota. 49 This suggests that there was no contamination from outside sources, such as culture water and other inner organs, in our study, although further research is needed to confirm the effect of surrounding environmental microbiota on sperm microbiota.
This is the first report on Malaysian Mahseer (T tambroides) sperm microbiota from 3 different broodstock locations using the PCR-DGGE fingerprinting method and studying the correlation between sperm quality and sperm microbiota biodiversity. Our results demonstrate the phylogenetic diversity of sperm microbiota and the possibility of the influence of water quality on sperm quality and sperm microbiota construction. In addition, it is possible that some bacteria are indigenous bacterial members in the Malaysian Mahseer sperm microbiota and could be used as probiotics to improve sperm quality.
Supplemental Material
supplemental_table_1_revision – Supplemental material for Molecular Characterization of Microbiota Associated With Sperm of Malaysian Mahseer Tor tambroides
Supplemental material, supplemental_table_1_revision for Molecular Characterization of Microbiota Associated With Sperm of Malaysian Mahseer Tor tambroides by Ivan Chong Chu Koh, Bin Hassan Badrul Nizam, Yazid Muhammad Abduh, Ambok Bolong Abol Munafi and Shumpei Iehata in Evolutionary Bioinformatics
Footnotes
Acknowledgements
We would like to thank Institute of Marine Biotechnology for allowing usage of the Decipher Denaturing Gradient Gel Electrophoresis machine.
Funding:
The author(s) disclosed receipt of the following financial support for the research, authorship, and/or publication of this article: This research was supported financially by the Research Acculturation Grant Scheme (RAGS) vot 57120, Ministry of Higher Education, Malaysia.
Declaration of conflicting interests:
The author(s) declared no potential conflicts of interest with respect to the research, authorship, and/or publication of this article.
Author Contributions
ICCK and SI designed the study, and SI wrote manuscript. BHBN conducted culture experiment and data analysis. ABAM and YMA provide and assisted in fish rearing. All authors read and approved the final manuscript.
Supplemental Material
Supplemental material for this article is available online.
References
Supplementary Material
Please find the following supplemental material available below.
For Open Access articles published under a Creative Commons License, all supplemental material carries the same license as the article it is associated with.
For non-Open Access articles published, all supplemental material carries a non-exclusive license, and permission requests for re-use of supplemental material or any part of supplemental material shall be sent directly to the copyright owner as specified in the copyright notice associated with the article.