
Abstract
In plant-pathogen interaction systems, plant metabolism is usually agitated in the early stages of infection and much before visible symptoms appear. To identify the latent infection of strawberry by Botrytis cinerea by metabolome profiling, a metabolomics method based on gas chromatography and mass spectrometry was applied to identify the affected metabolites and discriminate diseased plants from healthy ones. An orthogonal partial least squares (OPLS) score plot showed that the metabolic profiling well separated B. cinerea-infected strawberry plants at 2, 5, and 7 days after infection from non-infected healthy plants. Combined analysis of variance (ANOVA) and OPLS analysis revealed candidate biomarkers of plant resistance and of infection and expansion of the pathogen in the plants. Among them, hexadecanoic acid, octadecanoic acid, sucrose, β-lyxopyranose, melibiose, and 1,1,4a-Trimethyl-5,6-dimethylenedecahydronaphthalene were closely related to the early stage of disease development when symptoms were not visible. A discrimination method that could distinguish Botrytis gray mold diseased strawberry plants from healthy ones was established based on the partial least squares discriminant analysis (PLS-DA) model with a correct recognition accuracy of 100%. This research offers a good application of metabolome profiling for early diagnosis of plant disease and interaction mechanism exploration.
Introduction
Strawberry plants (Fragaria × ananassa) cultivation has changed from seasonal land-based cultivation to counter-season cultivation such as mulching and greenhouse cultivation, and as a result, strawberry plants increasingly are suffering serious diseases, including gray mold, anthracnose, and powdery mildew. 1 Gray mold is caused by Botrytis cinerea, a necrotrophic fungus, and is one of the most serious diseases that affect strawberries. It often results in a large amount of fruits rotting during harvest, storage, or transportation, causing serious economic losses.
Early diagnosis of disease in plants may help plants a successful protection from bad damage. A big challenge in dealing with latent pathogen infection is how to choose the appropriate time to apply fungicides. During pathogen infection, plant metabolism is usually agitated. Therefore, metabolomics may help to identify biomarkers and pathways related to plant-pathogen interactions that can be used to diagnose disease during the latent infection stage of some pathogens in crops, as well as to provide metabolic clues for elucidating the host-pathogen interaction mechanism.2,3
There is still only limited knowledge about how host-pathogen interactions affect the host’s metabolome. More than 200 000 kinds of metabolites have been found in plants; 4 some are primary metabolites necessary for maintaining plant life, growth, and development and some are secondary metabolites that are produced by primary metabolites and are closely related to plant stress. 5 When plants are infected by pathogens, small-molecule metabolites such as cellular signal transduction substances, primary metabolites, and secondary metabolites are adjusted in response to the infection. These adjustments include a number of complex cell rearrangements that rely mainly on changes in gene expression, protein modifications, and the induction of various compounds that are active in the defense response. Connecting phenotype and genes, metabolomics has recently proved to be effective in fully understanding specific changes in plant metabolites caused by external stimuli6,7 and has played an important role in the study of host-pathogen interactions.5,8–16 Steinfath et al 17 for the first time showed that metabolomics can be used to predict important phenotypes of crops grown in different environments and confirmed that tyrosine was a potential indicator of the sensitivity of black spot bruising to potato tissues.
There have been reports of research that metabolites have played an important role in the interaction between host and pathogens.18–20 The changes in metabolism caused by the interaction between B. cinerea and strawberry are not yet clear. Here, a comparative metabolome method based on gas chromatography and mass spectrometry (GC-MS) was applied to B. cinerea-infected and non-infected strawberry plants to look for biomarkers associated with pathogen infection and to setup a diagnostic partial least squares discriminant analysis (PLS-DA) method. The aim was to further understand the interaction mechanism between B. cinerea and strawberry plants and provide technical support for the early diagnosis of Botrytis gray mold disease in strawberry.
Materials and Methods
Fungus strain
Strain B. cinerea 52 was isolated from strawberry plants grown in strawberry professional cooperatives of Beijing in 2014. Genomic DNA was extracted from the isolates using the cetyltrimethylammonium bromide (CTAB) method as described by Angelini et al. 21 The DNA concentration of each sample was measured on a spectrophotometer at 260 and 280 nm, and their genomic purity was determined. The isolates were identified as B. cinerea based on morphology and the DNA sequences of three nuclear genes: glyceraldehyde-3-phosphate dehydrogenase (G3PDH), heat-shock protein 60 (HSP60), and DNA-dependent RNA polymerase subunit II (RPB2). 22
Collection and pretreatment of samples
Strain B. cinerea 52 was cultivated on potato dextrose agar (PDA). After incubation in the dark for 4 days at 20°C, mycelial plugs (5 mm) were taken from the colony margin and transferred to fresh casein (CA) and incubated in the dark for 4 days at 20°C and then under ultraviolet light for 4-8 days. Conidia were recovered by flooding the cultures with sterile distilled water containing surfactant (Tween 20, 0.05%) and rubbing the sporulating colony with a bent glass rod. The spore suspension was filtered through four layers of sterilized cheesecloth and collected on a membrane filter (pore size = 5 μm) under vacuum. The conidia were counted with a hemocytometer and the suspension was diluted to 105 conidia/mL in water for use as inoculum. 23
The strawberry variety of “Hong Yan” susceptible to gray mold was used in the study. The strawberry plants were potted in a peat:sand (50:50) compost and cultivated in a heated glasshouse at 20°C with one plant per pot. Conidial germination requires dark conditions, so the inoculations were performed at about 7: 00 p.m. Before inoculation, the surfaces of the leaves were washed with sterilized water and then blotted with water-absorbent paper. A 25-mL spore suspension was sprayed uniformly on the aerial parts of the whole potted plants. After inoculation, the pots were placed in a water tray and sealed with plastic film. Strawberry plants inoculated with B. cinerea were placed in the dark for 12 hours at 20°C and then cultured under natural light conditions. The plastic film was removed after 3 days of incubation. The whole process was conducted in a greenhouse. Each set of B. cinerea-treated and control plants had 18 repetitions. The control plants were inoculated with sterilized water containing surfactant (Tween 20, 0.05%) and then treated in the same way as the treated plants.
All the strawberry leaves in every repetition were harvested 2, 5, and 7 days after inoculation with sterilized scissors. Harvested samples were immediately quenched in liquid nitrogen and stored at −80°C until further processing. The metabolites were extracted from the leaf samples and derived as reported previously 24 with some modification. Briefly, each of the frozen leaf samples was milled to a fine powder with a liquid nitrogen pre-cooled mortar. The homogenized samples (100 ± 2 mg fresh weight) were weighed into 2.0 mL Eppendorf tubes and extracted with 1.8 mL of pre-cooled methanol:water (4:1, v/v) containing 10 µg/mL salicin as the internal standard by vortexing for 1 minute and then resting in an ultrasonic bath at room temperature for 20 minutes. The samples were centrifuged at 14 000×g for 15 minutes at 4°C, and then, 600 μL of the supernatant was transferred into 0.6 mL centrifuge vials. The samples were evaporated overnight using a centrifugal evaporator (Labconco, Eppendorf, Concentrator plus) at 45°C. For derivatization, 100 μL of methoxyamine hydrochloride in pyridine (20 mg/mL) was added to the dried extractions prior to incubation at 30°C for 2 hours. Then, 100 μL of N,O-bis(trimethylsilyl) trifluoroacetamide containing 1% trimethylchlorosilane (v/v) was added, and the mixtures were incubated at 37°C for 6 hours. After centrifuging at 14 000×g for 15 minutes, 160 μL of supernatant was transferred to vials for detection. All the solutions were tested within 48 hours.
Methanol (chromatographically pure) was purchased from the Sinopharm Chemical Reagent Co., Ltd (Shanghai, China). Ultrapure water was obtained from a milli-Q system (Millipore). N,O-bis(trimethylsilyl) trifluoroacetamide (v/v; containing 1% trimethylchlorosilane [99%], pyridine [99.8%], and methoxyamine hydrochloride [8%]), the internal standard salicin, and the 40 metabolite standards with active ingredients >99% were purchased from Sigma-Aldrich.
Gas chromatography and mass spectrometry analysis
For separation and detection of analytes, an Agilent 7890A gas chromatograph coupled to a 5975C inert XL mass selective detector (MSD; Agilent Technologies, Waldbronn, Germany) was used. The instruments were controlled by ChemStation software (Agilent Technologies, version E.02.01.1177). The syringe was cleaned with acetone three times before each use. A volume of 1 µL of the liquid sample was injected into the split/splitless injector at 250°C in split mode using a split ratio of 25:1. An HP-5ms capillary column (30 m × 0.25 mm × 0.25 µm; Agilent Technologies) was operated at a constant flow of 1 mL/min helium. The oven was kept at 65°C for 2 minutes and then heated to 185°C (5°C/min), to 200°C (1°C/min), and then to 280°C (15°C/min) and kept at this temperature for 5 minutes. The MSD interface was kept at 290°C throughout the run. After 5 minutes of solvent delay, the MSD was used in scan mode m/z 20-650. The electrospray ionization source was kept at 230°C and the transmission line was at 230°C. All samples were measured in a randomized manner.
Data analysis
Qualitative and quantitative analyses were carried out by GC-MSD data analysis and the NIST mass spectrometry database (MS 2.2). For analysis of variance (ANOVA), a multiple comparison between means was done using a least significant difference (LSD) test (P ⩽ 0.05) using the IBM SPSS Statistics (version 21) software. 25 Detection of biomarkers in the metabolic profiles was based on orthogonal partial least squares (OPLS) regression coefficients, and standard errors were calculated using jack-knifing with 95% confidence interval. 26 The performance of the developed models was assessed by the cumulative fraction of the total variation of the X’s that could be predicted by the extracted components (Q [cum] 2 ) and the fraction of the sum of squares of all X’s and Y’s explained by the current component (R2X and R2Y, respectively). For PLS-DA, two-thirds of the samples obtained from the experiment were selected randomly as the training set, and the remaining one-third was the testing set. The training set samples were first assigned as follows: the inoculated strawberry leaf samples obtained at the three sampling times had a value of 1; and the healthy samples had a value of 0. The PLS algorithm in the Unscrambler software 27 was used to conduct regression analysis on the GC-MS data of the training set samples and the categorical variables of the samples. Cross-validation was carried out using the leave-one-out method. The established PLS model was used to discriminate diseased from healthy plants in the validation set samples.
Results and Discussion
Metabolic profiles of strawberry leaves
A representative total ion chromatogram of the metabolome of strawberry leaves inoculated with B. cinerea is shown in Figure 1. A total of 249 peaks were detected. The chromatographic peaks are qualitative based on the retention time and mass spectral characteristics of the standards. In addition, metabolites with matching degrees >80% were identified by NIST MS 2.2 library searches. The metabolome of the strawberry leaves consisted mainly of sugars, organic acids, amino acids, and alcohols.

Representative GC-MS total ion chromatograms of crude extracts using a mixture of methanol:water (4:1, v/v) of strawberry leaves incubated with B. cinerea. GC-MS indicates gas chromatography-mass spectrometry.
Effects of B. cinerea on metabolome of strawberry plants
Gray mold in strawberry has a long latency period between infection and the appearance of symptoms. 28 B. cinerea usually infects strawberry inflorescences, causing flower death, especially during continuous rainy days, or it establishes symptomless infections, where the pathogen remains latent until the fruit ripens. In this study, the plants infected with B. cinerea had no visible symptoms of gray mold on their leaves, but later a layer of gray mold was found on the calyx of infected plants. Here, we tested the hypothesis that the B. cinerea-infected strawberry plants could be discriminated from the healthy plants in the latent period based on the composition of their metabolomes, which reflects the metabolic interaction between the plant and the pathogen.
The multivariate statistical analysis method has been successful in separating biological samples with and without external stimuli. 29 Such separation was based on comprehensive comparative analyses between the metabolite profiles of different groups of samples. We subjected the metabolite profiles of the strawberry leaves to OPLS analyses to classify and detect potential biomarkers for B. cinerea infection. Trends within the data were visualized in an OPLS score plot (Figure 2), where each GC-MS spectrum (ie, a metabolite profile) is represented by a symbol and grouped with the next most similar spectrum or group of spectra. Figure 2 shows that the GC-MS spectrum for an individual sample is clustered closely with the spectra for other samples from the same treatment group. Good separation was obtained for both the B. cinerea-infected and control plants at the three sampling times (2, 5, and 7 days after inoculation), with 38% of the Factor-1 (predictive component) variables accounting for 97% of the Factor-2 (orthogonal component) variables. Our findings confirmed that the metabolite profiles contained useful information related to changes in metabolism that were valuable for separating diseased plants from healthy ones and showed that pathogen inoculation caused changes in the plant metabolome even in the latent period after infection.

OPLS score plot of the metabolite profiles of strawberry leaves with or without B. cinerea incubation for 2, 5, and 7 days. Factor-1 is the predictive component and Factor-2 is the first orthogonal component. The ellipse shows Hotelling T2-range (significance level 0.05). B. cinerea-infected plants at 2 days after inoculation (); controls at 2 days ( ); B. cinerea-infected plants at 5 days after inoculation (
 ); controls at 5 days (
 ); B. cinerea-infected plants at 7 days after inoculation (
 ); controls at 7 days (
 ). Here, Factor-1 and Factor-2 refer to the first and the second Factors used to explain the variance. OPLS indicates orthogonal partial least squares.
The “global” metabolite analysis of the GC-MS spectra confirmed that B. cinerea-infected strawberry plants had different metabolic components compared to healthy plants. In the OPLS loading plot (Figure 3), the metabolic profiles contributed greatly to the observed discrimination of the samples, clearly reflecting their cellular metabolic diversity. In general, the different sample groups held dissimilar amounts and types of metabolites, resulting in distinctive metabolite profiling. The metabolites with the lowest and highest Factor-1 values contributed more than 50% to distinguishing between the treated and control plants and were closely related to the discrepancy between the different groups separated on the score plot (Figure 2). Variations in the content of mainly organic acids, alcohols, and sugars in the strawberry leaves contributed most to the observed separation between the healthy and diseased groups and are good candidates to be biomarkers for the diagnosis of strawberry gray mold.

Correlation loading plot of the predictive component of the OPLS based on the metabolite profiles of strawberry leaves with or without B. cinerea incubation for 2, 5, and 7 days. The correlation loadings plot contained two ellipses that indicated how much variance was considered by the model. The outer ellipse represented the unit circle, corresponding to 100% of the explained variance, while the inner ellipse corresponded to 50% of the explained variance. The dot represents that metabolites (name not provided) close to the outer ellipse were important for distinguishing between the inoculated and control samples. Encircled metabolites (name not provided) contributed considerably to the separation of samples on the scores’ plot. Here, Factor-1 and Factor-2 refer to the first and the second Factors used to explain the variance. OPLS indicates orthogonal partial least squares.
Signatory metabolites for the discrimination of strawberry plants incubated with/without B. cinerea
To determine significant fluctuations in the signatory metabolites in the B. cinerea-infected plants, the metabolites identifies by the OPLS analysis were tested using one-way ANOVA. Table 1 listed the metabolites whose content had changed significantly at least once in 3 sample collection time points. As shown in Table 1, there were 16 metabolites selected from the multivariate OPLS approach were found to have changed significantly in a univariate one-way ANOVA in the infected plants at 2 days after inoculation compared with the controls. There were 13 metabolites whose content increased and 3 metabolites whose content decreased in the infected plants. In the infected plants, 5 days after inoculation, 14 metabolites were found to have changed significantly. Among them, the content of 13 metabolites increased and the content of 1 metabolite decreased. For the infected plants 7 days after inoculation, 13 metabolites were found to have changed significantly. Among them, the content of 11 metabolites increased and the content of 2 metabolites decreased. Among them, hexadecanoic acid, octadecanoic acid, sucrose, β-lyxopyranose, melibiose, and 1,1,4a-Trimethyl-5,6-dimethylenedecahydronaphthalene content continuously increased after inoculation. These metabolites were considered as tentative biomarkers closely related to B. cinerea infection.
Metabolites with significant differences in B. cinerea-infected strawberry plants compared with the controls.

Abbreviations: ANOVA, analysis of variance; RT, retention time.
The table listed the metabolites whose content had changed significantly at least once in 3 sample collection time points. “Change fold” column showed the amount of the metabolites content changed in samples incubated with B. cinerea compared to without ones. The numbers greater than 1 represent the upregulation of metabolites and less than 1 represent the downregulation of metabolites.
The content of metabolites changed significantly (P ⩽ 0.05) in a one-way ANOVA.
It has been found that products of the cell signal transduction pathway and system resistance pathway are the first to change in plants after infection by pathogens, followed by changes in the primary metabolism, secondary metabolites, and metabolites related to tissue structure. 3 In this study, we found that in the initial phase of infection with B. cinerea, the content of the signal metabolite inositol increased, which is consistent with the previous report. 30 Hexadecanoic acid and octadecanoic acid, which are used for the synthesis of jasmonic acid, increased in infected plants, revealing a disturbance of the jasmonic acid pathway and possible activation of a series of defense reactions. 31 Primary metabolites such as malic acid, fructose, galactose, and pyruvic acid contribute to the physiological or morphological adjustment of strawberry plants to restrain the invasion of pathogens. For example, glucose is a precursor of shikimic acid and is also a constituent monomer of cellulose and hemicellulose, and their high content is related closely to the resistance of plants to pathogens. 32 In addition, jasmonic acid can stimulate the production of phenolic substances. 33 This study specifically selected strawberries of susceptible varieties as research materials. If the strawberry of the resistant variety was selected as the material, different biomarkers or signaling components may be obtained. Further studies are needed to clarify the functions of the tentative biomarkers in the interaction between B. cinerea and strawberry.
Partial least squares discriminant analysis-based metabolic fingerprinting of strawberry plants incubated with/without B. cinerea
In this study, we established a model for discriminating diseased strawberry plants from healthy plants. According to the ratio of the training and testing set (2:1), we collected 36 samples and randomly selected 24 samples as the training set, so the remaining 12 samples were used as the testing set. The regression analysis of the GC-MS data and the categorical variables of the training set were carried out based on PLS, to establish a discriminant model of the strawberry plants with gray mold disease. As shown in Figure 4, the model clearly separated the B. cinerea-infected plants from the controls, with 35% of the Factor-1 variables accounting for 98% of the Factor-2 variables. Based on these results, we consider that the model has high reliability and can be used for discriminant analysis.

PLS-DA score plot of the metabolome of strawberry leaves with or without B. cinerea incubation. Factor-1 is the predictive component and Factor-2 is the first orthogonal component. The ellipse shows Hotelling T2-range (significance level 0.05). B. cinerea-infected plants () and healthy controls ( ) in the testing sets. Here, Factor-1 and Factor-2 refer to the first and the second Factors used to explain the variance. PLS-DA indicates partial least squares discriminant analysis.
As can be seen from Figure 5, the discriminant model of strawberry plants infected with B. cinerea but without gray mold symptoms established by PLS regression was good. The regression lines of the calibration and verification results of the model basically coincide. The correlation coefficient between the correction value of the indicator variable and the verification value of the model were all >0.946. The calibration line passed through the origin and the validation line was close to the origin (Figure 5). The root mean square errors (RMSEs) of the calibration and verification results were 0.0434 and 0.1210 (close to 0), the offsets were 0.0038 and 0.0499 (close to 0), and the slopes were 0.9925 and 0.8853 (close to 1), respectively. These parameters indicate that the discriminant model fits well.
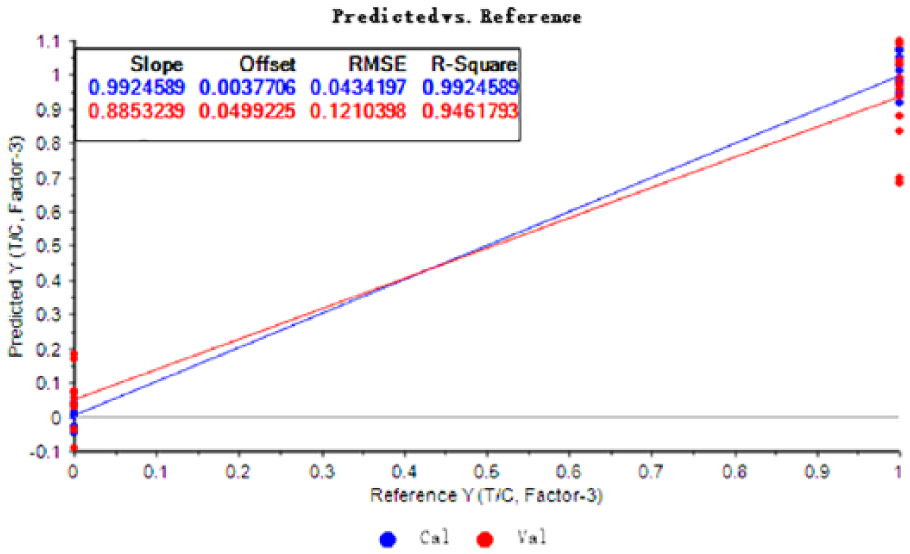
PLS-DA based on the metabolome of strawberry leaves with or without B. cinerea incubation. PLS regression chart of the real and predicted values obtained using the calibration model for sample classification variables. Here, T refers to treatments, C refers to controls, Cal refers to calibration, Val refers to validation, while Factor-3 refers to the third Factor used to explain the variance. PLS-DA indicates partial least squares discriminant analysis; RMSE, root mean square error.
The established model was used to discriminate the 12 testing samples. All the samples had low prediction errors close to 0.1, as shown in Table 2. The Ypred (predicted) values of samples 1-6 were all >0.5, which is close to 1, and were judged to be the infected samples, whereas the Ypred values of samples 7-12 were all <0.5, close to 0, and were judged to be controls. All 12 samples were correctly discriminated, indicating that the PLS-DA model can well discriminate B. cinerea-infected strawberry plants from healthy ones, and the identification accuracy for these samples was 100%.
Identification of the PLS-DA model for strawberry plant testing samples.
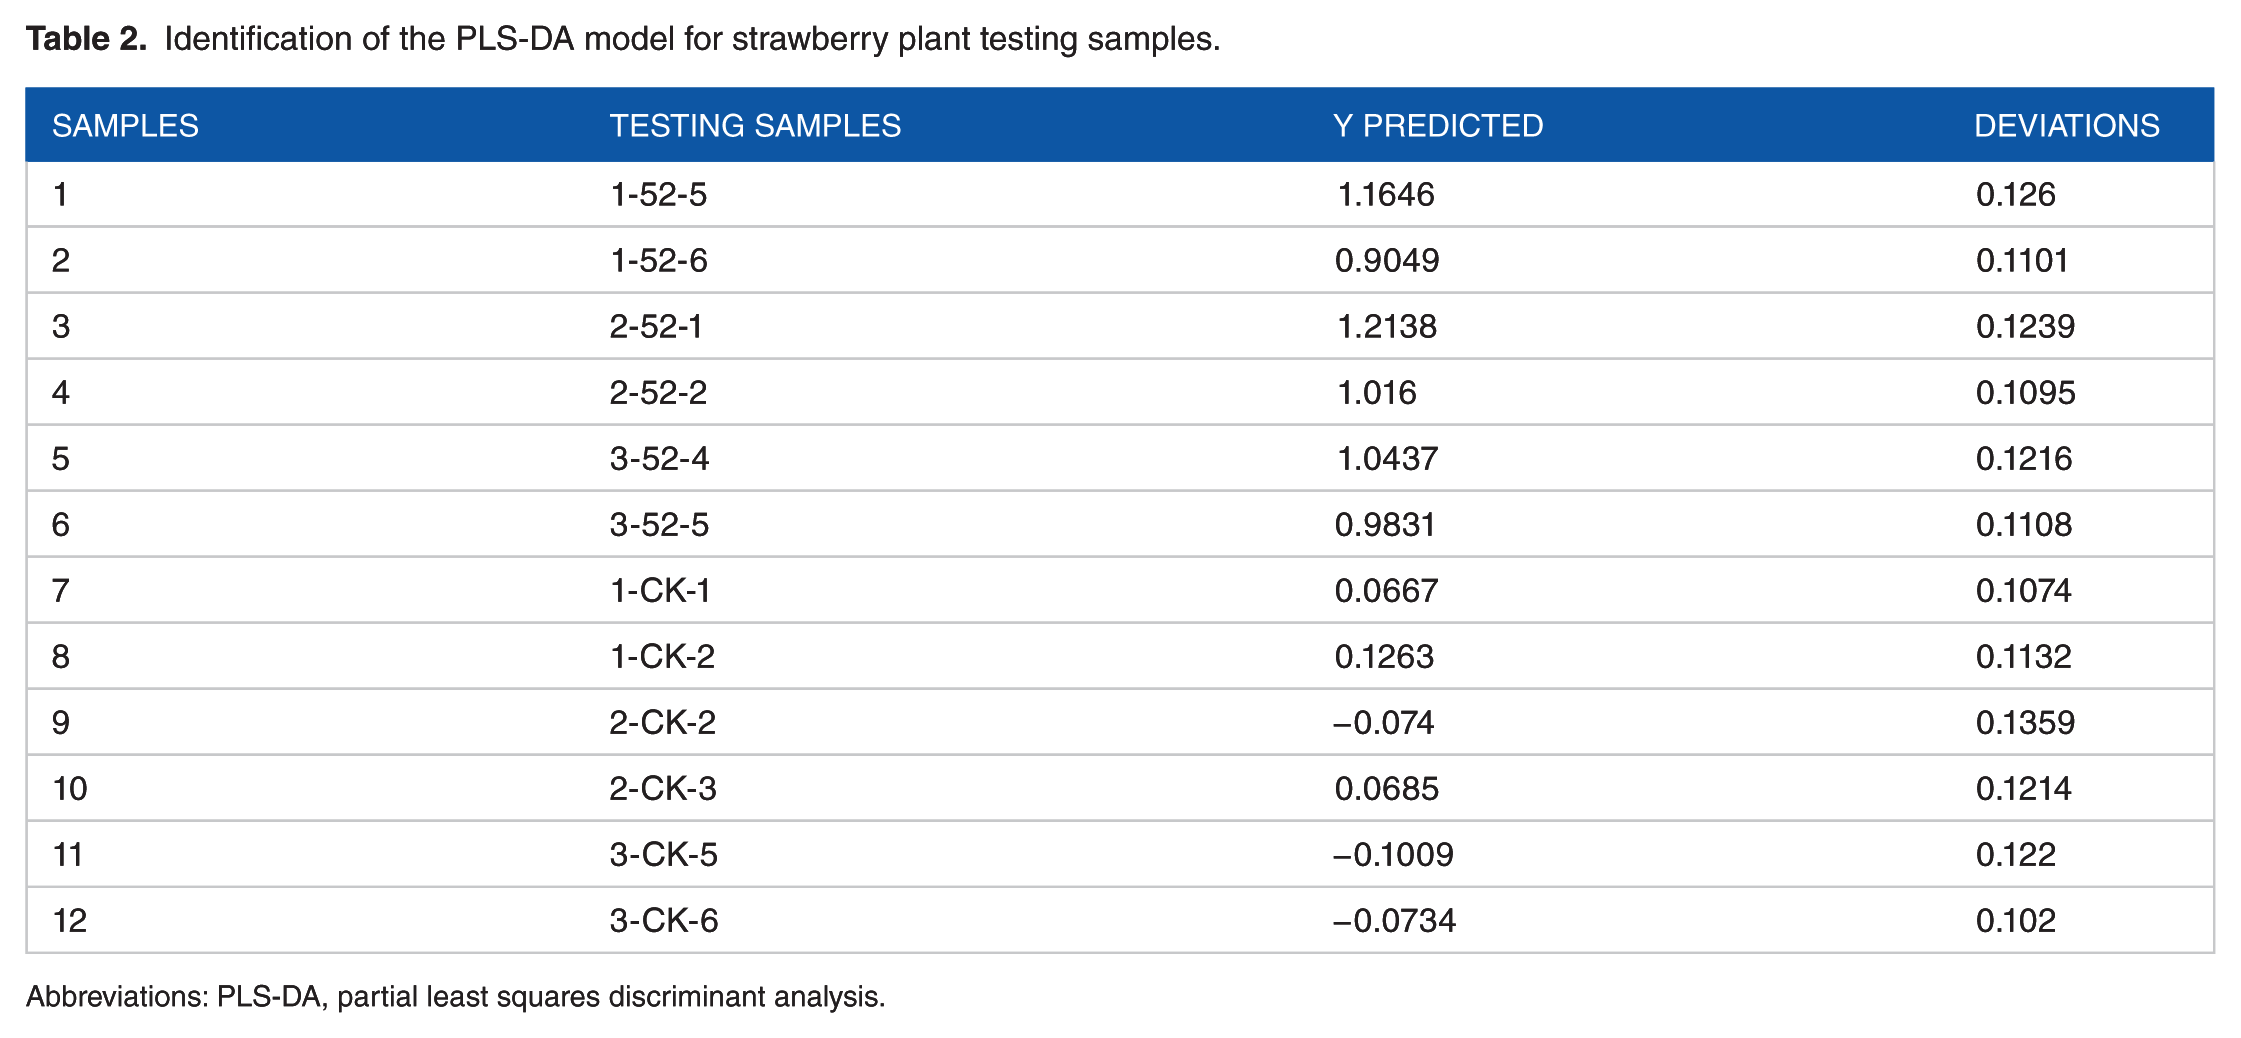
Abbreviations: PLS-DA, partial least squares discriminant analysis.
The diagnosis model of strawberry gray mold disease presented here needs to be used with larger sample sizes and with different diseases to verify its usefulness as a guide in the early diagnosis of strawberry diseases in the field.
Conclusion
B. cinerea caused changes in the metabolome of the leaves of infected strawberry plants. Signatory metabolites that fluctuated before visible symptoms appeared were obtained based on OPLS and contributed to the distinction between healthy and diseased plants. The PLS-DA model that was established based on the metabolome successfully diagnosed latent infestation by B. cinerea.
Footnotes
Funding:
The author(s) disclosed receipt of the following financial support for the research, authorship, and/or publication of this article: This work was funded by the National Key R&D Program of China (2017YFD0200307) and the Special Fund of the National Science Foundation of China (31772192).
Declaration of conflicting interests:
The author(s) declared no potential conflicts of interest with respect to the research, authorship, and/or publication of this article.
Author Contributions
PFL conceived the idea and guided the overall design of the experiments. ZHH ran the GC-MS of the metabolome, analyzed part of the data, and drafted the manuscript. XNC conducted the in-field experiments and collected plant samples. TD analyzed part of the data. PQL and GZW processed the pretreatment. PFL and ZHH helped in responding to peer reviewers’ comments. PFL made critical revisions and approved the final version. ZQH was responsible for the cultivation and management of strawberry seedlings in the greenhouse. While XLL contributed to article conception and data analysis. All authors read and approved the final manuscript.