
Abstract
Current research has identified several potential biomarkers for lung cancer diagnosis or prognosis. However, most of these biomarkers are derived from a relatively small number of samples using algorithms at the gene level. Hence, gene expression signatures discovered in these studies have little overlaps. In this study, we proposed a new strategy to identify biomarkers from multiple datasets at the pathway level. We integrated the genome-wide expression data of lung cancer tissues from 13 published studies and applied our strategy to identify lung cancer diagnostic and prognostic biomarkers. We identified a 32-gene signature that differentiates lung adenocarcinomas from other lung cancer subtypes. We also discovered a 43-gene signature that can predict the outcome of human lung cancers. We tested their performance in several independent cohorts, which confirmed their robust prognostic and diagnostic power. Furthermore, we showed that the proposed gene expression signatures were independent of several traditional clinical indicators in lung cancer management. Our results suggest that the pathway-based strategy is useful to identify transcriptomic biomarkers from large-scale gene expression datasets that were collected from multiple sources.
Introduction
Lung cancer is one of the most lethal cancers and the most frequently diagnosed cancers worldwide.1–3 The age-standardized 5-year net survival of lung cancers is in the range of 10% to 20% in most countries. 4 Cancer diagnosis and prognosis have been the 2 major challenges in lung cancer management. 5 The precise classification of human lung cancers may help physicians to make treatment based on the specific characteristics of patients.6,7 Current classification of human lung cancers is based on tissue histological discrimination. However, the tissue is not available for defining final histological result in 15% to 20% of cases, while 7.2% of cases are poorly differentiated by histology. 8 To overcome above limitations, gene expression signatures in lung cancer tissues have been intensively applied to classify lung cancer subtypes and predict the clinical outcome of lung cancers. 9 Several gene expression signatures have been developed for lung cancer diagnosis and prognosis.10–19 Using either a data-driven approach in clinical trials or a biological mechanism-driven approach prior to the clinical trials, these studies have provided foundations for lung cancer diagnosis and prognosis, which were proved to be able to guide a better treatment for lung cancers. 7
Although many gene signatures have been developed, the listed genes in different signatures have little overlaps. 20 This has raised the questions about biological relevance, significance, and clinical implication of these signatures. 20 Two major factors may account for this discrepancy. First, the development of lung cancer is heterogeneous among individuals, 21 involving multiple genetic and epigenetic alterations. 22 Second, the discovered biomarkers were normally derived from a relatively small cohort size, which may cause substantial population bias. 7 To increase the robustness of gene signature, 23 a meta-analysis of gene expression data in different cohorts 24 was performed to identify prognostic signature of lung adenocarcinoma (ADC). However, multi-cohort studies still cannot solve the problem of low reproducibility among cohorts. 25 One possible explanation is that different genes are merely the separate aspects of the same groups of molecular pathways or mechanisms that cause the disease. 26 This hypothesis has been examined using the Kyoto Encyclopedia of Genes and Genomes (KEGG) 27 and Gene Ontology (GO) 28 to derive functionally related gene sets as mechanism-anchored signatures from genome-wide expression data.29,30 Currently, the commonly used methods in multi-cohort studies are all focusing on differential expressions at the single-gene level, 25 including combined P value methods,31,32 combined effective size methods, 33 rank-based methods, 34 and raw data integration-based methods. 25 In particular, Haynes et al have described a multi-cohort analysis framework by leveraging the biological and technical heterogeneity in multiple heterogeneous datasets. 35 To bridge the gaps between deterministic biological mechanisms of single-gene biomarkers and the statistical predictive power of multi-gene signatures that are disconnected from mechanisms, Chang et al 36 performed a pathway-based analysis to identify gene signatures for ADC prognosis. However, they only considered differentially expressed genes in lung cancer-related pathways. As cancer biomarker genes do not have to be located in cancer-related pathways, 37 this strategy may miss some important biomarker genes. Here, we developed a pathway-based strategy, which is independent of the knowledge of disease-related pathways, to identify robust biomarkers from multi-cohort gene expression data. We constructed a meta-dataset of gene expression profiles in lung tissues from published studies and applied our pathway-based analysis method to identify significant pathways that are related to lung cancer prognosis or diagnosis. We further selected significant genes in these pathways and used them as the biomarker signatures for lung cancer prognosis and diagnosis. We also tested the reliability and accuracy of the discovered gene signatures in independent validation cohorts.
Materials and Methods
Data sets
We compiled a multi-cohort lung cancer gene expression dataset of 1916 lung tissue samples from 13 published studies (Supplementary Table S1). Among them, there are 827 human lung ADC samples, 357 squamous-cell carcinoma (SCC) samples, 76 large-cell carcinoma (LCC) samples, 21 small-cell lung carcinoma (SCLC) samples, 2 adeno-squamous carcinoma samples, 39 basaloid carcinoma samples, 24 carcinoid tumor samples, 56 large-cell neuroendocrine carcinoma samples, 290 lung cancer samples without clear pathological classification, and 224 healthy control samples. The expression values in these samples were all measured using Affymetrix Human Genome U133 Plus 2.0 Array. We downloaded gene expression data of these samples from National Center for Biotechnology Information (NCBI) Gene Expression Omnibus (GEO) database 38 and integrated into a matrix of gene expression values using simple concatenation. We applied the “mas5calls” method in “affy” package 39 to assess the status of each probeset and excluded the probe sets that were missed in one-third or more of the samples. We used the “gcrma” algorithm 40 to normalize the expression level of each probe set and removed batch effects among expression data from multiple studies using ComBat. 41 Finally, a matrix of normalized gene expression data (1916 samples by 54 675 probe sets) was constructed. We used this dataset as the training set to discover the gene signatures for lung cancer diagnosis and prognosis. The clinical histology (Supplementary Table S1A) and survival information (Supplementary Table S1B) for each sample in this dataset were also retrieved from the GEO database. 38
To validate the performance of the discovered signatures, we collected 3 additional gene expression datasets and used these 3 datasets separately as the independent validation datasets. The first dataset, ACC-1 cohort, was collected from Aichi Cancer Center (ACC), Japan. 42 Gene expression values of samples in this cohort were measured by Agilent Homo sapiens 21.6K custom array. The raw values of gene expression in this dataset were normalized using Feature Extraction 7.5 software (Agilent Technologies, Palo Alto, CA, USA), 42 which was downloaded from GEO 38 under the accession GSE11969 (Supplementary Table S1). The second, MCC cohort, was collected from Moffitt Cancer Center (MCC), USA. 43 Gene expression values of samples in MCC cohort was measured by Rosetta/Merck Human RSTA Custom Affymetrix 2.0 microarray. The raw gene expression values were further normalized against their median sample using IRON, 43 which was downloaded from GEO 38 under the accession GSE72094 (Supplementary Table S1). The third cohort, ACC-2 cohort, was from ACC, Japan as well. 44 Gene expression values of samples in this cohort were measured by Agilent-014850 Whole Human Genome Microarray, and the raw gene expression values were further normalized using Feature Extraction 7.5 software. 44 We downloaded the normalized gene expression data from GEO 38 under the accession GSE13213 (Supplementary Table S1). For genes with multiple probes/probe sets in these 3 datasets, the gene expression value was measured as the geometric mean of all the original probes/probe sets mapping to that gene. The clinical histology (Supplementary Table S1A) and survival (Supplementary Table S1B) information for each sample in these datasets were also retrieved from GEO. 38
Finally, we compiled a RNA-seq dataset of lung tissue samples to test the performance of the discovered prognostic signature on samples that were measured by high-throughput sequencing platform. This dataset included 576 samples in The Cancer Genome Atlas (TCGA) lung adenocarcinoma cohort (LUAD) 45 and 553 samples in TCGA lung squamous-cell carcinoma cohort (LUSC). 46 The normalized gene expression values and the overall survival information (Supplementary Figure S1) of all these samples were downloaded from UCSC Xena platform. 47
The pathway-based strategy to identify biomarkers from multi-cohort dataset
We proposed a pathway-based strategy to identify robust gene expression signatures from the multi-cohort dataset of various sources. This strategy contains 2 major steps, which was outlined in Figure 1.
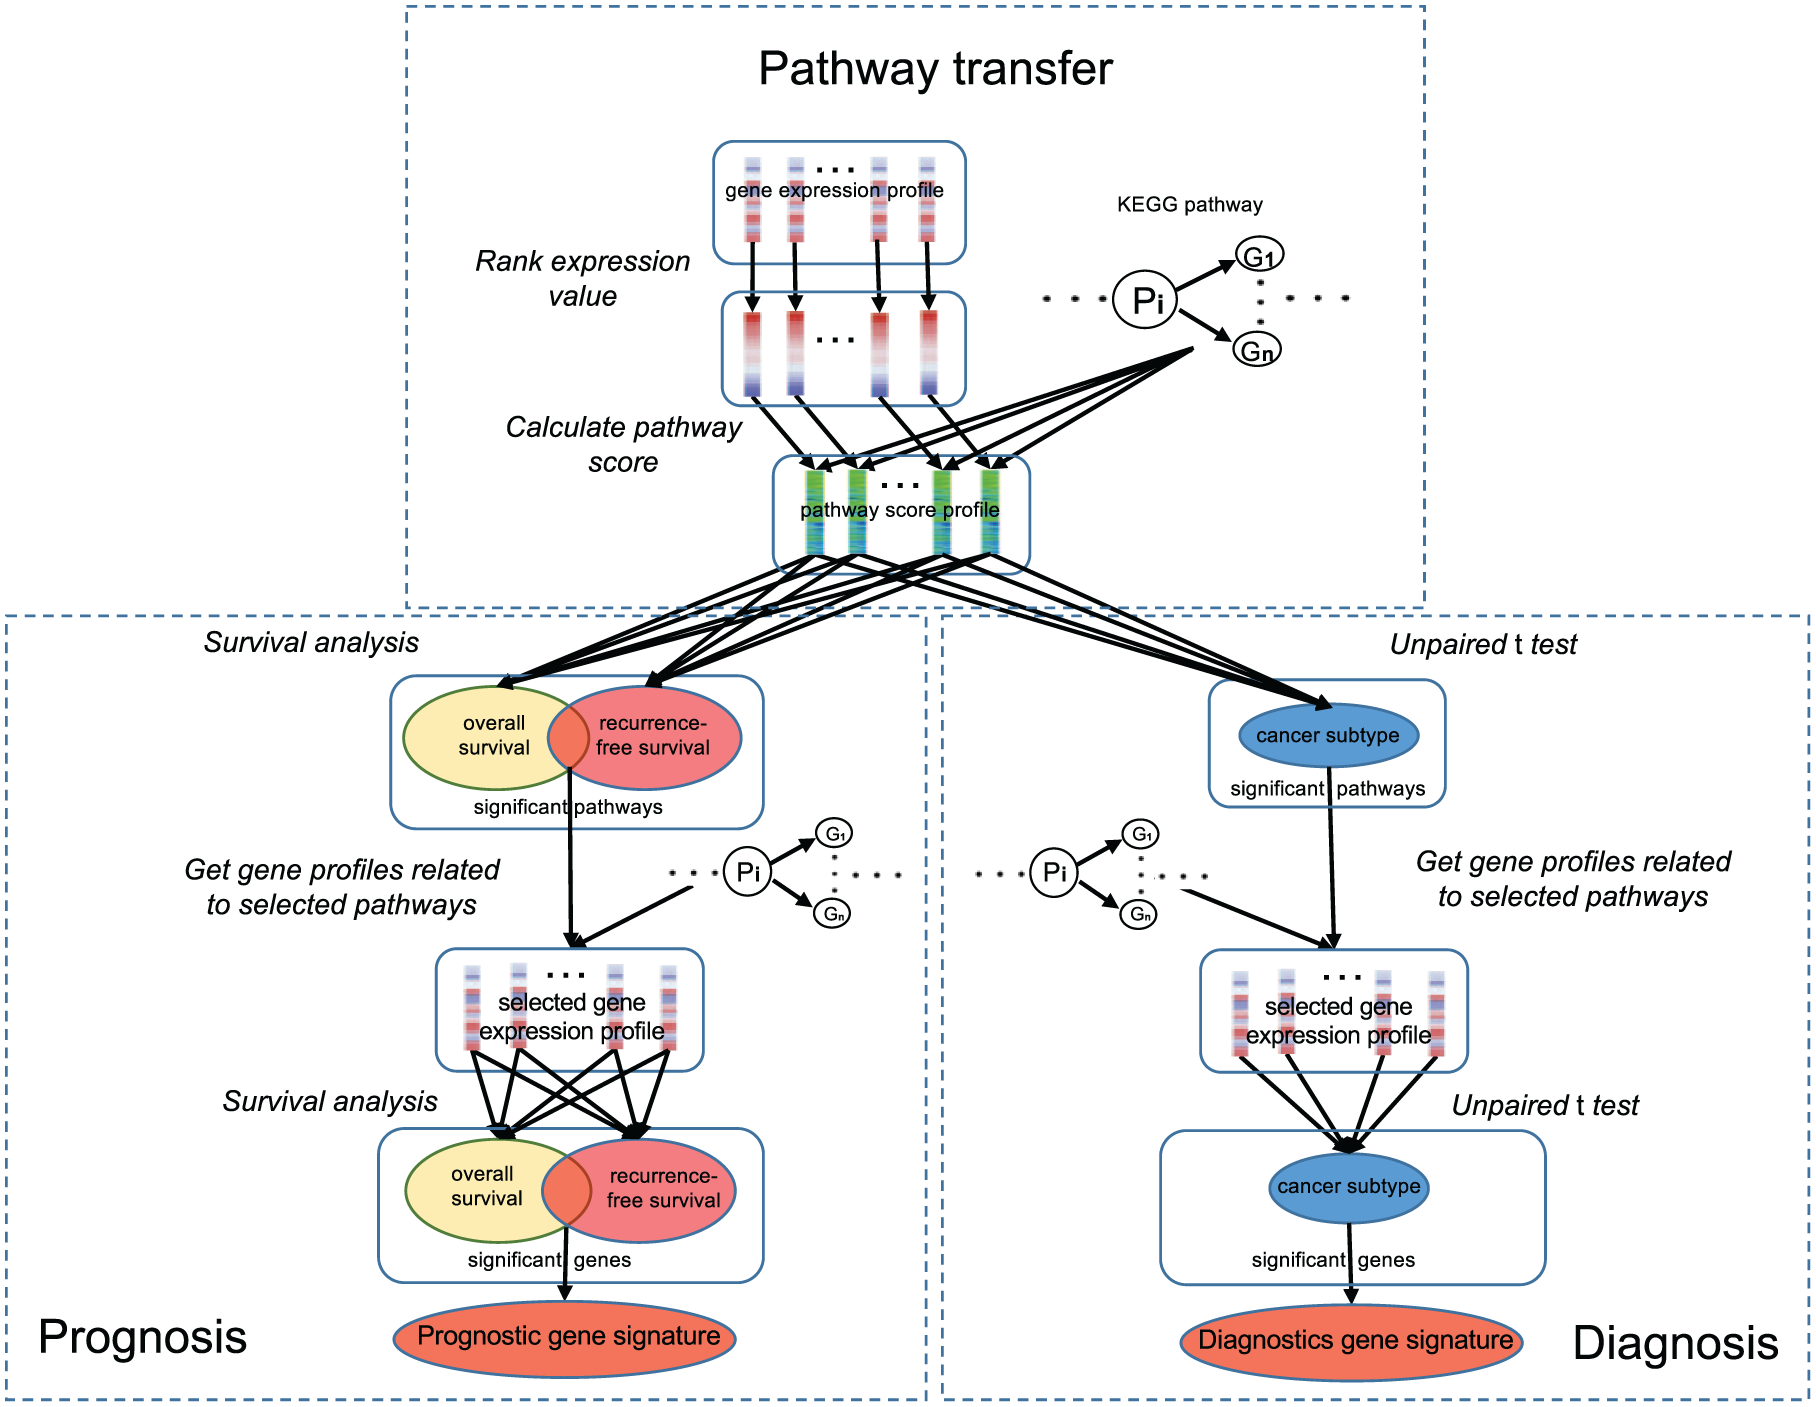
The pipeline of pathway-based strategy to identify the molecular signature.
In the first step, gene expression values at the transcriptome level were transformed to KEGG pathway scores 27 for each sample in the training dataset. Here, we used the FAIME method 48 to compute the pathway scores of all KEGG pathways in the KEGG database (release 52) using gene expression values in each single sample. The FAIME method 48 ranks the genes of each sample in the descending order of their expression values and assigns an exponentially decreasing weight for each gene. A normalized centroid is then defined as the unidimensional average of the weighted expression values of a gene set, such as the genes in a KEGG pathway. Finally, the FAIME Score of each gene set is calculated in every sample as the difference between the normalized centroid of its gene set and that of its complement gene set. A positive pathway score means the expression of genes in that pathway is upregulated as a functional group, while a negative pathway score means the downregulation. The larger the absolute value of the pathway score, the higher the expression dysregulation for genes in that pathway. After transformation, each sample in the original dataset is represented by a vector of functional scores of 229 KEGG pathways.
In the second step, we constructed the prognostic and diagnostic gene signatures using the KEGG pathway scores of each sample in the training dataset. To construct the prognostic signature, we performed univariate Cox proportional hazards regression analysis on KEGG pathway scores and the survival outcome and selected significant pathways based on the adjusted P value (Bonferroni-Holm method, adjusted P value <1 × 10⁻³) in Cox regression. The pathways that are strongly associated with both overall and recurrence-free survival were chosen for further analysis. After significant pathway identification, we dissected the corresponding microarray probes of each significant pathway and calculated the geometric mean values for genes in the significant pathways. We also applied univariate Cox proportional hazards regression to select significant genes in the significant pathways. Using adjusted P value (Bonferroni-Holm method, adjusted P value <1 × 10⁻⁷) as the cutoff, we chose all genes that were strongly associated with both overall and recurrence-free survival and used this set of significant genes as the prognostic gene signature. Similarly, we constructed a diagnostic biomarker for ADC patients using KEGG pathway scores of each sample in the training cohort. The ADC diagnostic biomarker is important in clinical application, as ADC is the most common form of lung cancers 2 and the precise classification of ADC is helpful to guide its treatment. 7 We performed a 2-sided unpaired t-test on each KEGG pathway to test its performance in differentiating the ADC patients from non-ADC patients and healthy controls. We chose the significant pathways that can strongly distinguish the ADC patients from non-ADC samples using the adjusted P value (Bonferroni-Holm method, adjusted P value <10−45) as the cutoff. For each gene in the significant pathways, we calculated the geometric mean value of all corresponding probes. Using adjusted P value (Bonferroni-Holm method, adjusted P value <10−45) as a cutoff, we chose a set of genes that can distinguish the ADC patients from non-ADC samples and used this set of genes as the diagnostic biomarker for lung cancer.
The risk score and ADC score
To test the performance of the discovered signature in lung cancer prognosis, we calculated a risk score for each sample in the training cohort and validation cohort, respectively, using the gene expression values of the signature genes.49-51 We used a scoring formula below to calculate a risk score from weighted gene expression for each sample.

here, Si is the calculated risk score; n is the number of genes; Wi is the weight of gene i;
Similarly, an ADC score for each sample in the training and validation cohort was calculated to test the power of the discovered diagnostic signature in differentiating ADC patients from non-ADC samples, using the same formula above. A higher ADC score represents a larger probability of that sample as an ADC patient. To test the prediction robustness in validation cohort, we computed the area under the receiver operating characteristic (ROC) curve (AUC) value for diagnostic analysis.
Statistical analyses
All statistical analyses were performed using the R platform. 52 Cox regression, log-rank test, and Kaplan-Meier survival analysis were performed by the “coxph,” “survdiff,” and “survfit” functions in the “survival” library, respectively. The R scripts are freely available in GitHub (https://github.com/unbvb/pathway-based-strategy).
Results
The construction of lung cancer prognostic gene signature
Using our pathway-based strategy (Figure 1), we constructed a prognostic gene signature that can predict lung cancer outcome using the integrated multi-cohort training dataset. First, we obtained 16 significant KEGG pathways that are related to lung cancer survival and determined their weights using their Z score in survival analysis (Table 1). Among them, 8 KEGG pathways were positively correlated to lung cancer survival, while another 8 KEGG pathways were negatively correlated to survival. The Kaplan-Meier survival curves demonstrated that all these KEGG pathways can statistically differentiate lung cancer samples into groups with different survival outcome for both recurrence-free survival (Figure 2) and overall survival (Supplementary Figure S2). The differentiation power was substantially increased when 8 positive pathways, 8 negative pathways, or all 16 significant pathways were combined together (Supplementary Figure S3A and B for recurrence-free survival and overall survival, respectively). Then, we identified significant genes that can predict lung cancer survival in these 16 significant pathways (Figure 1). We discovered 43 significant genes (Table 2) that were strongly associated with both overall and recurrence-free survival. Similarly, the weight of each gene was determined by their Z scores (Table 2). Finally, we used these 43 genes as a gene signature for lung cancer prognosis.
The KEGG pathways that are significantly related to lung cancer survival.

Abbreviations: ABC, ATP-binding cassette; KEGG, Kyoto Encyclopedia of Genes and Genomes.

The curves of the Kaplan-Meier KEGG pathway score of each significant pathway against the recurrence-free survival of lung cancer patients in the training cohort. KEGG indicates Kyoto Encyclopedia of Genes and Genomes.
The 43-gene prognostic signature.

The prognostic performance of the 43-gene signature
After identification, we tested the performance of the discovered 43-gene signature in predicting the survival outcome of lung cancer samples in the training cohort and several independent validation datasets.
We calculated the risk score of each sample in the training cohort using the expression values of genes in the 43-gene prognostic signature. We confirmed that the risk score can predict the survival of lung cancer patients in the training cohort (Figure 3). Univariate Cox proportional hazard regression of survival indicates that the risk score is negatively associated with the survival outcome of lung cancer patients (log-rank test: overall survival, P value <2 × 10⁻¹⁶; recurrence-free survival, P value <2 × 10⁻¹⁶). Using the median risk score as a cutoff, we further classified the lung cancer patients into 2 groups with either high- or low-risk scores. Kaplan-Meier survival curves (Figure 3A) demonstrated a significant difference in clinical outcome between those 2 patient groups (log-rank test: overall survival, P value <2 × 10⁻¹⁶; recurrence-free survival, P value = 3.07 × 10⁻¹³).

The 43-gene prognostic signature predicts the clinical outcome of lung cancers in the discovery and validation cohorts. (A) Kaplan-Meier curves for lung cancer patients in the discovery cohort. (B) Kaplan-Meier curves for lung cancer patients in 3 validation cohorts. In each cohort, patients were stratified into 2 categories according to the 43-gene-based risk score. Red curves represent the patients with higher risk score, while blue curves represent the patients with lower risk score. P values indicate the significance of survival differences between the patients with high risk score and low risk score. ACC indicates Aichi Cancer Center; MCC, Moffitt Cancer Center.
Furthermore, we investigated the prognostic performance of the 43-gene signature in 3 independent validation cohorts (Supplementary Table S1). We calculated the risk score for each sample in the validation datasets and observed similar prediction performance of risk score. Univariate Cox proportional hazard regression of survival indicates that the risk score is negatively associated with the survival of lung cancer patients (log-rank test: ACC-1 cohort, P value = 4.36 × 10⁻³; MCC cohort, P value = 8.20 × 10⁻⁴; ACC-2 cohort, P value = 1.73 × 10⁻⁴). Using the median risk score as a cutoff, we classified the lung cancer patients into 2 groups for each validation cohort. Kaplan-Meier survival curves (Figure 3B) demonstrated a significant difference in survival outcome between these 2 patient groups in the validation cohorts (log-rank test: ACC-1 cohort, P value = 2.81 × 10⁻²; MCC cohort, P value = 2.31 × 10⁻⁴; ACC-2 cohort, P value = 4.98 × 10⁻⁴). To explore whether the 43-gene expression signature is an independent prognostic factor, we applied a multivariate Cox model to compare its prognostic power with several traditional prognostic variables in lung cancer, including age, sex, smoking history, stage, and mutation status of cancer genes. Multivariate Cox proportional hazards regression of overall survival indicates that the 43-gene expression signature remains a significant independent covariate, although the clinical stage is a more significant prognostic factor (Table 3). Interestingly, the mutational status of one cancer gene, STKII, is also correlated to the overall survival in MCC cohort, which is independent of the 43-gene risk score. This suggests that the 43-gene expression signature is an independent prognostic factor from several known factors, such as the mutational status of cancer genes and clinical variables.
Multivariate Cox proportional hazards regression of the overall survival in lung cancer patients.

Abbreviations: ACC, Aichi Cancer Center; CI, confidence interval; HR, hazard ratio; MCC, Moffitt Cancer Center; NA, not applicable.
P value <.05; **P value <<.05.
Finally, we tested the prognostic performance of the 43-gene signature in TCGA lung cancer dataset, which measured gene expression in lung tissues using RNA-seq. Univariate Cox proportional hazard regression of survival indicates that the risk score is weakly associated with the survival of TCGA lung cancer patients (log-rank test: LUAD cohort, P value = 1.64 × 10⁻²; LUSC cohort, P value = 6.38 × 10⁻²). Using the median risk score as a cutoff to classify the lung cancer patients into 2 groups, Kaplan-Meier survival curves (Supplementary Figure S4) demonstrated a slightly significant difference in survival outcome in the TCGA LUAD cohort (log-rank test: P value = 3.01 × 10⁻²). However, there is no significant difference in survival outcomes in the TCGA LUSC cohort (log-rank test: P value = .402).
The construction of lung cancer diagnostic biomarker
In addition to a prognostic biomarker, we also constructed a set of genes that can differentiate ADC patients from non-ADC patients and healthy controls. We performed the 2-sided unpaired t-test to compare each KEGG pathway score between ADC patients and non-ADC samples in the training dataset. In all, 18 significant KEGG pathways (2-sided unpaired t-test, P value <2 × 10⁻¹⁶; Table 4) were identified. Their weights were determined using the t score in the 2-sided unpaired t-test (Table 4). For each gene in those 18 pathways, we calculated the geometric mean of expression values of all corresponding probes of that gene and used this as the gene’s expression value. Among these genes, we selected 32 genes (Table 5) that can distinguish the ADC patients from non-ADCs (2-sided unpaired t-test, P value <2 × 10⁻¹⁶). We used this gene set as a 32-gene diagnostic signature for lung ADCs and determined the weight of each gene using its t score (Table 5).
The significant pathways that can significantly differentiate ADC patients from non-ADC patients.
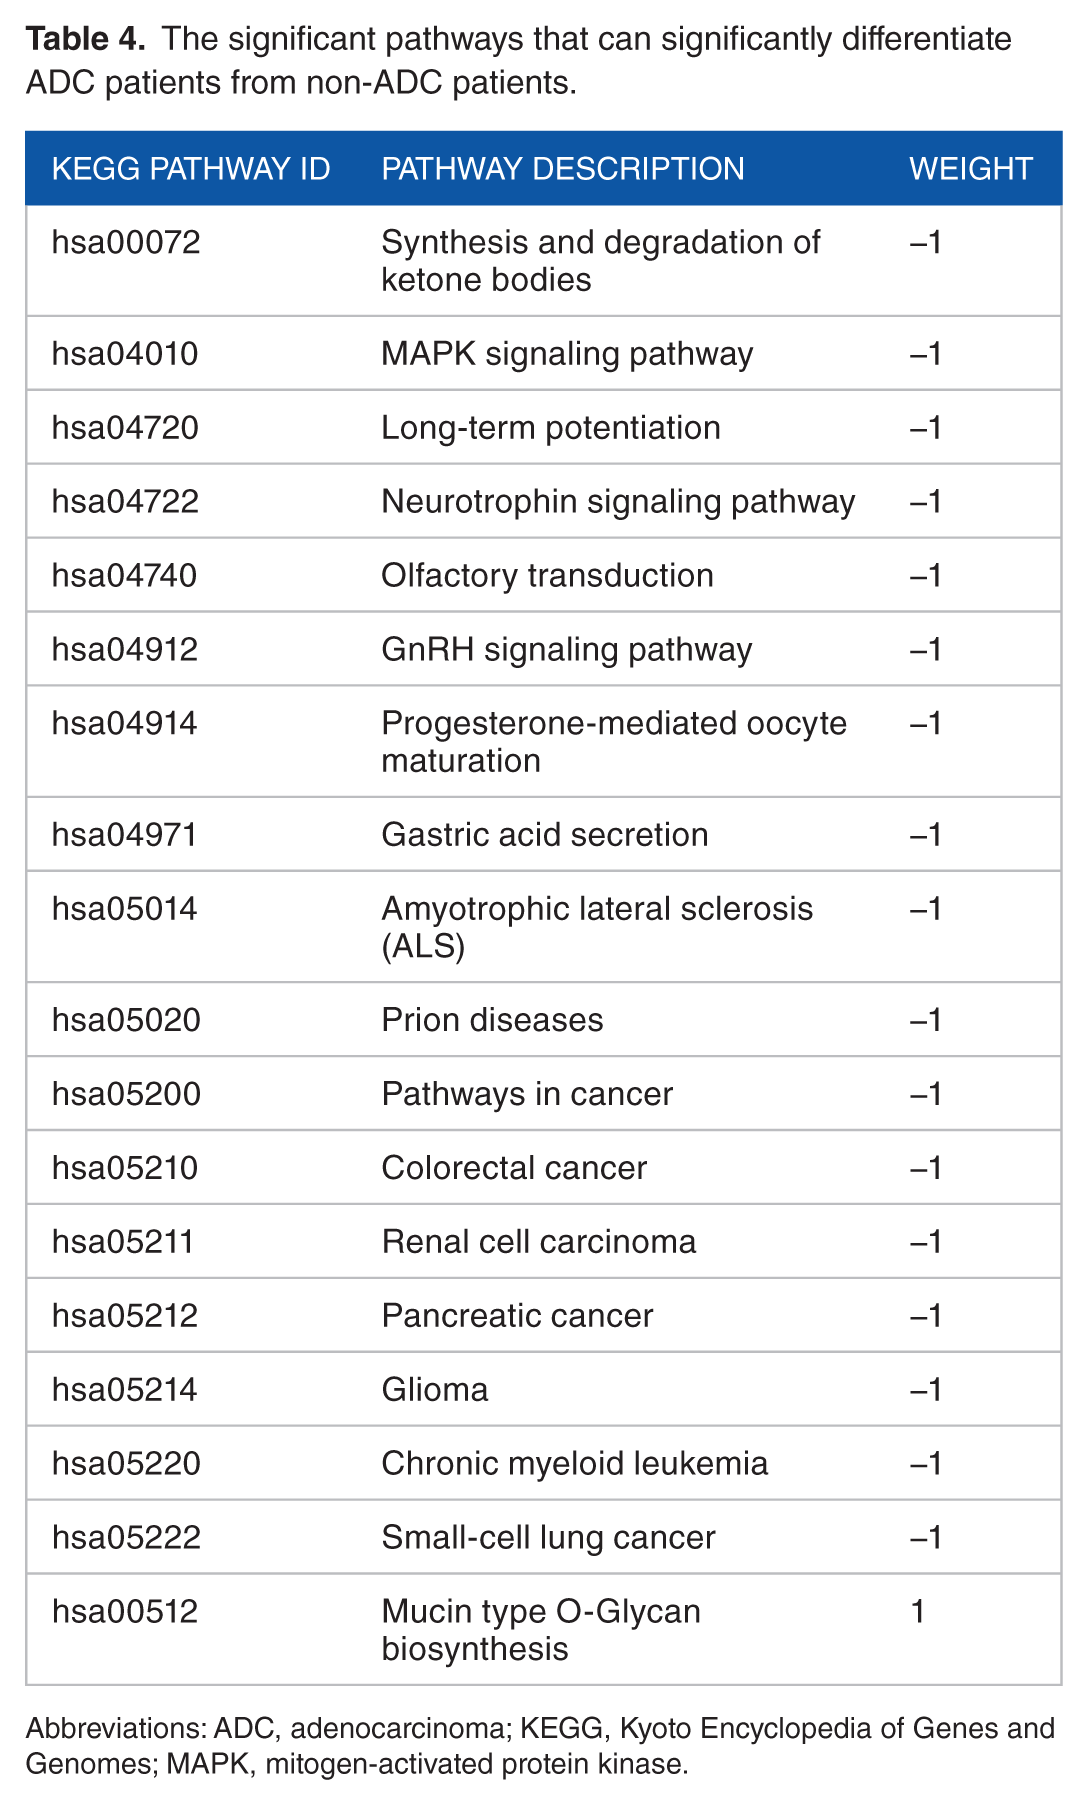
Abbreviations: ADC, adenocarcinoma; KEGG, Kyoto Encyclopedia of Genes and Genomes; MAPK, mitogen-activated protein kinase.
The 32-gene diagnostic signature.

The diagnostic performance of 32-gene diagnostic signature
To explore the diagnostic power of the 32-gene signature in differentiating ADC patients from non-ADC patients and healthy controls, we calculated the ADC score for each sample in both the training and ACC-1 validation cohorts using the gene expression values of those 32 genes in the diagnostic signature. In the training cohort, principal component analysis (PCA) indicates that expression values of those 32 signature genes can differentiate ADC patients from non-ADC samples (Figure 4A). At the same time, the ADC score was significantly higher (t-test: P value <2 × 10⁻¹⁶) in ADC patients than that of non-ADC samples (Figure 4B). The AUC value was 0.831 (Figure 4C). In the ACC-1 cohort, there are 90 ADC patients and 48 non-ADC samples, including 5 healthy controls, 35 SCC patients and 18 LCC patients. Principal component analysis of expression values of those 32 signature genes shows ADC patients can be well separated from non-ADCs in the ACC-1 cohort (Figure 4D). The ADC score was also significantly higher in ADC patients than that of SCC patients (t-test: P value = 1.57 × 10⁻¹¹), LCC patients (t-test: P value = 2.75 × 10⁻³), and healthy controls (t-test: P value <2 × 10⁻¹⁶; Figure 4E). The AUC values were 0.873, 0.723, and 0.909 when differentiating ADC patients from SCC patients, LCC patients, and healthy controls, respectively (Figure 4F). These results suggest that the 32-gene-based ADC score is a good signature for ADC diagnosis.
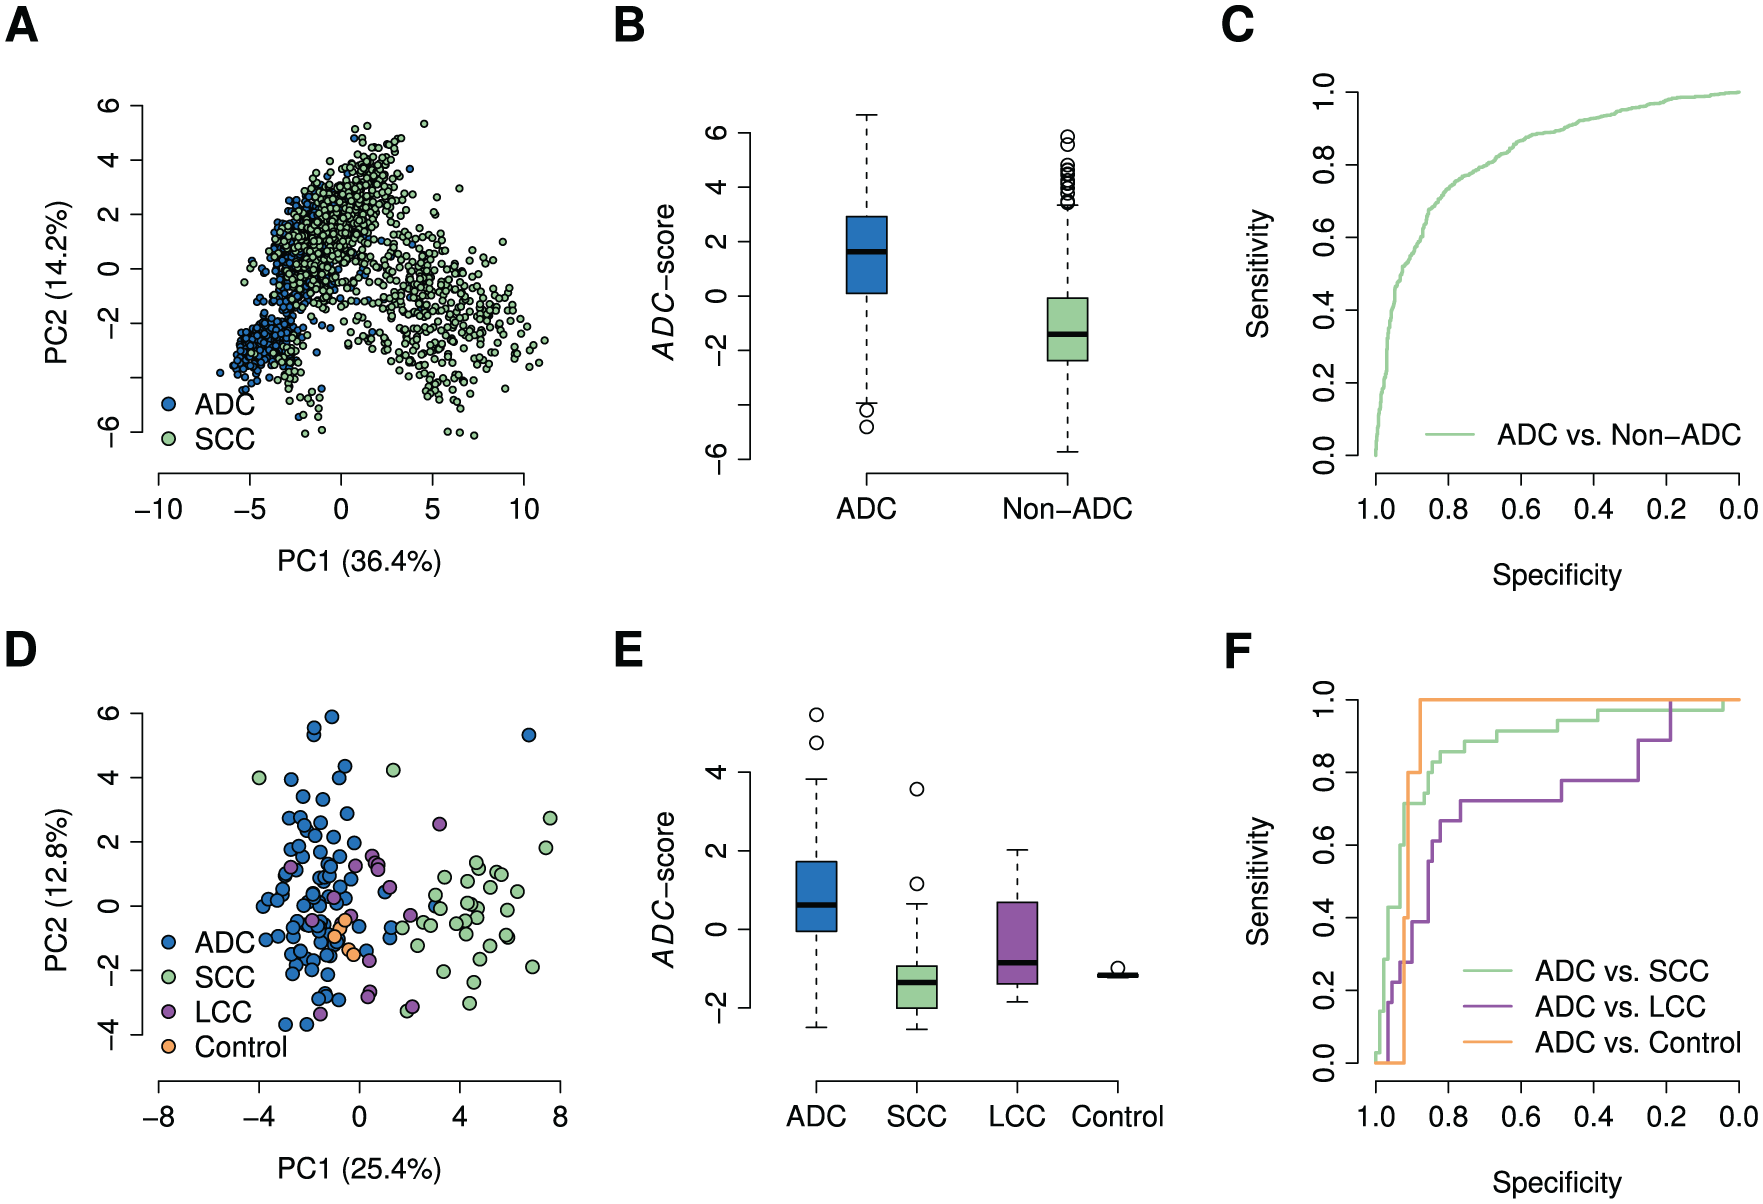
The 32-gene diagnostic signature distinguishes ADC patients from non-ADC subjects in both the discovery and the validation cohorts. (A) Principal component analysis on the expressions of the 32-gene signature in the discovery cohort. (B) The box plot of the ADC scores of the ADC patients and other non-ADC patients in the discovery cohort. (C) The ROC curves of using the 32-gene-based ADC score to distinguish the ADC patients from non-ADC patients in the discovery cohort. (D) Principal component analysis on the expressions of the 32-gene signature in the ACC-1 cohort. (E) The box plot of the ADC scores of the ADC patients, SCC patients, LCC patients, and the healthy controls in the ACC-1 cohort. (F) The ROC curves of using the ADC score to distinguish the ADC patients from SCC patients, LCC patients, and the healthy controls in the ACC-1 cohorts. ADC indicates adenocarcinoma; PC1, the first principal component; PC2, the second principal component; ROC, receiver operating characteristic; SCC, squamous-cell carcinoma; LCC, large-cell carcinoma.
Discussion
In this study, we proposed a pathway-based strategy to extract important features in genome-wide expression data and successfully applied it to a large-scale multi-cohort dataset to identify gene expression signatures for lung cancer prognosis and diagnosis. This strategy is different from those commonly used methods in selecting gene signatures related to clinical phenotypes. 25 Those methods, such as combined P value methods,31,32 combined effective size methods, 33 and rank-based methods, 34 all focus on dysregulated expression at the single-gene level. 25 In our methods, we used a pathway-based strategy to extract significant pathways using genome-wide expression data. We computed the pathway score of each KEGG pathway for each single sample using the FAIME algorithm. 48 Unlike the method proposed by Drier et al, 5 which estimates the extent to which the behavior of a pathway deviates in each sample from normal, FAIME algorithm 48 can quantify the activation or suppression of each pathway in a sample using the gene expression data of that sample only. Then, we found significant genes in those significant pathways and used those genes as the biomarker signature (Figure 1). In contrast to a single gene, a KEGG pathway is a set of genes acting together to perform a specific biological function. Therefore, a significant pathway could explain the inner connection of genes and molecular features, such as prognosis and diagnosis, at a higher level. Given this feature of biological pathways, the identified significant pathways are less likely to be false positives, which is especially important for meta-analysis. In our results, we observed 16 significant pathways (Table 1) that are related to prognosis and 18 significant pathways (Table 4) that are related to ADC diagnosis. Based on these significantly dysregulated pathways, we further identified a 43-gene prognostic signature (Table 2) and a 32-gene diagnostic signature (Table 5). Using 3 independent cohorts, we tested the prediction power of the 43-gene prognostic signature and the classification power of the 32-gene diagnostic signature. We confirmed that our 43-gene prognostic signature can successfully predict the outcome of lung cancer patients in the discovery cohorts (Figure 3A) and all 3 independent validation cohorts (Figure 3B), which is independent of several other clinical factors, such as cancer stage (Table 3). Besides, the 32-gene diagnostic signature can significantly distinguish the lung ADC patients from other patients and healthy controls (Figure 4). The superior performance of the identified gene signatures suggests that our pathway-based strategy is able to extract meaningful features in the large-scale gene expression data from various public resources, which is evitable to have substantial background noises.
We used a multi-cohort lung cancer study as the example to show the feasibility of our pathway-based strategy in identifying meaningful biomarker signatures. In a previous study, Chang et al 36 also used a pathway-based algorithm to identify the prognostic signatures for lung cancers. Unlike the pathway-based algorithm proposed by Chang et al, 36 we did not use any prior knowledge specific to lung cancers in our pathway-based strategy (Figure 1). We tested the prediction power of their published prognostic signature 36 in our validation cohorts (Supplementary Figure S5). In comparison, we observed a higher or comparable predictive power of our 43-gene prognostic signature (Figure 3B) in predicting the survival outcomes of lung cancer patients. The independence of prior knowledge of our pathway-based strategy may explain the superior performance of our signature in lung cancer prognosis (Figure 3B and Supplementary Figure S5). Comparing the performance of prognostic biomarkers identified by our pathway-based strategy and several published single-gene methods (Supplementary Table S2), we observed that biomarkers identified by single-gene level, in general, had low replicability in predicting patients’ outcomes in 3 validation cohorts (Supplementary Figure S6). However, our pathway-based strategy is not ideal for identifying signatures in gene expression datasets across platforms. The 43-gene prognostic signature was identified in a multi-cohort gene expression dataset using Affymetrix Human Genome U133 Plus 2.0 Array. When testing its performance in TCGA RNA-seq dataset, we observed insignificant prediction power in TCGA LUAD and LUSC cohorts (Supplementary Figure S4), which is much smaller than that in ACC-1, MCC, and ACC-2 cohorts (Figure 3B). Although the distribution of survival data in these datasets (Supplementary Figure S1) may partially explain this difference, more attention should be paid when gene expressions are measured by different platforms.
Many studies have identified several prognostic signatures to predict lung cancer outcome using datasets with relatively small sample size and traditional gene-level methods.10–19,36,53 In these 19 published prognostic signatures, there are 627 genes in total (Supplementary Table S2), including 24 biomarker genes in our 43-gene prognosis signature (Supplementary Table S2). This suggests that the signature genes identified by our pathway-based method and the integrated multi-cohort dataset can identify several known prognosis-related genes, while a set of novel signature genes may present some unique information from multi-cohort study. Among the prognostic genes in our signature, many have been suggested to be closely related to lung cancers. For example, E2F1 is an existed biomarker gene for lung cancer prognosis in 2 previous studies.10,53 E2F1 expression is significantly increased in lung cancers than normal tissues. 54 Moreover, E2F1 is a transcription factor, which controls the transcription of cyclin E and cyclin D1. 55 Therefore, the increased expression of E2F1 will promote the transcription of cyclin E and cyclin D1, which is correlated to tumorigenesis of lung cancers. 56 Besides, E2F2 is a novel prognostic signature gene in our prognostic signature, which was exclusively identified in our study. In a previous study, Feliciano et al suggested that the suppression of E2F2 can inhibit the function of miR-99a, which will support the proliferation and tumor-promoting action of relative proteins. 57 In addition, several other novel prognostic signature genes were also related to human lung cancers, such as ALDH2, 58 ADH1B, 58 RAD51, 59 PLK1, 60 and CDK1. 61 Notably, 2 well-known oncogenes, EGFR and KRAS, were not identified by our pathway-based strategy, although they have been extensively documented to be involved in lung cancer pathogenesis. 62 Further investigations found that these 2 genes were included in several significant pathways, including 5 diagnosis-related pathways for EGFR, 11 diagnosis-related pathways, and 2 prognosis-related pathways for KRAS. Therefore, these 2 genes were not identified as the biomarker genes as they are not unique in predicting lung cancer outcomes and classifying subtypes. This may prove the rationality of our pathway-based strategy in constructing disease-related signatures.
Furthermore, we found that the signatures for lung cancer diagnosis and prognosis were totally different. At the pathway level, only one KEGG pathway, progesterone-mediated oocyte maturation, was observed to correlate with both lung cancer clinical outcome and subtype classification (Tables 1 and 4). The lung cancer prognosis-related pathways are mostly involved in metabolism, cell division, and reproduction, such as tyrosine metabolism and DNA replication (Table 1, Figure 2 and Supplementary Figure S1). Meanwhile, the diagnosis-related pathways are involved in cancer-related signaling, including MAPK signaling pathway and GnRH signaling pathway (Table 4). For the significant gene, many prognosis-related genes were cell cycle genes, while diagnosis-related genes were some kinases (Tables 2 and 5). Interestingly, there is no overlap gene between the identified diagnostic gene signature and prognostic gene signature. This suggests that the underlying mechanisms that drive cancer metastasis and differentiate different cancer subtypes are more likely to be different. Therefore, the separate identification of lung cancer prognosis and diagnosis biomarkers may be more reasonable, although some studies have proposed a set of signature genes for lung cancer prognosis and diagnosis at the same time. 18
Conclusions
We proposed a pathway-based strategy to analyze large-scale gene expression data that were collected from multiple sources. Our results suggest that the pathway-based strategy is useful to identify significant transcriptomic biomarkers from such noisy dataset, which is especially important in the era of precision medicine.
Supplemental Material
Figure_S1_xyz153701c28279b – Supplemental material for A Pathway-Based Strategy to Identify Biomarkers for Lung Cancer Diagnosis and Prognosis
Supplemental material, Figure_S1_xyz153701c28279b for A Pathway-Based Strategy to Identify Biomarkers for Lung Cancer Diagnosis and Prognosis by Mengying Sheng, Xueying Xie, Jun Wang and Wanjun Gu in Evolutionary Bioinformatics
Supplemental Material
Figure_S2_xyz153707f6923ef – Supplemental material for A Pathway-Based Strategy to Identify Biomarkers for Lung Cancer Diagnosis and Prognosis
Supplemental material, Figure_S2_xyz153707f6923ef for A Pathway-Based Strategy to Identify Biomarkers for Lung Cancer Diagnosis and Prognosis by Mengying Sheng, Xueying Xie, Jun Wang and Wanjun Gu in Evolutionary Bioinformatics
Supplemental Material
Figure_S3_xyz1537026c2ee0c – Supplemental material for A Pathway-Based Strategy to Identify Biomarkers for Lung Cancer Diagnosis and Prognosis
Supplemental material, Figure_S3_xyz1537026c2ee0c for A Pathway-Based Strategy to Identify Biomarkers for Lung Cancer Diagnosis and Prognosis by Mengying Sheng, Xueying Xie, Jun Wang and Wanjun Gu in Evolutionary Bioinformatics
Supplemental Material
Figure_S4_xyz1537071173700 – Supplemental material for A Pathway-Based Strategy to Identify Biomarkers for Lung Cancer Diagnosis and Prognosis
Supplemental material, Figure_S4_xyz1537071173700 for A Pathway-Based Strategy to Identify Biomarkers for Lung Cancer Diagnosis and Prognosis by Mengying Sheng, Xueying Xie, Jun Wang and Wanjun Gu in Evolutionary Bioinformatics
Supplemental Material
Figure_S5_xyz15370cb890805 – Supplemental material for A Pathway-Based Strategy to Identify Biomarkers for Lung Cancer Diagnosis and Prognosis
Supplemental material, Figure_S5_xyz15370cb890805 for A Pathway-Based Strategy to Identify Biomarkers for Lung Cancer Diagnosis and Prognosis by Mengying Sheng, Xueying Xie, Jun Wang and Wanjun Gu in Evolutionary Bioinformatics
Supplemental Material
Figure_S6_xyz1537054db36a7 – Supplemental material for A Pathway-Based Strategy to Identify Biomarkers for Lung Cancer Diagnosis and Prognosis
Supplemental material, Figure_S6_xyz1537054db36a7 for A Pathway-Based Strategy to Identify Biomarkers for Lung Cancer Diagnosis and Prognosis by Mengying Sheng, Xueying Xie, Jun Wang and Wanjun Gu in Evolutionary Bioinformatics
Supplemental Material
Table_S1_xyz1537035e5e7f4 – Supplemental material for A Pathway-Based Strategy to Identify Biomarkers for Lung Cancer Diagnosis and Prognosis
Supplemental material, Table_S1_xyz1537035e5e7f4 for A Pathway-Based Strategy to Identify Biomarkers for Lung Cancer Diagnosis and Prognosis by Mengying Sheng, Xueying Xie, Jun Wang and Wanjun Gu in Evolutionary Bioinformatics
Supplemental Material
Table_S2_xyz15370ab6aa551 – Supplemental material for A Pathway-Based Strategy to Identify Biomarkers for Lung Cancer Diagnosis and Prognosis
Supplemental material, Table_S2_xyz15370ab6aa551 for A Pathway-Based Strategy to Identify Biomarkers for Lung Cancer Diagnosis and Prognosis by Mengying Sheng, Xueying Xie, Jun Wang and Wanjun Gu in Evolutionary Bioinformatics
Footnotes
Funding:
The author(s) disclosed receipt of the following financial support for the research, authorship, and/or publication of this article: This work was supported by grants from National Natural Science Foundation of China (61471112, 61372164, and 61571109), Key Research & Development Program of Jiangsu Province (BE2016002-3), and the Fundamental Research Funds for the Central Universities (2242017K3DN04).
Declaration of conflicting interests:
The author(s) declared no potential conflicts of interest with respect to the research, authorship, and/or publication of this article.
Author Contributions
WG conceived this study. MS performed the analysis. MS, JW, XX, and WG interpreted the results. MS and WG wrote the manuscript. All authors contributed to the final version of the manuscript. All authors read and approved the final manuscript.
Supplemental Material
Supplemental material for this article is available online.
References
Supplementary Material
Please find the following supplemental material available below.
For Open Access articles published under a Creative Commons License, all supplemental material carries the same license as the article it is associated with.
For non-Open Access articles published, all supplemental material carries a non-exclusive license, and permission requests for re-use of supplemental material or any part of supplemental material shall be sent directly to the copyright owner as specified in the copyright notice associated with the article.