
Abstract
Background:
Arteriovenous fistula (AVF) is the preferred vascular access for hemodialysis, yet primary failure and early dysfunction remain common, thereby prolonging catheter dependence and increasing costs. Traditional prediction models show limited discrimination, and few studies have combined machine-learning (ML) methods with formal assessment of clinical utility. This study aimed to identify predictors of AVF failure and compare ML models with logistic regression in a Turkish hemodialysis cohort, and to derive a clinical risk score.
Methods:
In this retrospective study, 385 adults with native AVFs (171 failures, 214 patent) operated between January 2018 and November 2024 were analyzed. Demographic, clinical, and laboratory variables were extracted from electronic records. Standard logistic regression (GLM), penalized logistic regression (LASSO), Random Forest, and XGBoost models were fitted and evaluated using 10-fold cross-validation and an independent test set (75%/25% split). LASSO coefficients were translated into a hand-calculable clinical risk score.
Results:
Patients with AVF failure were older and had lower BMI, albumin, and creatinine than those with patent accesses. In multivariable logistic regression, higher urea and lower BMI and albumin independently predicted failure. On the test set, AUCs were 0.731 (GLM), 0.876 (LASSO), 0.918 (Random Forest), and 0.884 (XGBoost). Cross-validated mean AUCs ranged from 0.906 (GLM) to 0.950 (XGBoost), with Brier scores 0.079–0.116 and generally good calibration. A 30% risk threshold suggested a clinically reasonable balance between sensitivity and specificity, and decision-curve analysis showed net benefit for all ML models versus treat-all/none. The clinical risk score stratified patients into low (⩽3 points), intermediate (4–7), and high (⩾8) risk.
Conclusion:
ML models, particularly ensemble methods, showed improved discrimination compared with standard logistic regression for predicting AVF failure and supported a simple, clinically usable risk score for stratified surveillance.
Introduction
End-stage renal disease (ESRD) is a growing public health problem that affects over 4.59 million people globally. 1 Hemodialysis accounts for 70% of renal replacement therapy globally, with vascular access type critically affecting treatment efficacy.2,3 Arteriovenous fistulas (AVF) remain the preferred vascular access despite primary failure rates of 20%–60%, which prolong catheter dependence and contribute to healthcare costs representing 20% of total hemodialysis expenditures.3 –6
Traditional prediction models have identified clinical risk factors including advanced age, diabetes, cardiovascular disease, and smoking as risk factors for fistula failure. 7 However, traditional statistical methods have so far shown low discriminative abilities in predictions; and machine learning algorithms may better capture complex, non-linear relationships among multiple risk factors.7,8 Recent studies using machine learning models have shown promise, with XGBoost models achieving AUC values of 0.80 in large cohorts. 9 However, most existing models focus on discrimination metrics without adequately assessing clinical utility and do not use complementary statistical and machine learning methods to confirm findings.9,10
Recent work has further advanced this field. Hori et al. compared logistic regression with machine learning approaches (Random Forest, SVM, XGBoost) in 1010 patients, finding Random Forest achieved the highest accuracy (AUC 0.828) and identifying surgical time as a key predictor. 11 A systematic review by Meng and Ho using the Prediction model Risk Of Bias Assessment Tool (PROBAST) found high risk of bias in many published AVF prediction models and noted that most lack external validation or demonstrate reduced performance when tested in external cohorts. 12 These findings highlight the need for methodologically rigorous model development with transparent reporting and formal utility assessment. Notably, most existing models have been developed in Western or East Asian populations, data from Turkish populations remain limited, and few studies have translated complex models into practical clinical tools usable without electronic calculators.
The main objective of this study was to identify factors affecting fistula failure and develop and validate machine learning models for predicting AVF failure in a Turkish hemodialysis population, comparing their performance with that of traditional logistic regression using both discrimination metrics and decision curve analysis to ultimately create a fistula risk guideline for clinical use. We hypothesized that machine learning approaches would demonstrate superior predictive performance and clinical utility, enabling risk-stratified surveillance strategies.
Methods
Study design and population
This retrospective observational study included 385 adult patients (171 with AVF failures and 214 with patent accesses) undergoing maintenance hemodialysis. The preoperative laboratory values of the patients were collected from electronic health records. All hemodialysis patients who underwent AVF surgery between January 2018 and November 2024 were included in the study.
Inclusion criteria were: (1) age ⩾18 years; (2) maintenance hemodialysis; (3) native arteriovenous fistula of any upper extremity configuration created during the study period; and (4) complete baseline demographic, clinical, and preoperative laboratory data. Exclusion criteria were: (1) arteriovenous grafts (comprising <1% of vascular access in Turkey 13 ); (2) patients who died (n = 13) or received kidney transplantation (n = 2) with a functioning AVF before completing 1-year follow-up; and (3) missing key preoperative variables (albumin, BMI, creatinine, urea; n = 7). Patients with previous ipsilateral vascular access surgery were not excluded. The retrospective design introduces potential selection bias, as patients excluded for incomplete data or loss to follow-up may differ systematically from those analyzed.
Patients with available baseline demographic, clinical, and laboratory data at the time of vascular access assessment were eligible; those who had missing preoperative data were excluded. The primary outcome was arteriovenous fistula failure within 1 year of creation, defined as: (a) permanent loss of access function requiring surgical revision, thrombectomy, or abandonment with creation of new access at a different site; (b) permanent return to central venous catheter due to access dysfunction; or (c) primary non-maturation (failure to achieve adequate flow for dialysis initiation by 3 months). Fistulas requiring a single successful salvage intervention (e.g. angioplasty) with subsequent adequate function were not classified as failures.
Postoperative surveillance followed institutional practice consistent with KDOQI guidelines. 14 AVF assessment (thrill palpation, bruit auscultation, arm inspection) was performed at each hemodialysis session. Access function was monitored through Kt/V, urea reduction ratio, arterial and venous pressure trends, and recirculation measurements when clinically indicated. Doppler ultrasound was performed when clinical findings or dialysis parameters suggested dysfunction or when maturation had not occurred. No additional surveillance was employed during the study period.
Binary outcomes (failure vs patent at 1 year) rather than time-to-event analysis were investigated because: (i) clinical decision-making at AVF creation benefits from simple risk classification, (ii) the clinical risk score is intended to provide immediate risk estimates rather than survival curves, and (iii) the 1-year horizon reduces time-varying exposure effects.
Composite outcome definition
We combined primary non-maturation, early thrombosis, and permanent loss within 1 year into a single composite outcome for several reasons. First, from a clinical decision-making perspective at the time of AVF creation, these endpoints share a common consequence: failure to achieve or maintain functional hemodialysis access, necessitating continued or renewed catheter dependence. The clinical question addressed—“which patients are at highest risk of not having a functional fistula one year after creation?”—is most relevant for preoperative counseling and resource allocation regardless of the specific failure mechanism.
Furthermore, these entities, while pathophysiologically heterogeneous, share overlapping risk factors including vessel quality, patient nutritional status, and systemic vascular health. Prior literature has similarly employed composite AVF failure endpoints encompassing maturation failure and early loss.5,9,12 Finally, separating these outcomes would have substantially reduced statistical power given our sample size. With 171 total failure events, subgroup analyses by failure type would yield unstable estimates. This approach limits mechanistic interpretation and future larger studies with sufficient events should examine outcome-specific risk models.
Statistical analysis
Descriptive analysis
Continuous variables showed non-normal distribution and were reported as median [IQR] and compared between groups using the Wilcoxon rank-sum test. Categorical variables are summarized as n (%) and compared using the χ2 test. Variables with p < 0.05 were considered statistically significant.
Multivariable logistic regression
A multivariable logistic regression model was used to identify independent predictors of AVF failure. Odds ratios (ORs) with 95% confidence intervals (CIs) and p-values were reported. Model discrimination and calibration were quantified by the area under the ROC curve (AUC) and Brier score, respectively.
Machine-learning model development
The dataset was randomly divided into a training set (75%) and a test set (25%) using a fixed random seed to ensure reproducibility. Four supervised binary classifiers were developed for AVF failure prediction:
Standard Logistic Regression (GLM)—baseline reference model.
Penalized Logistic Regression (LASSO)—regularization tuned via 10-fold cross-validation to minimize deviance.
Random Forest (RF)—ensemble of 500 trees using Gini impurity for splitting; mtry parameter optimized via grid search.
Extreme Gradient Boosting (XGBoost)—gradient boosting with logistic loss, learning rate = 0.1, max_depth = 4, subsample = 0.8.
Data preprocessing and data leakage prevention
To minimize optimistic bias, strict separation of training and test data was maintained throughout analysis. The 75%/25% train-test split was performed before any data inspection using a fixed random seed. Within 10-fold cross-validation, continuous variable standardization was fitted only on training folds and applied to validation folds. Hyperparameter optimization (LASSO λ via minimum deviance, Random Forest mtry via grid search, XGBoost learning rate and depth) was conducted entirely within the training set. No feature selection occurred outside LASSO regularization. The test set was reserved exclusively for final evaluation.
Cross-validation and internal validation
Model performance was internally validated using 10-fold cross-validation. For each fold, AUC, Brier score, and calibration slope/intercept were recorded.
Model performance metrics
Model performance was evaluated on both the cross-validated training folds and the independent test set.
Discrimination: assessed via AUC from ROC analysis.
Calibration: assessed via calibration slope/intercept and Brier score.
Overall accuracy: evaluated at multiple probability thresholds (0.10–0.90).
Calibration plots by decile for all models are shown in Figure S1.
Threshold-based classification
To examine clinical applicability, classification metrics (sensitivity, specificity, positive predictive value (PPV), negative predictive value (NPV), and accuracy) were computed at predefined thresholds from 0.1 to 0.9 on the held-out test set. Classification performance was evaluated at thresholds from 0.10 to 0.90. The 30% threshold was selected based on examination of sensitivity–specificity trade-offs, targeting a clinically meaningful risk level balancing detection of high-risk patients against false-positive burden. We acknowledge this represents empirical optimization rather than true a priori specification.
Decision-curve analysis
Decision-curve analysis (DCA) was performed to quantify net clinical benefit across thresholds. Bootstrapped 95% confidence intervals were estimated with 500 resamples.
Development of the clinical risk scoring system
Following model selection, coefficients from the final penalized logistic regression (LASSO, λ1ₛₑ) were converted into an easily interpretable scoring system for clinical practice. Continuous predictors were transformed into categories based on cohort distributions and dialysis-relevant reference ranges. Each category was assigned integer weights proportional to the corresponding standardized coefficient magnitude, preserving the direction and contribution of each variable.
Variables with very small or counter-intuitive coefficients (phosphorus and malignancy) were excluded from the clinical risk tool to avoid clinical misinterpretation. The linear predictor was scaled so that one point corresponded to the smallest meaningful log-odds change, producing integer point increments for each variable range. The total score was mapped back to predicted probabilities using the logistic function, and cut-points were chosen to correspond to approximately 10% and 30% risk thresholds for low, intermediate, and high-risk strata.
The study adhered to the Declaration of Helsinki and was approved by an institutional ethics committee. All statistical and machine-learning analyses were performed in R version 4.5.1. (R Foundation for Statistical Computing, Vienna, Austria).
Results
Study population
A total of 385 patients were included in the analysis, comprising 171 individuals (44.4%) with arteriovenous fistula (AVF) failure and 214 (55.6%) with patent access.
The median age was 57 years (IQR 45–67); 59% were male. Compared with patent accesses, AVF failure patients were older (60 vs 55 years, p = 0.015) with significantly lower BMI (22.1 vs 25.6 kg/m2, p < 0.001), albumin (3.57 vs 4.02 g/dL, p < 0.001), creatinine (7.00 vs 8.00 mg/dL, p < 0.001), and hemoglobin (10.2 vs 11.1 g/dL, p < 0.001; Table 1).
Baseline characteristics.
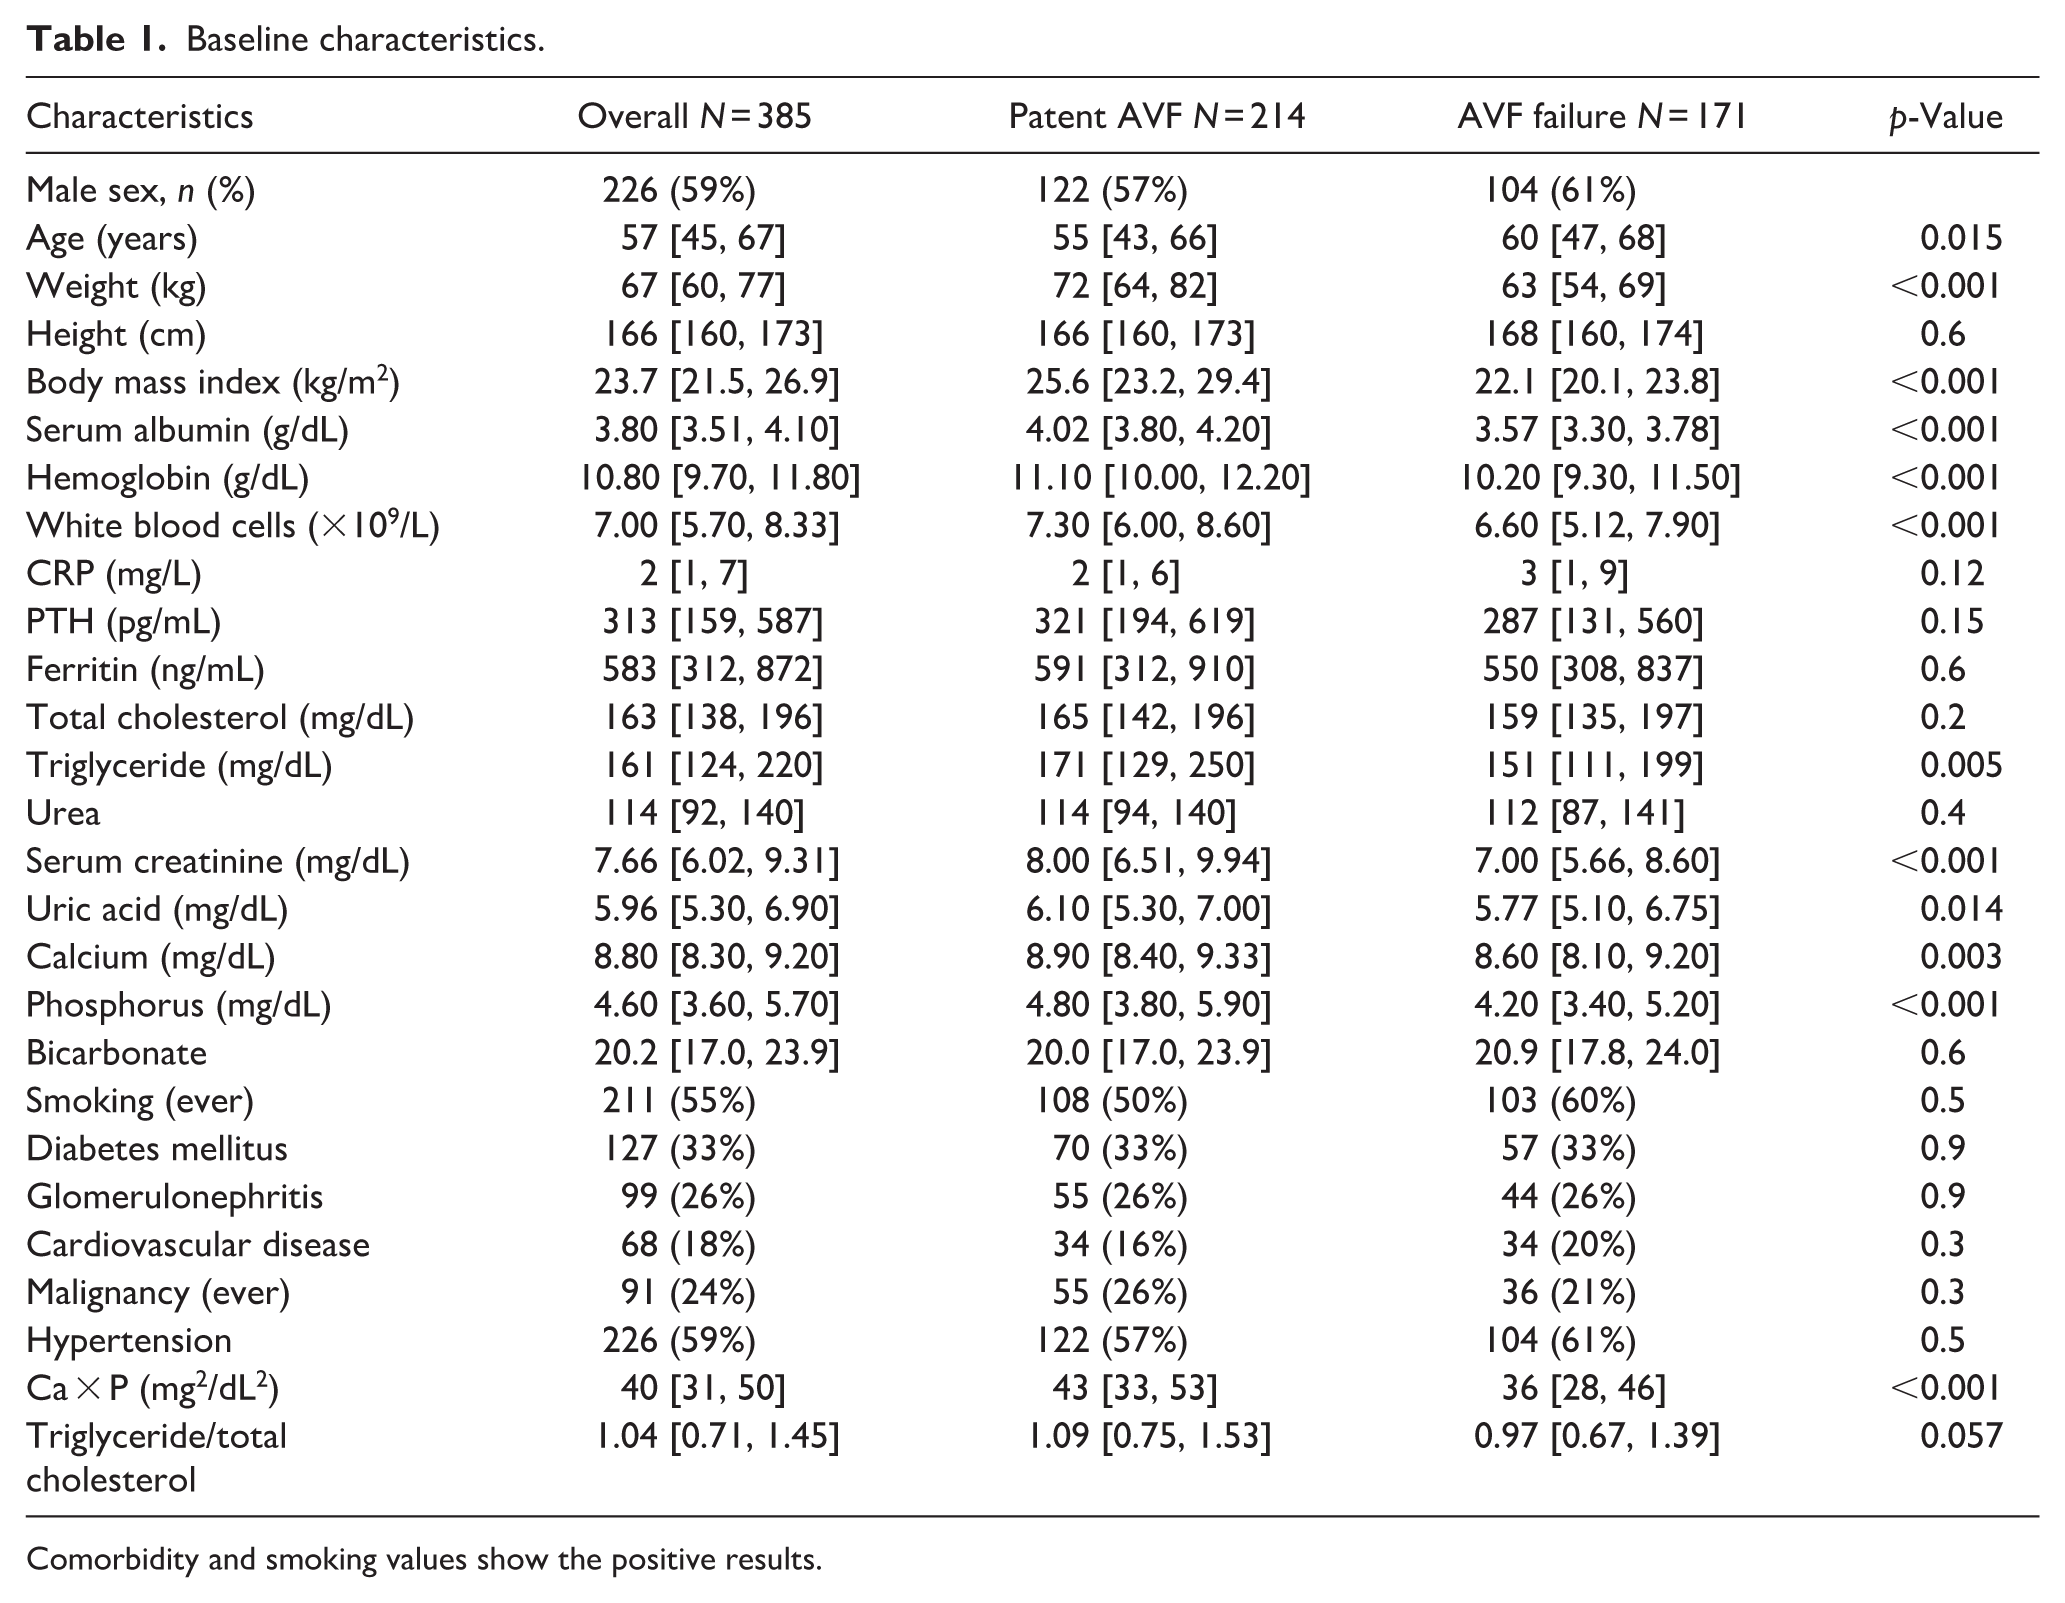
Comorbidity and smoking values show the positive results.
Predictors of AVF failure (multivariable logistic regression)
Multivariable logistic regression identified several independent predictors of AVF failure. Higher serum urea levels and lower body mass index (BMI) and serum albumin concentrations were each significantly associated with increased odds of AVF failure.
Specifically, for each 1 kg/m2 increase in BMI, the odds of AVF failure decreased by 35% (OR = 0.65, 95% CI 0.57–0.73, p < 0.001). Each 1 g/dL increase in serum albumin was associated with a 96% reduction in risk (OR = 0.034, 95% CI 0.009–0.111, p < 0.001), while each 1 mg/dL increase in serum urea increased the odds of failure by 1.1% (OR = 1.011, 95% CI 1.003–1.020, p = 0.005).
Model discrimination
Receiver operating characteristic (ROC) curves for all models on the held-out test set are shown in Figure 1. Logistic regression (GLM) achieved an AUC of 0.731, whereas LASSO, Random Forest, and XGBoost models reached AUCs of 0.876, 0.918, and 0.884, respectively.
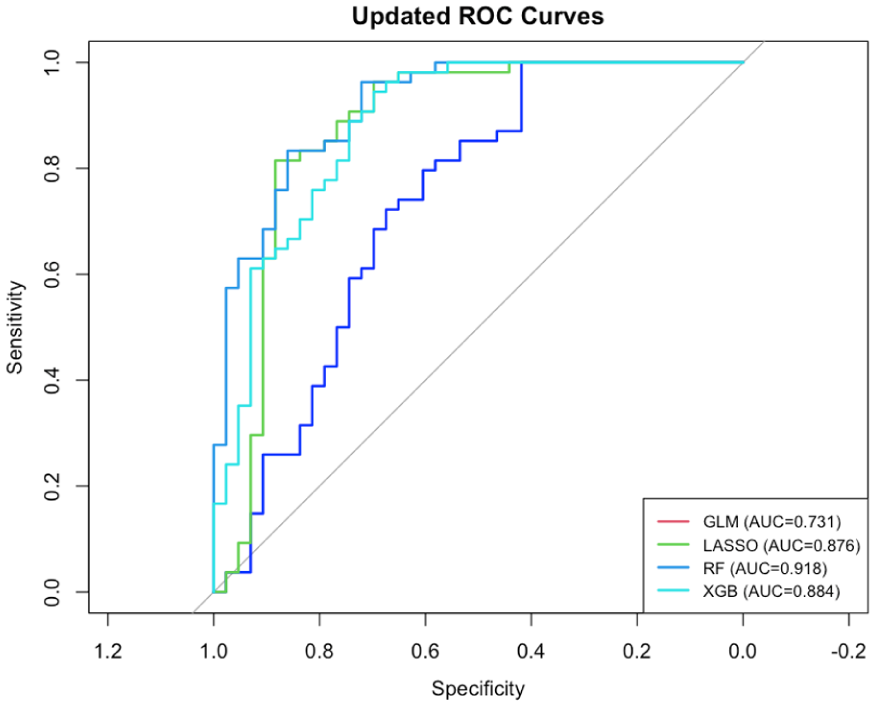
Receiver operating characteristic (ROC) curves for all models on the test set
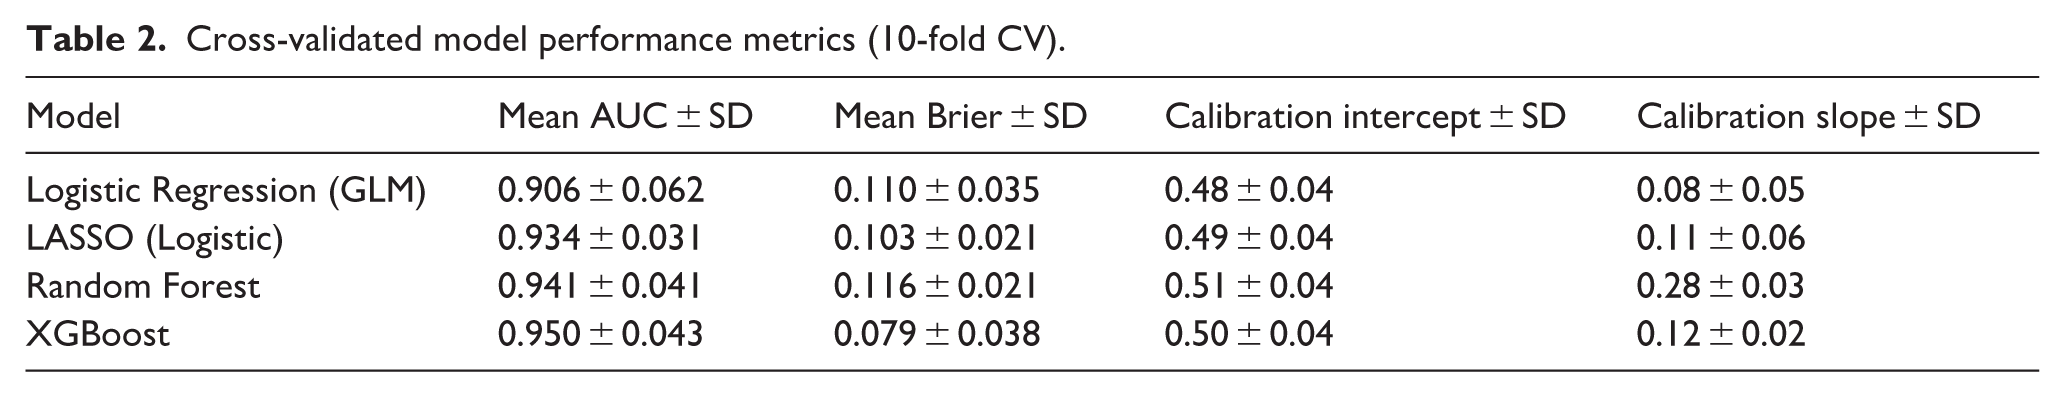
Cross-validated performance metrics are summarized in Table 2 showing mean ± SD AUCs of 0.906 ± 0.062 (GLM), 0.934 ± 0.031 (LASSO), 0.941 ± 0.041 (RF), and 0.950 ± 0.043 (XGBoost). Together, these results show machine-learning models show improved discrimination compared to standard logistic regression, with XGBoost providing the most consistent discrimination across validation and test datasets. The larger CV-test gap for GLM (0.175) compared to LASSO (0.058), Random Forest (0.023), and XGBoost (0.066) reflects the stabilizing effect of regularization and ensemble methods on generalization performance.
Cross-validated model performance metrics (10-fold CV).
Model calibration
Probability calibration was satisfactory for all models (Table 2, Figure 2). Brier scores ranged from 0.079 ± 0.038 (XGBoost) to 0.113 ± 0.027 (Random Forest), indicating good overall probability accuracy. Calibration slopes and intercepts indicated acceptable agreement between predicted and observed risks (Figure S1). XGBoost achieved the best balance between discrimination and calibration performance.
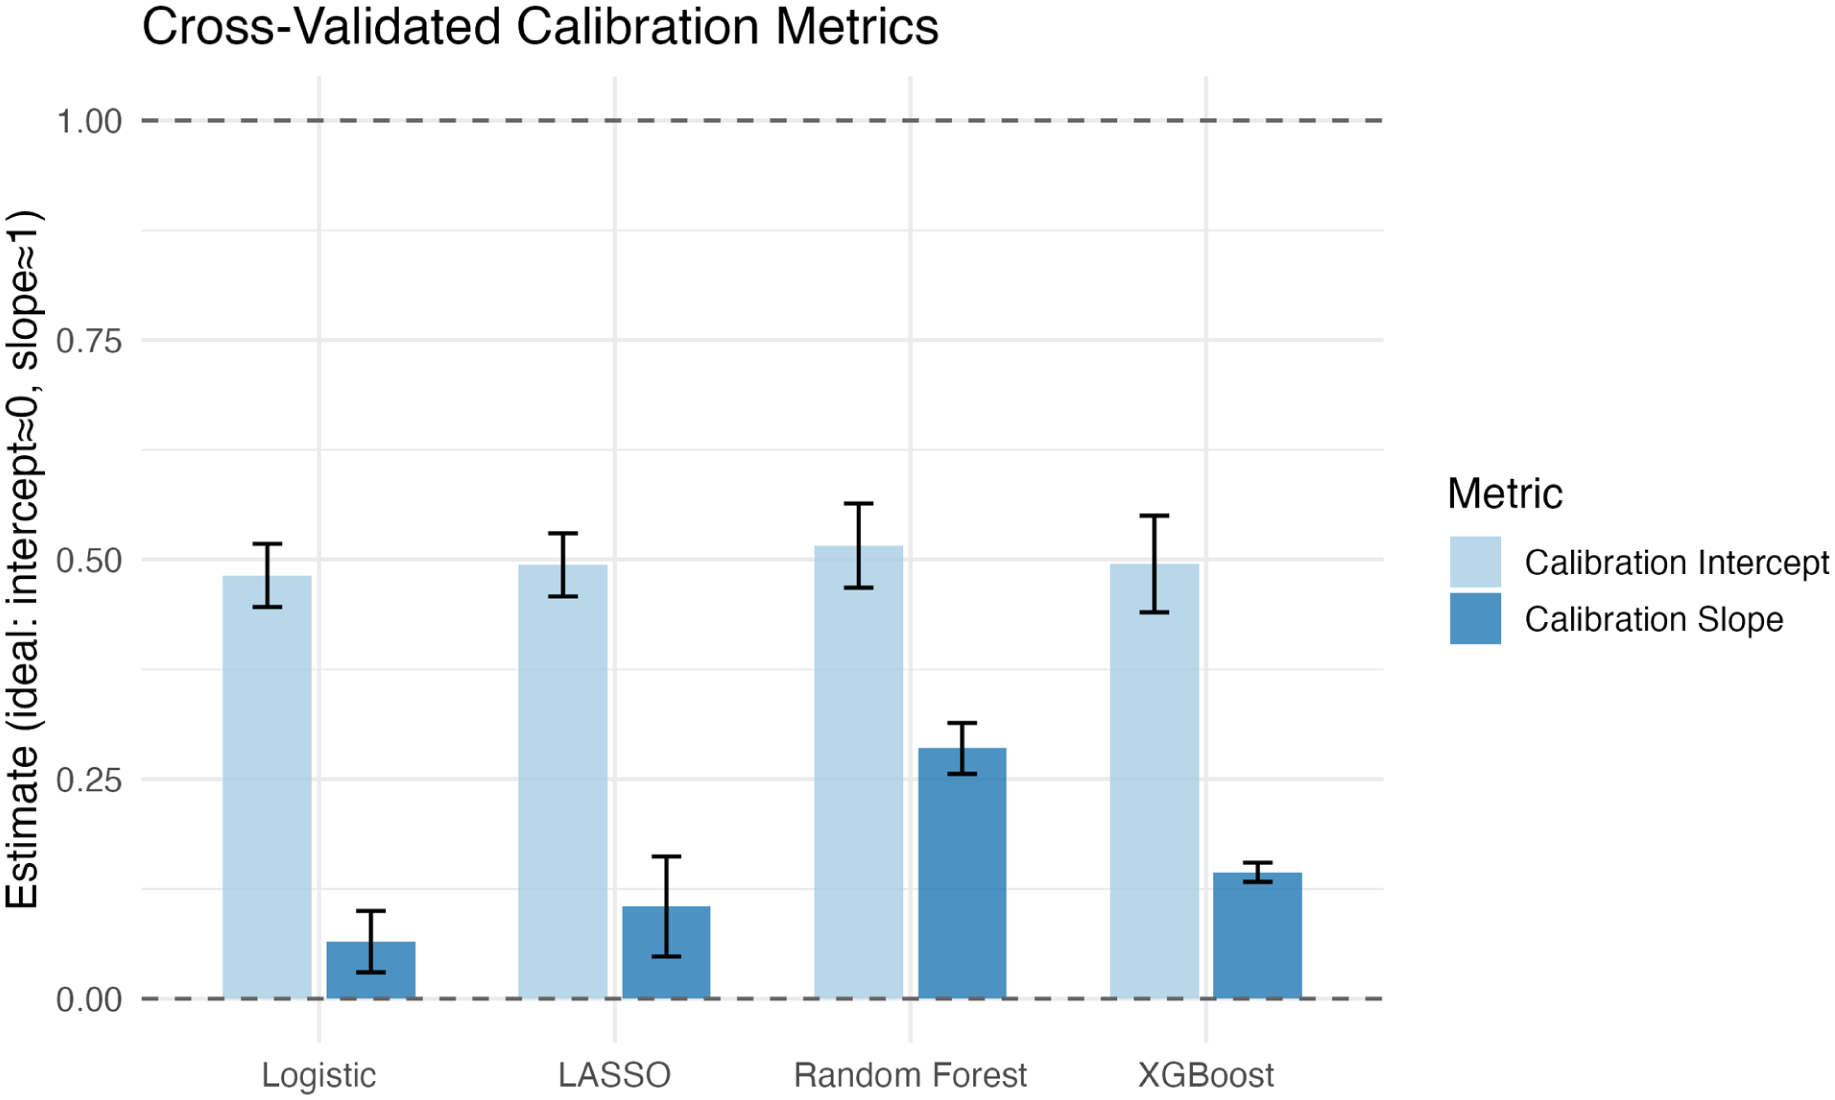
Cross validated calibration performance.
Threshold-based classification performance
Across all models, sensitivity remained ⩾0.90, with specificity increasing progressively from 0.1 to 0.5 thresholds. At the 10% threshold, all models achieved perfect sensitivity (1.00) whereas specificity remained inadequate (0.49–0.81). Increasing the threshold to 0.30 provided the best balance of diagnostic accuracy, sensitivity, and specificity. Above 0.5, sensitivity declined markedly while specificity approached 1.00; however with diminished utility in clinical practice. This pattern suggests that a 30% threshold may represent a clinically pragmatic cut-off for identifying patients at high risk of AVF failure.
Decision curve analysis
Decision-curve analysis (Figure 3) demonstrated consistent positive net benefit for all models. These profiles indicate that use of model-based risk prediction would offer measurable clinical advantage for risk-guided vascular-access surveillance.
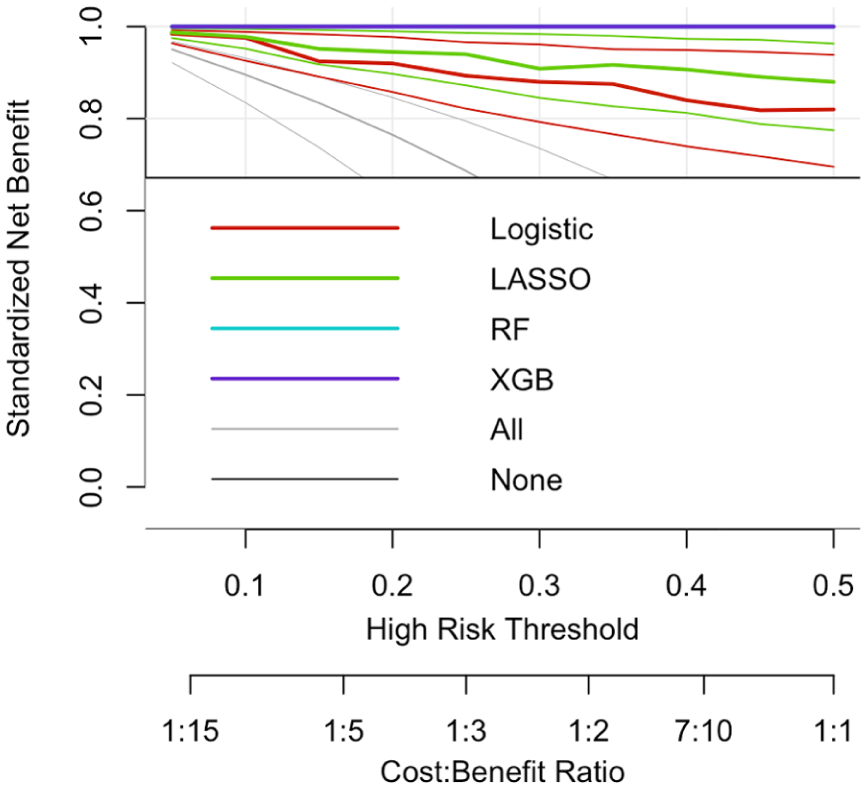
Decision-curve analysis comparing model net benefit across thresholds.
Development of the clinical risk scoring system
Coefficients from the final penalized logistic regression model (LASSO, λ1ₛₑ; AUC = 0.97, Brier = 0.11) were used to create a practical clinical risk score to support clinical decision-making. Eight variables were retained in the final penalized model: age, body mass index (BMI), serum albumin, urea, serum creatinine, serum phosphorus, smoking status, and malignancy. Because the effects of phosphorus were small and the negative coefficient for malignancy likely reflected competing risks, both variables were excluded from the tool to avoid clinical misinterpretation.
Continuous predictors were converted to categorical ranges using clinically meaningful cut-points derived from cohort medians and dialysis nutrition guidelines (e.g. albumin <3.5 g/dL, BMI <22 kg/m2, creatinine <7 mg/dL). The log-odds coefficients were rescaled to integer values preserving their relative magnitude and direction. Table 3 presents the final AVF Failure Risk Score, which allows manual calculation of total points without electronic tools.
AVF failure risk score (LASSO derived).
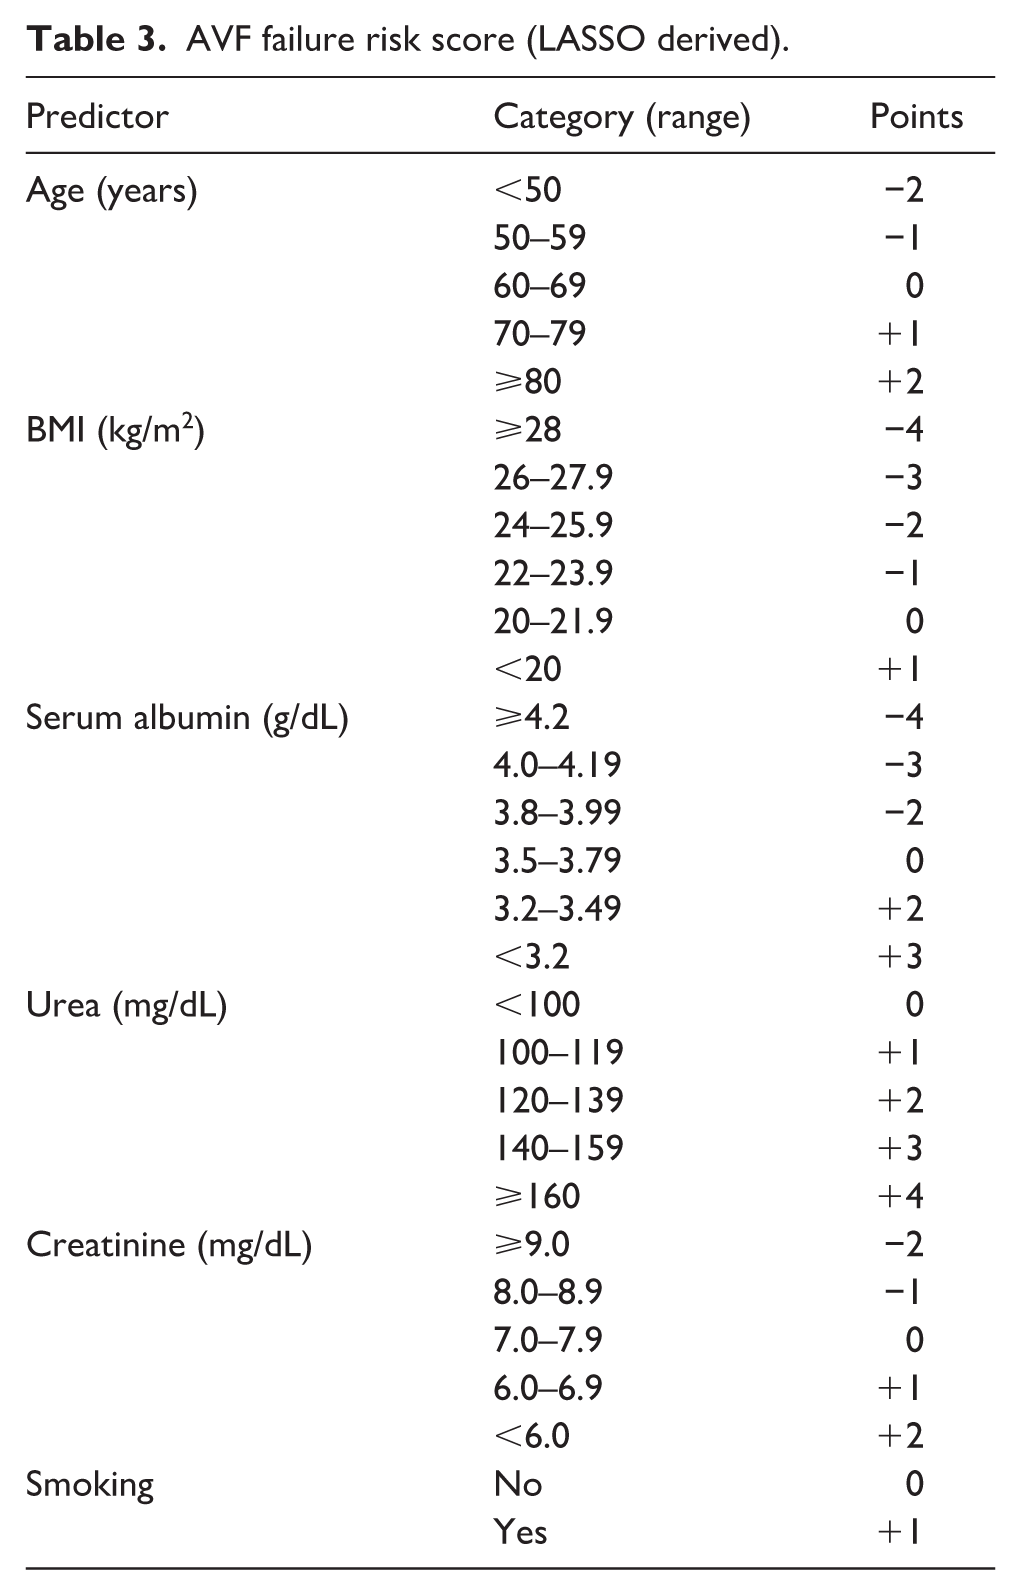
In this scoring system, lower albumin, lower BMI, older age, higher urea, lower creatinine, and smoking each contributed positive points (indicating higher failure risk). Albumin had the strongest relative weight, followed by BMI and urea, consistent with their penalized coefficient magnitudes.
Patients were stratified according to their total score as follows:
Low risk: ⩽3 points (<10% estimated probability)—routine follow-up
Intermediate risk: 4–7 points (10%–30%)—repeat clinical assessment or Doppler within 4–6 weeks
High risk: ⩾8 points (⩾30%)—high risk of fistula failure, exercise caution with surgical decision-making
This discrete scoring scheme maintains the model’s discrimination and calibration properties while providing a transparent, reproducible method for clinical risk assessment.
Discussion
This study demonstrated that novel machine learning approaches, particularly Random Forest and XGBoost, offer superior discrimination compared to traditional logistic regression in predicting AVF failure. Our best-performing model (XGBoost, AUC = 0.950 ± 0.043 in 10-fold CV) outperformed conventional approaches and compares favorably with recently published models. 10 Decision curve analysis confirmed meaningful clinical utility across relevant risk thresholds, supporting implementation for risk-stratified management.
Low BMI, hypoalbuminemia, and elevated urea emerged as dominant predictors. Albumin’s importance aligns with evidence linking malnutrition to impaired healing and protein-energy wasting,15,16 while higher BMI may reflect reverse epidemiology in hemodialysis populations. 17 Older age, higher urea, and lower creatinine (a proxy for muscle mass) further suggest that diminished physiological reserve and advanced uremia increase AVF failure risk through poorer vascular health, reduced remodeling capacity, and susceptibility to intimal hyperplasia.
A key strength is translating the statistical model into a hand-scored rubric. Many predictive models remain confined to datasets; by binning predictors into familiar categories and mapping points to risk bands (<10%, 10%–30%, ⩾30%), we provide a practical tool for vascular-access surveillance. Another strength is decision curve analysis, which quantifies clinical net benefit beyond discrimination. All ML models showed net benefit over default strategies across threshold probabilities of 10%–40%.
The discrepancy between cross-validated and test-set AUC for standard logistic regression (CV 0.906 vs Test 0.731) likely reflects sampling variability in the modest test set (n = 97) and the absence of regularization. Smaller CV-test gaps for penalized and ensemble models (LASSO: 0.934→0.876; Random Forest: 0.941→0.918; XGBoost: 0.950→0.884) indicate more stable generalization. As noted previously, AVF models often lose performance externally 12 ; thus our estimates should be considered hypothesis-generating pending validation.
The 30% predicted risk threshold has practical implications. At this cut-point, sensitivity remained high (0.96–1.00) with acceptable specificity (0.75–1.00). High-risk patients may benefit from enhanced mapping, alternative access consideration, closer surveillance, and nutritional optimization. Risk stratification should complement—not replace—access-specific assessment. Consistent with KDOQI guidance, surveillance should remain individualized 14 ; anatomical factors such as vessel diameter and configuration remain essential because the score reflects systemic rather than technical risk.
Misclassification consequences should be acknowledged. False positives increase surveillance burden and anxiety, whereas false negatives may delay detection and prolong catheter dependence. Prioritizing sensitivity at the 30% threshold reflects the greater clinical consequences of missed failure, though optimal thresholds depend on institutional resources and patient preferences.
Our finding that nutritional markers and reduced muscle mass predict AVF failure aligns with evidence linking frailty to vascular-access outcomes. Chan et al. highlighted combining frailty indices with biomarkers in dialysis decision-making 18 ; future models should incorporate validated frailty measures.
Several limitations warrant discussion. The model uses only demographic and laboratory variables, excluding anatomical predictors such as vessel diameter, depth, ultrasound quality, fistula configuration, and surgical factors, which were unavailable retrospectively.11,19 –21 Accordingly, it captures systemic patient risk rather than procedural determinants and should complement imaging and surgical assessment. The retrospective single-center design limits generalizability, and excluding patients who died or were transplanted with functioning access may introduce selection bias. The binary outcome does not reflect time-to-event variation; competing-risk survival models could provide additional insight. Despite internal validation, high discrimination may reflect residual overfitting, and prospective external validation is required before routine clinical use. 12
From a clinical perspective, the tool may support tailored surveillance: high-risk patients (⩾30%) could receive earlier Doppler evaluation, whereas low-risk patients (<10%) may follow standard protocols. Future work should include multicenter validation, impact assessment on interventions and outcomes, and integration of anatomical or ultrasound variables.
Conclusion
Machine learning algorithms, particularly Random Forest and XGBoost, demonstrated improved discrimination compared with traditional logistic regression for predicting AVF failure, with strong cross-validated and test-set performance and favorable calibration and decision-curve profiles. BMI, serum albumin, and urea emerged as key predictors, consistent with the roles of nutritional status, uremic burden, and physiological reserve in vascular remodeling.
A 30% predicted-risk threshold provides a pragmatic trigger for intensified surveillance, enabling personalized follow-up such as earlier imaging, closer monitoring, or preventive intervention. Because AVF failure is associated with catheter dependence and adverse outcomes, risk-stratified management may improve access patency and downstream patient outcomes.
External validation and prospective implementation studies remain necessary. Integration into clinical workflows or electronic health records could facilitate routine risk assessment, and future research should determine whether targeted interventions in high-risk patients translate prediction into improved clinical outcomes.
Supplemental Material
sj-docx-1-jva-10.1177_11297298261432153 – Supplemental material for From algorithms to action: Risk stratification for arteriovenous fistula failure in hemodialysis
Supplemental material, sj-docx-1-jva-10.1177_11297298261432153 for From algorithms to action: Risk stratification for arteriovenous fistula failure in hemodialysis by Sibel Ada, Berrak Itır Aylı and Tolga Onur Badak in The Journal of Vascular Access
Footnotes
Declaration of conflicting interests
The authors declared no potential conflicts of interest with respect to the research, authorship, and/or publication of this article.
Funding
The authors received no financial support for the research, authorship, and/or publication of this article.
Ethical approval
The ethical approvals for the study were obtained from Adana City Hospital Ethics Committee (Approval Number: 901 date: 20.11.2025).
Consent to participate
Written consent was not obtained due to the retrospective design of the study.
Data sharing statement
The data has not been made publicly available due to patient privacy, but can be obtained de-identified from the corresponding author upon request.
Supplemental material
Supplemental material for this article is available online.
References
Supplementary Material
Please find the following supplemental material available below.
For Open Access articles published under a Creative Commons License, all supplemental material carries the same license as the article it is associated with.
For non-Open Access articles published, all supplemental material carries a non-exclusive license, and permission requests for re-use of supplemental material or any part of supplemental material shall be sent directly to the copyright owner as specified in the copyright notice associated with the article.