
Abstract
Purpose:
With an ageing population, the number of total hip arthroplasty (THA) performed in osteoporotic patients is increasing. Cemented stems are often chosen for osteoporotic bone owing to their lower fracture risk. However, how bone quality influences stress distribution after cemented stem insertion remains unclear. This study compared femoral stress distribution between normal and osteoporotic femora using thermoelastic stress analysis (TSA).
Materials and methods:
6 composite femora were used: 3 normal adult male models (#3403) and 3 osteoporotic models (#3503). C-stem AMT cemented stems were implanted with a standardised technique. TSA was conducted before and after stem insertion under physiological loading (normal: 100–1900 N; osteoporotic: 100–1000 N). Stress distribution was analysed by Gruen zones and compared using linear mixed models.
Results:
In the normal models, stress uniformly decreased after stem insertion with a distal shift of peak stress. In the osteoporotic models, proximal stress decreased markedly, while distal stress (zones 4L, 4M) increased, demonstrating a more pronounced distal shift.
Conclusions:
Bone quality strongly affects load transfer after cemented stem insertion. Osteoporotic bone demonstrated proximal stress loss and distal concentration, possibly underlying atypical periprosthetic femoral fractures. TSA provides useful insights for implant design and surgical planning in osteoporotic THA.
Keywords
Introduction
The ageing population has led to an increased number of total hip arthroplasties (THA) performed in older patients with osteoporosis.1–3 Osteoporotic patients have fragile bone quality and are at higher risk of postoperative complications, including periprosthetic femoral fractures and implant loosening.4,5 Particularly in older and osteoporotic patients, cemented stems have been reported to have lower postoperative femoral fracture rates compared with cementless stems,6,7 leading to increased recommendations for cemented stem selection.
In THA, stem insertion alters the load-transfer pattern of the femur, resulting in changes in stress distribution. These changes in load transfer patterns vary significantly depending on implant surface characteristics, design geometry, fixation method, and patient bone quality. 8 Particularly in osteoporotic bone with reduced stiffness, load distribution and transfer may differ from normal bone, potentially altering stress distribution around the stem. These factors influence initial fixation stability, bone remodelling, and risk of periprosthetic fractures, thereby affecting postoperative outcomes.9–11
Previous studies have reported femoral stress distribution after cemented THA using finite element analysis (FEA) or strain gauge experiments. These studies consistently observed stress reduction in the proximal medial femur, known as stress shielding, with cemented stems.12–14 However, most evaluations have been limited to normal bone assumptions, and changes in stress distribution in poor bone quality have not been sufficiently clarified.
This study employed thermoelastic stress analysis (TSA) for evaluation. This method is an experimental technique that utilises the thermoelastic effect, in which minute temperature changes occur when an object deforms. Hyodo et al. 15 constructed a system to analyse stress distribution on the surface of composite femora after cemented stem insertion using TSA, and reported its effectiveness. By detecting these minute temperature changes with high-sensitivity infrared cameras and converting them into stress variations, surface stress distribution across the entire specimen can be evaluated. Unlike conventional strain gauge methods, this technique allows non-contact analysis of whole-surface stress distribution of the femur, and a high correlation with strain gauge measurements has been reported. In previous studies, TSA has primarily been applied to femoral stress analysis after cementless stem insertion.16–18
The purpose of this study was to analyse surface stress distribution of 2 types of composite femora with different stiffnesses after cemented stem insertion using TSA, and to clarify the influence of stiffness differences on stress distribution. In this study, we used composite femora with different stiffness simulating normal adult males and osteoporotic patients, performed TSA before and after cemented stem insertion, and compared changes in surface stress distribution.
Materials and methods
Materials
Composite femora
This study used 2 types of composite femur models reproducing the mechanical properties of normal adult males and osteoporotic patients. For the normal model, Composite Femur #3403 (Sawbones, Pacific Research Laboratories, Vashon, WA, USA) was used. This model reproduces the shape and mechanical properties of cadaveric femora from adult males with height 183 cm and weight approximately 890 N (about 90 kg). The cortical bone portion consists of Short-Glass-Fibre Reinforced Epoxy, and the cancellous bone portion consists of short-fibre-filled epoxy with density approximately 17 pcf (about 0.27 g/cm³), with the medullary canal also reproduced. Small inter-individual mechanical variation compared with biological bone has been reported.19,20 For the osteoporotic model, Composite Femur #3503 (Sawbones, Vashon, WA, USA) was used. This model has the same shape as the normal model but with thinner cortical bone made of Short-Glass-Fibre Reinforced Epoxy and cancellous bone composed of low-density polyurethane foam (0.16 g/cm³, 10 pcf). Mechanical testing with multiple osteoporotic cadaveric femora has confirmed that this model reproduces the bone strength of osteoporotic bone. 21
Stem and head
The C-stem AMT (DePuy Synthes, Johnson & Johnson, Warsaw, IN, USA) was used as the stem. This is a taper-slip type cemented stem with a polished surface finish and triple-taper geometry. 22 Stem placement was planned using 3-dimensional preoperative planning software, ZedHip (version 17.0.0, Lexi Co., Ltd., Tokyo, Japan), to reproduce the position of the femoral head centre of the composite femur (Figure 1). A neck cut line at 135° to the femoral shaft axis was set 15 mm proximal to the lesser trochanter on the medial side, and stem insertion alignment was standardised with neutral position in the varus-valgus plane, 2° flexion, and 10° anteversion. Size 3 High Offset was used for the normal model and Size 6 High Offset for the osteoporotic model, both combined with BIOLOX DELTA TS 32 mm, +9 head components (DePuy Synthes). PALACOS bone cement (Heraeus Medical, Germany) was used.
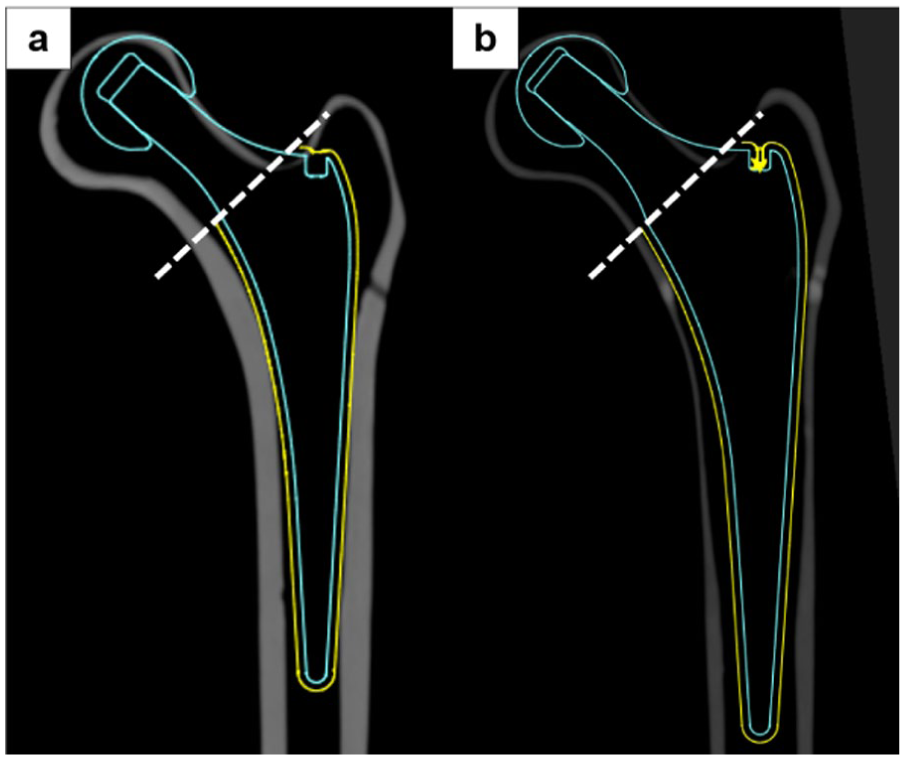
Preoperative planning for stem insertion. (a) Normal adult male model (b) Osteoporotic model. Using 3D preoperative planning software ZedHip (version 17.0.0), placement was planned to reproduce the position of the femoral head centre. The neck cut line was set at 135° to the femoral shaft axis, 15 mm proximal to the lesser trochanter on the medial side. Stem insertion alignment was standardised with neutral orientation in the varus–valgus plane, 2° flexion, and 10° anteversion.
Methods
Thermoelastic stress analysis
TSA is a non-destructive testing method that utilises the thermoelastic effect where minute temperature changes occur when materials undergo adiabatic elastic deformation. The thermoelastic effect was proposed by Thomson 23 and is expressed by the following equation:

Where: ΔT = temperature change of object (K), k = thermoelastic coefficient (1/Pa), T = object temperature (K), Δ(σ1 + σ2) = change in sum of principal stresses (Pa)
The thermoelastic coefficient is a material-specific value, and by measuring the temperature change ΔT caused by applied stress using high-sensitivity infrared cameras, the sum of principal stress changes Δ(σ1 + σ2) can be determined. The thermoelastic properties of the composite femur used in this experiment, with cortical bone composed of Short-Glass-Fibre Reinforced Epoxy, have already been established. For a temperature change of 1 K, the sum of principal stress changes by approximately 227 MPa, with a thermoelastic coefficient of 1.47 × 10−¹¹ [Pa−¹]. 15
Specimen preparation and stress distribution image acquisition
3 composite femora each of normal and osteoporotic models were used, totaling 6 specimens. Specimen preparation was performed by 2 hip surgeons experienced in THA surgical techniques. The distal portion of the composite femur was removed using an electric saw, and specimens were fixed to a specimen holder at 9° valgus and 2° flexion to reproduce loading conditions during single-leg stance. 24 To maintain consistent thermal emissivity, matte black heat-resistant paint (Asahipen Corporation, Osaka, Japan) was uniformly spray-applied to the composite femur surface (Figure 2(b)). Specimens in this state constituted the non-inserted groups (normal model: control S group; osteoporotic model: control O group).
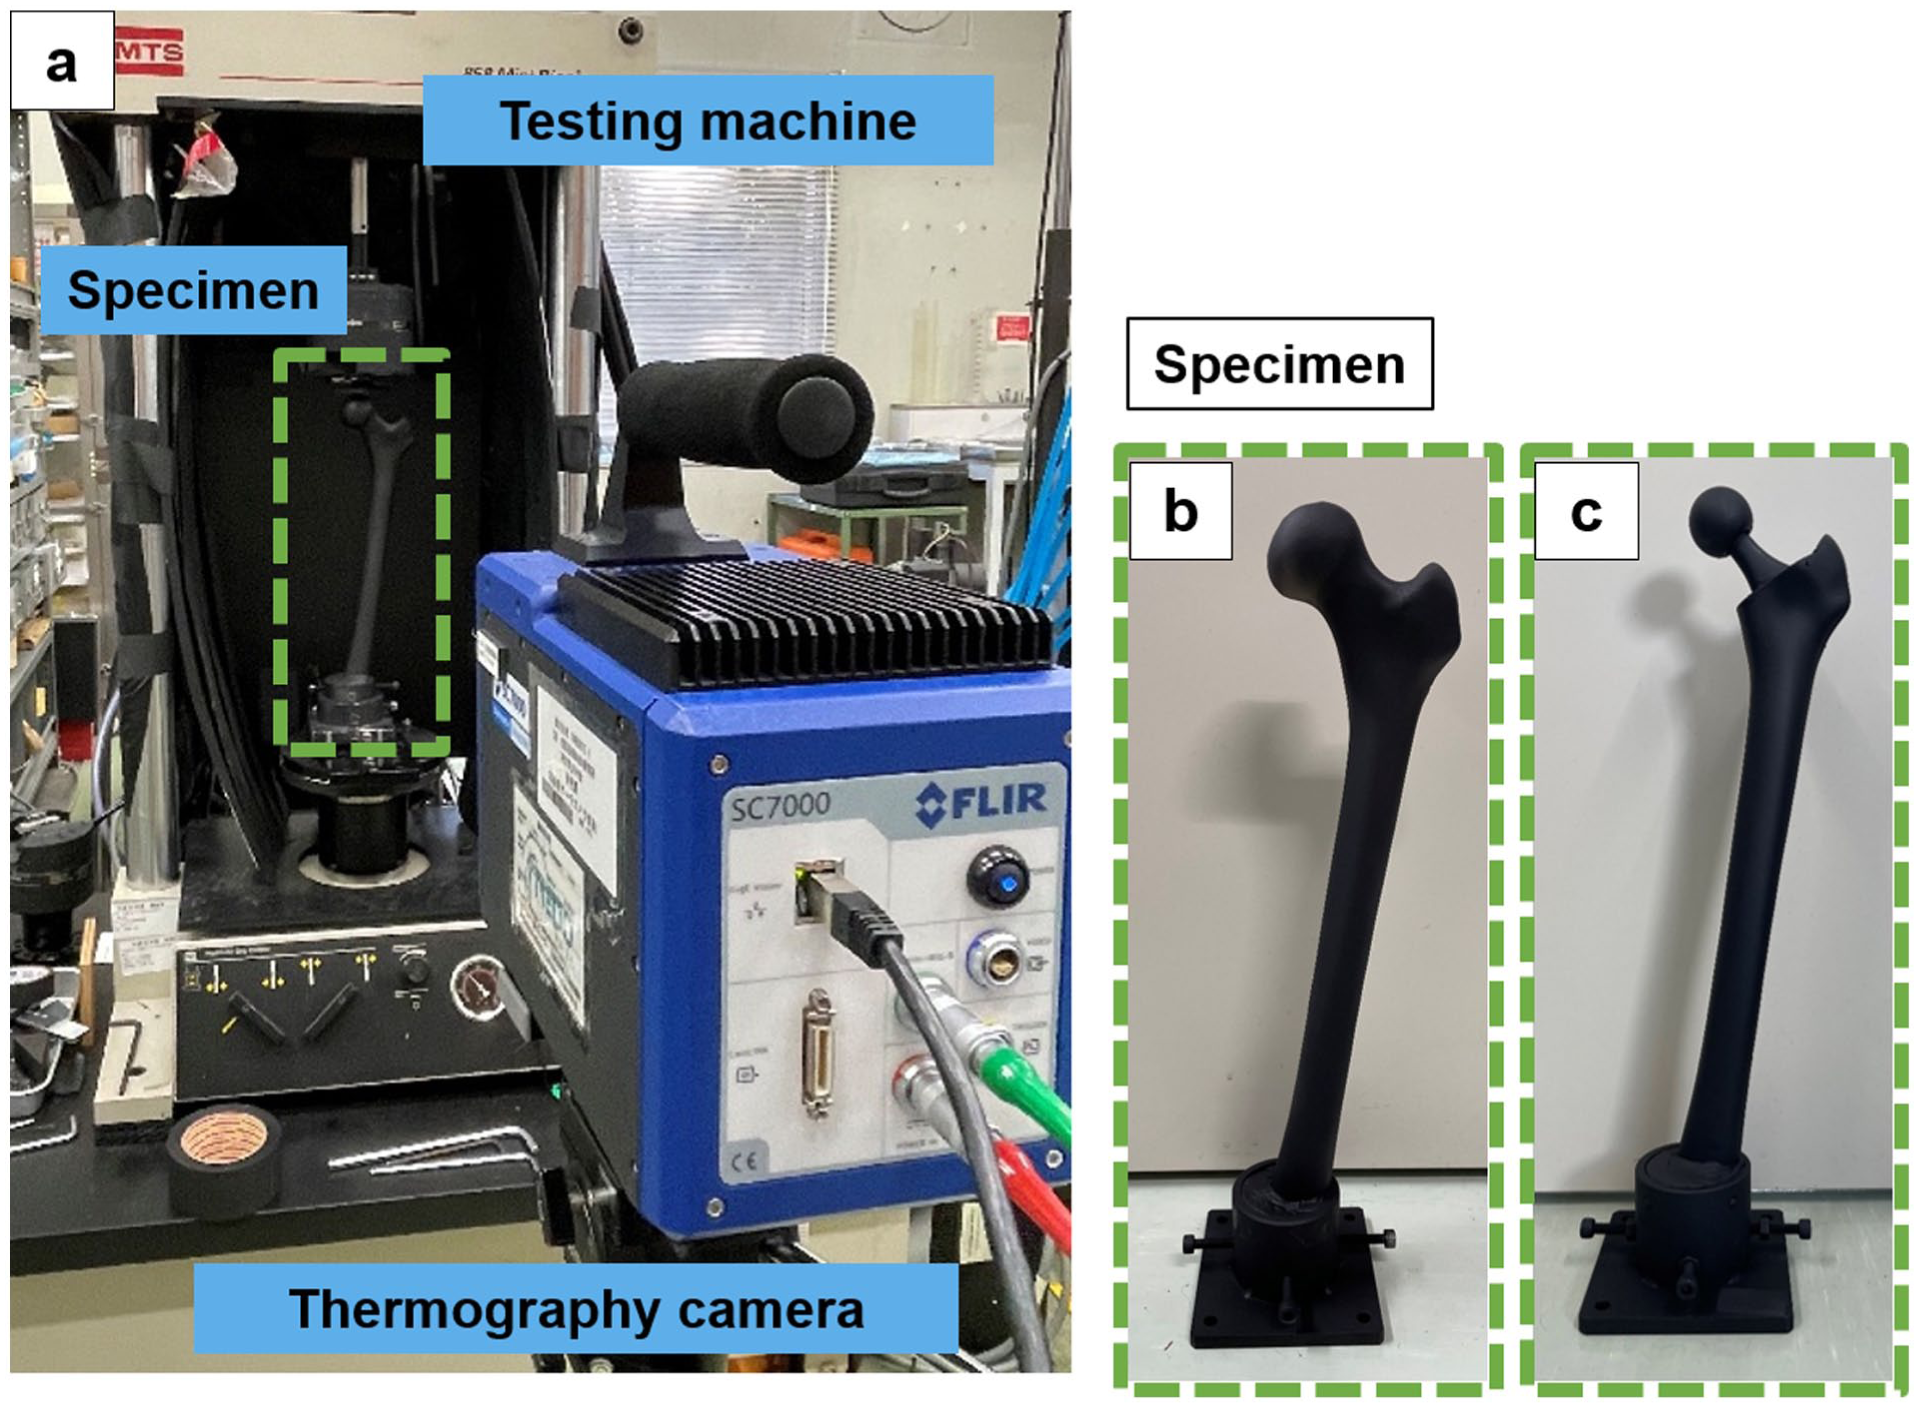
Experimental set-up and specimen appearance. (a) Experimental set-up. Specimens were mounted on a mechanical testing machine (MTS 858 Mini Bionix, MTS Systems Corporation) for thermoelastic stress analysis (TSA) under physiological loading. Loads were applied to the femoral head, and surface temperature changes were recorded using a high-sensitivity infrared thermography camera (CPA-SC7500, FLIR Systems). (b) Pre-insertion specimen (control group) (c) Post-insertion specimen after cemented stem insertion (insert group). A thin, uniform layer of black heat-resistant paint was applied to standardise thermal emissivity for TSA.
Composite femora were mounted on a hydraulic servo testing machine (MTS 858 Mini Bionix, MTS Systems Corporation, Eden Prairie, MN, USA), and cyclic sinusoidal compressive loads at 5 Hz were repeatedly applied vertically to the femoral head centre. For the normal model, a maximum load of 1900 N, approximately twice the assumed body weight of 90 kg (890 N), was set, with loads applied in the range of 100–1900 N. 25 For the osteoporotic model, based on the average body weight of elderly Japanese women (51 kg), the load range was set at 100–1000 N. 26 After load stabilisation, 4000 infrared images corresponding to 100 cycles were captured using an infrared stress measurement system (CPA-SC7500, FLIR Systems Inc., Wilsonville, OR, USA) (Figure 2(a)). The obtained images were processed using infrared stress measurement software (TSAvis, Ken Automation, Inc.) with lock-in processing synchronised to the load amplitude, to acquire stress distribution images of the femoral surface from four directions: anterior, posterior, medial, and lateral.
After measurement completion, stem insertion was performed on composite femora used as control groups. The neck was cut according to the placement plan, the medullary canal was rasped, and cement plugs were inserted 1 cm distal to the stem tip under fluoroscopic guidance. Vacuum-mixed bone cement was injected retrograde using a cement gun, and C-stem AMT was inserted under fluoroscopic guidance. Subsequently, black heat-resistant paint was again spray-applied to the surface to create inserted group specimens (normal model: insert S group; osteoporotic model: insert O group) (Figure 2(c)). TSA was performed on insert group composite femora under the same loading conditions as control groups to acquire stress distribution images.
Outcome measures
Visual assessment
Stress distribution images of each group were visually evaluated for colour intensity changes indicating stress variations.
Stress value measurement
Stress values (changes in the principal stress sum) were measured on the lateral and medial surfaces of composite femora. Average stress values were calculated for each zone, divided according to Gruen zones 27 (lateral: zones 1–4L; medial: zones 4M–7) (Figure 3). Statistical comparisons were performed between control and insert groups for each model. Stress values were calculated pixel by pixel, with each zone containing 600–800 pixels for zones 1, 2, 3, 5, 6 and 7, and 200–300 pixels for zones 4L and 4M.
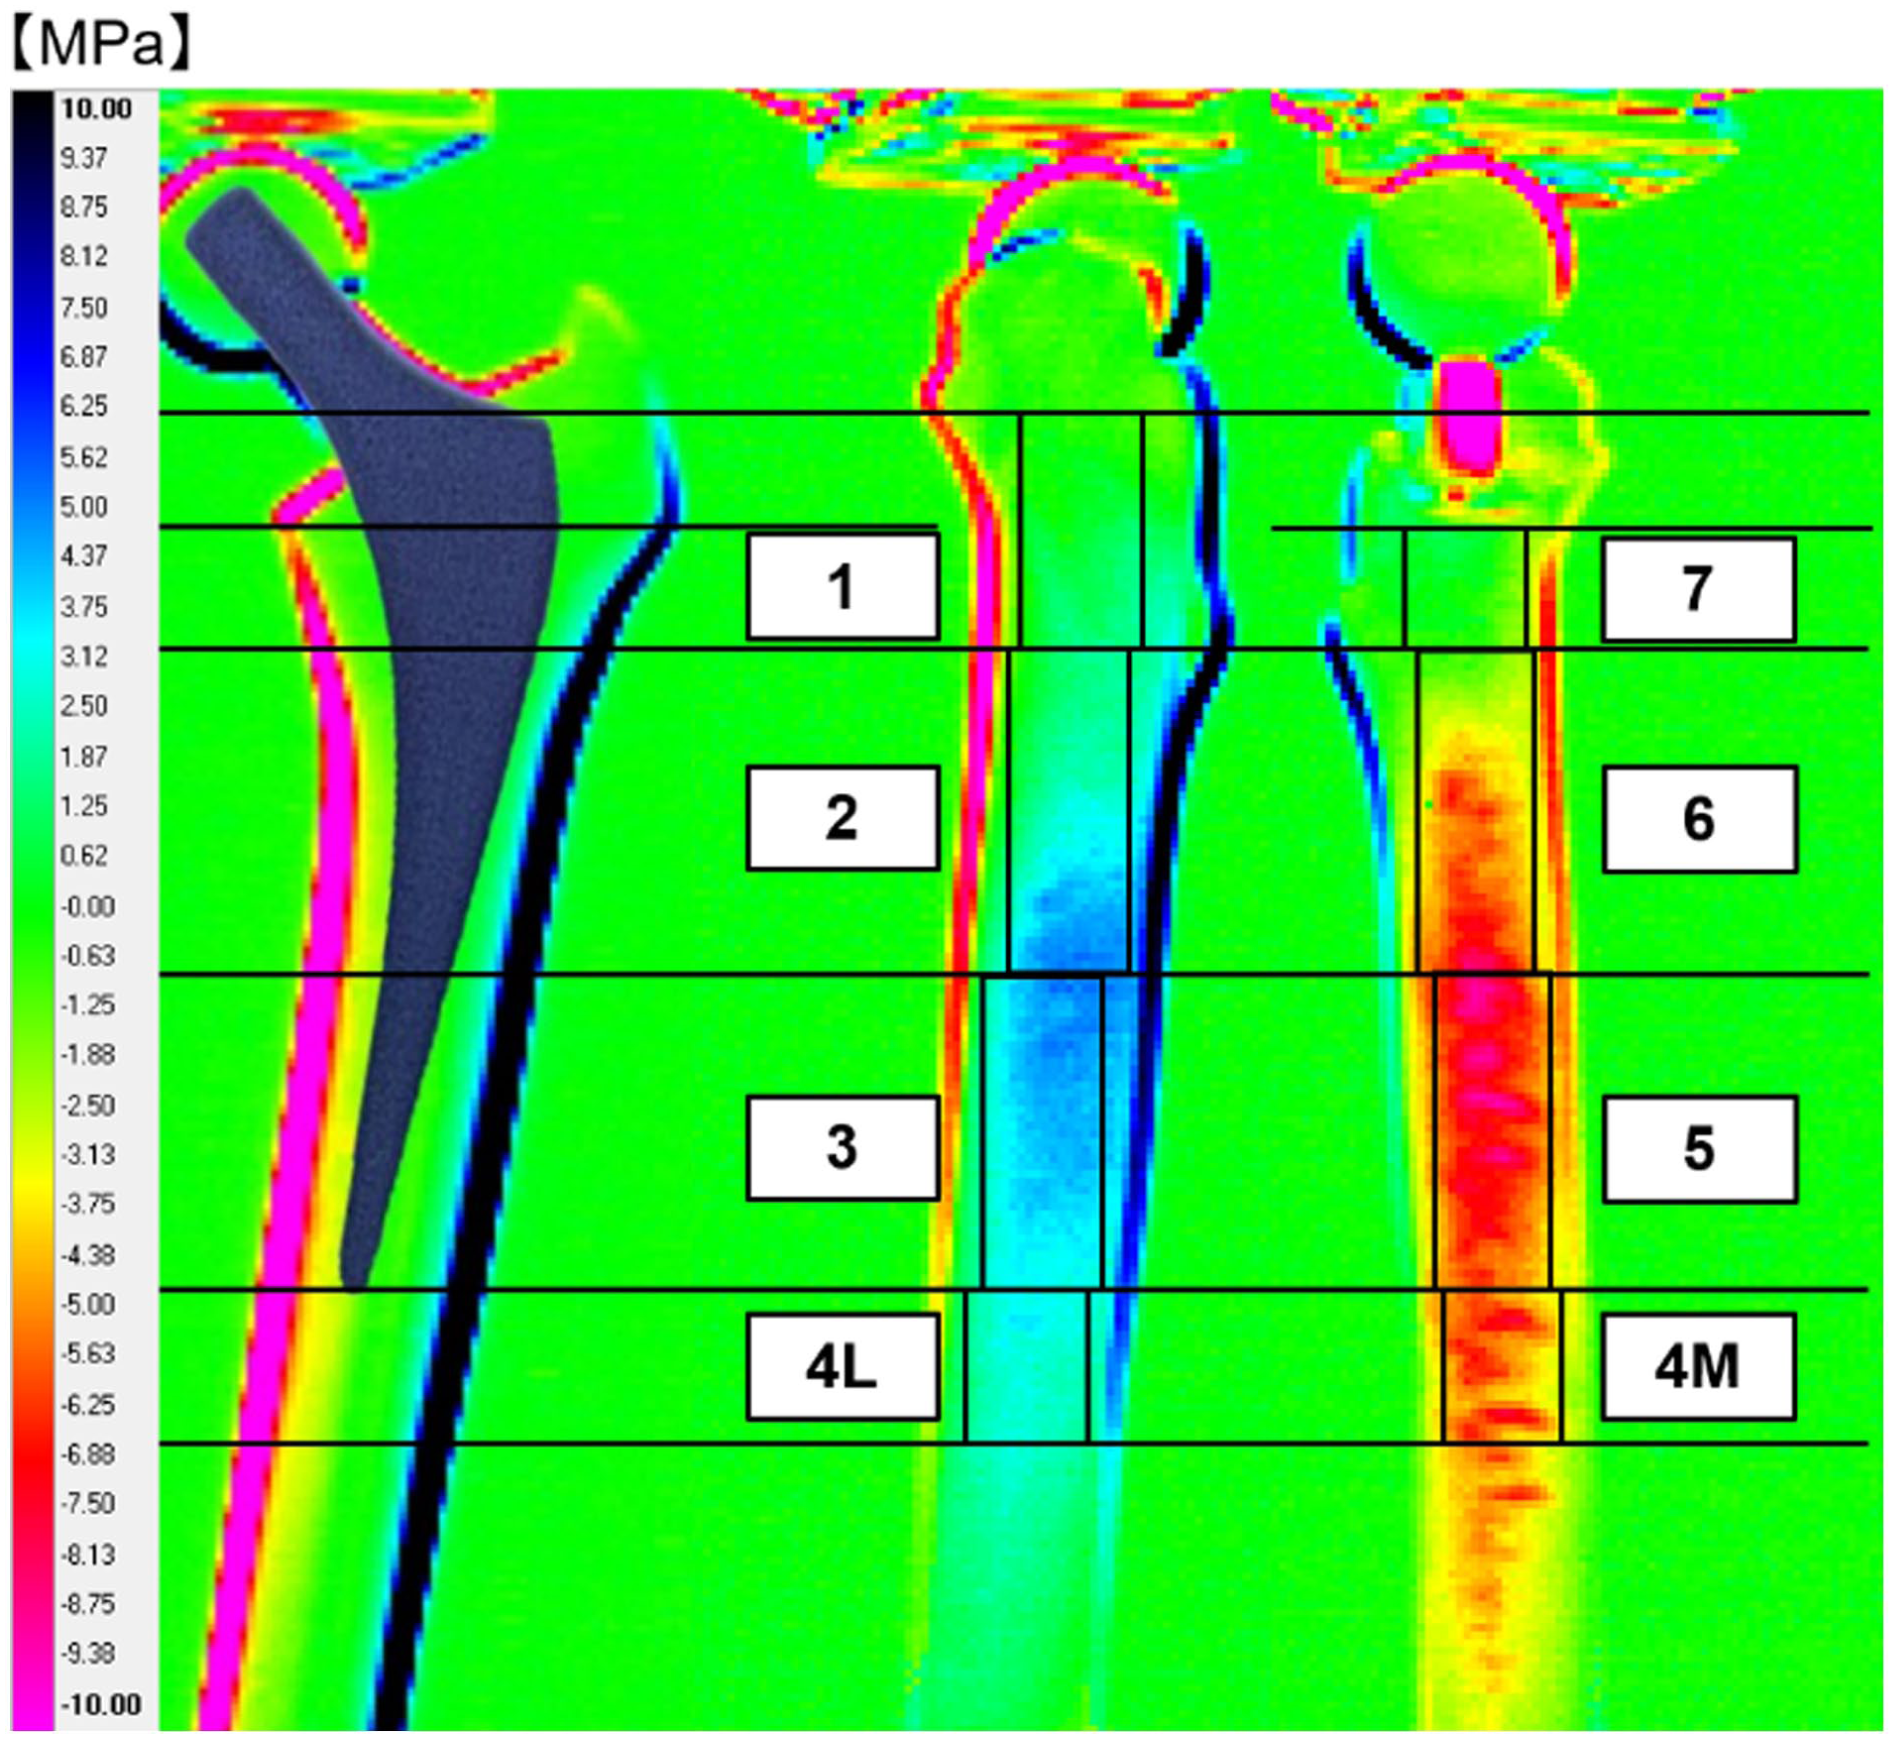
Zone classification diagram. Based on the Gruen zone classification, medial and lateral surfaces were divided into regions (zones 1, 2, 3, 4L, 4M, 5, 6, 7). Regions were defined excluding marginal artefacts to ensure accurate stress measurement.
Statistical analysis
Linear mixed models (LMM) were used to examine differences in stress values between groups. Group (control vs. insert) was set as a fixed effect, and individual composite femur differences were considered random effects (significance level
Results
Visual assessment
In the normal model, the insert S group exhibited overall lighter colouration compared with the control S group, visually confirming stress reduction. The difference was most evident in the proximal region. In the osteoporotic model, the insert O group showed lighter colouration proximally and darker colouration distally compared with the control O group (Figure 4).
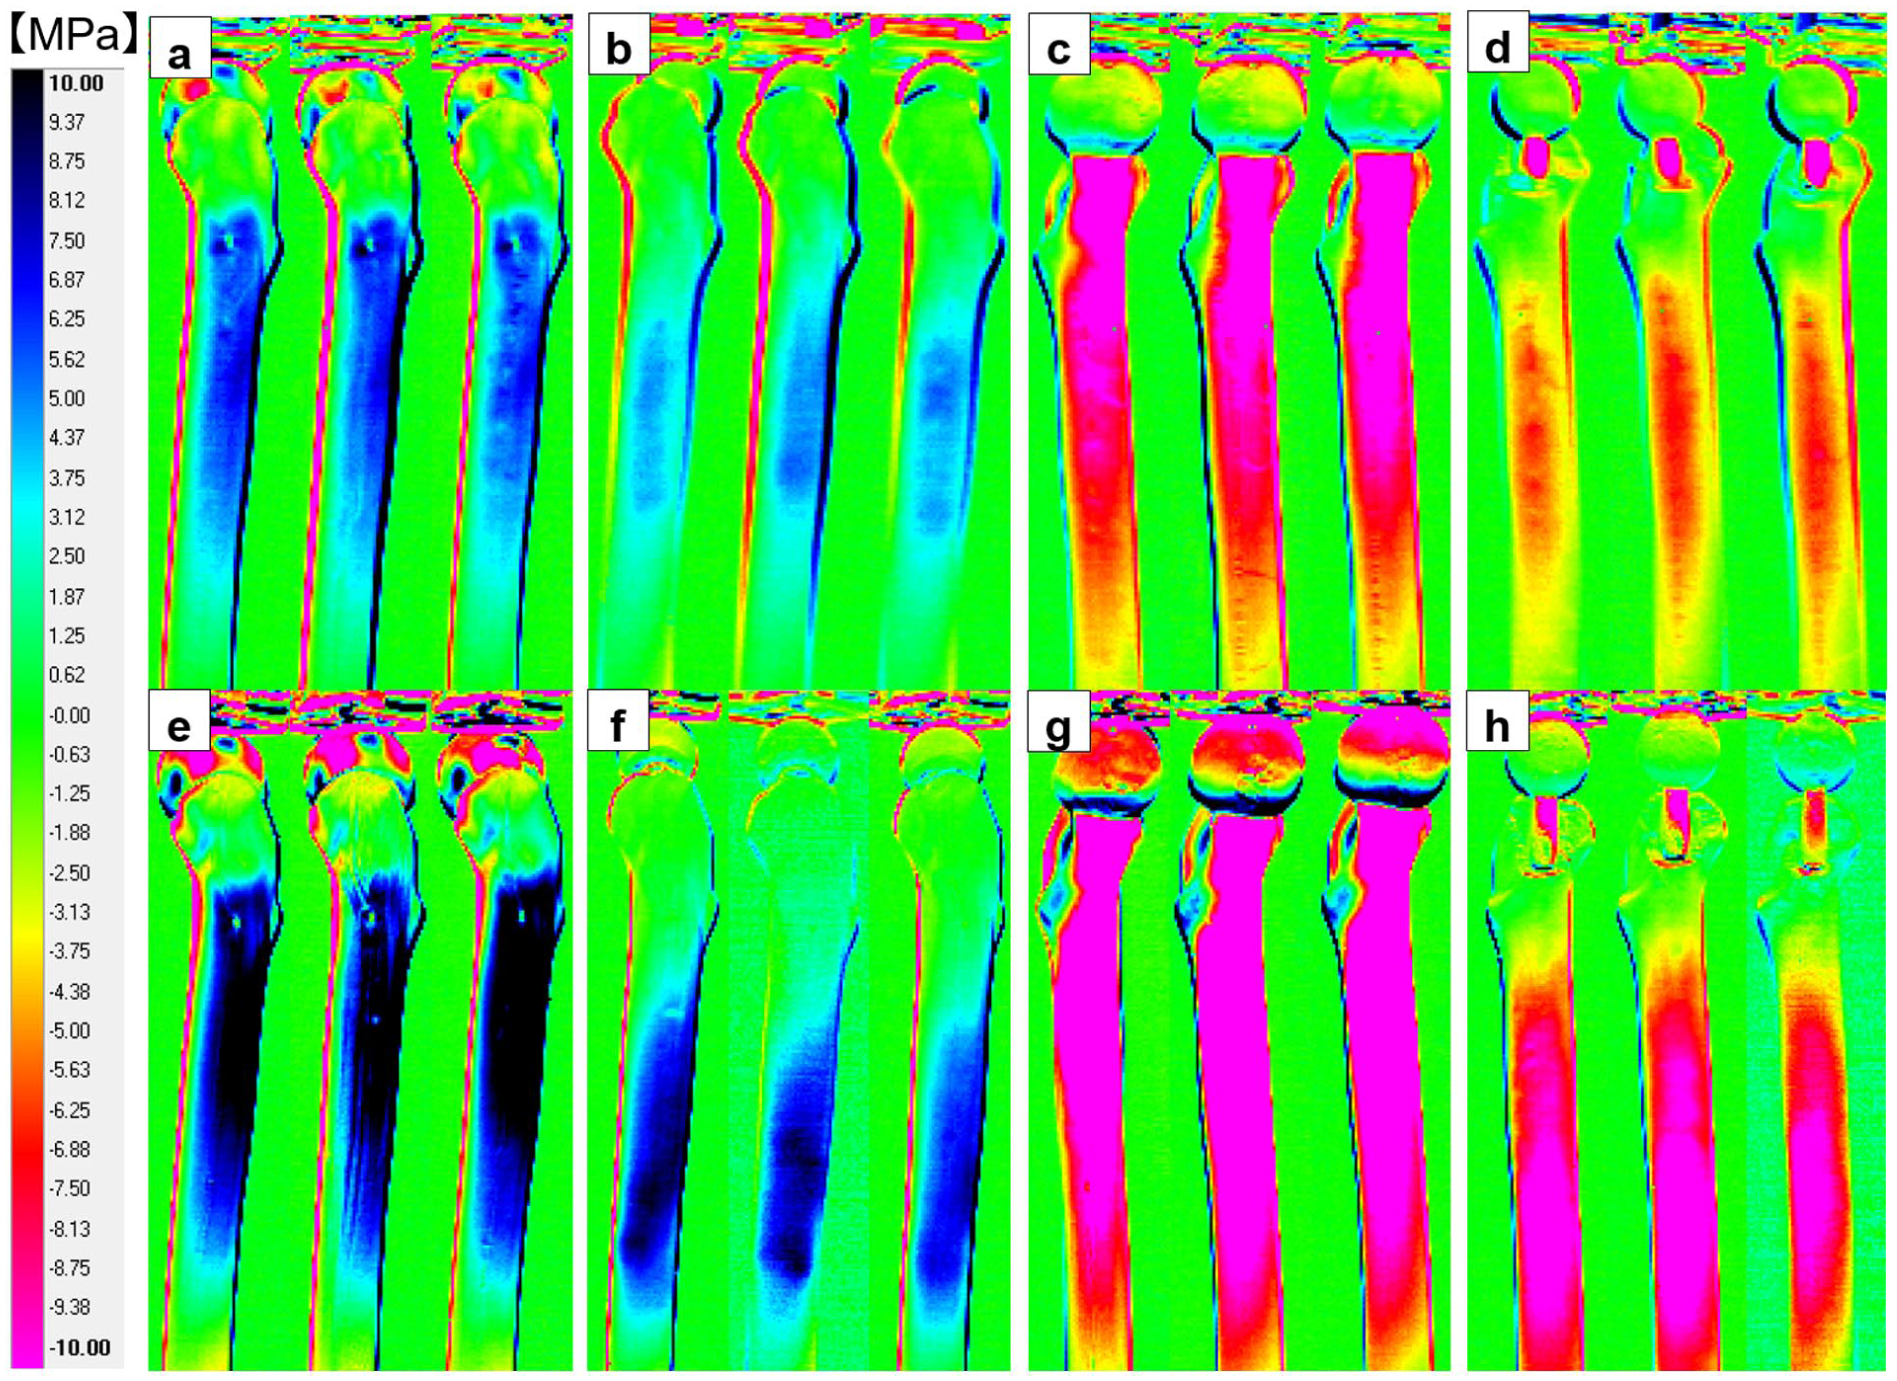
Comparison of thermoelastic stress analysis images in normal and osteoporotic models. ((a)–(d)) Normal model ((a) Lateral control S group (b) Lateral insert S group (c) Medial control S group (d) Medial insert S group). Blue colours indicate tensile stress on the lateral side, while red colours indicate compressive stress on the medial side. The insert S group shows overall lighter colouration compared with the control S group, indicating stress reduction, particularly marked in the proximal region. ((e)–(h)) Osteoporotic model ((e) Lateral control O group (f) Lateral insert O group (g) Medial control O group (h) Medial insert O group). Blue colours indicate tensile stress on the lateral side, while red colours indicate compressive stress on the medial side. The insert O group shows lighter colouration proximally and darker colouration distally compared with the control O group on both sides.
Stress evaluation
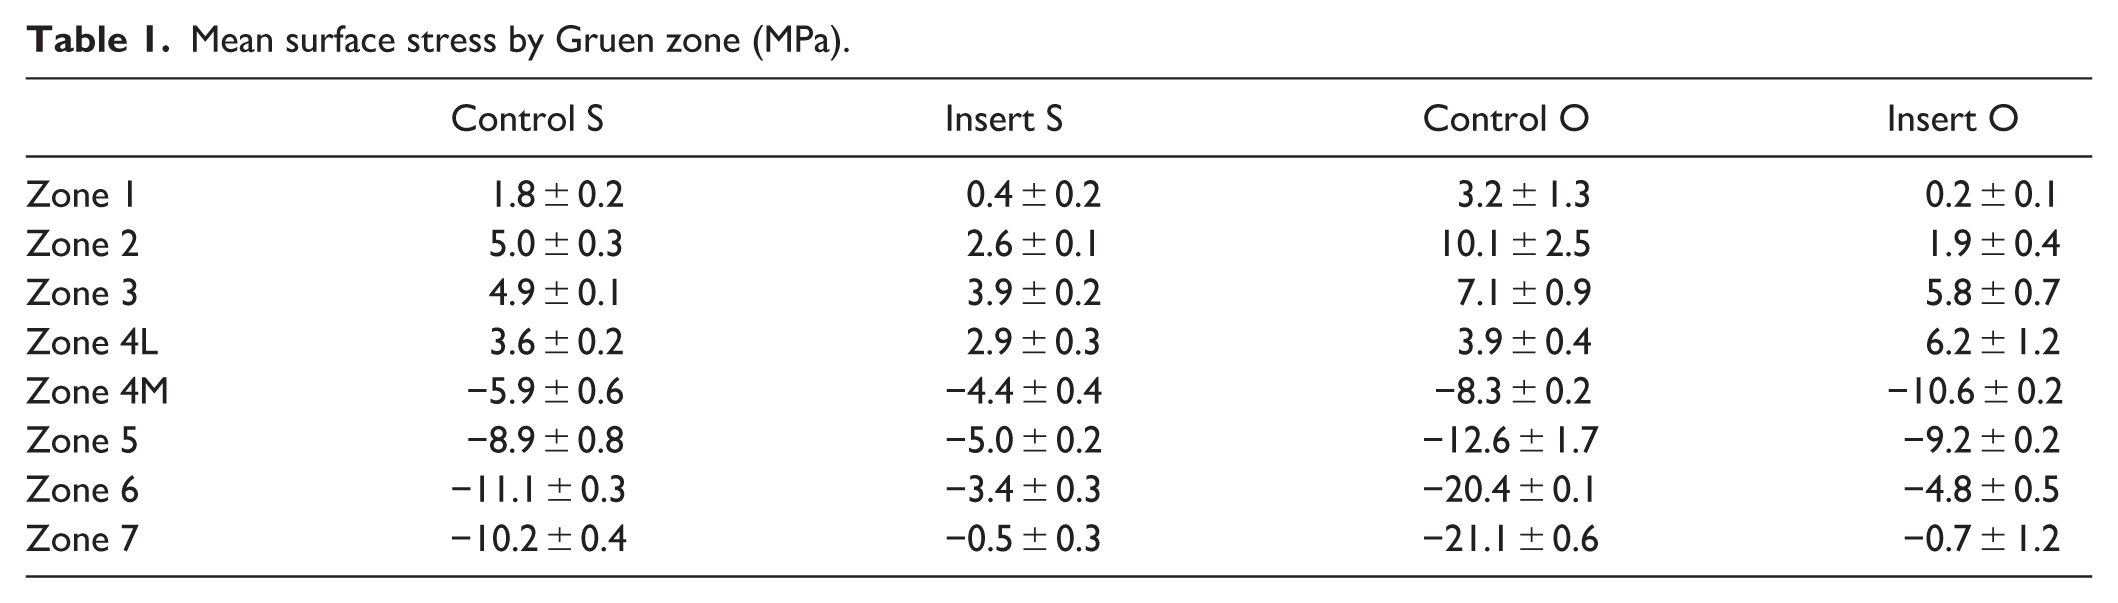
Statistical analysis revealed significant differences (p < 0.05) between control and insert groups across all zones in both normal and osteoporotic models (Figure 5). The mean surface stress by Gruen zone before and after stem insertion (MPa; negative values indicate compressive stress, positive values indicate tensile stress) is shown in Table 1.
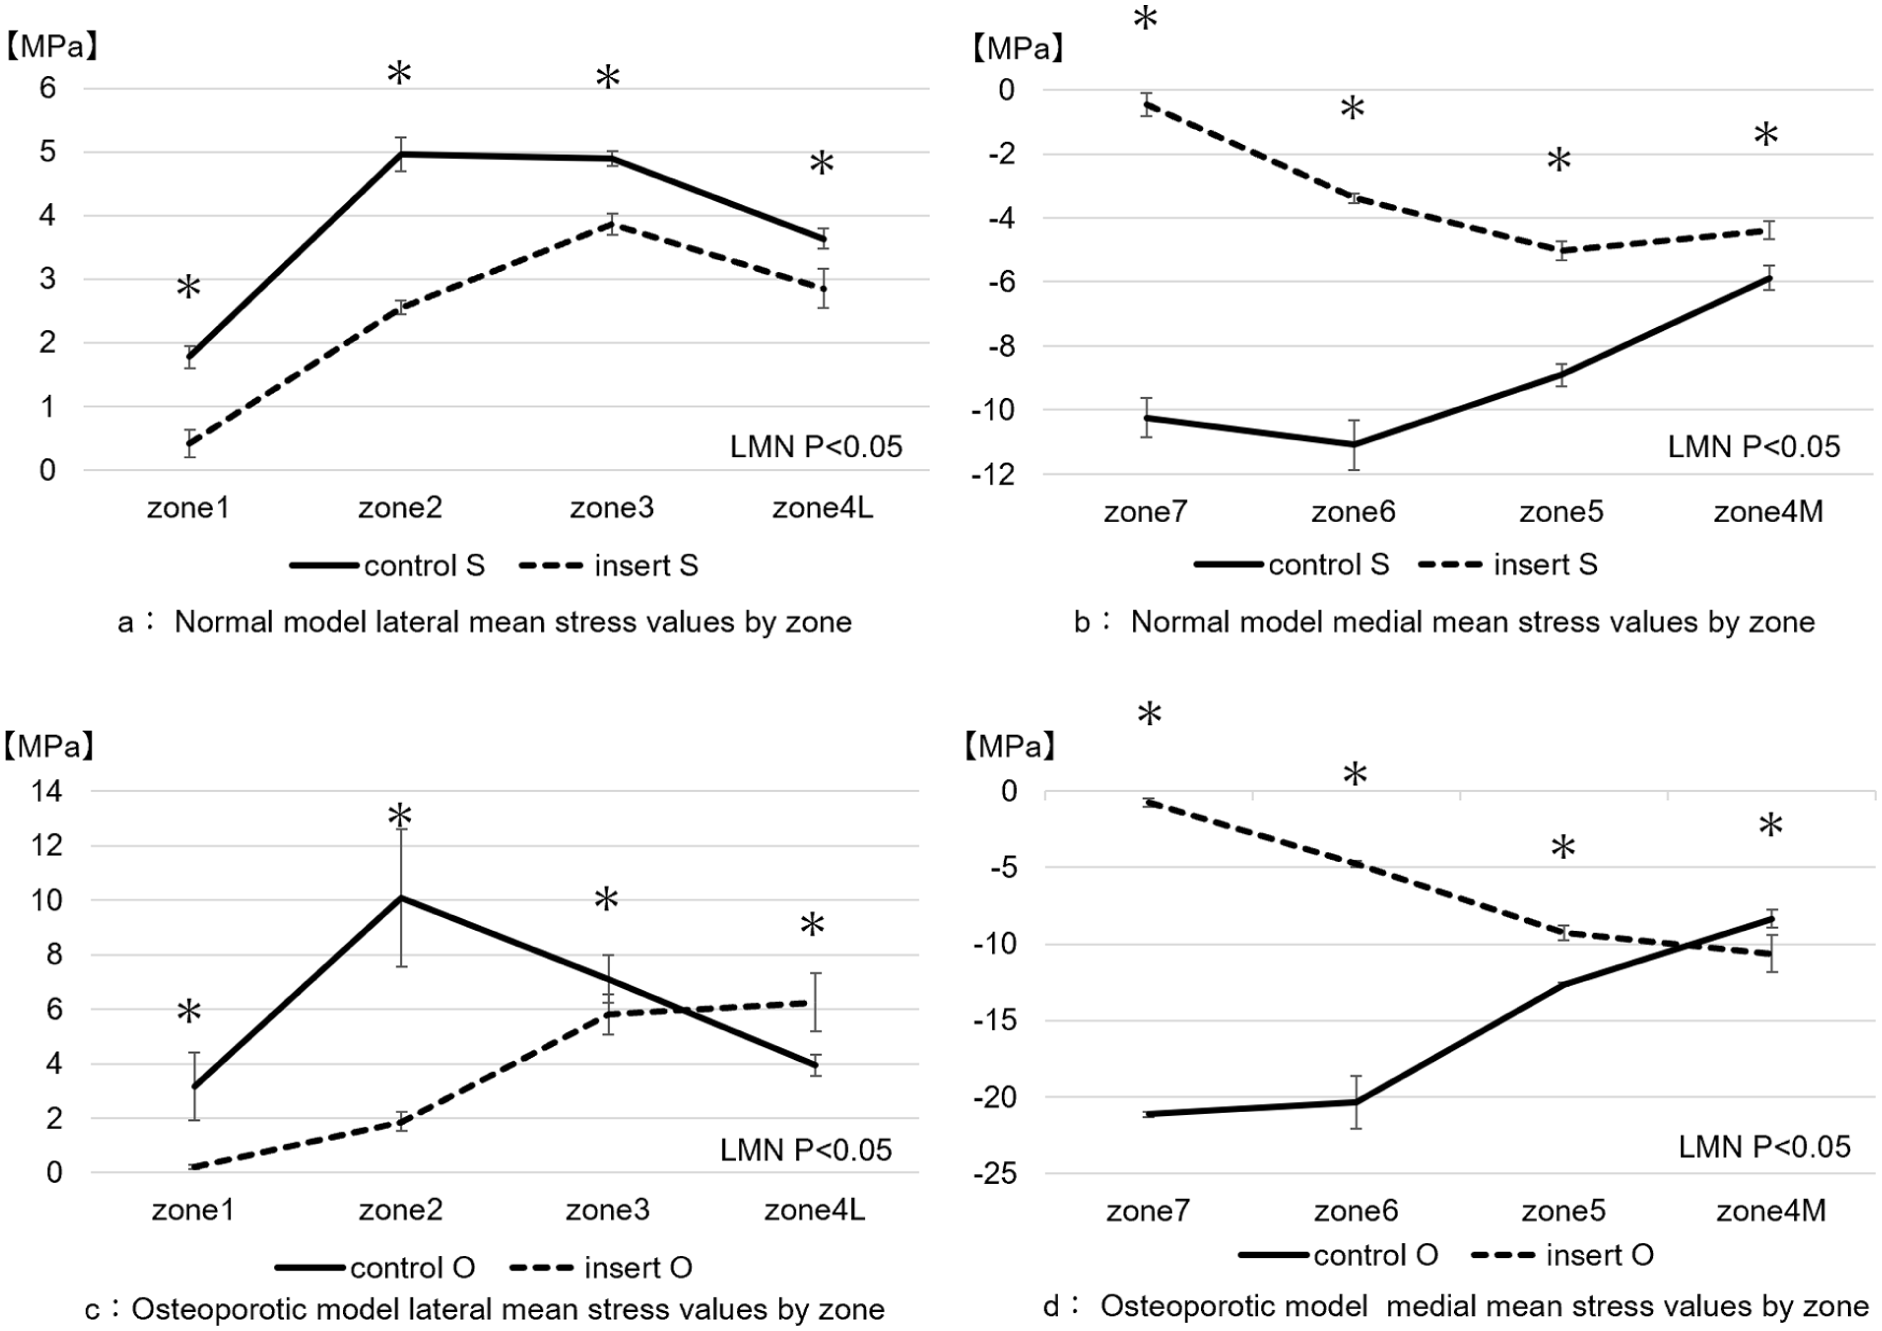
Comparison of stress values in normal and osteoporotic models. (a) and (b): Normal model ((a) Lateral; (b) Medial). Mean stress values and standard errors are shown. The insert S group showed lower stress than the control S group in all regions, with the largest differences in lateral zone 2 and medial zones 6 and 7. Maximum stress occurred in lateral zone 2 and medial zone 6 in the control S group, but shifted to lateral zone 3 and medial zone 5 in the insert S group. *p < 0.05 by linear mixed model analysis. (c) and (d): Osteoporotic model ((c) Lateral; (d) Medial). The insert O group showed stress reduction in lateral zones 1–3 and medial zones 5–7, but stress increased in zones 4L and 4M compared with the control O group. The largest differences were in lateral zone 2 and medial zones 6 and 7. Maximum stress occurred in lateral zone 2 and medial zone 6 in the control O group, but shifted to lateral zone 4L and medial zone 4M in the insert O group. *p < 0.05 by linear mixed model analysis.
Mean surface stress by Gruen zone (MPa).
In the normal model, the insert S group demonstrated reduced stress in all zones compared with the control S group, with the largest differences in lateral zone 2 and medial zones 6 and 7. Maximum stress occurred in lateral zone 2 and medial zone 6 in the control S group, but shifted to lateral zone 3 and medial zone 5 in the insert S group.
In the osteoporotic model, the insert O group showed reduced stress in lateral zones 1–3 and medial zones 5–7 compared with the control O group, while stress increased in zones 4L (lateral) and 4M (medial). Maximum stress occurred in zone 2 (lateral) and zone 6 (medial) in the control O group but shifted to zones 4L and 4M in the insert O group.
Discussion
This study inserted cemented stems into normal and osteoporotic composite femur models and compared stress distribution before and after stem insertion using thermoelastic stress analysis (TSA). Both models showed reduced proximal stress after cemented stem insertion, with the maximum stress location shifting distally. In the osteoporotic model in particular, proximal stress reduction was marked, and a stress reversal phenomenon was observed whereby distal stress in the insert group exceeded that of the control group. These findings suggest important implications: stress changes before and after stem insertion may differ according to bone quality.
The proximal-predominant stress reduction across all zones and the distal shift of maximum stress location in the normal model after cemented stem insertion are consistent with stress distribution patterns of cemented stems reported in previous finite element analysis (FEA) and experimental studies. Finite element analyses have shown that cemented stems distribute loads and homogenise stress distribution, causing the maximum stress to shift distally.12,28,29 This is attributed to the structural characteristic that cemented stems do not directly contact the femur but transfer loads via the cement. Loads from the femoral head are transmitted through the high-stiffness stem, but cement interposition prevents the femur from directly receiving loads proximally, resulting in stress reduction after stem insertion. Conversely, the stem subsides slightly within the cement mantle while transmitting loads distally, and the cement distributes these loads to bone, maintaining load transfer in the distal region and resulting in smaller stress reduction.
The osteoporotic model showed substantial changes in stress distribution after cemented stem insertion, clearly demonstrating differences attributable to bone quality. Osteoporotic models have low stiffness, making them prone to large strains under loading, and stress imbalances easily occur due to stiffness differences between bone and stem.28,29 In this study, although smaller loads were applied to the osteoporotic model than to the normal model, stress differences before and after cemented stem insertion were larger in the proximal region. This is attributed to the osteoporotic model’s low stiffness, resulting in large stresses in the control group, whereas in the insert group, the considerable stiffness differences with the stem and the interposed cement prevented the femur from directly receiving loads, leading to pronounced proximal stress reduction. Furthermore, the distal region showed increased stress in the insert group compared with the control group. This increase can be explained by the high-stiffness stem subsiding within the cement layer while transmitting loads distally, concentrating these loads at the stem tip. Particularly in osteoporotic models with large bone strain, stress concentration readily occurs near the stem tip, contributing to the stress reversal phenomenon not observed in normal models.
Bone quality fragility significantly influences postoperative stress distribution and bone density changes. Watanabe et al. reported a strong correlation (r = 0.886) between postoperative stress change rates and bone density change rates using TSA analysis, demonstrating that stress reduction correlates with bone density reduction. 18 Morita et al. 30 reported that preoperative bone density correlates with bone density reduction in Gruen zone 7 at 1 year postoperatively. The large stress reduction observed in the osteoporotic model in this study supports these reports.
Furthermore, the distal stress increase observed in the osteoporotic model may be related to the pathogenesis of atypical periprosthetic femoral fractures (APFF). APFF occurs without a trauma history and exhibits morphology similar to atypical femoral fractures, including transverse fracture lines and lateral cortical thickening. Known risk factors include osteoporosis, long-term bisphosphonate use, and femoral bow deformity. 31 In atypical femoral fractures, stress increase in the diaphysis due to femoral bow deformity is considered one cause, 32 supporting the relationship between stress distribution and fracture occurrence. Baba et al. reported a higher incidence of APFF with cemented stems compared with typical periprosthetic fractures. 31 This study analysed conditions simulating walking loads, which are the most common in daily life, and the observed distal stress increase in the osteoporotic model suggests that repetitive stress concentration at the distal stem region occurs daily in osteoporotic patients, potentially contributing to APFF development.
This study has 4 limitations. First, constraints existed in the loading settings. Although the osteoporotic and normal models had identical geometry, the former lacked body weight specifications, requiring independent load adjustment based on the average body weight of elderly Japanese women. In contrast, the normal model was designed on the basis of a 183 cm, approximately 90 kg physique, creating inconsistent load conditions between models and limiting clinical coherence. Second, this study was limited to immediate postoperative initial fixation. Taper-slip cemented stems such as the C-stem AMT are known to undergo dynamic load redistribution affecting bone stress due to postoperative microsubsidence. 33 However, this study did not reproduce time-dependent changes and may not have captured long-term bone remodelling or stress distribution changes. Third, the study was limited to a single stem design. Stem geometry, surface treatment, taper angle, stem length, and material can all influence stress transfer, and the lack of comparison with other designs limits the generalisability of the findings. Fourth, the evaluation in this study was confined to stress distribution on the femoral surface, and internal stress changes remain unclear. Although TSA is highly effective for assessing surface stresses, it does not directly reflect internal stress conditions. Therefore, combining the present findings as validation data with FEA would enable more detailed investigation, including internal stress distribution.
Conclusion
This study inserted cemented stems into normal and osteoporotic composite femur models and compared changes in surface stress distribution using thermoelastic stress analysis (TSA). Both models showed reduced proximal stress and a distal shift of the maximum stress location after stem insertion. In addition, the osteoporotic model demonstrated an increase in distal stress.
These results reflect the effects of cement interposition between the femur and stem, namely a reduction in femoral stress. In osteoporotic bone in particular, cemented stem insertion resulted in greater proximal stress reduction, while distal stress concentration may occur due to loads transmitted through the stem and cement, causing strain at the stem tip. This distal stress concentration may be associated with an increased risk of periprosthetic fracture, underscoring the clinical importance of bone quality in cemented stem fixation.
Furthermore, experimental evaluation using TSA is clinically valuable for visualising actual stress distribution that cannot be fully captured by analyses such as finite element analysis (FEA). This study represents the first report to experimentally evaluate stress distribution in femora with cemented stem insertion using TSA in models of differing bone quality, providing new insights that may contribute to future implant design optimisation and the reduction of complication risk in total hip arthroplasty for osteoporotic patients.
Footnotes
Acknowledgements
The authors thank the technical staff at the Advanced Manufacturing Research Institute, AIST, for their assistance with the thermoelastic stress analysis equipment and methodology.
Declaration of conflicting interests
The authors declared no potential conflicts of interest with respect to the research, authorship, and/or publication of this article.
Funding
The authors disclosed receipt of the following financial support for the research, authorship, and/or publication of this article: This research was supported by JSPS KAKENHI Grant Number JP24K19563.