
Abstract
Aim:
The purpose of this study was to investigate the greater trochanter’s (GT) behaviour in simulated subtrochanteric osteotomy.
Materials and methods:
Measurement of functional and anatomical femoral torsion, and position of the GT and lesser trochanter was performed using 3-dimensional (3D) surface models of 100 cadaveric femora. Femoral torsion between 2° and 22° was defined as normal, femora with <2° and >22° of femoral torsion were assigned to the low- and high-torsion group. Subtrochanteric osteotomy was simulated to normalise torsional deformities to 12°.
Results:
With subtrochanteric osteotomy, functional torsion was simultaneously corrected while adjusting anatomical torsion (R2 = 0.866, p < 0.001). Compared to the normal-torsion group, an anteroposterior (AP) overcorrection of ±0.5 centimetres (range 0.02–1.1 cm) of the GT resulted in the high- and low-torsion group, respectively (p < 0.001): Mean AP GT distance to a standardised coronal plane was 2.1 ± 0.3 cm (range 12–30 cm) in the normal-torsion group compared to 1.61 ± 0.1 cm (range 1.4–1.71 cm) and 2.6 ± 0.6 cm (range 1.8–3.6 cm) for the corrected high and low-torsion groups, respectively. The extent of the GT shift in AP direction correlated strongly with the extent to which anatomical femoral torsion was corrected (R2 = 0.946; p < 0.001).
Conclusions:
Subtrochanteric osteotomy for femoral maltorsion reliably adjusts anatomical and functional torsion, but also results in a ±1 cm AP shift of the GT per 10° of torsional correction. However, this effect of the procedure is most likely not clinically relevant in relation to hip abductor performance.
Introduction
Femoral torsional abnormalities are common in young patients presenting with groin or hip pain.1,2 In case of reduced femoral torsion, the femoral neck abuts against the acetabular rim, creating a pincer-like femoroacetabular impingement.1–4 Compromised results of open and arthroscopic preservation surgery of the hip due to femoral impingement in case of unrecognised torsional deformity have been reported.5–7 Excessive femoral antetorsion, on the other hand, causes under-coverage of the femoral head and therefore instability and overload of the anterosuperior joint.8–10 With about ⅔ of torsional changes occurring distal to the lesser trochanter (LT), 11 subtrochanteric osteotomy seems currently to be the most reasonable option with correspondingly promising results.7,10,12
However, concerns regarding subtrochanteric correction of femoral maltorsion have been expressed. A recent study evaluated the position of the greater trochanter (GT) in the axial plane, and found a more posteriorly translated GT in relation to the axis of the femoral neck when the anatomical torsion was low, similar to a compensatory mechanism which normalises the functional femoral torsion. 13 Due to the association between aberrant anatomical torsion and aberrant GT morphology, subtrochanteric correction of femoral torsion might therefore result in an unanticipated excessive shift of the GT. Theoretically, the transformation of functional torsion could limit the hip abductors by decreasing their lever arm causing secondary muscular fatigue, limping, and pain.
The purpose of this study was to investigate the effects on the GT in simulated subtrochanteric osteotomy and quantify the GT's change in position in the axial plain using 3-dimensional (3D) surface models. The goal was to provide a better clinical impression of the problem at hand. The hypothesis was that rotational osteotomy for femoral maltorsion might cause malcorrection of the GT position in the axial plane.
Material and methods
The Institute of Forensic Medicine (The Zurich Institute of Forensic Medicine (IRMZ, University of Zurich, Zurich)) provided computed tomography (CT) data of 100 cadaveric femurs. The scans were performed on a Somatom Definition Flash CT scanner (Siemens Healthineers, Erlangen, Germany). The resolution of the CT scans was 512 × 512 pixels. The slice thickness was 1.0 mm in all scans. The mean age of the individuals was 57 years (range 18–86 years). There were 70 male and 30 female femur cadavers. The mean height of the subjects was 172 cm (range 137–190 cm) and the mean weight was 71 kg (range 41–110 kg). Exclusion criteria were postoperative or post-traumatic alterations of the bony anatomy or any signs of bony malformations.
Ethics approval and consent to participate
Ethical approval for this study was obtained from Zurich Cantonal Ethics Commission: 2017-01616. The study was performed in accordance with the ethical standards in the 1964 Declaration of Helsinki and in accordance with the HIPAA.
The CT scans were segmented using the global thresholding and region growing functionality of a standard segmentation software (Mimics Medical, Materialise NV, Leuven, Belgium) to generate 3D bone models, which were then imported into the in-house developed surgical planning software. CASPA (Computer Assisted Surgery Planning Application, Balgrist CARD AG, Zurich, Switzerland).
3-dimensional measurements
First, the 3D femur surface model was oriented to the reference points, which are in accordance with the recommendations by the International Society of Biomechanics (ISB). 14
Anatomical torsion of the femur
The measurement of anatomical torsion was measured in a manner similar to Murphy’s technique.15,16 For this, the centre of the femoral head was defined by the centre of a sphere fitted to the surface of the femoral head. Next, the centre of the femoral neck was determined. The anatomical femoral torsion was defined as the two-dimensional angle of the femoral neck axis (a line joining the centre of the femoral head to the centre of the femoral neck) and the retrocondylar plane, projected onto the y-z plane of the femoral coordinate system (Figure 1).
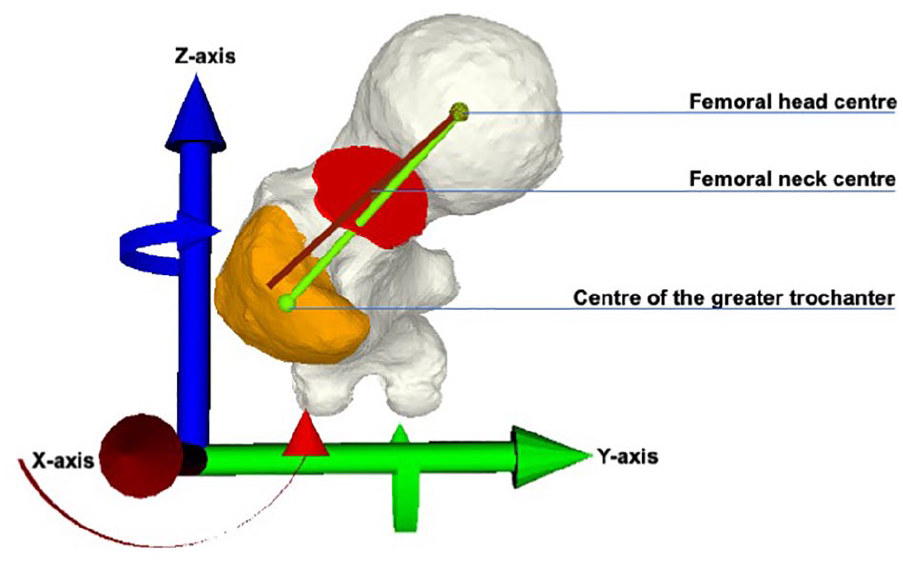
Superior view of a left 3-dimensional femur surface model. The anatomical femoral torsion was defined as the 2-dimensional angle of the femoral neck axis (red vector between the femoral head centre and the femoral neck centre) and the retrocondylar plane (aligned to the y-axis), projected onto the y-z plane of the femoral coordinate system. The functional torsion (green vector) was defined as a 2D angle projected onto the y-z plane, similar to the anatomical femoral torsion, but between the axis of the GT (femoral head centre to the centre of mass of the GT) and the retrocondylar plane vector.
Greater and lesser trochanter, and functional torsion
Functional torsion of the femur was defined as a two-dimensional angle projected onto the y-z plane, similar to the anatomical femoral torsion, but between the axis of the GT (femoral head centre to the centre of the GT) and the retrocondylar plane vector (Figure 1). 13 The centre of the GT was defined by its geometric centroid. For this, the GT was separated from the rest of the femur using a cutting plane. The GT was cut immediately below its apex medially and the vastus tubercle laterally, so that the attachment sites of the gluteus medius (superoposterior and lateral facets) and minimus (anterior facet) remained on the bony GT surface. 17
A best fitting sphere defined the centroid of the LT.
Group assignment
Based on available data, normal femoral torsion is reported to be 12 ± 10°, so the cut-off torsional deformity was set to >22° and <2° femoral antetorsion, respectively.18–20 Therefore, anatomical femoral torsion between 2° to 22° was defined as normal, whereas femora with <2° and >22° were assigned to the low- and high-torsion group, respectively.
Simulation of the subtrochanteric osteotomy
A subtrochanteric osteotomy was simulated to correct all femora with maltorsion to exactly 12°. For this, a 6-hole 4.5 LCP plate was applied onto the lateral cortex of the femur. The centre of the plate then determined the level of the osteotomy. 12 The osteotomy was performed perpendicular to the mechanical axis. To keep the anterior knee alignment (the patella pointing forward) constant, the proximal part of the femur was rotated instead of the distal part. By shifting the distal to the proximal part of the femur, the lateral cortex was realigned for optimal positioning of the LCP plate. Finally, the femoral head was repositioned (shifted) into its original position, so that the hip’s centre of rotation is constant.
Measurement of the position of the greater and lesser trochanter
23 femora were corrected for high and low anatomical torsion. The 100 femora which included the 23 femora post-correction were aligned equally (right femora were mirrored) in the same coordinate system, with the femoral head centre matched. The position of the GT and LT were measured as the distance to two standardised planes (Figure 2). The first (coronal) plane with the same normal vector as the retrocondylar plane was moved anteriorly into the centre of the femoral head. The distance between the lesser and greater trochanter and the first plane was measured as the shortest/direct distance, in millimetres (mm), and defined the (AP) position of the GT in the sagittal plane compared to the hip centre. In the frontal plane, the mediolateral (ML) distance (or offset) of the GT/LT to a second (sagittal) plane was measured (and therefore to the hip centre), which was perpendicular to the first plane and also passing through the femoral head centre (Figure 2).
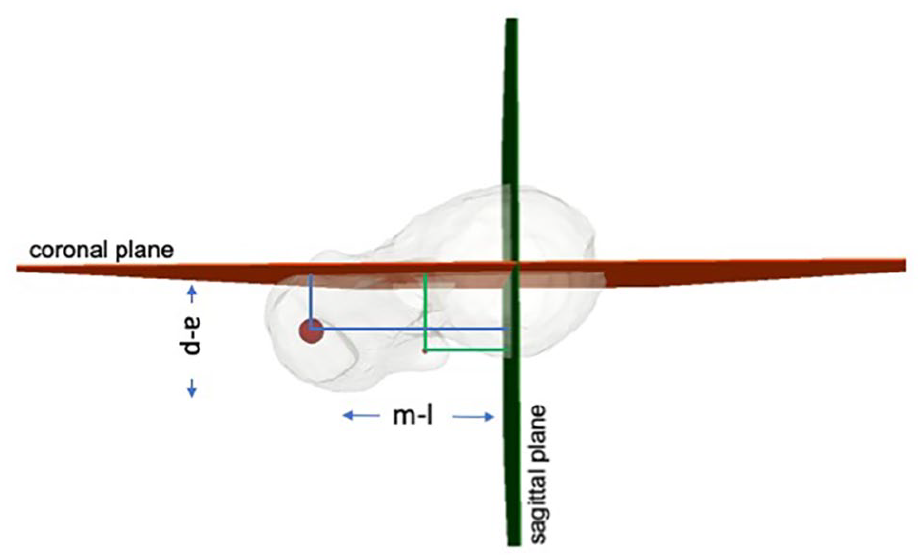
Superior view of a left femur. To define the position of the greater trochanter (GT) in the sagittal plane, the anteroposterior distance was measured of its centre of mass (big red dot) to a standardised coronal plane with the same normal vector as the retrocondylar plane, but moved into the centre of the femoral head (red plane). The GT position in the frontal plane was defined as the shortest distance (in mm) from the GT to a second (sagittal) plane (green), which was perpendicular to the first plane and also passing through the femoral head centre. Identically, the shortest distance (in millimetres) of the lesser trochanter (LT, small red dot) to the respective planes was measured, which defined the AP and ML position of the LT in the coordinate system.
Statistical analysis
All relevant data were entered in a spreadsheet program and statistically analysed with SPSS software version 23.0 (IBM-SPAA). Normal distribution of all values was confirmed with Shapiro-Wilk and Kolmogorov-Smirnov tests. AP and ML distances of GT/LT to both planes were measured in all 100 femora. After corrective subtrochanteric osteotomy in 23 surface models, distances were re-calculated. Continuous variables were described as means with standard deviations and ranges and were compared using independent or paired t-test as appropriate. Univariate analysis with post-hoc Bonferroni test (analysis of variance, ANOVA) was used to compare continuous variables of the 3 groups of anatomical femoral torsion (normal, low and high). The correlation of continuous variables was assessed using the Pearson correlation coefficient.
Results
The results for anatomical torsion, functional torsion, and position of the GT and LT in the sagittal and frontal plane of n = 100 femora are shown in Table 1, categorised into 3 groups by their respective anatomical torsion. 17 femora showed a natively reduced anatomical torsion of <2° and 6 femora an increased anatomical torsion of >22°. In the sagittal plane, the GT was positioned 5.3 mm more anterior to the hip centre in the low-torsion group compared to the normal-torsion group, and 9.4 mm more anterior compared the high-torsion group (n = 6) (p < 0.001). There was no significant difference regarding the GT position in the frontal plane (ML position) between the groups.
Demographics in the 3 groups of anatomical torsion.
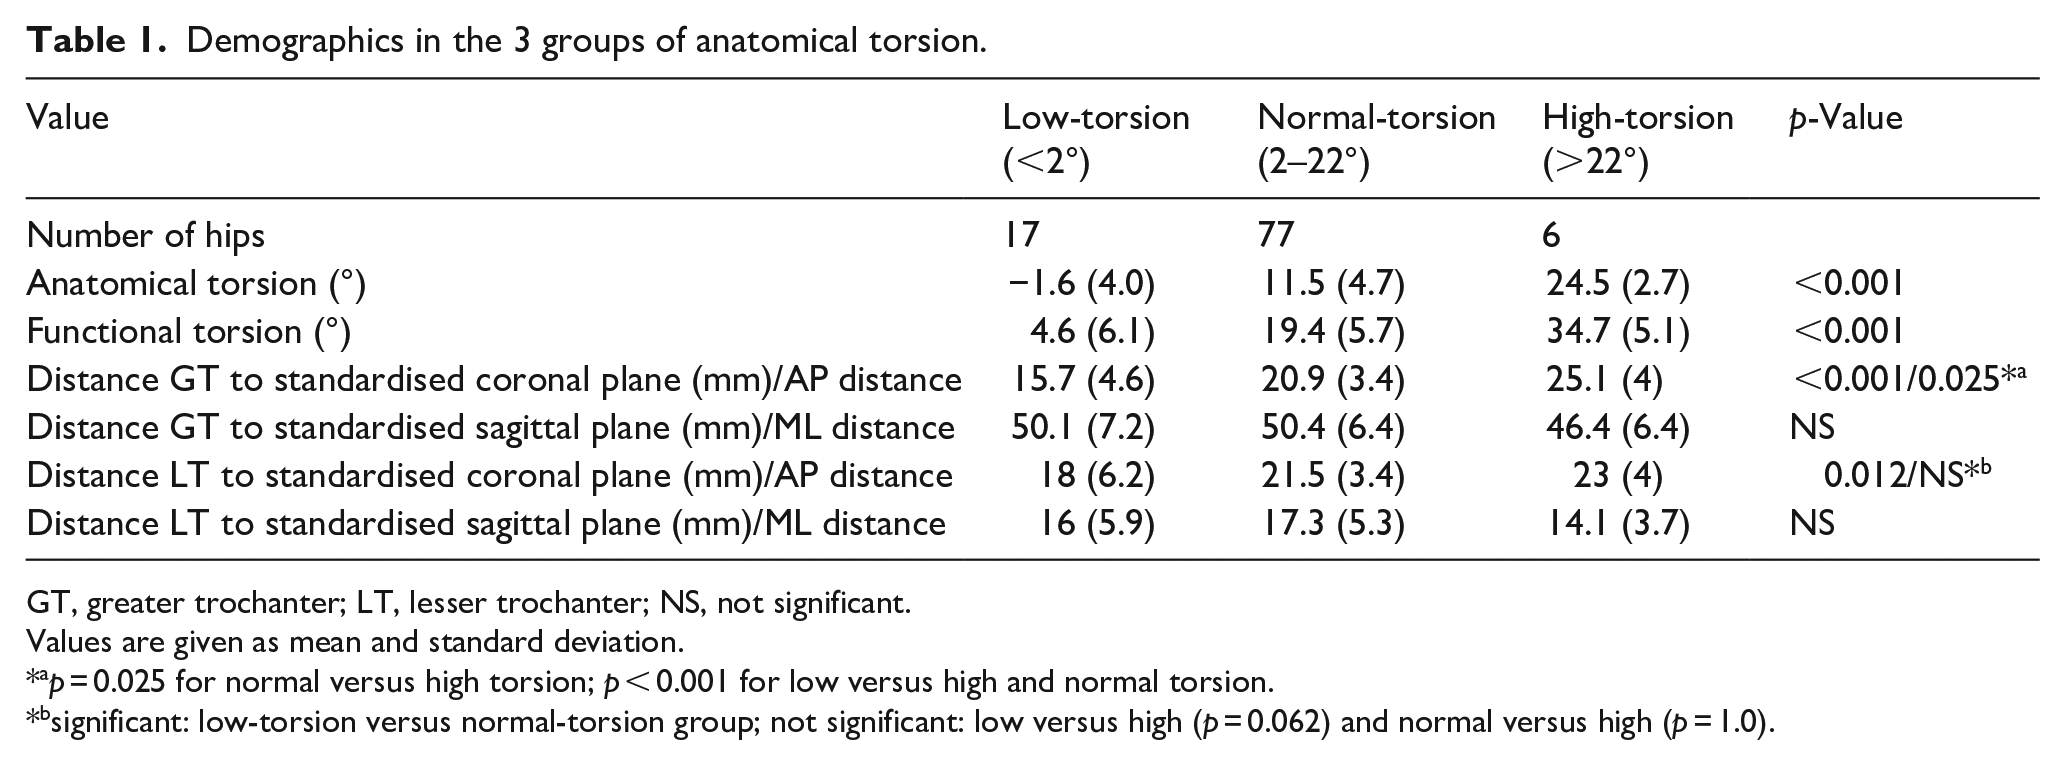
GT, greater trochanter; LT, lesser trochanter; NS, not significant.
Values are given as mean and standard deviation.
p = 0.025 for normal versus high torsion; p < 0.001 for low versus high and normal torsion.
significant: low-torsion versus normal-torsion group; not significant: low versus high (p = 0.062) and normal versus high (p = 1.0).
Pearson analysis showed a positive correlation between anatomical and functional femoral torsion (R 2 = 0.916; p < 0.001) (Figure 3). Moreover, a correlation was found between anatomical torsion and AP position of the GT in the sagittal plane (R 2 = 0.235; p < 0.001) (data not shown).
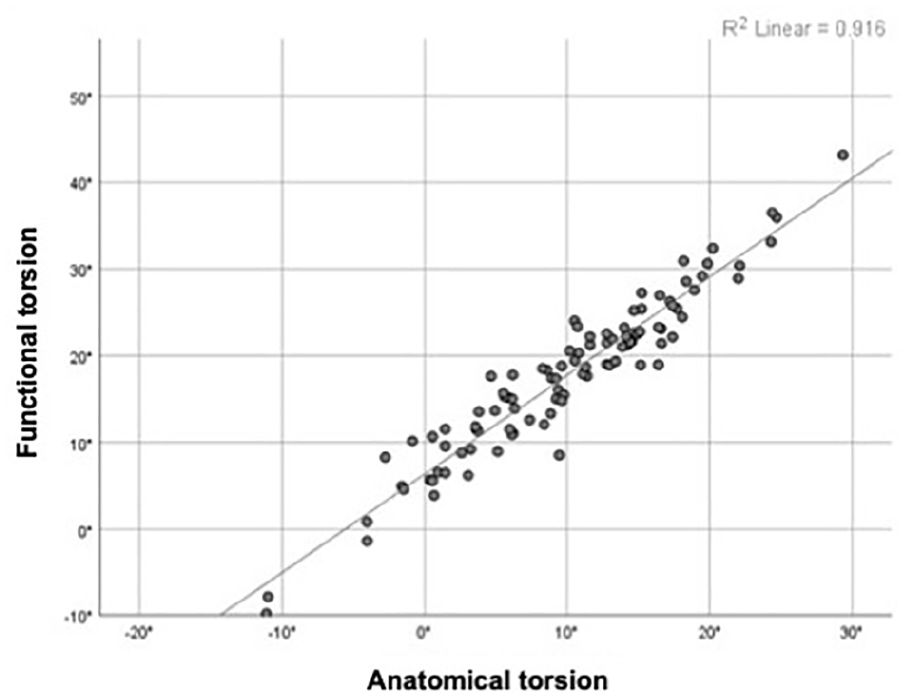
Statistically significant Pearson correlation between anatomical and functional femoral torsion (R 2 = 0.916; p < 0.0001).
Subtrochanteric osteotomy for correction of maltorsion (to a value of 12° antetorsion) simultaneously corrected the functional antetorsion in a linear manner (R 2 = 0.866, p < 0.001) (Figure 4(a)). Univariate analysis showed no statistically significant differences in functional torsion between the maltorsion groups after subtrochanteric correction and the normal-torsion group (Table 2).
Demographics and position of greater trochanter after subtrochanteric osteotomy.
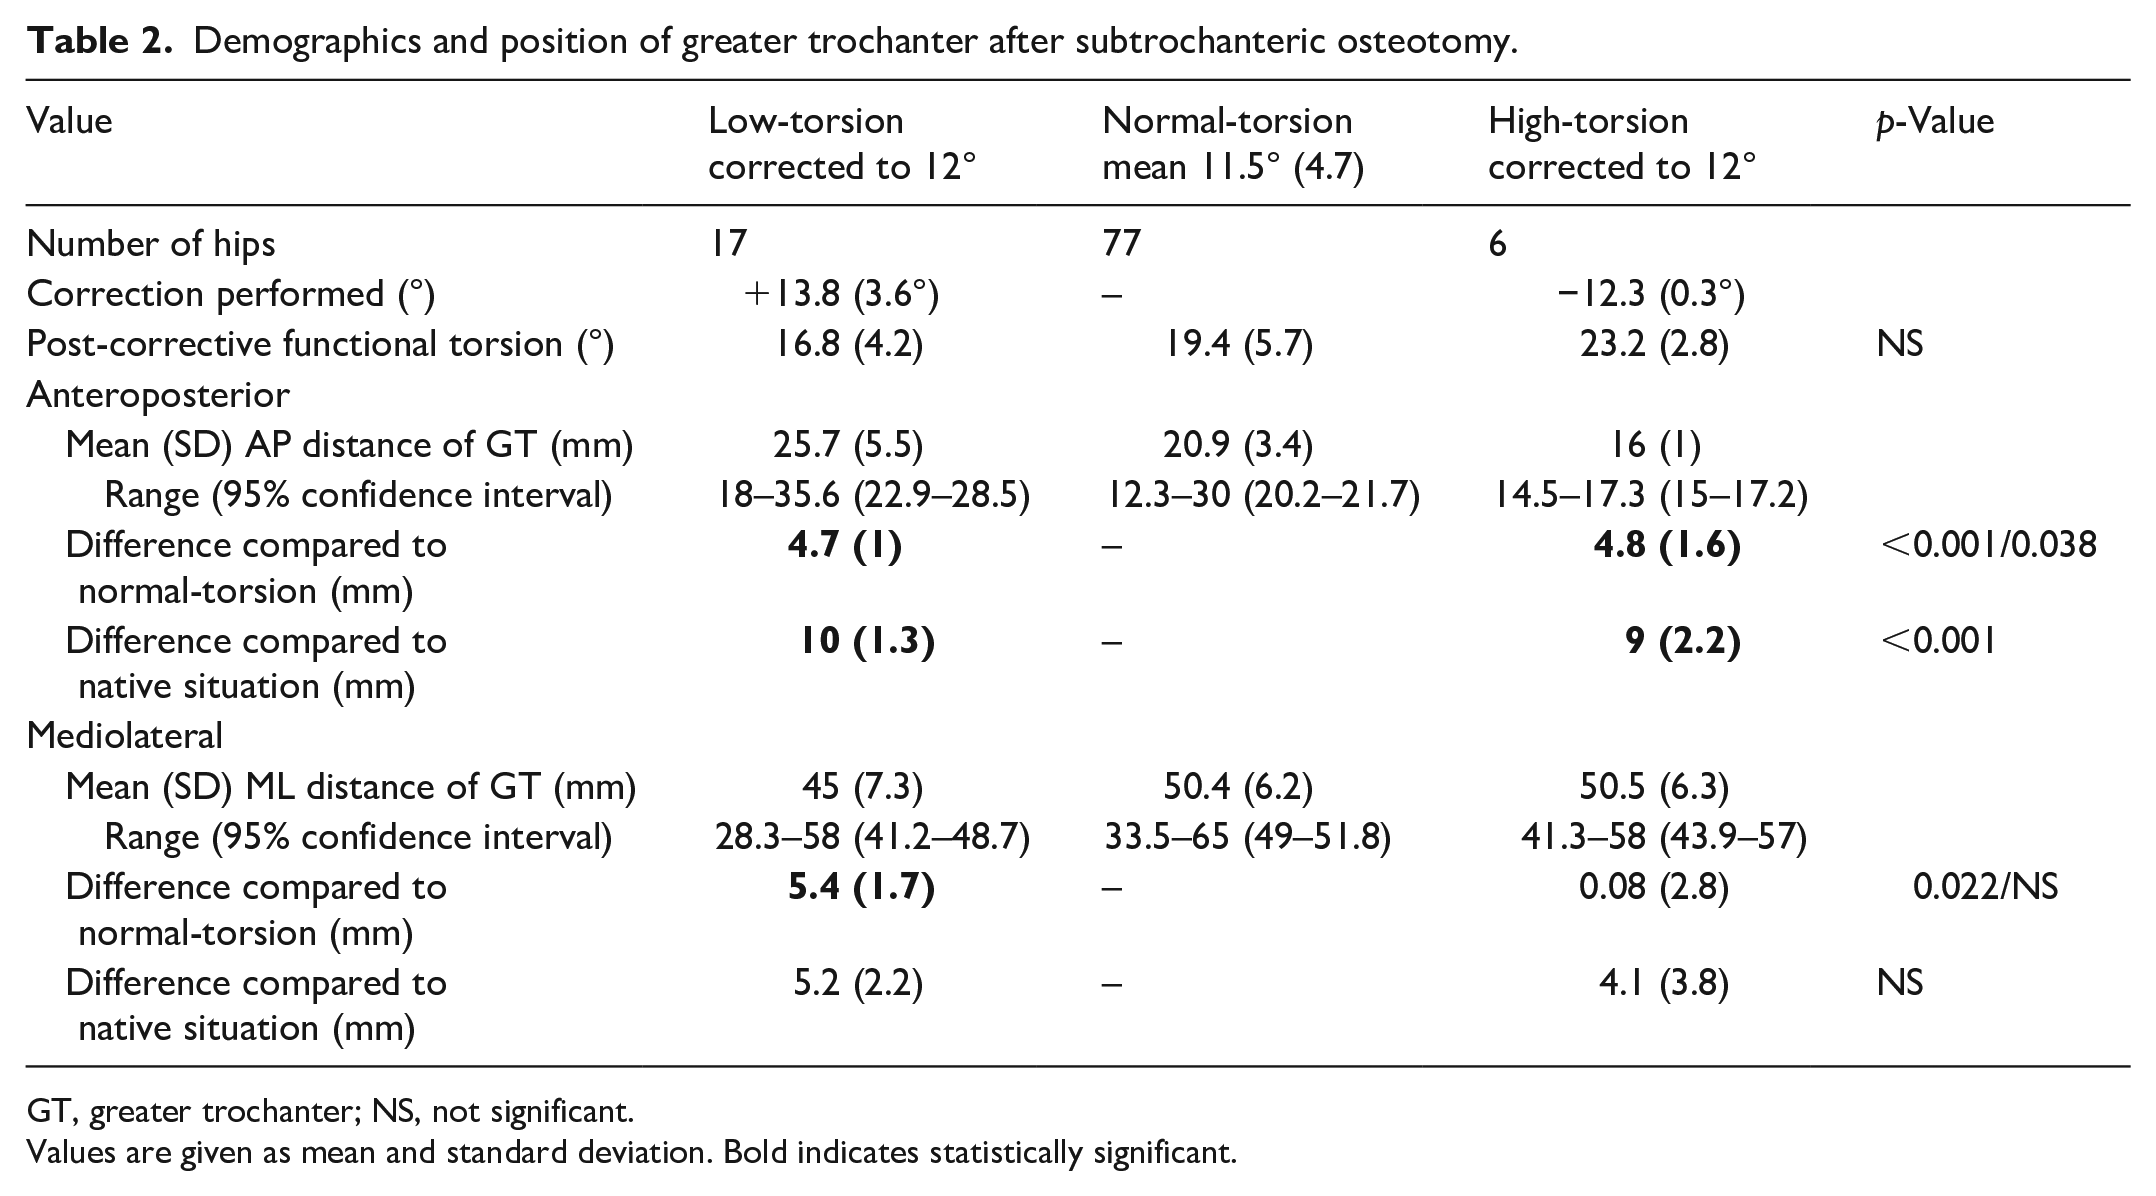
GT, greater trochanter; NS, not significant.
Values are given as mean and standard deviation. Bold indicates statistically significant.
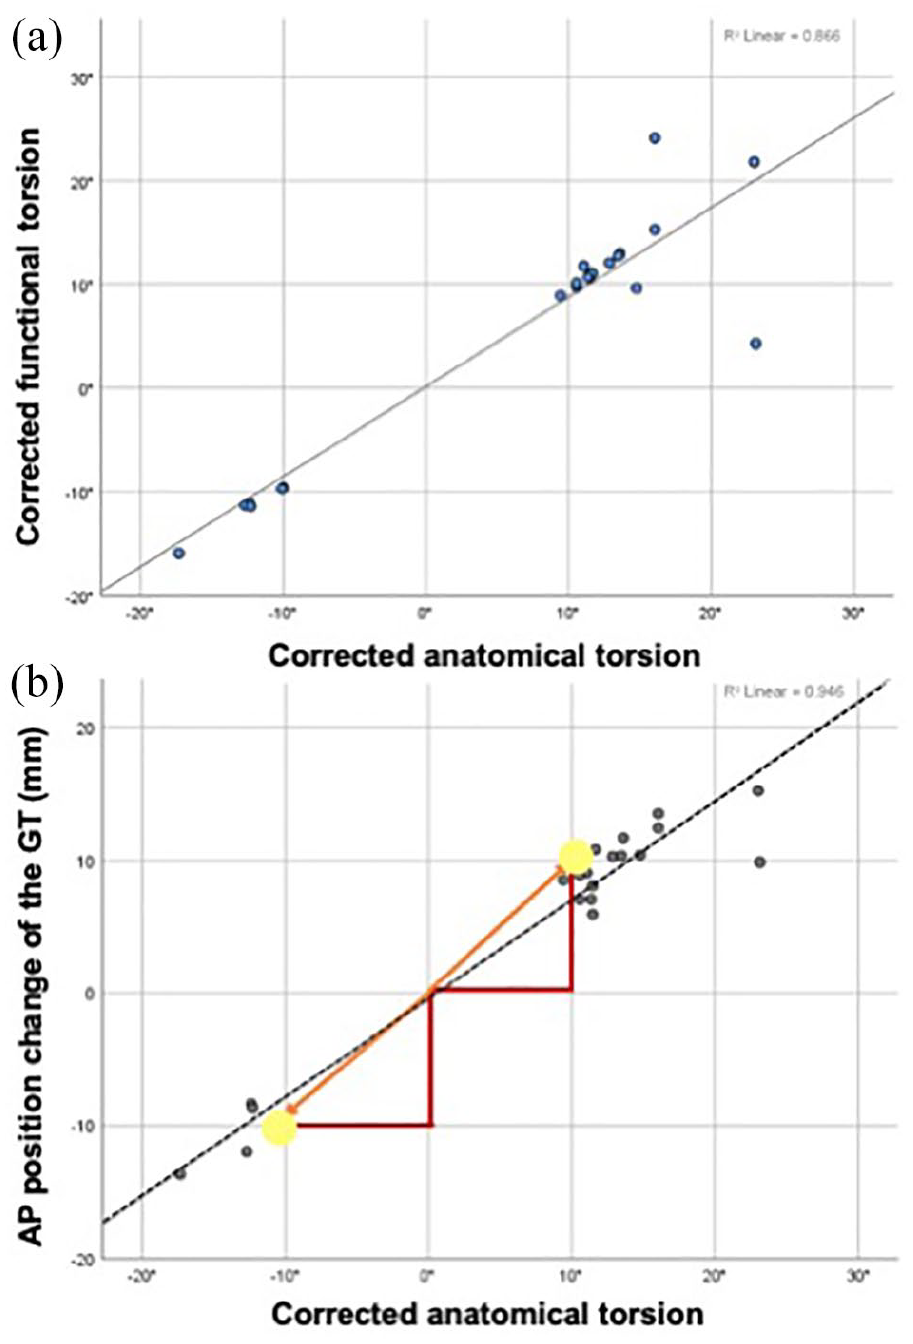
Pearson correlation analysis: (a) by correcting anatomical femoral torsion, subtrochanteric osteotomy equally normalised functional torsion and (b) the extent to which anatomical femoral torsion was corrected (in degrees) correlated with the GT shift (in millimetres) in the sagittal plane (in anteroposterior direction). On average, the GT position shifted ±10 mm in AP direction per 10° correction of anatomical torsion.
However, subtrochanteric osteotomy on average shifted the GT ±1 cm in AP direction compared to the hip centre, resulting in an overcorrection of 0.5 cm compared to the normal-torsion group (Table 2). Overall, only a small percentage of all GT were shifted into the desired range: in 4/23 cases (17%), the GT came to lie within the 95% confidence interval (CI) of the normal-torsion group. The overcorrection of the GT is illustrated in Figure 5. The extent of the GT shift in the sagittal plane correlated strongly with the extent to which anatomical femoral torsion was corrected: The GT shifted approximately 1 cm in AP (or PA) direction per 10° of torsional correction (R 2 = 0.946; p < 0.001) (Figure 4(b)).
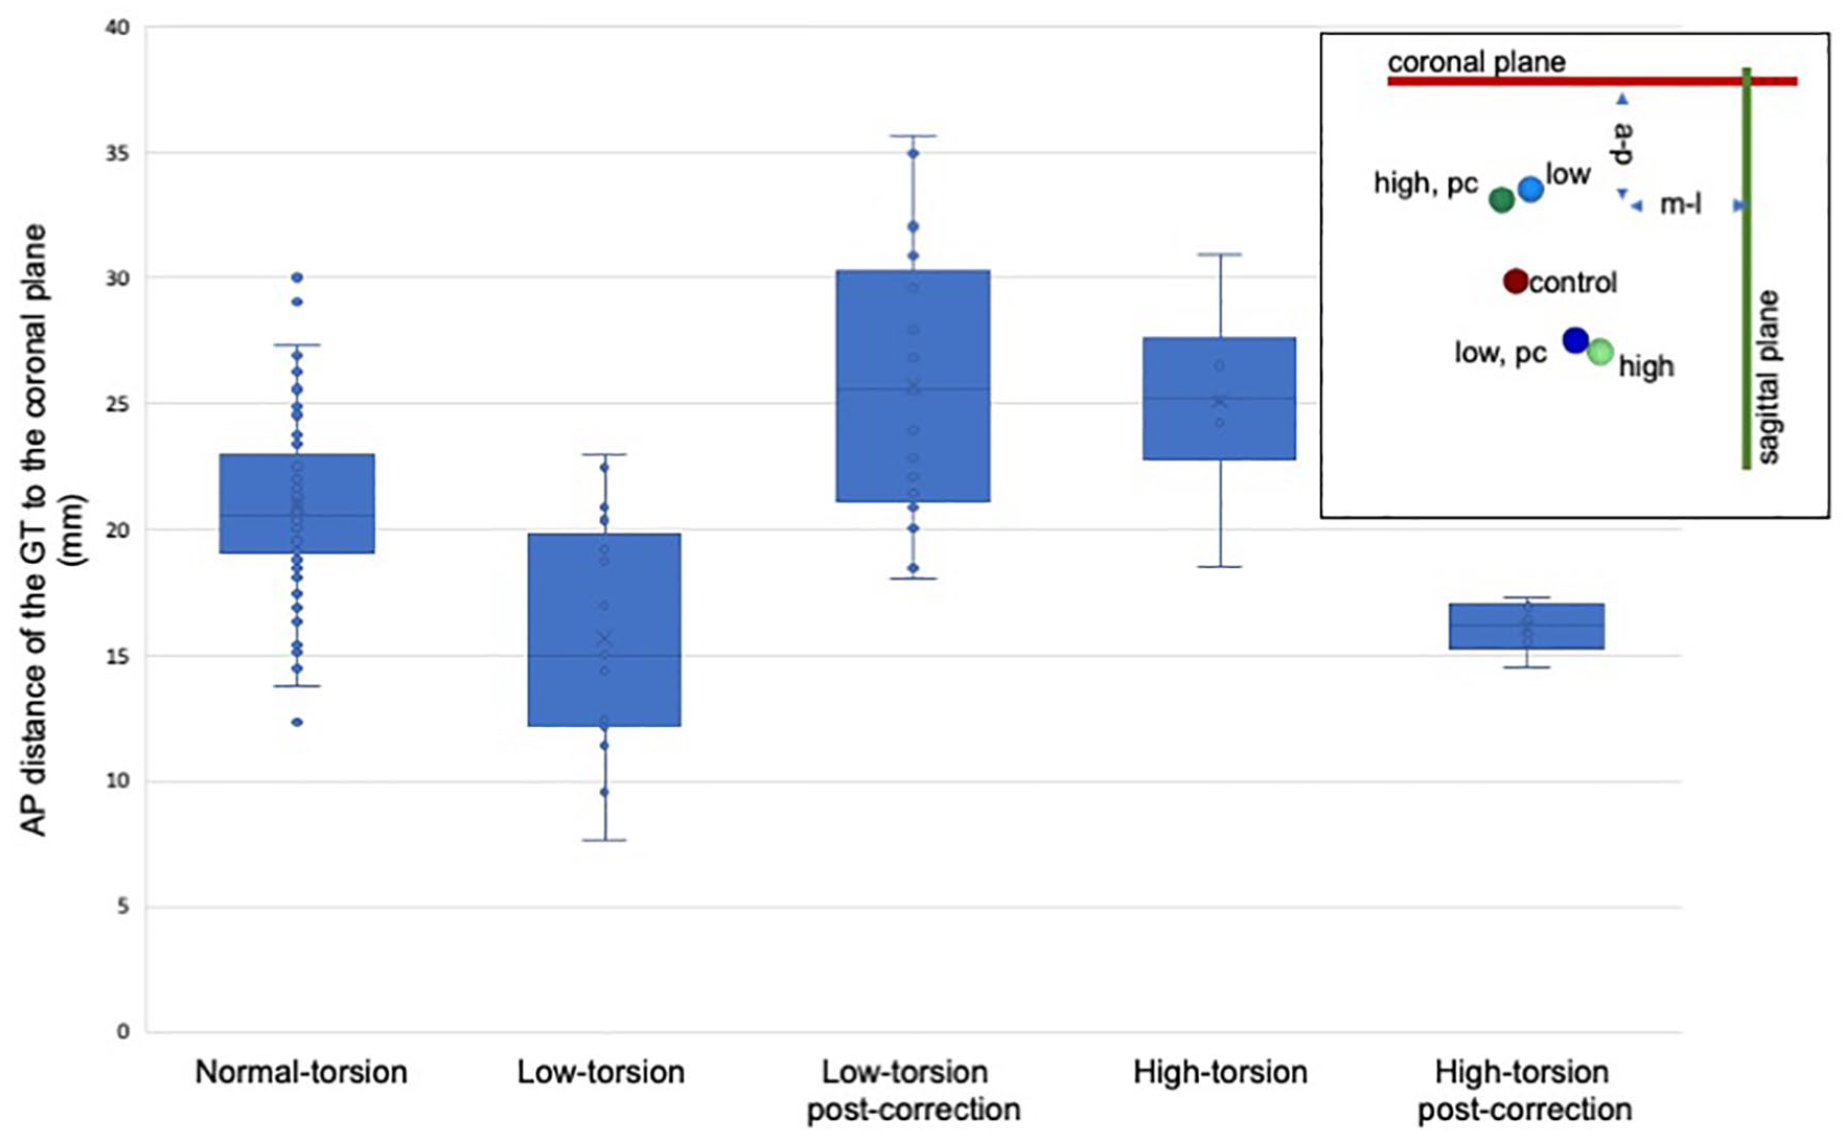
Anteroposterior (AP) position of the greater trochanter (GT) measured in millimetres to the standardised plane, using boxplot. Schematic drawing on the top right to illustrate GT position in the frontal and sagittal plane (compare Figure 2). Subtrochanteric rotational osteotomy to 12° due to decreased femoral torsion resulted in an excessively posterior GT position, and vice versa: the GT positioned within the range of the high-torsion group.
Regarding GT shift in the frontal plane, subtrochanteric correction of the low-torsion group resulted in a mean of 5.4 mm lateralisation of the GT compared to the hip centre (p = 0.022). This phenomenon was not observed in the high-torsion group (n.s.).
The LT differed in the AP position in the low-torsion versus the normal-torsion group by 3.5 mm (p = 0.012). Overall, subtrochanteric osteotomy had only a negligible effect on the LT with no significant change in position.
Discussion
The most important finding of this study is that subtrochanteric corrective osteotomies achieve reliable adjustment of anatomical and functional femoral antetorsion but result in a GT shift of ±1 cm in the sagittal plane per 10° of torsional correction.
The following functional interpretation depends on the assumption that the condylar axis of the knee remains unchanged, which is based on the findings of MacWilliams et al., 21 that torsional deformities are at least partially compensated by hip rotation. If the patient would move with the femoral neck in the same orientation after osteotomy, then functionally there would be no AP or ML translation of the GT, but external/internal rotation of the foot. However, as the patients walk with the foot directed straight forwards after osteotomy, the patients thus rotate the hip joint in or outwards.
Therefore, we found that surgical correction of anatomical torsion resulted in an overcorrection of the GT especially in the sagittal plane: the GT of low-torsion femora shifted posteriorly into the range of the high-torsion group, and vice versa. On average, the GT shifted ±1 cm in AP direction per 10° of subtrochanteric correction (R 2 = 0.946; p < 0.001), resulting in a mean overcorrection of 0.5 cm when compared to the normal-torsion group. In summary, the GT of only four of 23 corrected femora (to normal antetorsion of 12°) was finally positioned within the 95%confidence interval (CI) of the normal-torsion group (2–22°).
Assessing CT scans of 61 cadaveric femurs and 54 patients with high (n = 22 hips), low (n = 10) and normal femoral torsion (n = 22), Batailler et al. 13 were able to describe a relationship of the GT to the anatomical femoral torsion: When the anatomical torsion decreased, the GT was more tilted and translated posteriorly in relation to the axis of the femoral neck (Figure 6, bottom row). This can be interpreted as a compensatory mechanism. For example, in femora with excessive antetorsion, functional torsion becomes narrowed to the value of femora with normal torsion in that the GT is positioned more anteriorly in relation to the axis of the femoral neck (Figure 6, top row). This improves the course of action and partially compensates for the lever arm of the hip abductors. Therefore, it seems that the unintentionally implied error regarding the GT position after subtrochanteric osteotomy occurs because aberrant anatomical torsion is coupled with aberrant GT morphology (Figure 6).
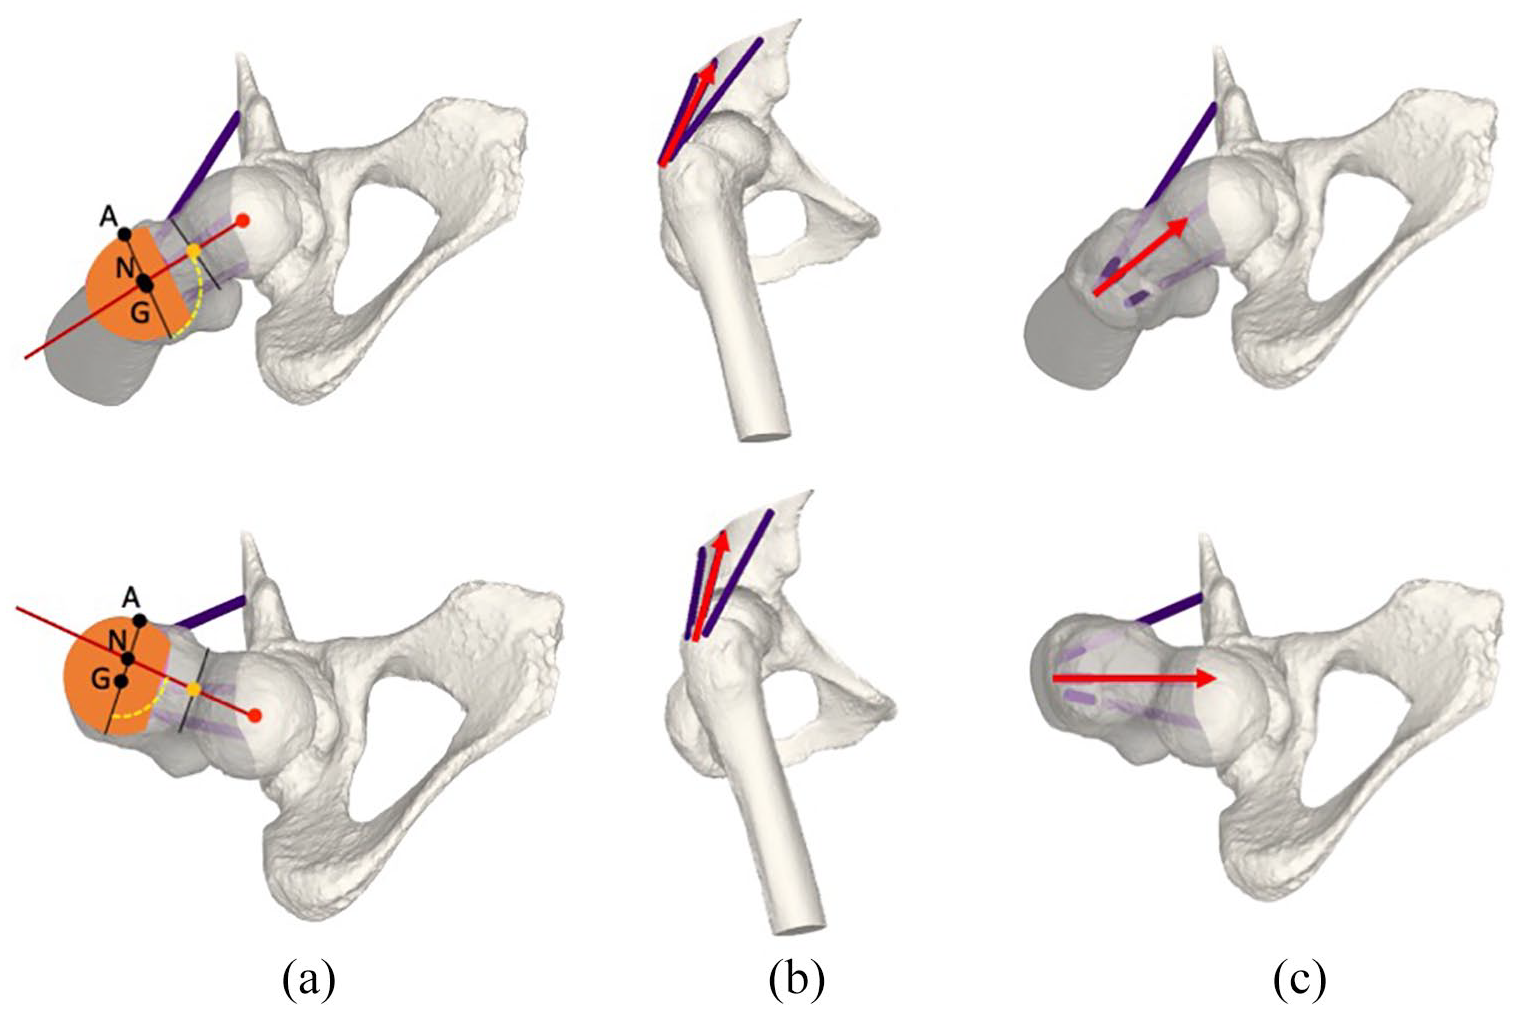
Top row: Femora with high torsion, bottom row: Femora with low torsion. (a) shows the posterior tilt (yellow angle) in the axial plane according to Batallier. The posterior tilt is defined as the femoral neck axis (red) and the axis of the greater trochanter (GT). Point A marks the most anterior point of the GT, point N marks the intersection of the femoral neck axis and the axis of the GT, and point G marks the centre of mass of the GT. When the anatomical torsion is low, the GT was more tilted and translated posteriorly in relation to the axis of the femoral neck, and vice versa. (b) shows the sagittal and (c) the axial profile of the high and low torsion femora. As a compensatory mechanism for torsional deformity, the position of the GT is more anterior in femora with high torsion, and more posterior in femora with low torsion. As a consequence, the course of action and the lever arm of the hip abductors are at least partially compensated. However, this morphological feature is responsible for the GT overcorrection after subtrochanteric correction of femoral maltorsion.
Contrary to the predictions of Batailler et al., 13 in our simulation subtrochanteric osteotomy did not worsen functional torsion. It even normalised (Figure 4(a): linear correlation) and no difference of functional torsion was found between the control group and post-correction femora (p = 0.06). All the more it can therefore be debated whether an AP shift of the GT of 1.5 cm due to torsional correction of 15° impacts the hip abductors in such a way that limping and pain results. Furthermore, since the superior-inferior distance between the origin and insertion of the abductors is large compared to this AP shift, the angle and moment arm should not change much. However, unlike the proximal or distal transfer of the GT,22–25 consequences of AP change of GT position is less clear. Therefore, further biomechanical studies would be of interest to evaluate the impact on the hip abductors. Even stronger influence might apply to the hip external/internal rotators. However, until now, clinical studies reported no complaints related to the changes of axial osseous geometry in short-term follow-up, 12 and subtrochanteric rotational osteotomy of the femur was reported to be reliable and safe concerning muscle function.
As a limitation of the study, the sample size could be criticised. However, previously assessed femora by Batailler et al. 13 (n = 115) showed identical anatomical characteristics. Therefore, due to a normal distribution of femoral torsion in this study, no digressive results are to be expected with standardised simulation of further samples.
Conclusion
Subtrochanteric osteotomy for femoral maltorsion reliably adjusts anatomical and functional femoral antetorsion, but also results in an ±1 cm AP shift of the GT per 10° of torsional correction. However, a position change of the GT of 1cm is most likely not clinically relevant concerning the function of the hip abductors.
Footnotes
Declaration of conflicting interests
The author(s) declared no potential conflicts of interest with respect to the research, authorship, and/or publication of this article.
Funding
The author(s) disclosed receipt of the following financial support for the research, authorship, and/or publication of this article: This work is part of the LEDECO project supported by the SNF Swiss National Science Foundation (Grant Number: 320030_182352).