
Abstract
Purpose
To investigate the effect of nutritional status on pupillary responses in children aged 5 to 18 years.
Methods
This cross-sectional study comprised 92 eyes of malnourished children and 80 eyes of age- and gender-matched healthy children based on BMI Z-score. Serum ferritin, hemoglobin, serum 25-hydroxyvitamin D, and vitamin B12 levels were recorded. Pupillary responses were taken using Sirius topography (CSO, Italy) with the automated pupillometry function. Static pupillometry consisted of pupil diameters at scotopic, mesopic, and photopic luminances. In dynamic pupillometry, the mean pupil dilation speed at the 10th second was calculated by dividing the distance by time in each 0.2 s period.
Results
No significant difference was observed between the groups regarding age, gender, visual acuity, and spherical equivalent (p > 0.05). Mean hemoglobin, serum ferritin, serum 25-hydroxyvitamin D, and vitamin B12 levels were lower in malnourished children than healthy children (p < 0.001). The malnutrition group had lower mean pupil diameters under all luminance and higher speed of pupil dilation compared to the control group (p < 0.05). While malnutrition subgroups were similar in terms of pupil diameters under all luminance (p > 0.05), the speed of pupil dilation was significantly different between the groups (p = 0.024). BMI z-score was positively correlated with mesopic and photopic pupil diameter but also negatively correlated with the speed of pupil dilation (p < 0.05).
Conclusion
Malnourished children have smaller pupil diameters and higher speed of pupil dilation than healthy controls, indicating an autonomic impairment.
Introduction
Evidence has shown that the maturation of the visual system, which has neurological and ocular components, requires a balanced diet. Thus, malnourished children are more susceptible to problems with visual development. 1 Deficiency of micronutrients can cause a wide range of ocular diseases, from the ocular surface to the optic nerve, including riboflavin deficiency–related ocular surface damage, thiamine deficiency–related nystagmus, copper deficiency–related optic atrophy, cobalamin deficiency–related optic atrophy, strabismus, macular degeneration, and iron deficiency–related retinal nerve fiber layer thinning.2–4
Measuring pupil size and reactivity has been recommended as a valuable method for obtaining information about the neurological system, including the optic nerve, posterior visual pathways, and sympathetic nerves to the eye. 5 Pupil diameters under low light conditions and the dilation status project the function of the sympathetic nervous system by stimulating the α-adrenergic receptors. In addition, pupil diameters in light luminance and the contraction status indicate the parasympathetic system function by activating the muscarinic receptors.6,7 Hence, pupillometry is particularly well suited for interpreting the balance of the autonomic nervous system.
Recent advances in automated pupillometric devices have quantitatively revolutionized the diagnosing and monitoring of numerous ocular and neurological conditions.8,9 Its usability has been established in children with various diseases, such as attention deficit hyperactivity disorder, autism spectrum disorder, and obstructive sleep apnea.10–12 A limited number of studies have focused on the effects of serum levels of selected micronutrients on static and dynamic pupillary responses in children.13,14 Given that marked alterations in cardiac autonomic modulation have been described in malnourished children, no study has yet addressed static and dynamic pupillary responses as a part of the autonomic system in malnourished children. 15 The aim of this study was to investigate whether malnutrition compromises the autonomic nervous system in the pediatric population through pupillary responses.
Methods
This cross-sectional study was conducted at the ophthalmology department of the Faculty of Medicine of Alanya Alaaddin Keykubat University Training and Research Hospital, Turkey, in collaboration with the pediatrics department. The study sample consisted of children who applied to the pediatric clinic for screening or were incidentally diagnosed with malnutrition between November 2023 and December 2024. The study was designed to adhere to the Declaration of Helsinki and approved by the local ethical review committee (Registration number: 10354421-2023/14-18 and 18/10/2023). Informed consent was obtained from each parent or legal guardian before the examination.
Anthropometric measurements
In the recent Academy of Nutrition and Dietetics/American Society of Parenteral and Enteral Nutrition (AND/ASPEN)2014 Pediatric Malnutrition Consensus Statement, the use of z-scores for weight for height/length, BMI for age, length/height for age, or mid-upper arm circumference is established as a primary indicator when only a single data point is available for use as a criterion for identifying and diagnosing malnutrition-related undernutrition. 16 Even though a standardized approach is not available in the pediatric population older than 60 months, using z-scores to identify and document pediatric malnutrition/undernutrition is highly recommended. 16 A z score is a statistical measure of the standard deviations that compare above or below the mean in a normal distribution of values from a study population.
In this regard, the height, weight, and body mass index (BMI) of all participating children measured on admission were noted from medical records. The BMI z-scores were calculated according to the validated percentiles for Turkish children by the same pediatrician (BY). 17 According to AND/ASPEN malnutrition criteria, children in the study group had a BMI z-score < −1, defined as malnutrition-related undernutrition. The control group comprised healthy children with a BMI z-score between −1 and 1, represented as normal nutrition. When comparing malnutrition subgroups, all children were divided into three groups based on severity: mild (−1 to −1.9 z-score), moderate (−2 to −2.9 z-score), and severe malnutrition (−3 or greater z-score). 16
Laboratory analysis
Serum concentrations of ferritin, hemoglobin, vitamin B12, and vitamin D levels were recorded for each participant. The reference ranges for micronutrient levels were based on laboratory reference values used in the hospital. 18 In the study, having ferritin levels <15 ng/mL were considered low values. Anemia was defined as hemoglobin <11.5 g for children aged under 12 years, hemoglobin <12 g for children aged 12 to 18 years in girls, hemoglobin <12 g for children aged 12 to 15 years in boys, and hemoglobin <13 g for children aged 15 to 18 years. Serum vitamin B12 level <200 pg/mg was classified as deficiency, between 200 and 300 pg/mg as insufficiency, and >300 pg/mg as normal. The 25-hydroxyvitamin D level was determined as sufficiency between 20 and 100 ng/mL and deficiency <20 ng/mL. 19
Ophthalmic and pupillary examinations
Participants 5 to 18 years of age with spherical refractive error < 2.00 D, cylinder refractive error < 1.00 D, and best corrected visual acuity ≤ 0.10 logMAR were included in the study. Participants with any ocular disease (e.g., corneal disease, ptosis, optic neuropathy, or any optic neuropathy); any disease affecting pupillary motility (e.g., anisocoria or synechiae); a history of ocular surgery or head or ocular trauma; or any neurological disease were excluded from the study. All parents or legal guardians were asked whether their children were taking any medications that could have influenced pupillary movement (e.g., decongestants).
Each participant underwent a detailed ophthalmological examination, including best-corrected visual acuity (BCVA), slit-lamp biomicroscopy, and dilated posterior segment examination. Pupil responses were recorded by the same clinician (FY) using Sirius topography (CSO, Italy) with the automated pupillometry function. This device allows monitoring of pupil size from maximum illumination to a non-light condition.
After a 5-minute dark adaptation, the measurements were performed based on the method of Prakash et al. 20 in the following order: scotopic (0.4 lux), mesopic (4 lux), and photopic (40 lux) luminance. Following the static measurements, dynamic pupillometry (500 lux) was performed (Figure 1). The mean pupil dilation speed was calculated by dividing the pupil size by the time interval, the difference between the 0th and 10th second (mm/s). The right eye was recorded first, followed by the left eye.
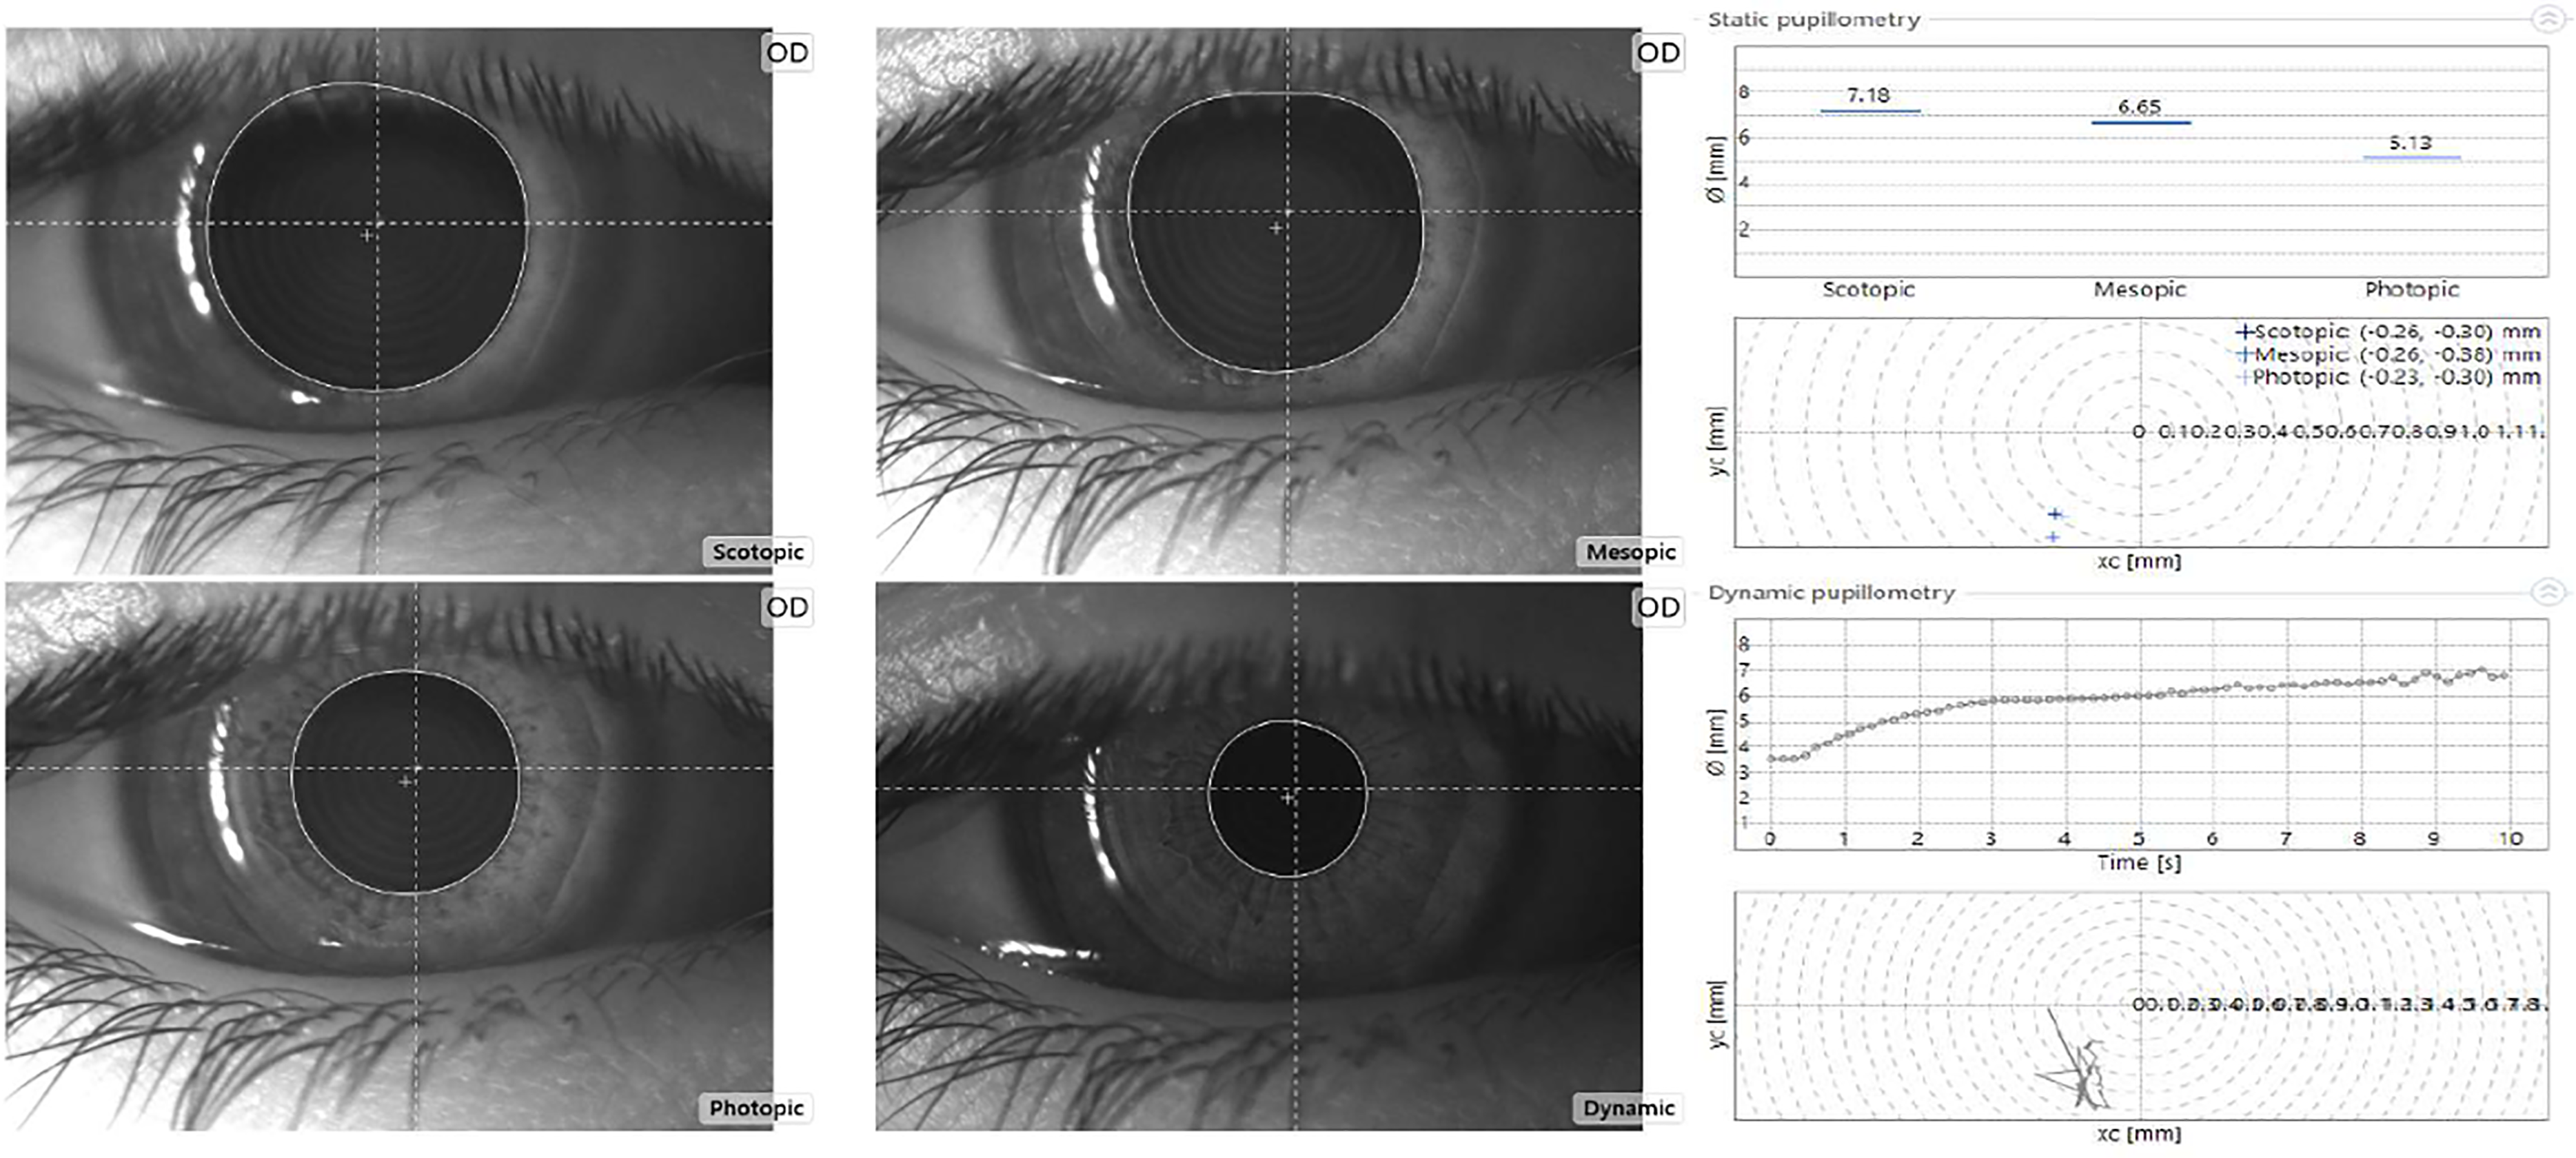
Pupillometric analysis via Sirius (CSO, Firenze, Italy). The right upper graphic indicates pupil diameters under scotopic, mesopic, and photopic illumination, and the right lower graphic indicates dynamic pupillometry analysis over time for every 2 seconds.
All pupillometry measurements were performed at the same time of day (between 9:00 a.m. and 12.00 p.m.) to minimize the effect of circadian rhythm on pupillary function. During pupillometry, patients were asked to look at a target 3 m away instead of the light source to avoid the accommodative reflex. Only the right eye of each participant was chosen to obtain data in this cross-sectional study. Pupil diameters at scotopic, mesopic, and photopic light intensities and pupil dilation speed data at 10 s were compared between the groups.
Statistical analysis
Statistical analyses were performed using SPSS (Statistical Package for the Social Sciences, Chicago, IL, USA) software, version 23. A Kolmogorov–Smirnov test was used to confirm the normality of the data. The data are presented as means with standard deviations for continuous data and frequencies and percentages for categorical data. Chi-square tests for categorical variables and Mann–Whitney U-tests for continuous variables were used to compare the study and control groups. The Kruskal–Wallis test was used to compare demographic and pupillary responses between malnutrition subgroups (mild, moderate, and severe), followed by post-hoc analysis for multiple comparisons. The Spearman method was applied to determine the correlation coefficients and significance between pupillary responses and both BMI z-score and laboratory values. A P-value < 0.05 was considered statistically significant.
Results
A total of 172 eyes of 172 children, comprising 92 from the malnutrition group and 80 from the control group, were enrolled in this study. Of the 92 participants, 28 were in the mild, 40 were in the moderate, and 24 were in the severe malnutrition subgroups.
The demographic and clinical characteristics of the malnutrition and control groups are displayed in Table 1. The groups were similar in terms of age, gender, visual acuity, and spherical equivalent (p = 0.351, p = 0.555, p = 0.290, and p = 0.238, respectively). The mean hemoglobin, serum ferritin, vitamin D, and vitamin B12 levels in the malnutrition group were lower than in the control group (p < 0.001). The malnutrition group had lower mean pupil diameters under three different levels of illumination and higher speed of pupil dilation than the control group, as shown in Table 2 (p = 0.046, p = 0.013, p = 0.022, and p < 0.001, respectively).
Demographic and clinical characteristics of participants.
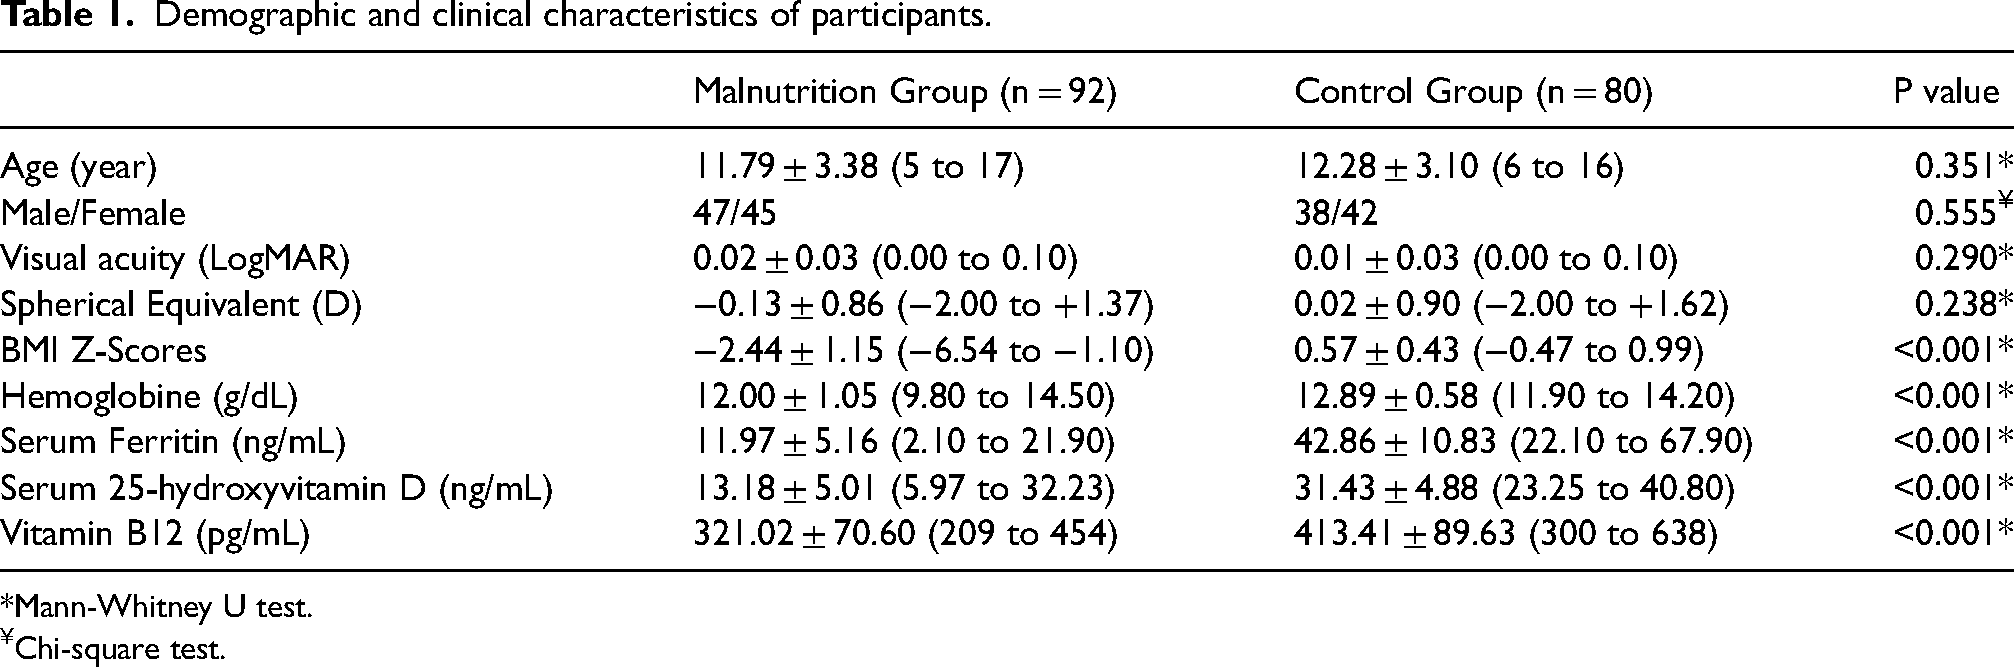
Mann-Whitney U test.
Chi-square test.
Comparisons of pupillary responses between malnutrition and control groups.
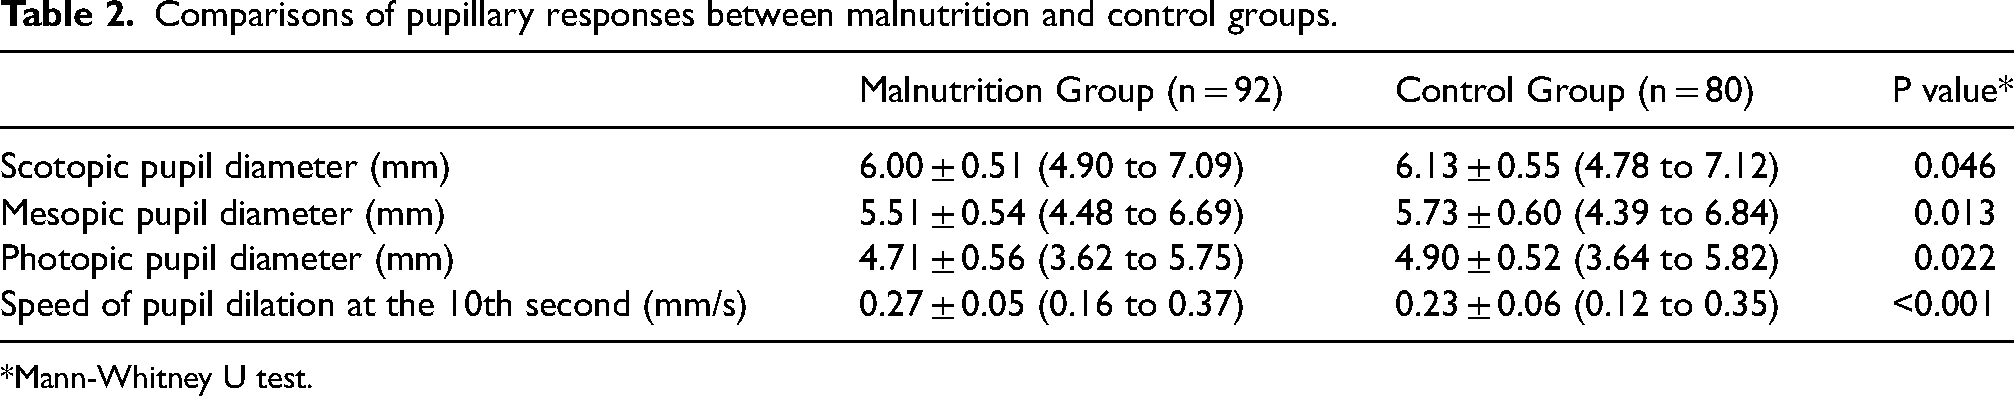
Mann-Whitney U test.
When analyzing the demographic characteristics of the malnutrition subgroups, no significant differences were observed in any demographic variables (p > 0.05), except for gender and vitamin D level (p < 0.001 and p = 0.008, respectively, in Table 3). Vitamin D levels were statistically lower in the severe malnutrition group than in the mild and moderate malnutrition groups (mild vs severe; p = 0.015, moderate vs severe; p = 0.003, respectively).
Demographic and clinical characteristics of malnutrition subgroups.
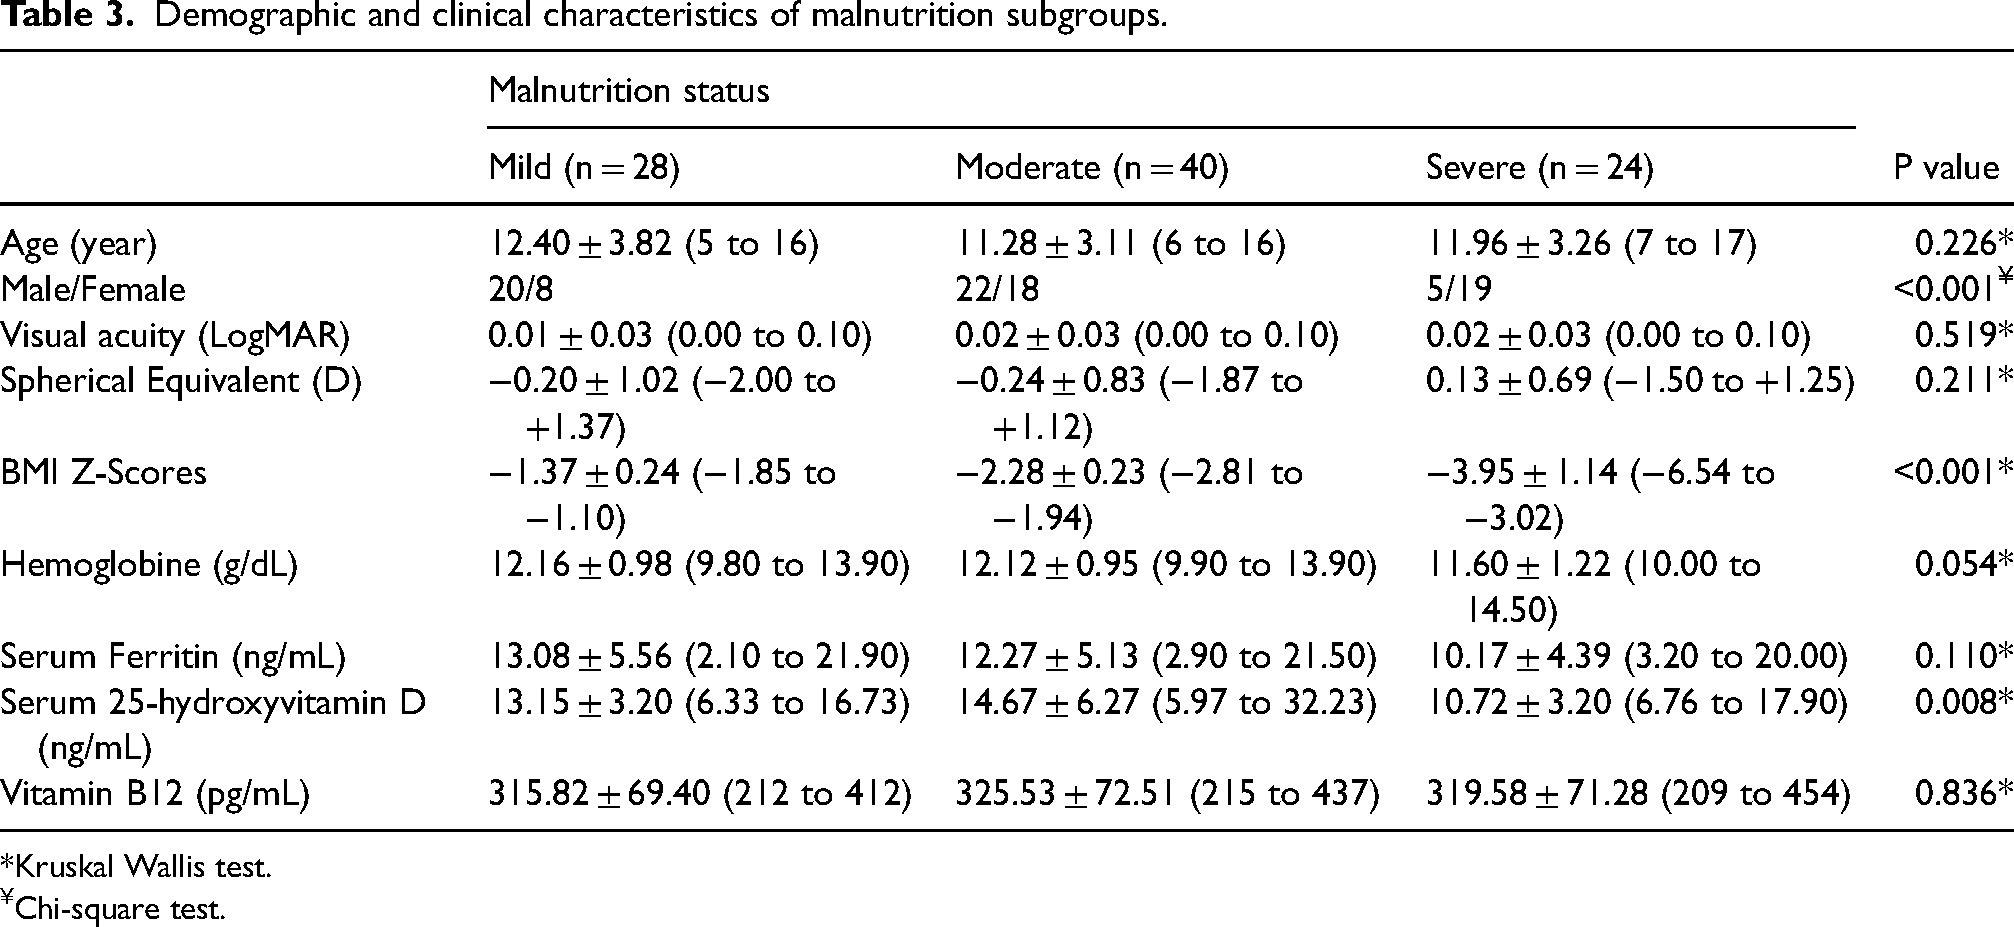
Kruskal Wallis test.
Chi-square test.
As demonstrated in Table 4, while there were no significant differences in pupil diameters under three different levels of illumination (p > 0.05), a significant difference was found in the speed of pupil dilation between the subgroups (p = 0.024). The severe malnutrition group had a higher speed of dilation than the mild malnutrition group (p = 0.007). No other significant difference existed regarding the speed of pupil dilation in the subgroup analyses mild vs moderate; p = 0.059, moderate vs severe; p = 0.281, respectively.
Comparisons of pupillary responses according to malnutrition status.
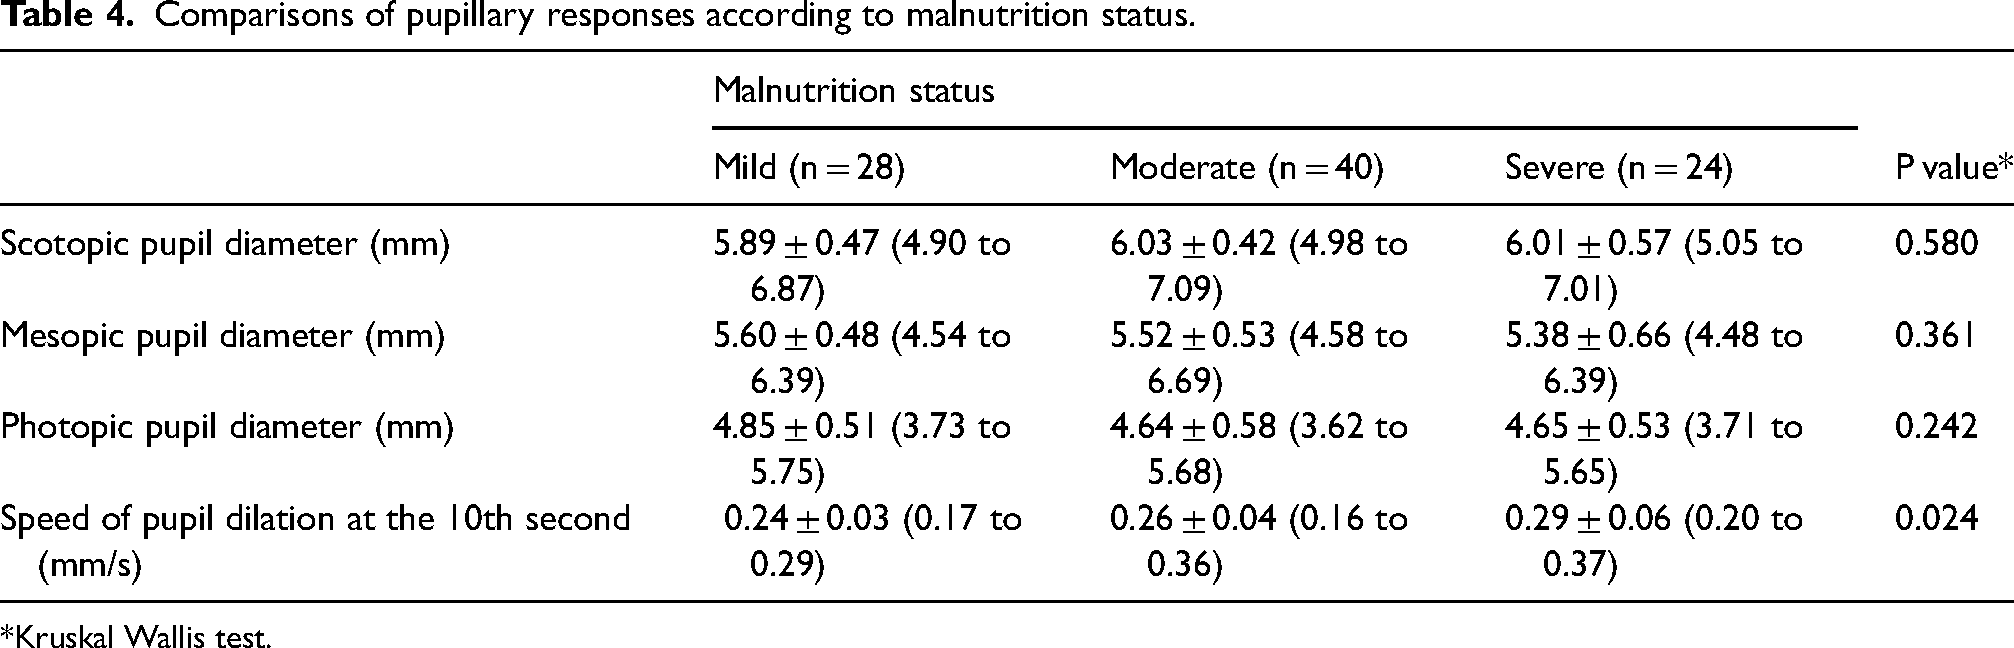
Kruskal Wallis test.
As depicted in Figure 2, mesopic and photopic pupil diameters were positively correlated with BMI z-score (r = 0.227, p = 0.029; r = 0.280, p = 0.007, respectively). There was no relationship between BMI z-score and scotopic pupil diameter (p = 0.765). A moderate negative correlation was also noted between BMI z-score and speed of pupil dilation (r = −0.313 p = 0.004, in Figure 2). No relationship existed between pupillometry and selected laboratory values (p > 0.05).
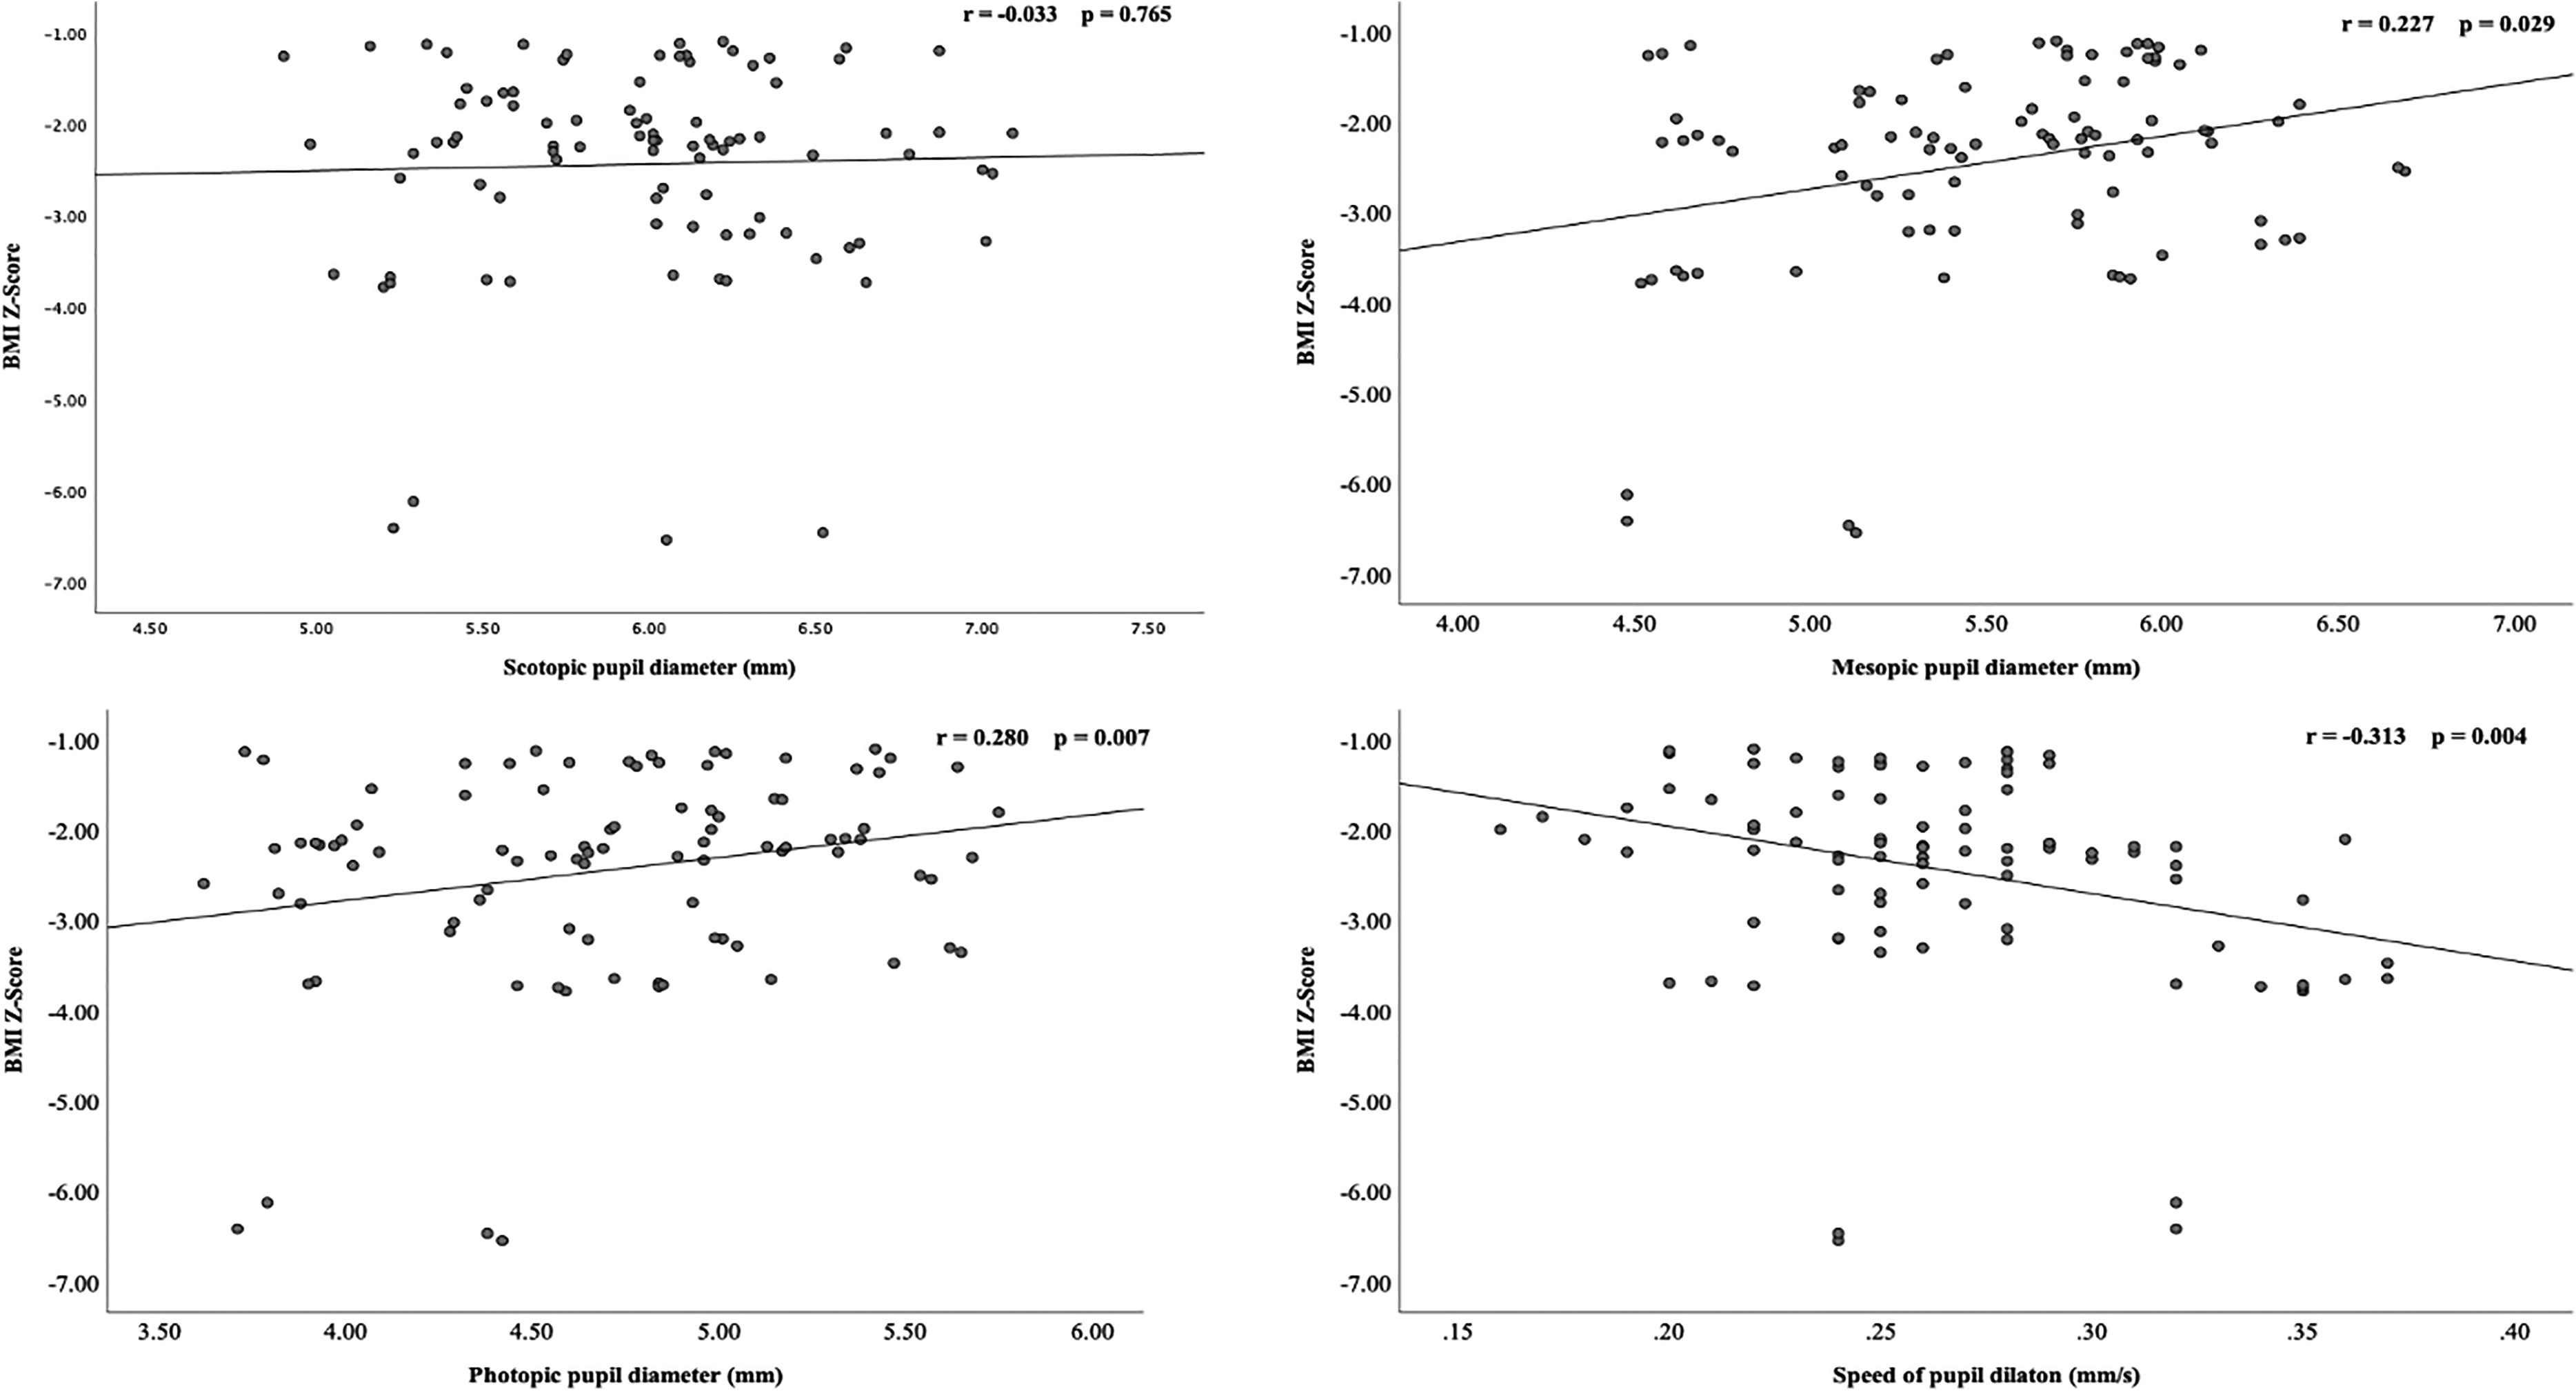
Scatter plots showing the correlations of BMI Z-score with A: scotopic pupil diameter, B: mesopic pupil diameter, C: photopic pupil diameter, and D: speed of pupil dilation.
Discussion
In the present study, malnourished children had smaller pupil diameters under three different illuminations and a higher pupil dilation speed than healthy children. Also, a significant increase in the mean speed of pupil dilation was noted in children with severe malnutrition compared with mild malnutrition. To the best of our knowledge, this is the first study to investigate the influence of malnutrition on pupil responses obtained by an automated pupillometry system in the pediatric population.
As a nongenetic factor, malnutrition has adversely affected central nervous system development, including retinal development, in animal studies.21,22 In malnourished rats, alterations in the ultrastructure of the optic nerve, such as irreversible disorganization, myelination defects, and impaired nerve transmission, have been revealed during the developmental process of myelination. 23 Additionally, deleterious effects of malnutrition on the retina and its long-lasting degenerative process during the postnatal period in rats have been reported by Bevilaqua et al. 22 There is clear evidence that nutrition is also crucial in regulating the autonomic nervous system.24,25
On the other hand, studies investigating the nutritional status and pupillary responses are rare in the literature, restricting discussion of our findings. In a study by Healy et al. 26 evaluating pupillary threshold or pupillary responsiveness using the Portable Field Dark Adaptometer (PFDA), the variations in pupillary responsiveness in malnourished children aged 4 to 8 years have been associated with altered parasympathetic activity. In our study, pupil diameters under scotopic and mesopic illumination levels were lower in the malnutrition group than in the control group, suggesting insufficient dilation. Given that the effect of luminance on pupil size is well known, the effect was most marked at low luminance, as postulated by Guillon. 27 Meanwhile, parasympathetic withdrawal and sympathetic activation are responsible for pupil dilation. 6 Our study hypothesized that discrepancies in pupillary responses in children with malnutrition could be a consequence of not only altered parasympathetic activity but also altered sympathetic system activity. Similar alterations in the autonomic nervous systems characterized by a reduction in both sympathetic and parasympathetic modulation have been highlighted in malnourished children, as reported by Barreto et al. 15
The current study also highlighted a higher speed of pupil dilation in children affected by malnutrition compared to healthy controls. Besides, it was also inversely correlated with BMI z-score. It is known that a more rapid pupillary light reflex is observed in conditions characterized by autonomic dysfunction. 6 In the aforementioned study by Healy et al., 26 children with anemia appeared to have a more rapid pupillary light reflex than nonanemic children in their marginally nourished population. Another study by Healy et al. 28 emphasized that exaggerated pupillary responsiveness to light stimuli under dark-adapted conditions due to chronic hypoxia was an adaptive and overcompensatory reaction of autonomic functions. The possible explanation was an excessive and unregulated sympathetic response, as postulated by Healy. 28 Likewise, a higher speed of pupil dilation may have also appeared as a nutritional compensation mechanism. The speed of pupil dilation calculated in dynamic mode may be pivotal as a supportive diagnostic tool for assessing the sympathetic nervous system.
Malnutrition-induced retinal degeneration has also been reported to last from childhood into adulthood. 22 A study by Tekin et al., 29 in their study of malnourished children aged between 5 and 10 years, demonstrated reduced retinal nerve fiber layer and choroidal thickness without clinically observable ocular pathology. In addition, positive correlations were noted between BMI for age z-score and both retinal nerve fiber layer thickness and foveal central choroidal thickness in malnourished children. 29 The relationships between thinning of the retinal nerve fiber layer and slower pupillary responses, such as smaller response amplitude, slower velocity, and longer time to peak constriction and dilation, have been reported in the glaucoma population. 30 Impaired pupillary responses are anticipated in malnourished children, as studies have demonstrated thinning of the retinal ganglion cell layer and choroidal thickness in malnutrition.26,29 In the current study, the BMI z-score was positively correlated with mesopic and photopic pupil diameters but not scotopic pupil diameter. In this regard, our findings should be interpreted cautiously due to the lack of retinal structure analysis, including retinal nerve fiber thickness as a marker of optic nerve function.
Previous studies have shown the effects of serum levels of selected micronutrients on retina and choroid structures, as well as pupillary responses in children.4,13,14,29 Positive correlations of the retinal nerve fiber layer and choroidal thickness with hemoglobin, iron, and ferritin levels have been reported in children with iron deficiency anemia.4,31 Tekin et al. 29 demonstrated similar correlations between foveal central choroidal thickness and ferritin, hemoglobin, and vitamin B12 levels in malnourished children. Interestingly, the strong negative relationship between hemoglobin and pupillary responsiveness has been highlighted as the most important nutritional correlation by Healy et al. 26
In addition to its role in the myelination of the nervous systems, vitamin B12 is essential for maintaining normal neurological function and various metabolic processes. 2 Özkasap et al. 3 stated thinning of the retinal nerve fiber layer in children with vitamin B12 deficiency, based on a positive correlation. A study by Öztorun et al., 13 evaluating static pupillary responses in children with vitamin B12 deficiency using the Sirius topography device, reported larger pupil diameters under mesopic and photopic conditions than healthy children, indicating insufficient pupil constriction.
Despite its neuroprotective effect, no clear information about the pathological effects of vitamin D on the autonomic nervous system is well established in the literature. Previous studies on vitamin D deficiency have addressed impaired parasympathetic nerve fiber function and neuromuscular coordination.32,33 Yıldırım Biçer et al. 14 mentioned that children with vitamin D deficiency had larger pupil diameters in photopic conditions than healthy children, pointing to the parasympathetic system dysfunction, pointing to the parasympathetic system dysfunction, similar to Öztorun et al. 13 Also, the pupil dilation speed was slower in the group with < 12 ng/mL than ≥ 12 ng/mL. 14 Considering serum vitamin D levels in our study, a higher speed of dilation was observed in the severe malnutrition group (< 12 ng/mL) than in the mild malnutrition group (≥ 12 ng/mL). No significant relationships existed between pupillary responses and serum levels of selected micronutrients in our study. Since malnutrition subgroups were created according to BMI z-score in our population, these variations in pupillary responses may not be solely attributable to serum levels of micronutrients. Nevertheless, the lesser degree of variations in pupillary responses at high luminance should be considered when evaluating previous studies and their outcomes.
This study has some limitations. First, it is not possible to establish causal relationships using a cross-sectional design. Another drawback of this study is that the impact of other micronutrient deficiencies, such as vitamins A, C, and E, biotin, and zinc, could not be measured due to unavailable kits. There is no information regarding serum iron levels, which may help differentiate potential causes of anemia in our study. Laboratory analysis has relied on single measurements and indicators of nutritional status, which are known to be affected by inflammation. Differences in pupillary responses based on the severity of malnutrition did not reach significance levels due to the small sample size, which also affected the validity of the results. Finally, the Sirius device is only able to detect dilation speed in dynamic mode. Available pupillometry devices comprehensively monitor and provide information about dilation and contraction-related values, such as amplitude, latency, duration, and velocity.
In conclusion, the present study demonstrates smaller pupil diameters under different luminance levels as well as a higher speed of pupil dilation in malnourished children. Early recognition of these changes in the pupillary responses may be a sign of preventing malnutrition-related ocular pathologies. Thus, more detailed data are needed to clarify pupil characteristics in children with ocular symptoms. Further studies should also elaborate on the reversibility of these outcomes before and after treatment in malnourished children.
Footnotes
Ethical approval
Ethical approval was obtained from the Ethics Committee of Alanya Alaaddin Keykubat University, Approval Date: 18.10.2023 Approval number: 10354421-2023/14-18 and The study was designed to adhere to the Declaration of Helsinki. Informed consent was obtained from each parent or legal guardian before the examination.
Author contribution
All authors attest that they meet the current ICMJE requirements to qualify as authors.
Contributions of authors: design of the study (DOK); conduct of the study (DOK,FY); collection and management of data (EYŞ,BY); analysis and interpretation of data (DOK); preparation of manuscript (DOK,FY); review or approval of manuscript (EYŞ,BY).
Funding
The authors received no financial support for the research, authorship, and/or publication of this article.
Declaration of conflicting interests
The authors declared no potential conflicts of interest with respect to the research, authorship, and/or publication of this article.
Data availability statement
The datasets generated and/or analyzed in the current study are available from the corresponding author upon reasonable request. Data are not publicly available, and further enquiries can be directed to the corresponding author.