
Abstract
Purpose
To analyze wait time (WT) trends at Pediatric Ophthalmology and Strabismus (POS) service clinics.
Methods
Retrospective observational study utilizing MDClone and electronic health records (EHRs) on 19,018 patients from POS clinics at a tertiary university-affiliated hospital in Israel, during April 2016-June 2023. Data were collected by the qFlow real-time patient tracking system. Primary outcome measures were WTs trends.
Results
Data consisted of 19,018 patients, and the final cohort was 11,320 patients (49.51% female). Median age was 6 (IQR: 7) and median WT was 34.14 (IQR: 16.52–60.35) minutes. WT decreased during the pandemic (p < 0.001). WT across different eye clinics at the POS service differed (p < 0.001). Average WTs differed throughout the day: gradually decreasing from front desk opening until accepting patients, gradually increasing before noon, and followed by a gradual decrease. WTs fluctuated throughout the year with no clear pattern (31 min in May vs. 37 min in July, p < 0.001). There was a significant, weak, negative correlation between patients’ lateness and WT, suggesting late arrivals were admitted quicker (p < 0.001). Median WT was not associated with gender (p = 0.93) or religion (p = 0.11) and with age (R = 0.02, p = 0.14).
Conclusion
WTs remained stable over the years. WTs at the POS service were significantly influenced by the time of day, month, type of clinic, and arrival time relative to the set appointment. WTs were significantly decreased during the COVID-19 epidemic. Personalized clinic schedules and adjusting for the complexity of needing both an orthoptist and ophthalmologist, may shorten WTs and encourage patients to avoid early arrivals.
Introduction
Wait time (WT) is the duration patients wait in a clinic before being attended to by a healthcare worker. In recent years, hospital systems have increasingly emphasized quality of care (QOC), which includes patient satisfaction, amongst other parameters. As demand for healthcare services increases, providers of health services often face challenges in ensuring timely access. 1
Healthcare economy requires minimizing WTs to compete, manage costs, and retain clientele. This parameter has been of great interest in recent years given its association to many fields as well as ophthalmology QOC, to ensure better care experiences and patient satisfaction.2,3 Early international comparisons of WTs across Organization for Economic Co-operation and Development (OECD) countries traditionally focused on elective hospital care, but in recent years this has broadened to include ambulatory care. 4 The systemic interests of hospitals and clinics are broader and include retaining first-time patients, increasing referrals, cost controls, and competing in an expanding, consumer-driven marketplace. 5 The literature suggests that the time a patient spends waiting for their scheduled appointment has the largest influence on patient satisfaction and confidence in their provider.6,7 This, in turn, could increase compliance, thus improving outcomes as well as decreasing complaints, and preventing unnecessary tests and threats of malpractice lawsuits. 8
A literature review conducted on patient satisfaction in Emergency Departments (EDs) found that perceived WT was one of three main components. 9 In pediatric ophthalmology a longer wait might also reduce cooperation, resulting in a longer, less reliable examination, while delaying other patients and harming QOC in a vicious cycle.
A literature review conducted on patient satisfaction in Emergency Departments (EDs) found that perceived WT was one of three main components. 2 In pediatric ophthalmology a longer wait might also reduce cooperation, resulting in a longer, less reliable examination, while delaying other patients and harming QOC in a vicious cycle.
The aims of this study were to identify the unique characteristics and trends over time in Pediatric Ophthalmology and Strabismus (POS) clinic WTs. This in turn may help in identifying ways to shorten WTs and thus improve overall satisfaction and QOC.
Materials and methods
Location and duration
This retrospective observational study used MDClone software (MDClone, Beer Sheva, Israel) to analyze anonymized data from electronic health records (EHRs) at Rambam Health Care Campus (RHCC), a tertiary university-affiliated public hospital. We included all visits to the POS clinic at the Ruth and Bruce Rappaport Children's Hospital at RHCC during April 2016-June 2023. The service incorporates two pediatric ophthalmology clinics, each run by different US-matched fellowship trained pediatric ophthalmologists. An orthoptic clinic run by a certified orthoptist-optometrist operates in parallel with the ophthalmologist clinic on Mondays and Wednesdays.
Data collection
Measurements were obtained from RHCC's automated computerized call system - qFlow software (Qnomy, Miami, Florida, USA). The POS clinic utilizes this real-time patient tracking system to document every step of the patient's journey from the moment an appointment is scheduled. We defined WT as the time interval between front desk registration and paging the patient, while visit time was defined as the time interval between front desk registration and POS clinic staff patient sign out. MDClone® software (MDClone Ltd., Beersheba, Israel) generates synthetic, non-identifiable healthcare data, enabling analysis without exposing patient information. In our study, we used MDClone to retrieve pediatric ophthalmology and strabismus clinic records from April 2016 to June 2023. QFlow (QFlow Systems, Dallas, Texas, USA) is a workflow automation software that helps manage patient appointments and waiting times but does not perform statistical analysis.
No sampling was done as data were automatically retrieved on all the clinic patients during the study period.
Patient flow
Patients arrived to their appointment and registered at the front desk. After doing so, they waited at the main hall until the POS provider was ready to see them. The main hall contained several children-appropriate activities to pass the time (e.g., toys, computer games, televisions, medical clowns, alternating activities and events) which the patients could enjoy until the POS provider is ready to see them.
Statistical analysis
Normality of the data was assessed using both quantitative and qualitative approaches. Due to the large dataset Anderson-Darling test for normality was used and results in p < 0.001. Also, a density plot was generated and further demonstrated this quality of the data.
To compare differences across multiple groups for non-normally distributed continuous variables, the Kruskal-Wallis test was utilized. This non-parametric test was chosen due to the violation of normality in the primary dependent variable. Post-hoc pairwise comparisons were conducted where applicable to identify specific group differences. For comparisons between two independent groups, the Mann-Whitney U test was applied.
A chi-square test was used to compare no-show rates across different months. This test assessed whether the proportions of no-shows were independent of the month. Following a significant results, a post-hoc analysis was conducted in order to determine which pairs of months significantly differed from one another.
To examine the relationship between the waiting time between registration at the secretariat and admission to the physician and multiple predictors (day of the week, season, number of patients in the same day, demographics, time in relation to the Covid-19 pandemic, and punctuality group), a multivariate regression model was employed. The model accounted for several independent variables, including categorical and continuous predictors, to assess their effect on the dependent variable. For categorical variables, contrasts were used to assess the differences between categories.
The waiting time over time depicted a small non statistically significant decrease over the years. However, they displayed an overall random variations over time after taking into account the seasonal and yearly attenuations in the statical Time-series decomposition model model (e-supplement graphs 9a, b, c and d). Therefor they did constitute a variable that might have had an impact on the waiting times.
To better understand trends and patterns over time, a time series decomposition model was employed on the dataset. The decomposition was used to break down the total waiting time into trend, seasonal, and residual components. This method allows for a clearer understanding of the underlying patterns in the data, distinguishing long-term trends from short-term fluctuations.
Significance was determined using a p-value threshold of less than 0.05.
Statistical analyses were performed using R version 4.3.3 (R Foundation for Statistical Computing).
Post-hoc analysis
Following the initial chi-square test of independence to assess the association between months and no-show rates, we performed a pairwise comparison of no-show rates across different months. This step was taken to further investigate which specific months contributed to significant differences in no-show rates.
Bonferroni correction
Given the multiple comparisons across all pairs of months, we applied the Bonferroni correction to adjust the p-values for multiple testing. This adjustment reduces the risk of Type I errors by dividing the alpha level (0.05) by the number of comparisons. The corrected p-values were used to identify which pairs of months exhibited statistically significant differences in no-show rates.
Outcome measures
The primary outcome measure of this study was trends in WT for POS clinics at RHCC, a tertiary university-affiliated public hospital, between April 2016-June 2023.Secondary outcome measures were the association between WT and several additional variables: time of the day (the time slots from 8–10 am, 10–12, and 12–2 pm were grouped as ‘Early Morning,’ ‘Late Morning,’ and ‘Noon,’ respectively), interval between actual time of arrival and set appointment time, number of patients per workday, day of the week, month of the year, year, demographics (age, gender, and ethnicity), and number of times patients did not attend scheduled appointments (no shows).
Seasons were defined based on the month of the year. Specifically, December, January, and February were categorized as Winter; March, April, and May as Spring; June, July, August, and September as Summer; and October and November as Autumn. This classification was used to analyze potential seasonal variations in waiting times.
To evaluate the impact of deviations from scheduled times on WTs, we calculated the difference between appointment time and arrival time for each patient. We then categorized the patients into three groups: those who arrived early (more than 15 min before their appointment), those who arrived on time (within 15 min before 5 min after their appointment), and those who arrived late (more than 5 min after their appointment).
Results
The data consisted of 19,018 patient appointments. A total of 6,642 (34.92%) did not show and an additional 103 (0.54%) left the clinic before seeing a physician. These two groups were excluded from the final analysis. A pairwise comparison of no-show rates was conduced to further investigate which specific months contributed to significant differences in no-show rates. Given multiple comparisons across (i.e., across pairs of months) the Bonferroni correction was applied. The final cohort consisted of 11,320 patients (49.51% female). We determined the data to be not normally distributed (appendix graph 8). Median age was 6 (IQR: 7) years, median WT was 34.14 (IQR: 16.5–60.3) minutes, and the most common WT was 10 min, followed by a exponential shaped decrease in frequency to 150 min (Figure 1). WT were stable during the study period (p = 0.17, Table 1), but we did observe a decline during 2020–2022 (p < 0.001).
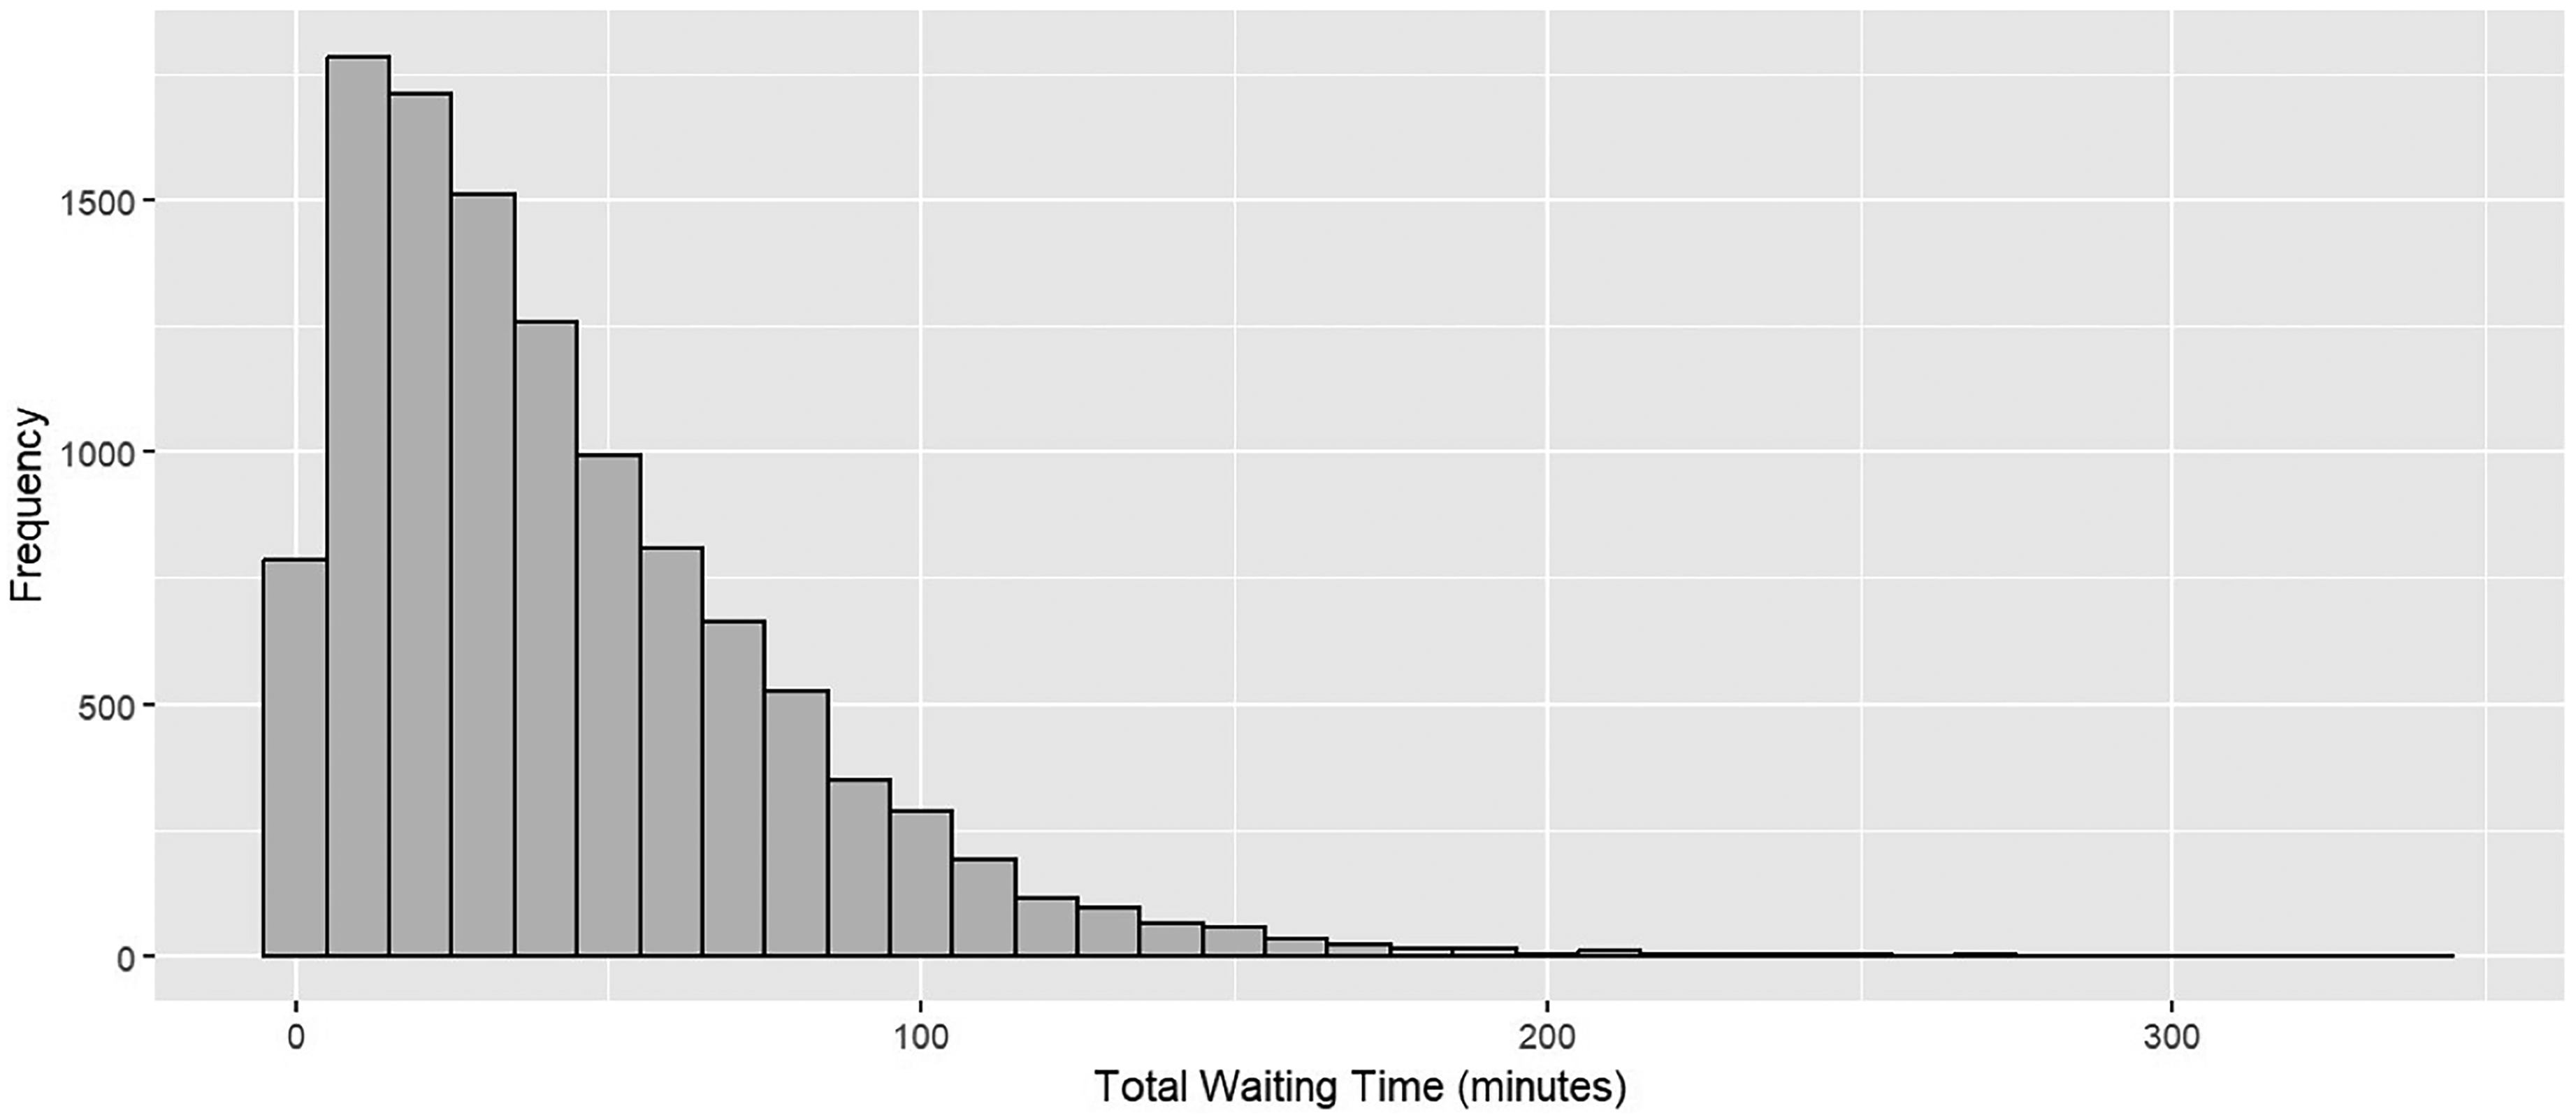
The distribution of total wait times.
Average waiting times over the years.
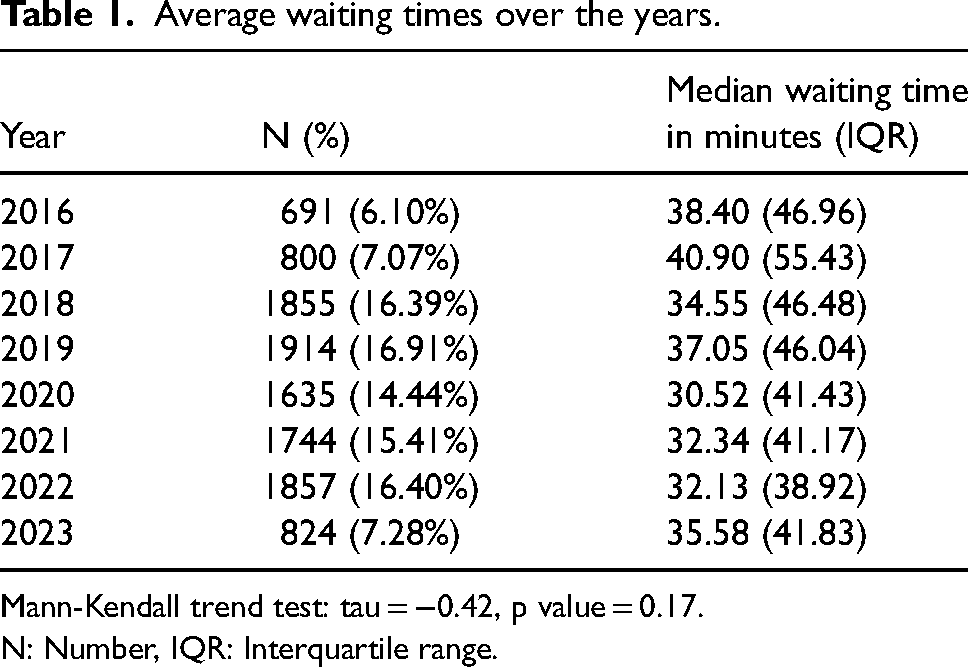
Mann-Kendall trend test: tau = −0.42, p value = 0.17.
N: Number, IQR: Interquartile range.
To analyze the impact of the COVID-19 alpha and delta variants (first and second waves of the epidemic) we divided the study duration into three time periods: pre (the beginning of the first wave, March 2020), during, and post (from October 2022) COVID-19. 3 We have found that WTs prior to the COVID pandemic (median 36.79 ± 47.62 min) and post the COVID pandemic (median 32.85 ± 40.63 min) were significantly longer than the WTs during the COVID pandemic (median 28.63 ± 39.76 min) (p < 0.001, Figure 2).
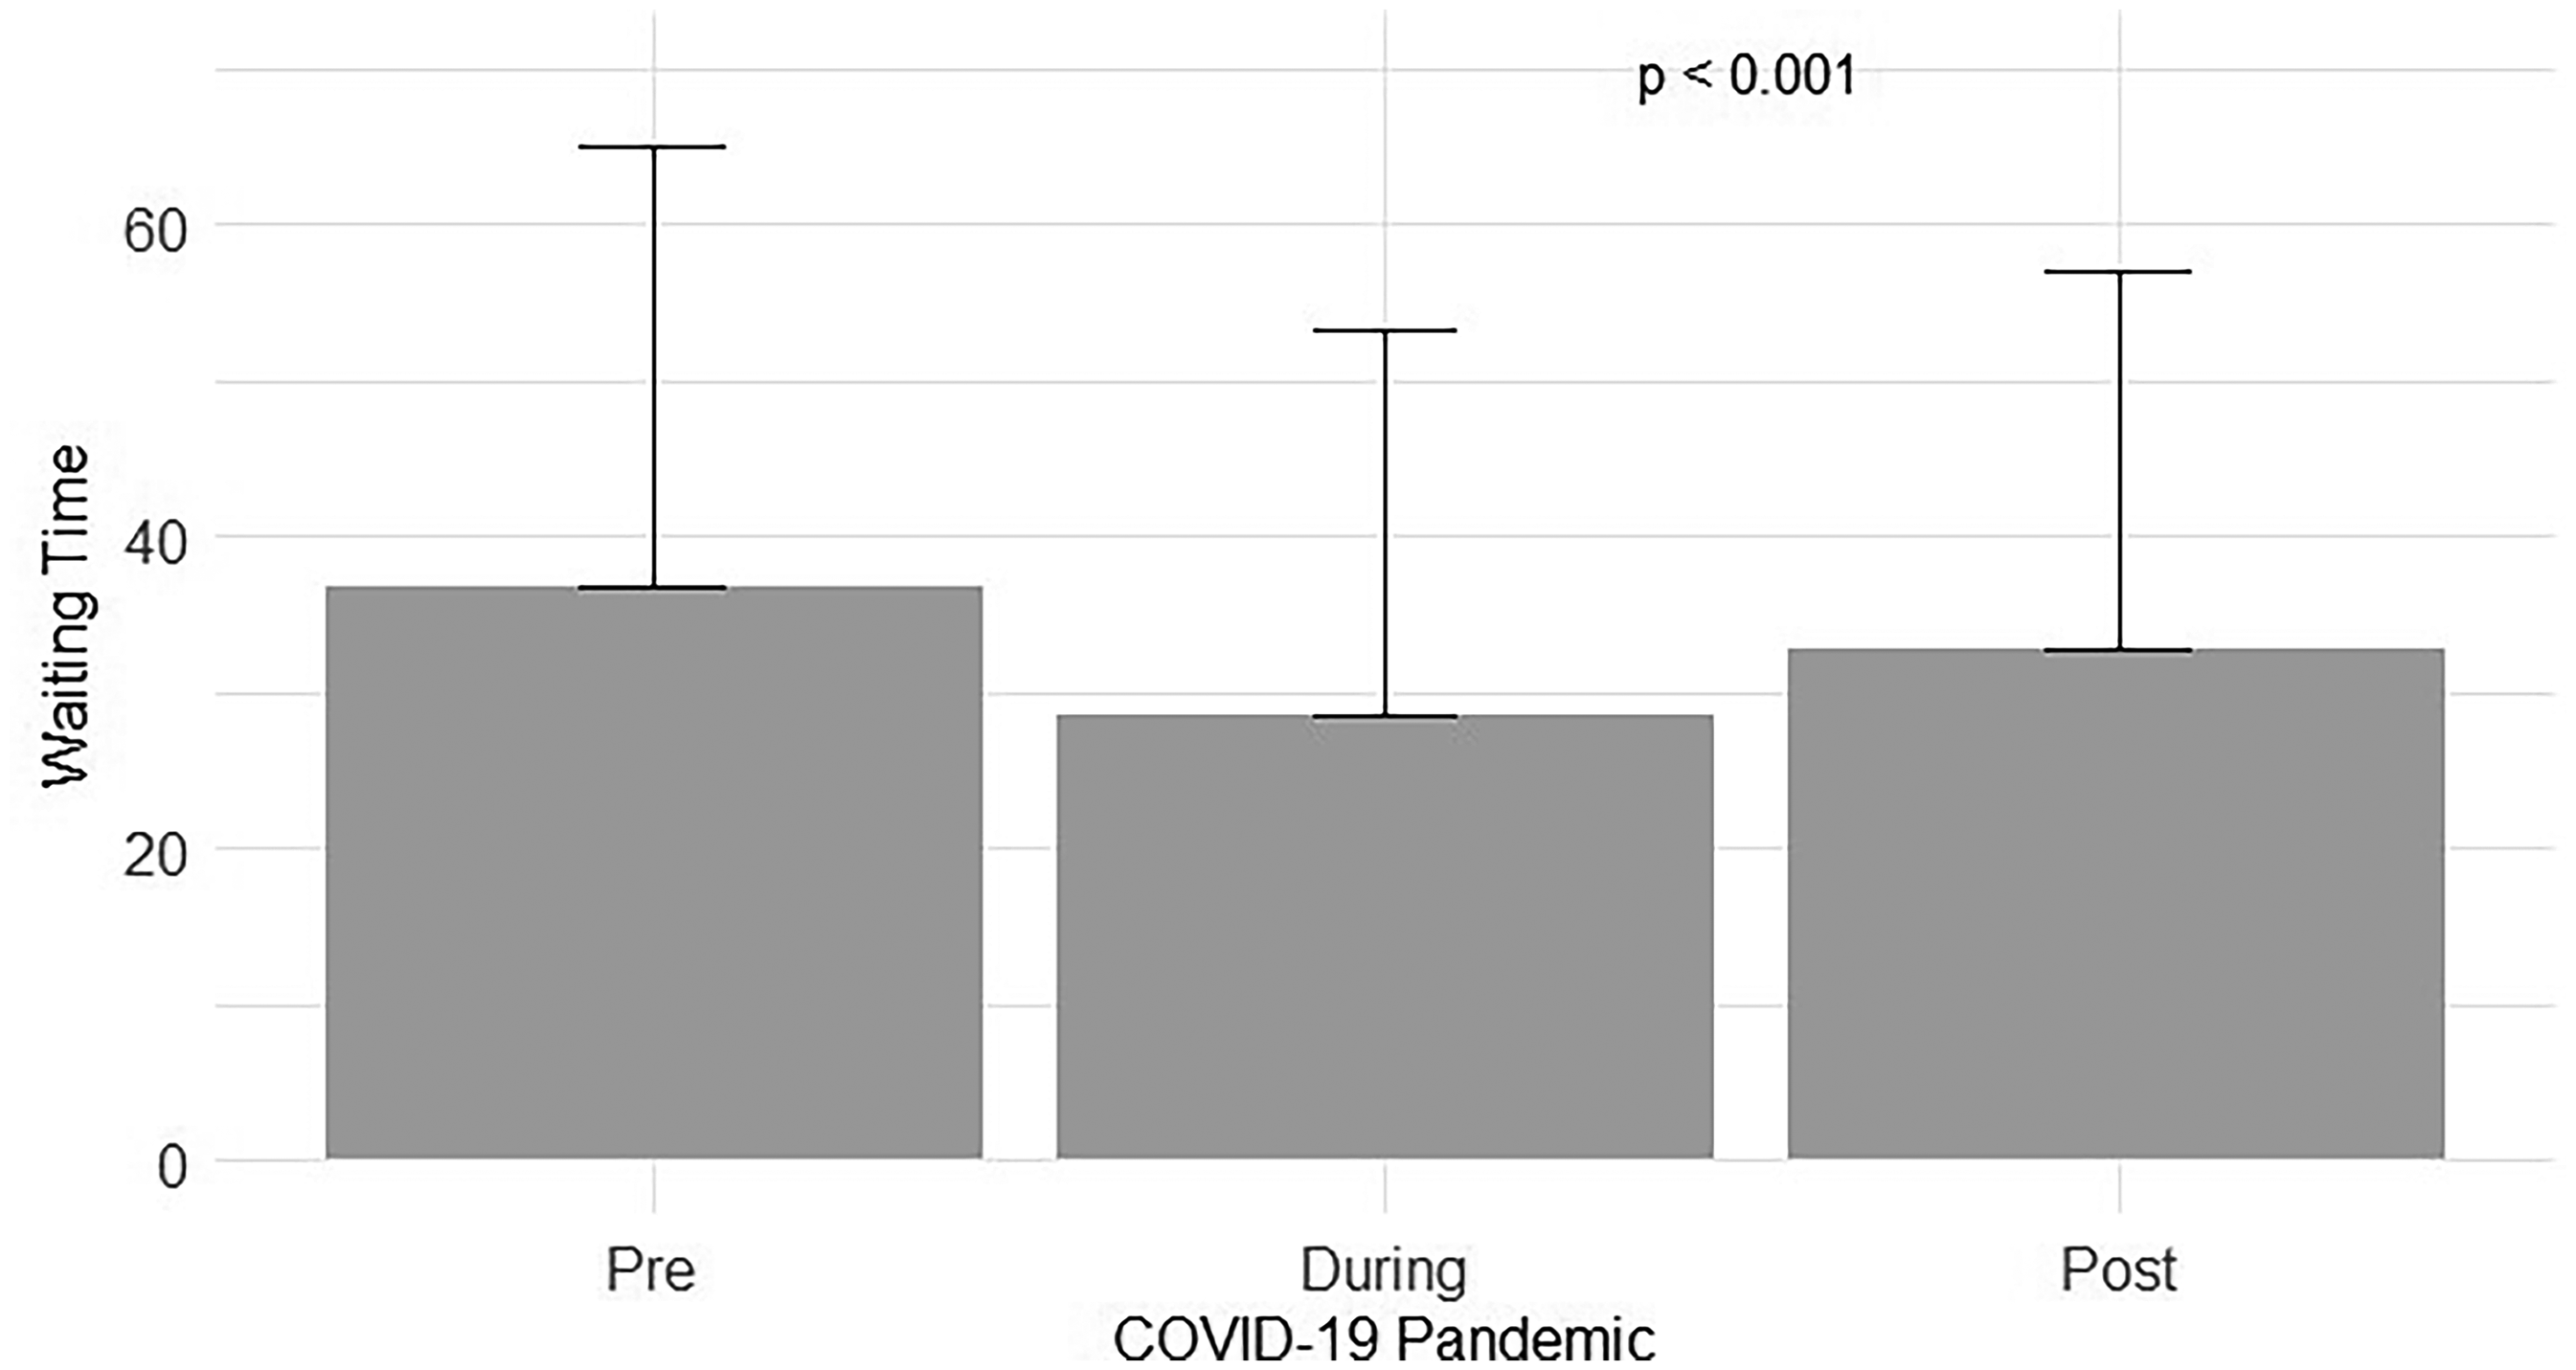
Wait times pre, intra, and post the COVID 19 pandemic.
The median WT was not associated with gender (p = 0.91, Supplementary, eTable 1), or religion (p = 0.11, Supplementary, eTable 2). However, it was marginally positively associated with age (R = 0.02, p = 0.04). WTs were different throughout the day. The peak median WT was at 7AM before the clinics opened (38.71 ± 51.64 min), followed by an increase until midday (37.80 ± 46.99 min), and then by a decline reaching a trough at 2PM of 14 min (p < 0.001, Table 2). Mondays (run by physician no. 1) and Wednesday (run by physician no. 2) had similar median WTs (45 and 43 min, respectively) but the WT for the Tuesday clinic run by physician no. 2 was only 26 min. (p < 0.001, Supplementary eTable 3). This explains the different WTs that were observed among the clinics run by the two pediatric ophthalmologists and the orthoptist (p < 0.001, Supplementary eTable 3).
Average waiting times throughout the day.
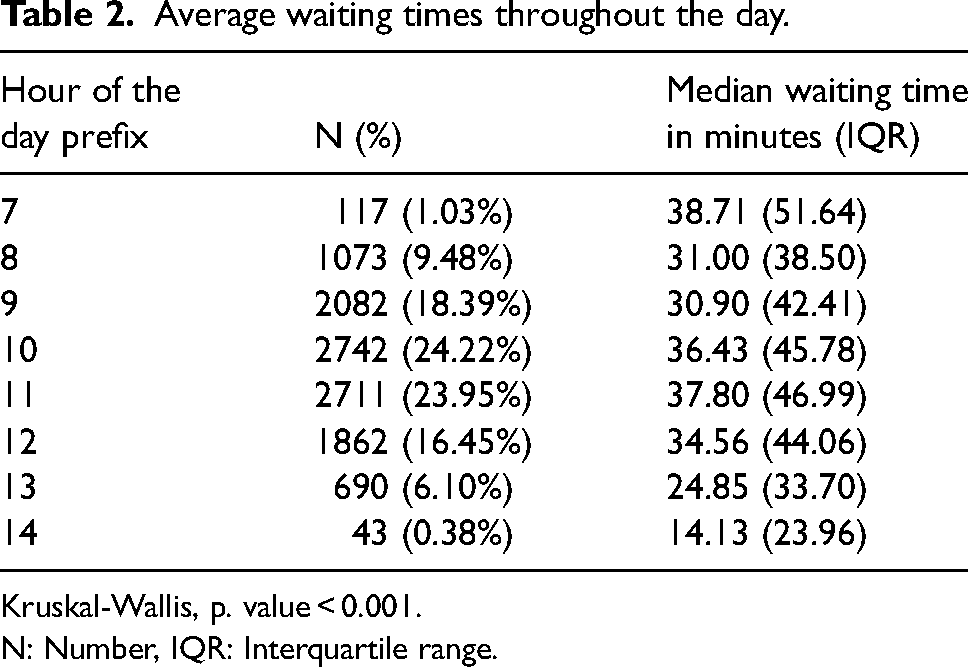
Kruskal-Wallis, p. value < 0.001.
N: Number, IQR: Interquartile range.
During the year, median WTs fluctuated in different months without a noticeable pattern, ranging from a minimum of 31 min in September to a maximum of 37 min in July (p < 0.001, Supplementary eTable 4).
A multivariate regression model found that the care provider in the clinic (YR, reference: Pediatric Ophthalmology EM), time of day (early and late, reference: Early morning), number of patients during the day, day of the week (Tuesday, reference: Monday) and the time frame in relation to the COVID epidemic (pre or post, reference: During) were statistically significant for shorter wait times (P < 0.05) (Table 3).
A multivariate regression model for identifying factors associated with waiting times.
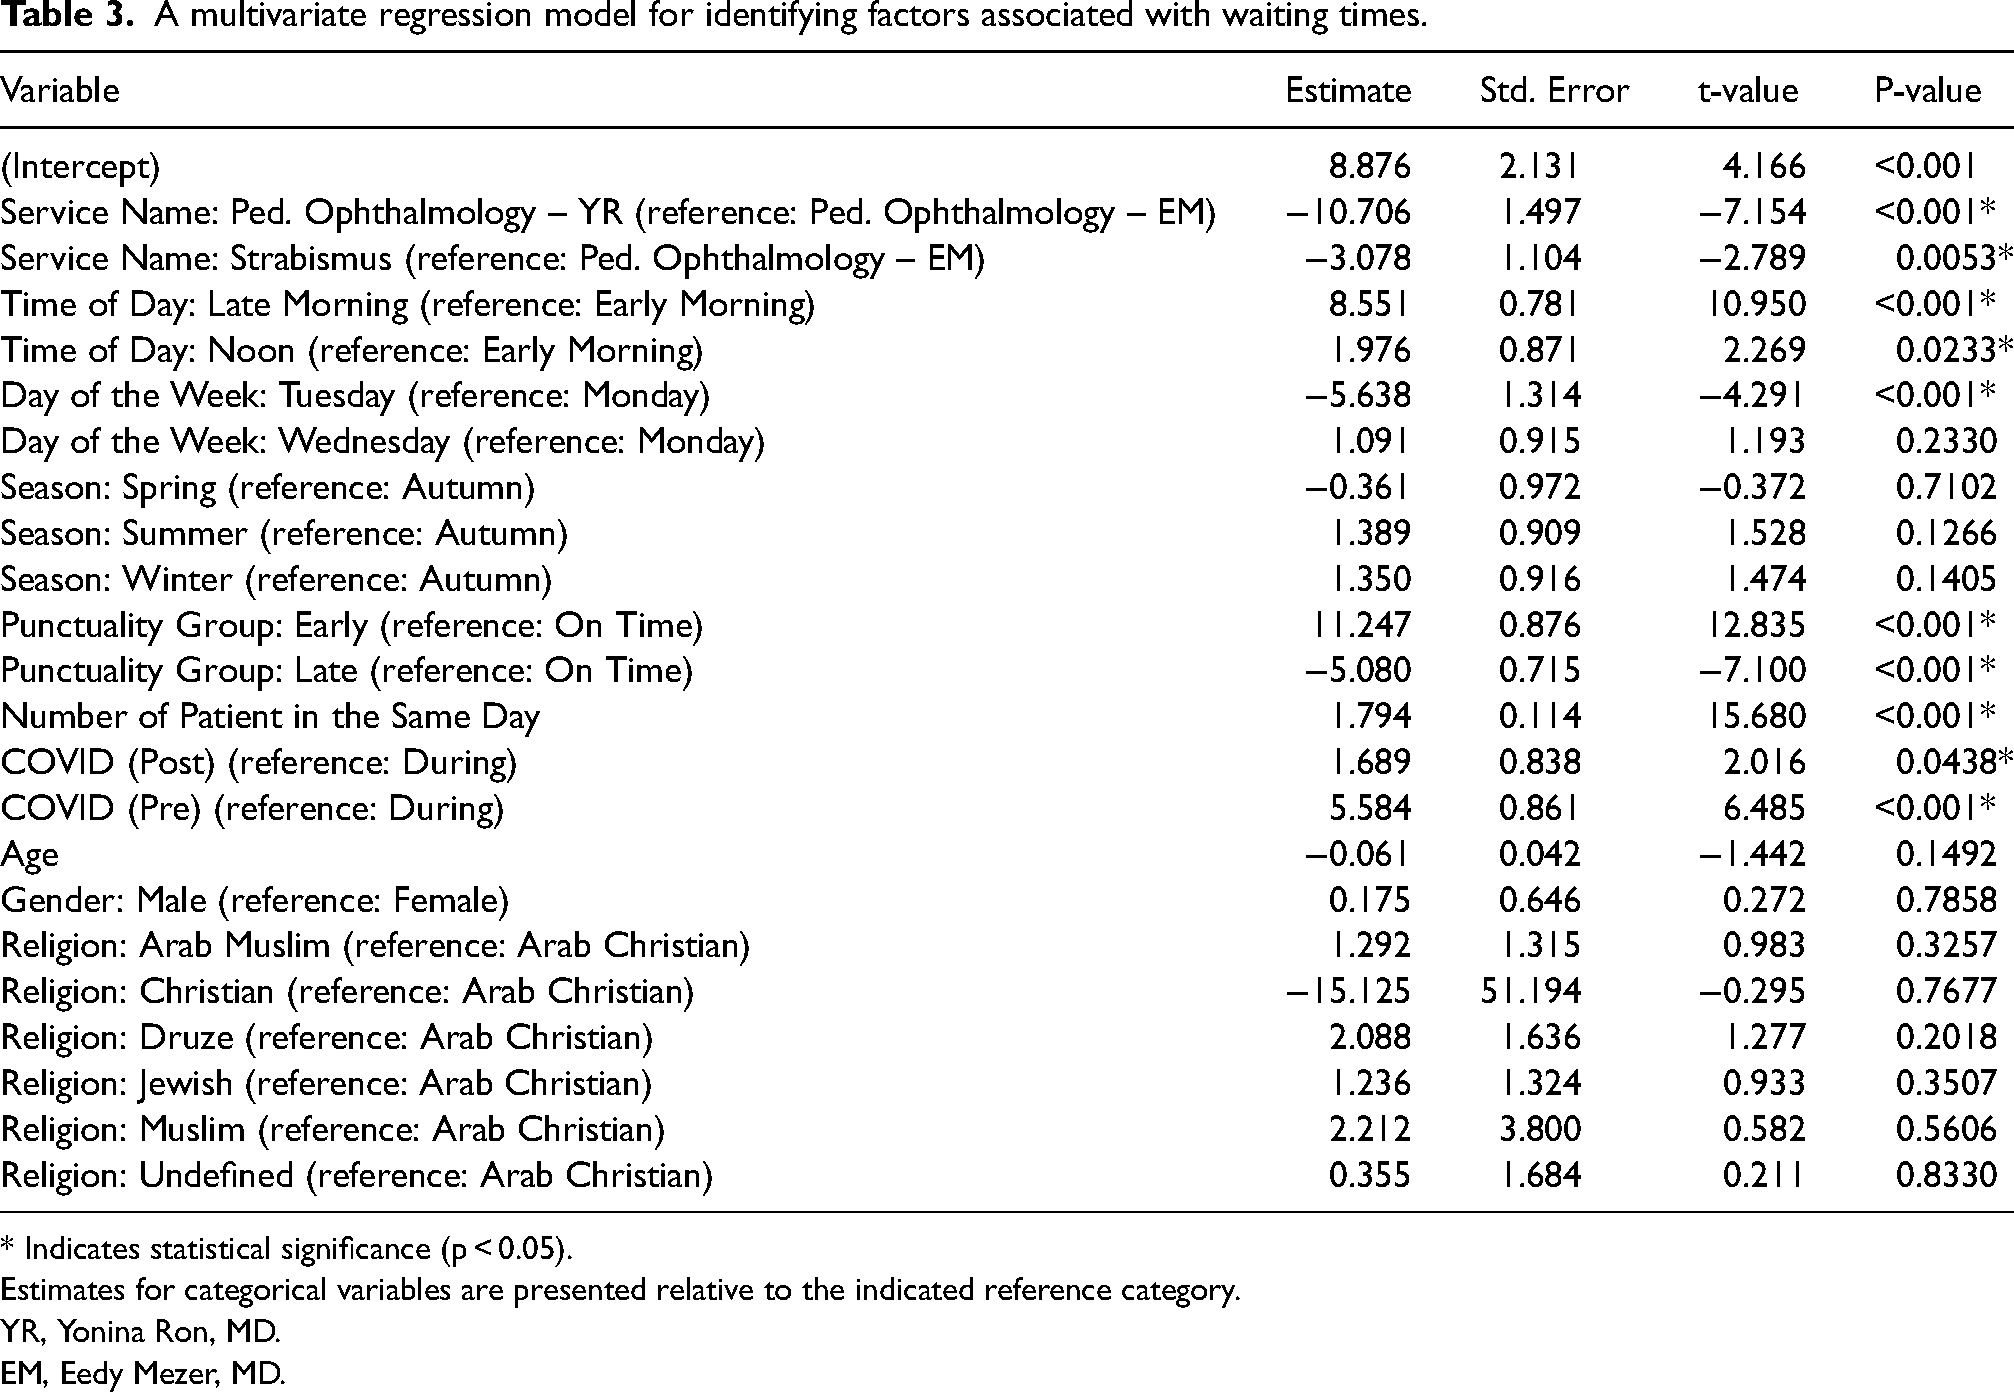
* Indicates statistical significance (p < 0.05).
Estimates for categorical variables are presented relative to the indicated reference category.
YR, Yonina Ron, MD.
EM, Eedy Mezer, MD.
WTs based on patients’ actual arrival time showed a significant difference among early arrivals (i.e., those who arrived more than 15 min before the appointed time), arrivals on time, and late arrivals (i.e., more than 15 min after their appointment) (43.41 ± 52.06, 30.38 ± 39.59, 27.48 ± 35.33, respectively, r = −0.23, p < 0.001, Supplementary eTable 5). This comparison showed a negative correlation between arrival and WTs (i.e., the later they arrived, the shorter the WT).
Discussion
In this study, we examined the WTs in pediatric eye clinics in a single tertiary referral hospital. Long WTs can have a significant negative impact on health. The consequences can include delays in receiving necessary care, delays in diagnosing diseases and increased demand on resources, as well as a broad economic impact (increased healthcare costs, reduced staff productivity). A significant number of aspects of WTs were analyzed, and WTs were found to be stable throughout the study period despite a growing recognition of the importance of minimizing WTs as a crucial component of patient care. 4
Of note, we attribute the remarkably high no show rate to two factors: exceptionally long waiting times from scheduling to the actual appointment date, and difficulties in receiving coverage approval from patients’ health insurance company for the appointment.
In addition, WTs prior to and after the COVID-19 outbreak were significantly longer than during the epidemic period in concordance with previous reports. 5 Of note, the number of patients seen in 2016–2017 were notably lower than in subsequent years, as until 2018 only one physician ran a clinic once weekly. The number of visits plummeted again in 2023 when the Tuesday clinic was canceled.
As mentioned in the literature, the average number of patients seen daily was significantly lower during the pandemic. Age, religion, and gender did not affect WTs, in agreement with previous studies. 5 WT for different clinics (physician 1, 2, and orthoptist) were also significantly different. One physician had shorter WTs during their Tuesday clinic as compared to their Wednesday clinic, which was similar in duration to the other physician's Monday clinics. This explains the different WTs that were observed among the clinics run by the two pediatric ophthalmologists and the orthoptist (p < 0.001, Supplementary eTable 3).
There are several additional factors that affected WT. Patients arriving late to their appointment were added to the list based on their arrival time and were therefore prioritized over patients with a later scheduled appointment. Patients requiring cycloplegic refraction and those having appointments for both an ophthalmologist and an orthoptist had longer WT as well, as assessments and scheduling availability were not always perfectly synchronized.
WT fluctuated throughout the day and were longest in the middle of the workday, between 10:00 and 12:00 noon. This was expected, as the clinic is busiest in the late morning, in addition to longer queues for parking and at the front desk.
WTs varied significantly during the year by month, ranging from a low in May to the longest in July. Although the literature does not provide a clear explanation for this phenomenon, a possible explanation could be that patients are more available during their summer vacation, resulting in fewer cancellations or no-shows. Conversely, during the rest of the year, the percentage of patients missing their scheduled appointments is higher, leading to shorter WTs.
Our findings indicate that WT duration was strongly related to the interval between actual time of arrival and appointed time, with patients who arrive more than 15 min early for their appointment experiencing longer WTs. In contrast, those who were late waited less time than those who arrived on time. Every other week, on Mondays and Wednesdays, the clinic starts at 10:00 instead of 8:30 due to Retinopathy of Prematurity (ROP) screening in the Neonatal Intensive Care Unit (NICU). Some patients schedule appointments to other services before their eye clinic visit. In these cases, WTs are prolonged because the time from registering at the clinic front desk until they are called to the eye clinic also includes time at other services. This finding that, paradoxically, those who registered early waited the longest at clinics, was also reported in studies from Saudi Arabia, Vietnam, and China.6,7 This may reflect patients’ beliefs that they will be admitted earlier if they arrive early, whereas because of the fixed capacity of outpatient consultation rooms and available staff, this can lead to a grouping of patients, resulting in longer queues for both the front office and clinic. On the other hand, patients who had arrived late would wait less as they would be inserted into the existing list of patients who have arrived in time for their appointments.
Advising the parents to avoid booking appointments with other services before their meeting at the eye clinic and not to arrive early may further decrease WTs.
Previous studies provided potential solutions for reducing WTs including delegating some tasks to orthoptists, such as sensorimotor and motility examinations, 8 which is the mode of operation in our POS clinics. A study of five subspecialty clinics in an academic center in Oregon reported that ophthalmologists spent an average of 11.2 min per patient. Delegating some tasks to orthoptists may improve utilization of pediatric ophthalmologist time and consequently reduce WTs, and/or enable seeing more patients.
Modifiable factors that could improve patient satisfaction include patient feedback surveys, a warm inviting waiting area, and reminders to avoid planning to arrive ahead of time. 9 In addition, several studies have found that staff chatting a small amount of time with patients about non-medical topics can make WTs more pleasant.2,4 These factors were just as important as efforts to reduce actual WT. 10 A waiting area which provides a welcoming environment (e.g., equipped with toys, computer games, televisions, medical clowns, and various activities) can also be extremely beneficial for achieving that goal.
This study has several limitations. First, it was conducted at a single hospital, which may limit generalizability. However, this hospital is a referral center that serves nearly 2 million residents and extrapolating the findings of this study could provide valuable insight.11,12 Second, this study was retrospective. Future prospective studies covering multicenter, international data may provide a broader perspective
Conclusions
This study raises questions that many public or private POS clinics face daily and provides ideas on how to improve overall patient satisfaction as well as better balance the workload in these busy clinics. We found that WTs are dynamic yet stable and influenced by multiple factors ranging from global events (COVID-19 pandemic); time of day, month and year; type of clinic, whether clinics run in parallel or not, and interval between arrival time and appointment time. Various means may be employed to identify and reduce WTs.
Supplemental Material
sj-docx-1-ejo-10.1177_11206721251345850 - Supplemental material for Wait times in pediatric ophthalmology clinics: Insights from a tertiary university hospital
Supplemental material, sj-docx-1-ejo-10.1177_11206721251345850 for Wait times in pediatric ophthalmology clinics: Insights from a tertiary university hospital by Achia Nemet, Asaf Israeli, Tzadok Yona, Eytan Z Blumenthal, Adir Sommer, Efrat Naaman, Vered Brucker, Yonina Ron, Jessica Lelonek and Eedy Mezer in European Journal of Ophthalmology
Footnotes
Author contributions
Conceptualization: Eedy Mezer; Methodology: Eedy Mezer, Asaf Israeli; Formal analysis and investigation: Tzadok Yona; Writing - original draft preparation: Achia Nemet, Asaf Israeli; Writing - review and editing: Eedy Mezer, Eytan Z. Blumenthal. Resources: Adir Sommer, Efrat Naaman, Jessica Lelonek
Declaration of conflicting interests
The authors declared no potential conflicts of interest with respect to the research, authorship, and/or publication of this article.
Funding
The authors received no financial support for the research, authorship, and/or publication of this article.
Ethics approval
This study was performed in line with the principles of the Declaration of Helsinki. Approval granted by the Ethics Committee of RHCC (May 24, 2023, RMB-0111-21).
Financial disclosure
The authors have neither proprietary nor commercial interests in any medications or materials discussed in this study
Supplemental material
Supplemental material for this article is available online.
References
Supplementary Material
Please find the following supplemental material available below.
For Open Access articles published under a Creative Commons License, all supplemental material carries the same license as the article it is associated with.
For non-Open Access articles published, all supplemental material carries a non-exclusive license, and permission requests for re-use of supplemental material or any part of supplemental material shall be sent directly to the copyright owner as specified in the copyright notice associated with the article.