
Abstract
Diabetic macular edema (DME) is one of the leading causes of visual impairment in patients with diabetes. Multimodal imaging (MMI) has allowed a shift from DME diagnosis to prognosis. Although there are no accepted guidelines, MMI may also lead to treatment customization. Several study groups have tried to identify structural biomarkers that can predict treatment response and long-term visual prognosis. The purpose of this editorial is to review currently proposed optical coherence tomography (OCT) and optical coherence tomography angiography (OCT-A) biomarkers.
Keywords
In 2019, the International Diabetes Federation estimated that 240 million people had diabetes (accounting for a global prevalence of 9.6%). This number is expected to rise to 356 million by 2045, reaching a global prevalence of 11.1%. 1 Diabetic retinopathy (DR) and diabetic macular edema (DME) are severe microvascular complications of diabetes and are among the leading causes of blindness in the working-age population. 2
The pathogenesis of DME is multifactorial and includes disruption of the blood-retinal barrier, local inflammation, and neurodegeneration. 3 Anti-VEGF agent injections are the first-line treatment for DME with central macular involvement and vision loss 4 but one-third of DME patients have suboptimal response to anti-VEGF treatments. In these cases, alternative treatments could be more efficacious. 5 Among these, intravitreal steroidal implants, tackling local inflammation, are the preferred second-line choice.
DME patients are heterogeneous in demographics, clinical presentation, natural history, and treatment response. Multimodal imaging (MMI) may help identify predictive features of visual and anatomic prognosis. Hence, a fervent branch of research has been devoted to identifying structural biomarkers that could predict treatment response and long-term visual outcomes. This editorial summarizes the main MMI biomarkers in DME, providing an updated review of their significance and interpretation based on the most recent literature (up to February 2023).
Fluorescein angiography (FA) has played a pivotal role in DME evaluation for years; FA evaluates macular perfusion and capillary dropout. Diabetic macular ischemia (DMI) is characterized by an enlargement of the foveal avascular zone (FAZ), and capillary loss in noncontiguous areas of the macula. DMI can occur regardless of the presence of macular fluid, and it is an independent cause of vision loss and poor treatment outcomes.6,7,8 The Early Treatment Diabetic Retinopathy Study (ETDRS) report n.11 first described a DMI severity stage, based on capillary loss, FAZ size, and FAZ outline. 9 Since then, DMI has been correlated with DME and DR severity and peripheral non-perfusion. 10
In eyes with DME, FA shows dye leakage due to the blood-retinal barrier impairment and dye pooling into large inner retinal cysts. A quantitative measure of macular leakage has been proposed as a biomarker of DME severity, and it has been associated with higher central retinal thickness and microaneurysm count. 11
FA has been progressively replaced by less invasive, higher-resolution imaging techniques, such as spectral-domain optical coherence tomography (OCT) and OCT angiography (OCT-A). SD-OCT provides high-resolution retinal structural images. Disruption of external (i.e., the ellipsoid zone (EZ) and the external limiting membrane (ELM)) or the inner retinal layers (i.e., disorganization of the inner retinal layers (DRIL)), presence of subretinal fluid, and vitreoretinal interface abnormalities have been associated with worse vision and poorer gains after treatment [Figure 1]. 12 Hyperreflective spots (HRS), defined as <30 µm-diameter solitary spots without back-shadowing, and reflectivity similar to that of retinal nerve fiber layer, have been interpreted as activated microglia cells and may represent a biomarker of local inflammation. Foveal eversion is another OCT biomarker possibly associated with persistent and recurrence of DME. 13 In 2020, the European School for Advanced Studies in Ophthalmology (ESASO) proposed a comprehensive classification of DME into three categories: early DME, advanced DME, and severe DME, differing in macular thickening and retinal layers integrity. The ESASO classification also included diabetic macular atrophy, which refers to an end-stage disease with an abnormally thin retina and diffuse neuronal loss. 14 Early DME is a poor prognostic factor after cataract surgery, and close pre- and postoperative monitoring has been advocated in eyes with early DME. 15 Finally, OCT allows quantitative measurements of the choroid. Diabetic eyes have choroidal depletion that matches DR severity; moreover, eyes with DME tend to have a higher lumen-to-stroma ratio in the macula than eyes without DME. 16
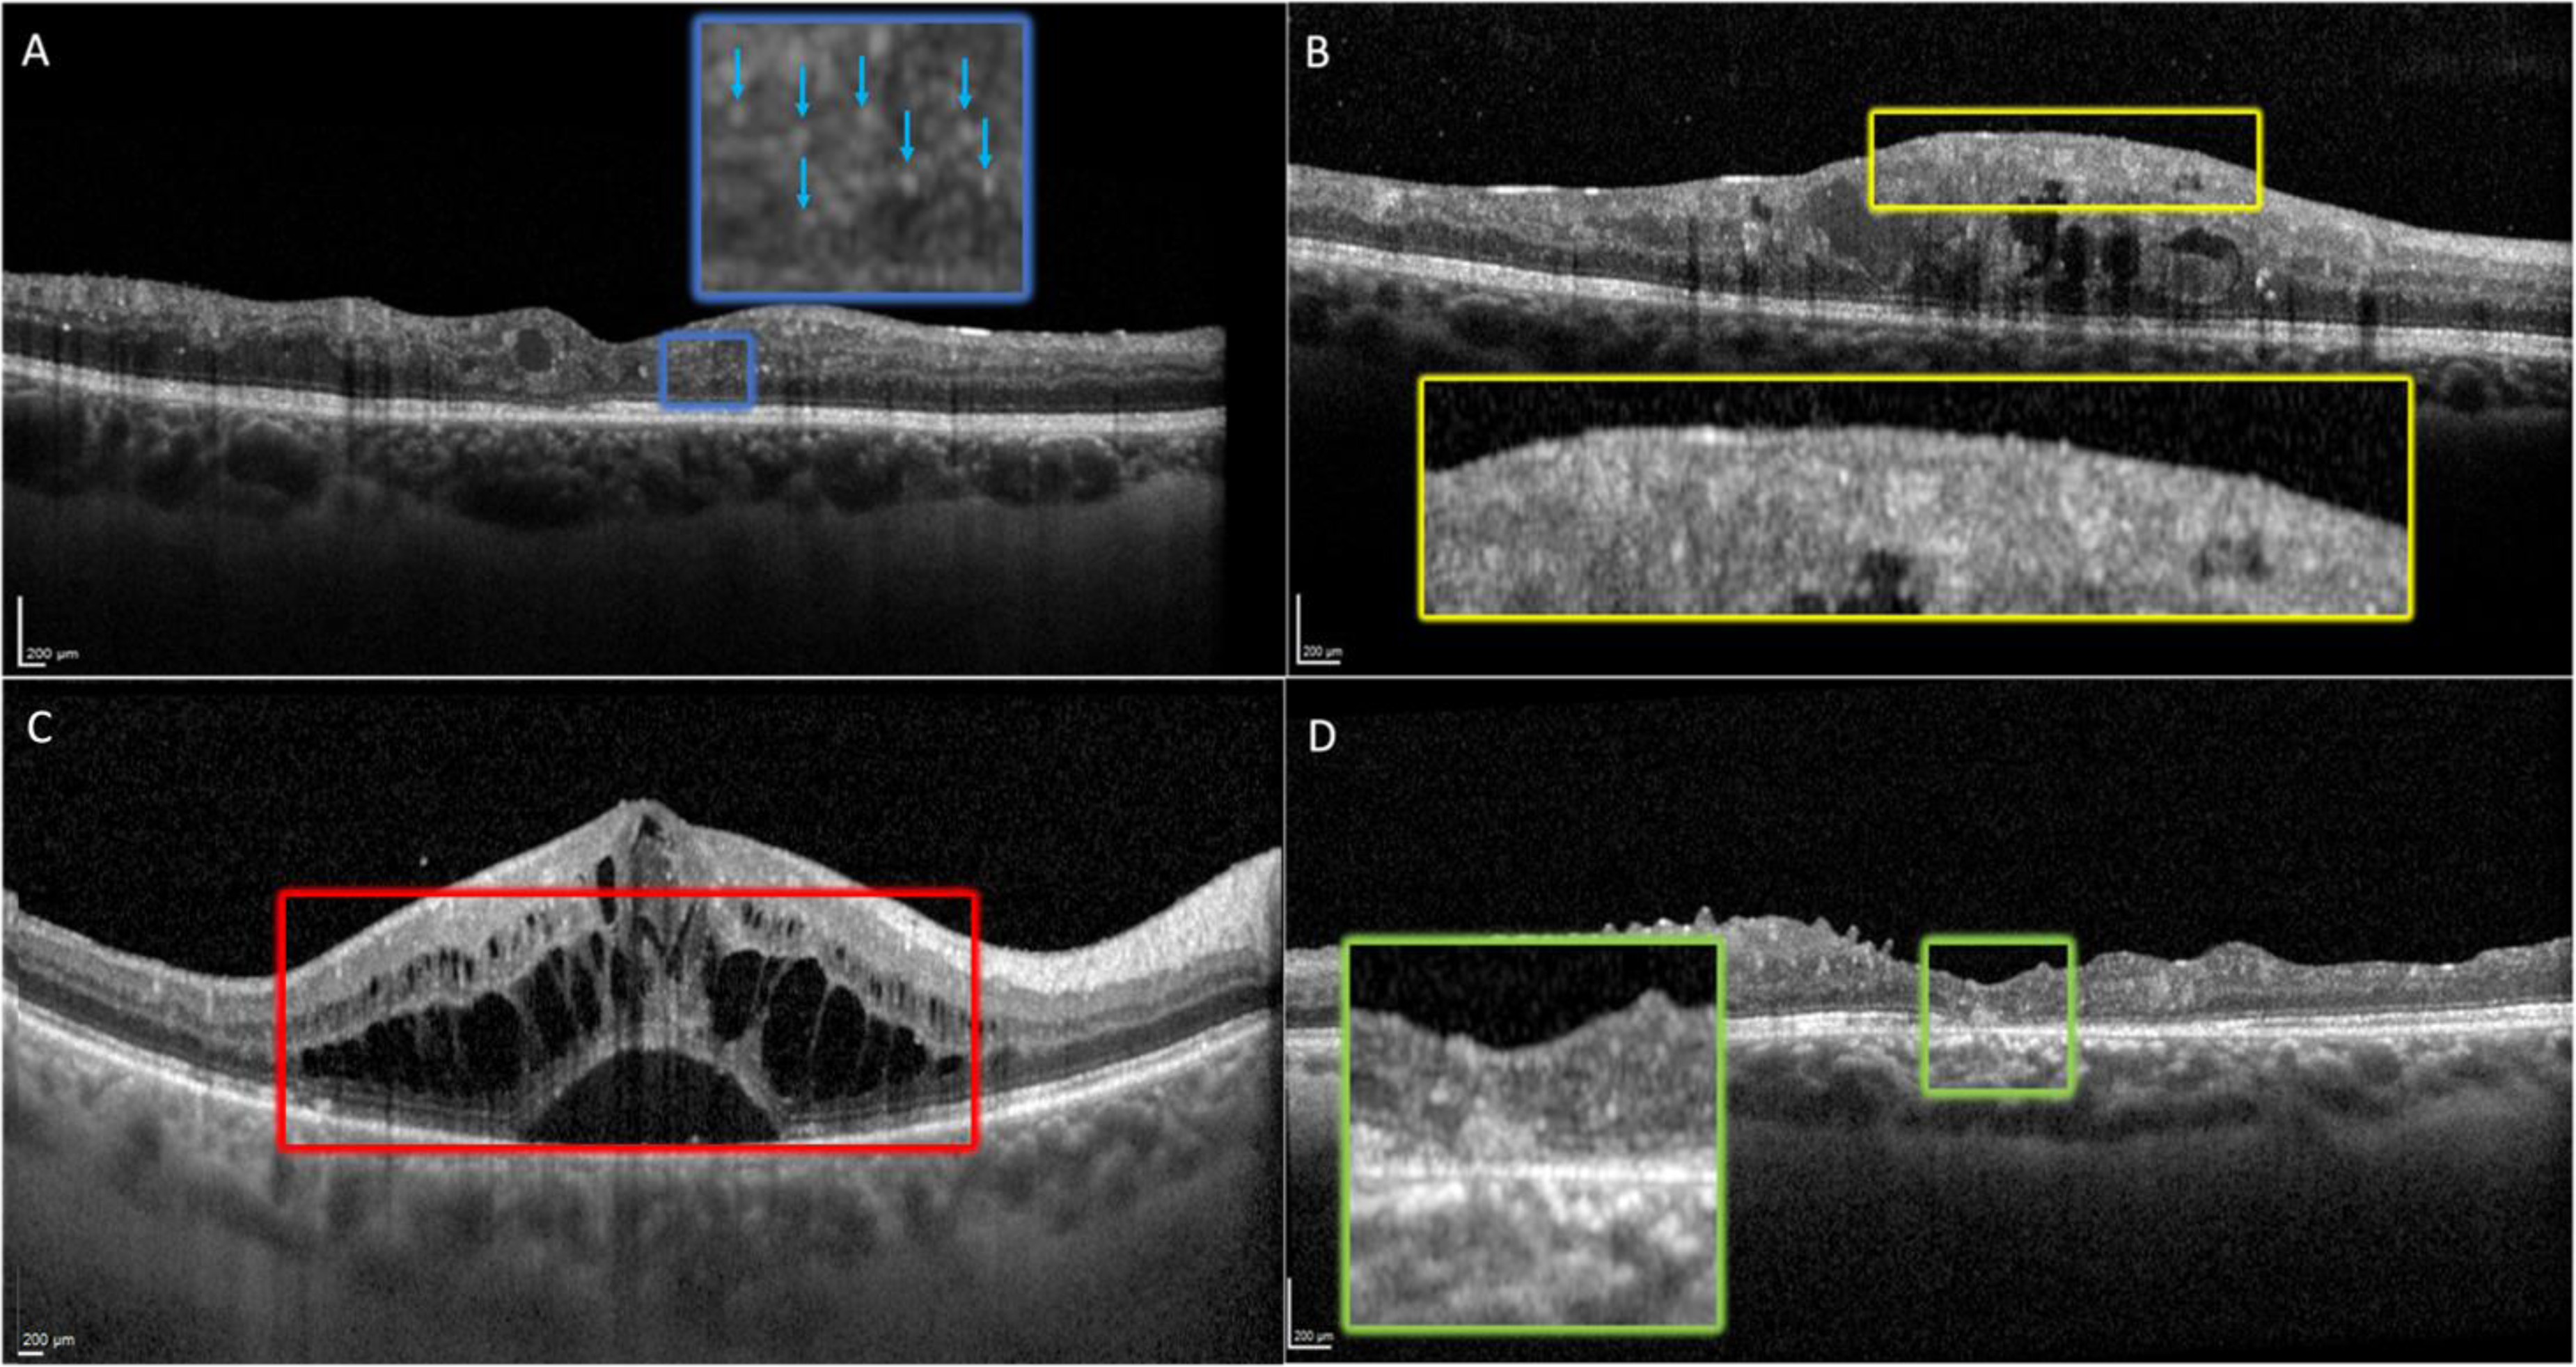
OCT of diabetic patients with different stages of diabetic macular edema. A) The box shows the presence of hyperreflective spots (HRS) without a posterior shadow cone. B) The box depicts disorganization of the inner retinal layers (DRIL). C) The box shows intraretinal and subretinal fluid. D) The box shows subfoveal disruption of the ELM and EZ.
OCT-A allows a precise and depth-resolved evaluation of the retinal and choroidal vasculature, as it is not limited by dye leakage [Figure 2]. The study of vascular plexuses is useful for diagnosing DR, predicting DR progression, and forecast its complications. A dropout in capillary perfusion has been observed in all stages of DR, and even in diabetic eyes without retinopathy . A larger FAZ, lower vessel density (VD), and a lower fractal dimension (FD) in the deep capillary plexus (DCP) have been associated with a higher risk of DR progression. Lower VD in the superficial capillary plexus (SCP) has been associated with a higher risk of DME.17,18 Capillary non-perfusion does not change with intravitreal treatment, and it is likely to increase with disease progression. 19 However, macular VD may help predict the efficacy of intravitreal treatment: non-perfusion in the DCP has been associated with poor response to anti-VEGF treatments. 20 Finally, OCT-A can also be applied to the study of microaneurysms (MA). A faster MA turnover correlates with higher ETDRS grading severity of DR and development of DME. 21
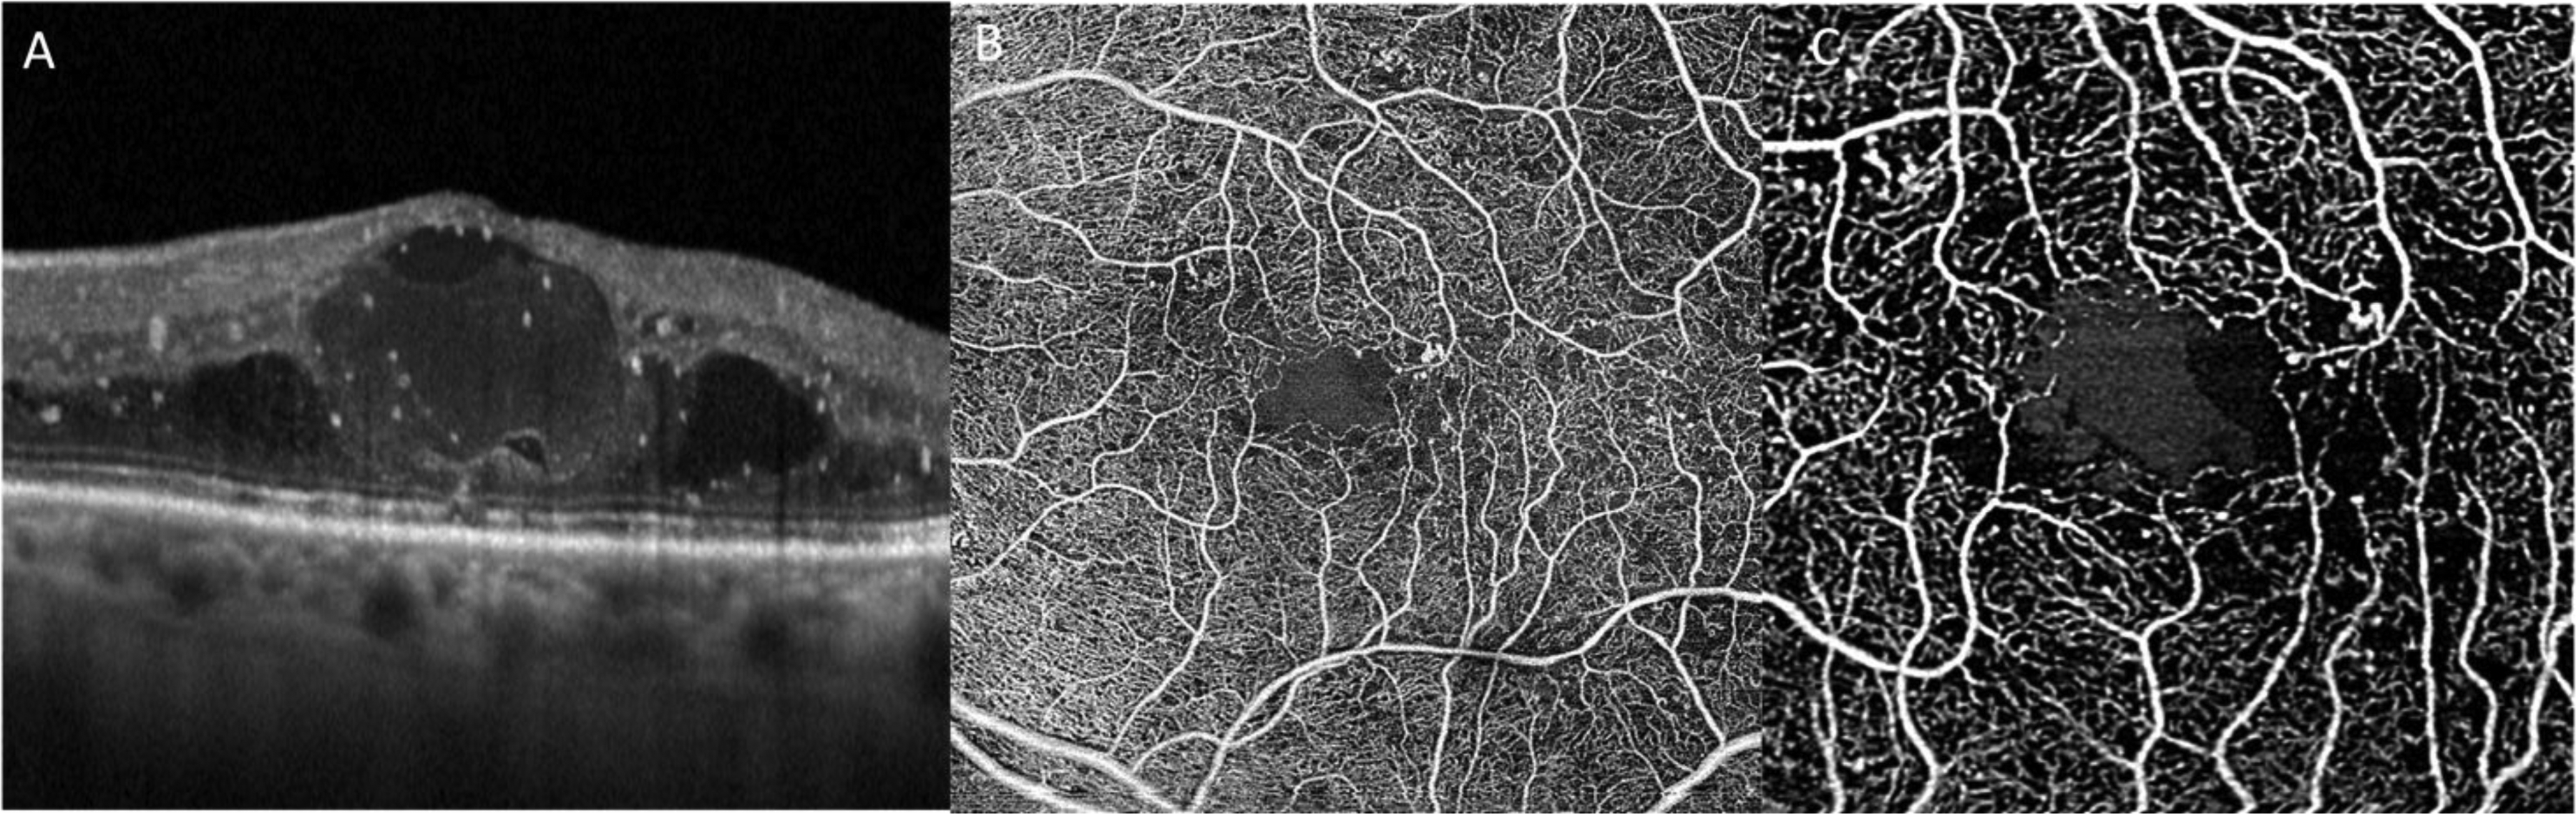
OCT and OCT-A of diabetic patient with diabetic macular edema. OCT shows an increase in central macular thickness (CMT) with intraretinal cysts and hyperreflective spots
Conclusions
The importance of MMI in patients with DME has progressively shifted from diagnosis to prognosis. The identification of biomarkers on MMI helps predicting the visual outcomes before and after DME treatment. However, there are currently no specific therapeutic guidelines based on MMI findings. As novel therapeutic options will soon be available for DME, further research is needed to identify specific imaging signatures of treatment outcomes to different drugs.
Footnotes
Abbreviations
Disclosure
Maria Vittoria Cicinelli and Francesco Bandello confirms they are an associate editor of this journal and was not involved in the peer review process for this paper.
Declaration of conflicting interests
The authors declared no potential conflicts of interest with respect to the research, authorship, and/or publication of this article.
Funding
The authors received no financial support for the research, authorship, and/or publication of this article.