
Abstract
Introduction
Amblyopia is a unilateral diminished vision, rarely bilaterally, caused by early abnormal visual development. The weaker eye is usually directed inward or outward. Amblyopia starts from birth up to the mid-childhood period. It is the primary cause of decreased vision among children. Amblyopia is mainly a cortical action, attributed to differing competing information from both eyes into area 17 in the cortex, although further anatomical and physiological changes were reported in the lateral geniculate nucleus of amblyopic humans. It is predicted to have an impact on 1–3% of the population. Detecting the condition in early childhood is important for successful treatment. 1
The cortical visual evoked potential (VEP) is a widely used technique for evaluating visual pathway integrity. In general, pattern VEP is adopted to detect visual function disabilities such as demyelinating, ischemic, or compressive optic neuropathy, and amblyopia and to objectively assess visual function in children, fake, and conversion disorders. 2
Additionally, psychophysical tests such as the contrast sensitivity test (CST) were found to be helpful in the diagnosis of visual dysfunction; it can provide clues that is not available through routine visual acuity testing. CST refers to the capability to differentiate between light and dim in a set of bands with no definite barrier. 3
CST has special importance in amblyopic patients, as amblyopia's foveal vision is similar to peripheral vision in normal individuals. This implies that excessively large receptor fields (spatial summation) have grown in the foveal visual cortex, which would account for the retention of low spatial frequencies while losing contrast sensitivity at high spatial frequencies. 4
Far as we know, upon reviewing literature, no earlier research has addressed a comparison between the value of PVEP and CST in assessing amblyopic patients who have started patching therapy for varying durations.
Subjects and methods
This cross-sectional study was conducted on 50 unilateral amblyopic patients and 50 age and sex matched healthy controls, corresponding to 100 eyes in the patient group and 100 eyes in the control group. The study was performed at the Clinical Neurophysiology Unit of Kasr Al Aini Hospitals from March 2020 to July 2021. Patients aged from 4 to 12 years were recruited from the pediatric ophthalmology outpatient clinic of Pediatric Hospital-Cairo University.
Two types of amblyopia were selected (50% of patients had amblyopia due to strabismus and 50% were anisometropic). All patients underwent patching therapy in the non-amblyopic eyes for variable durations (6 months to 12 months). Patients with mental retardation, chronic systemic diseases, or vision deprivation amblyopia (amblyopia due to physical obstruction) were excluded from the study.
Informed consent was taken from all of the guardians of the children who participated in the study, and the study was approved by the Ethics Committee of Cairo University.
All participants underwent ophthalmological examination and electrophysiological assessment. Fundus examination and visual acuity assessment were conducted by a single experienced pediatric ophthalmologist. In the Clinical Neurophysiology Unit of Kasr El-Ainy Hospital, contrast sensitivity tests and pattern-reversal visual evoked potentials were carried out using the Metrovision Scan Version 8000F (Metrovision, France) (Cairo University).
The International Society for Clinical Electrophysiology of Vision (ISCEV) Standards for standard pattern reversal VEP were used (latest update, 2016). A white and black checkerboard with two different-sized check elements (60° and 15°) served as the stimulus, with the fixation point in the middle of the screen. Between the center and the periphery of the field, the brightness and contrast of the stimulus were maintained constant and consistent throughout the test. The signals were band-pass filtered and amplified at a gain of 5 volts (1–100 Hz). According to the worldwide 10–20 electrode placement scheme, the recording electrodes were positioned on Oz, the reference electrode on Fz, and the ground electrode on Cz. There were no mydriatic or miotic medications used. Standard monocular stimulation involved covering the unstimulated eye with an opaque, light-tight patch. The difference between the N75 peak and P100 peak was expressed in microvolts. Latency was calculated in milliseconds, with the calculation of inter-side latency and amplitude difference, considering a latency of P100 more than 120 ms to be abnormal. 5
Regarding the CST, it employs monocular stimulation (a stimulated field of 10 degrees horizontally and 7.5 degrees vertically) with vertical sine-wave gratings at various spatial frequencies (15.1 cpd, 7.6 cpd, 3.6 cpd, 2.4 cpd, 1.2 cpd, and 0.55 cpd). The device displays stimuli at an average luminance of 50 cd/m2 with increasing contrast, and the patient was requested to push a button to terminate the process once they could distinguish the gratings from a plain screen while seated 200 cm away from the screen. The tool provides us with a graphic of the contrast sensitivity curve at the conclusion of the operation. The resulting contrast sensitivity curve was shown as a graph in green, connecting the average estimation of contrast sensitivity measurements performed at each spatial frequency. Normal limits were displayed in dark color, corresponding to the average ± 2 standard deviations of a series of measurements performed on a normal population. The minimum and maximum contrast thresholds in dB were registered for each eye. 6
The data was analyzed using MedCalc Statistical software, version 20.211.
When the distribution did not follow normality, by means of the mean, standard deviation, and median with range, quantitative variables were described. In addition to Chi-square, the qualitative data were presented using numbers, percentages. In order to compare the means of more than two separate groups, One-way ANOVA (Analysis of Variance) was used. The Student-Newman-Keuls (SNK) method was applied as a post-hoc test to perform stepwise multiple comparisons in order to identify sample means that were significantly different from one another.
Results
This cross-sectional study was conducted on 200 eyes, divided into three groups
Clinical and demographic data of the study groups.
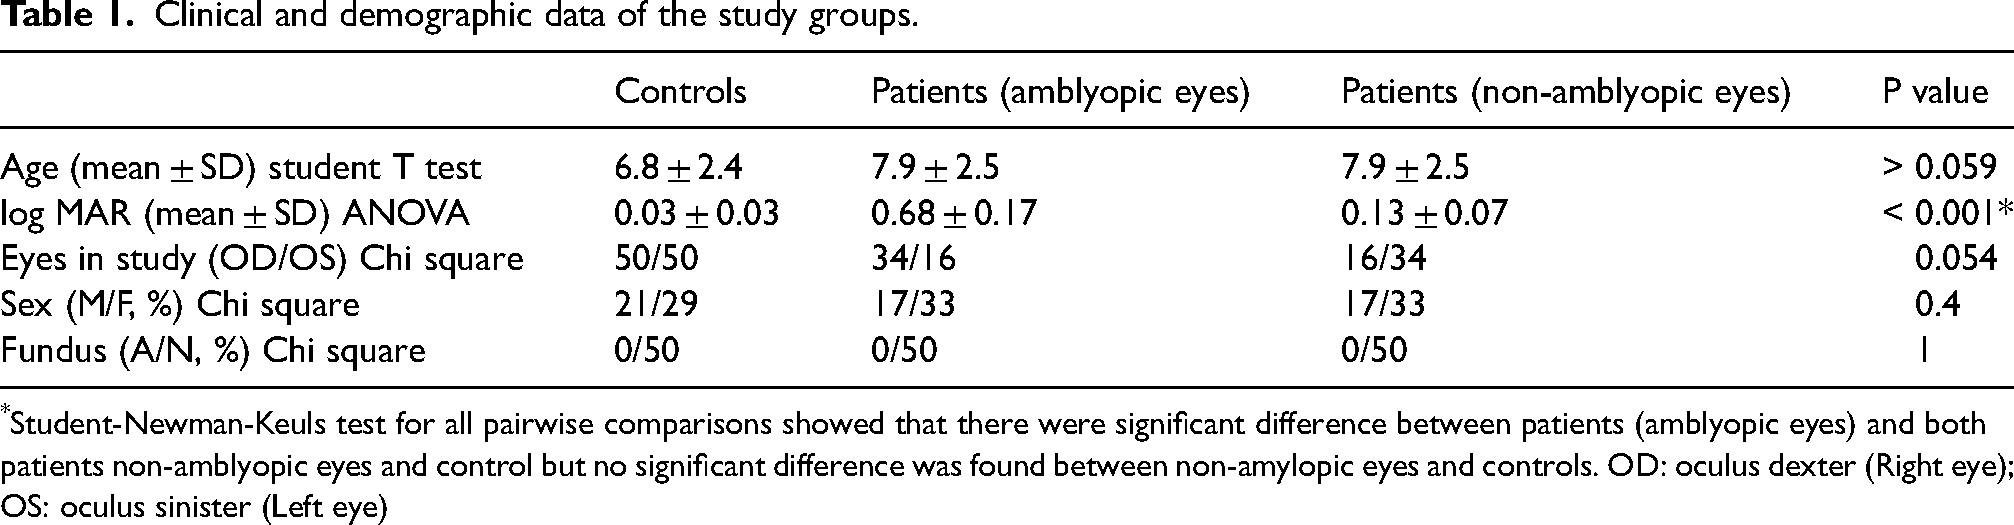
*Student-Newman-Keuls test for all pairwise comparisons showed that there were significant difference between patients (amblyopic eyes) and both patients non-amblyopic eyes and control but no significant difference was found between non-amylopic eyes and controls. OD: oculus dexter (Right eye); OS: oculus sinister (Left eye)
Pattern visual evoked potentials findings
Regarding the qualitative data of PVEP, there was no statistically significant difference in the results of P100 response latencies at either 15° or 60°check sizes in Group 2 compared to Groups 1 and 3, as shown in Table 2.
Qualitative and quantitative data of PVEP and CST.
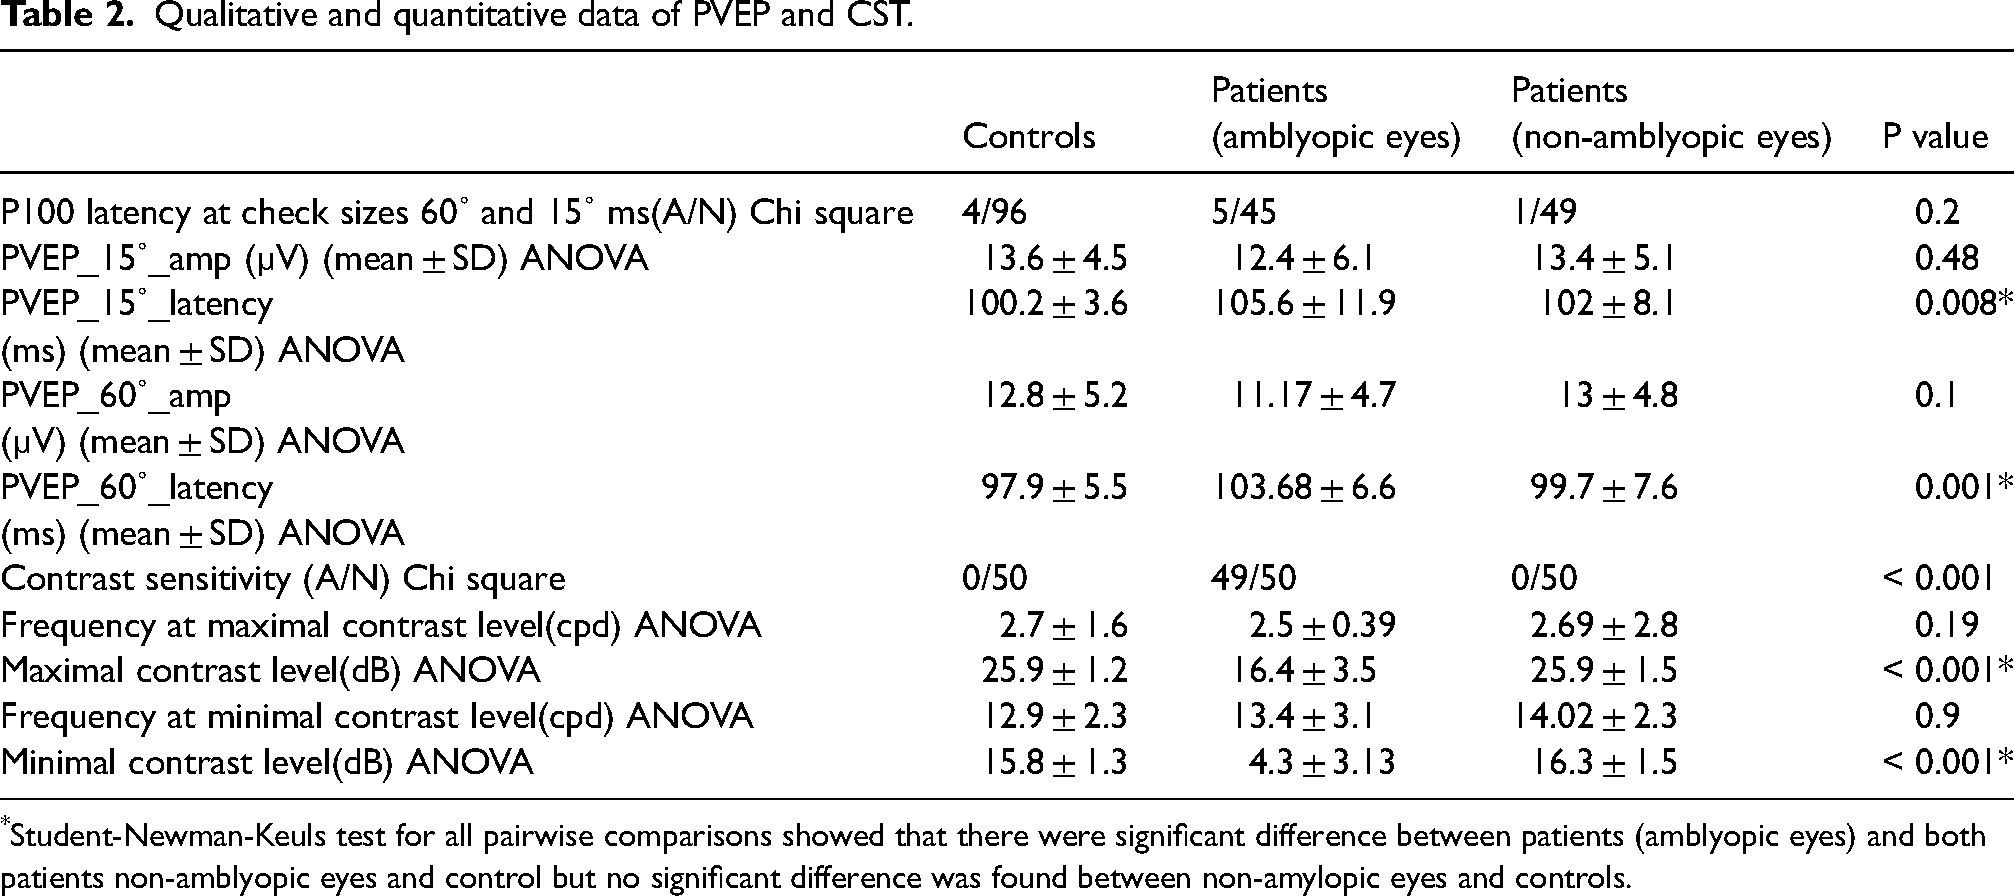
*Student-Newman-Keuls test for all pairwise comparisons showed that there were significant difference between patients (amblyopic eyes) and both patients non-amblyopic eyes and control but no significant difference was found between non-amylopic eyes and controls.
Regarding the quantitative data of PVEP, the mean latency of P100 response at 15° and 60°check sizes in all groups were within the normal range; however, it was significantly larger in Group 2 compared to Groups 1 and 3, while no significant difference was found regarding the amplitude of pattern VEP at either check size between the studied groups. No significant differences were found between Group 3 and the average of right and left eyes in Group 1 regarding latencies and amplitudes of P100 response of PVEP of 15°–60°check sizes (Table 2).
Contrast sensitivity test findings
Regarding the qualitative data of CST, there was a highly statistically significant difference in the results of the contrast sensitivity test, being affected (out of the normal range as shown in Figure 1) in 49 out of 50 of Group 2 (98%), compared to Group 1 (4%) and Group 3 (4%), as shown in Table 2. Qualitatively, the contrast sensitivity test was more suitable in detecting abnormalities in amblyopic eyes compared to pattern VEP latencies, with the difference between both groups being highly statistically significant, as shown in Table 2.
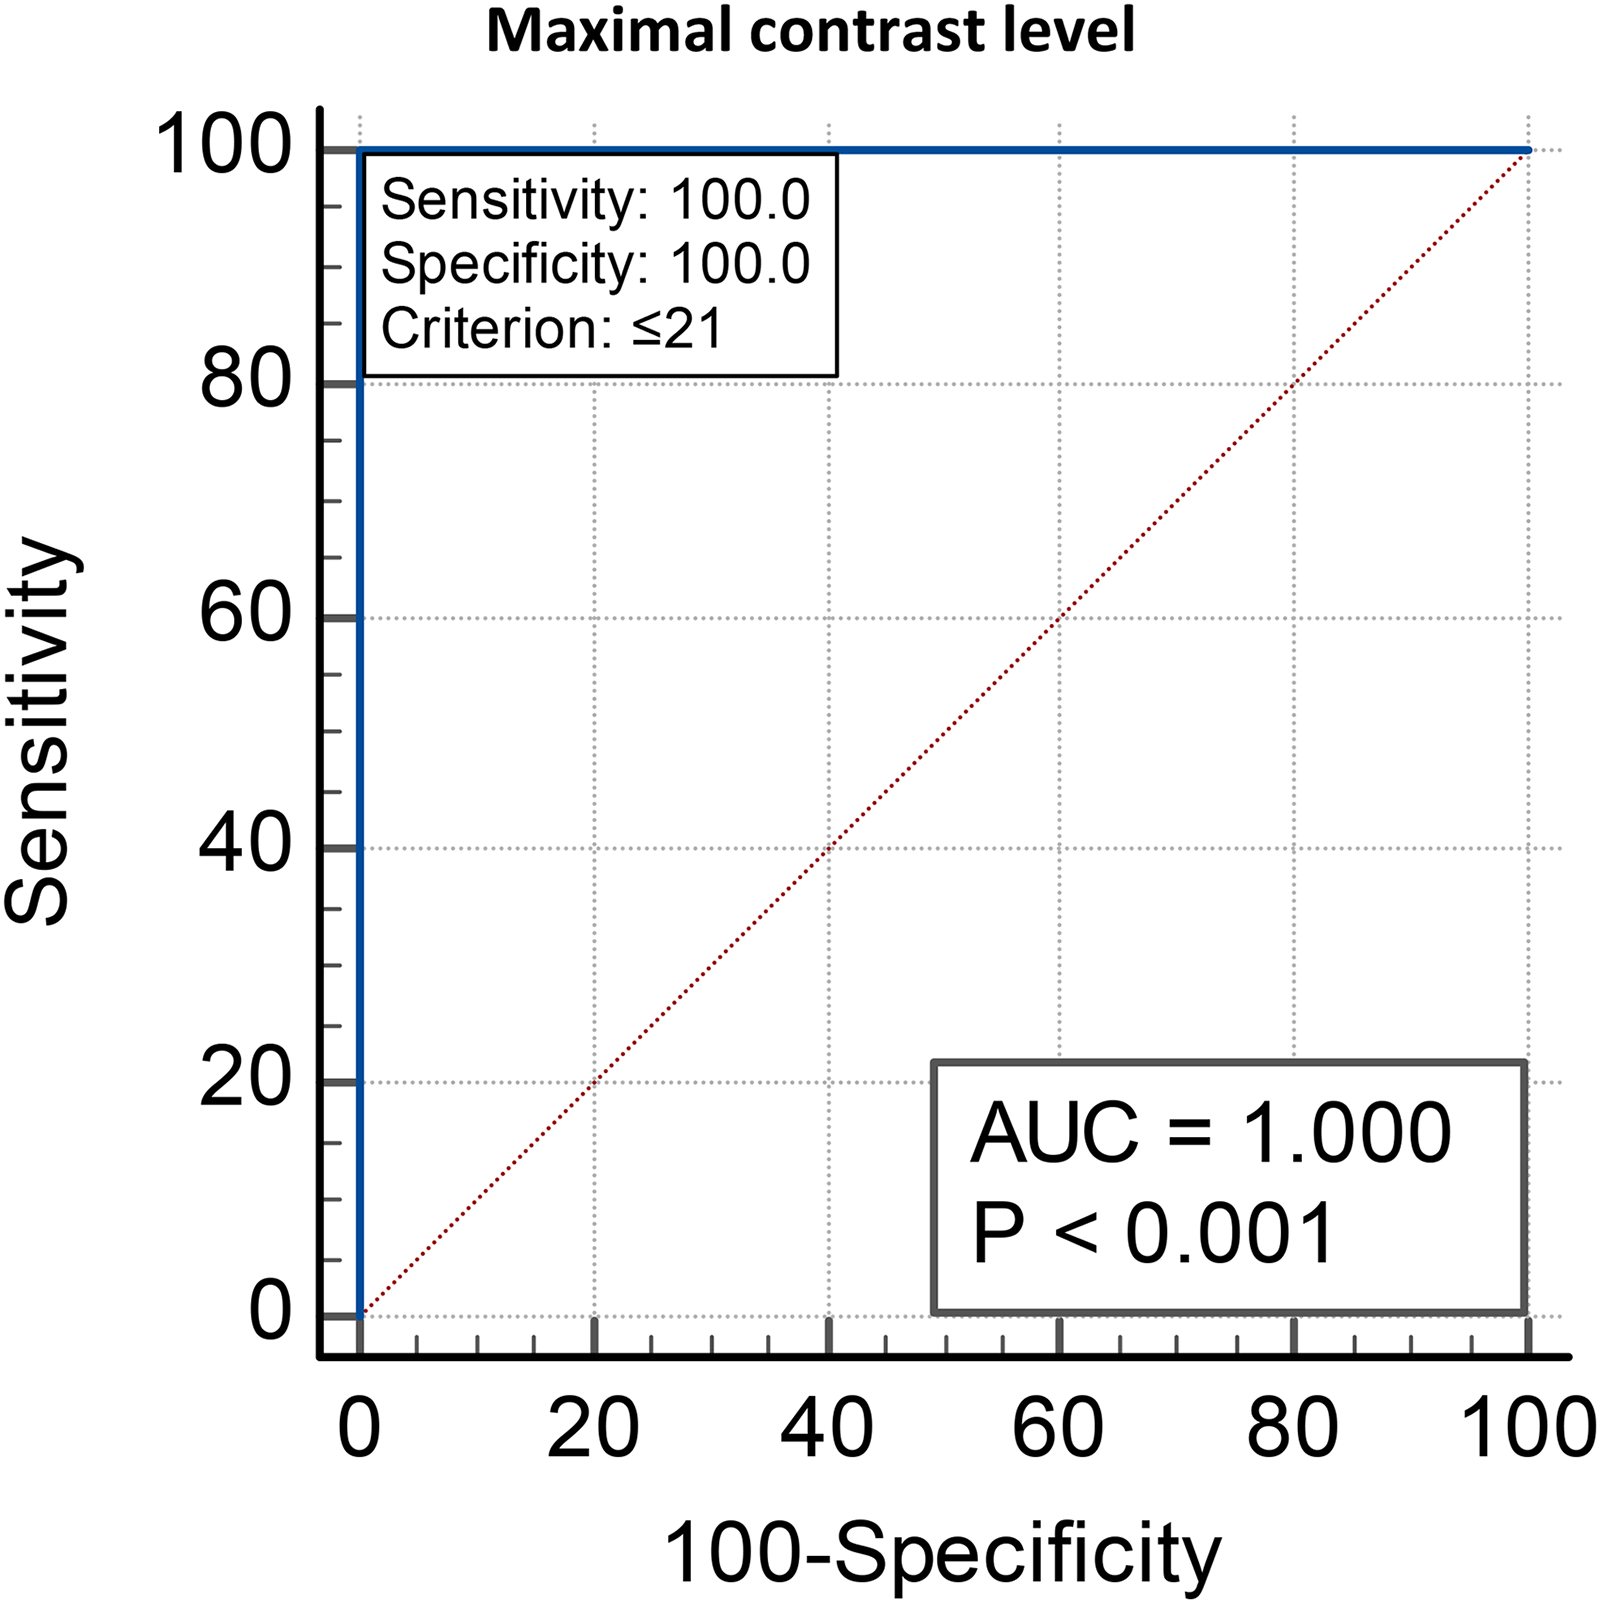
Receiver operating characteristic (ROC) curve showing the cut off value of maximal contrast level at frequencies (1.1–4.1cpd) for differentiation between amblyopic eyes (Group 2) and non-amblyopic eyes (Groups 1 and 3).
Regarding the quantitative data of CST, maximal and minimal contrast levels were significantly higher in Groups 1 and 3 compared to Group 2. This means that the non-amblyopic and control eyes had better vision in low contrast levels than the amblyopic eyes. No significant differences were found regarding frequencies at maximal and minimal contrast levels between the studied groups, or between Groups 1 and 3 (Table 2).
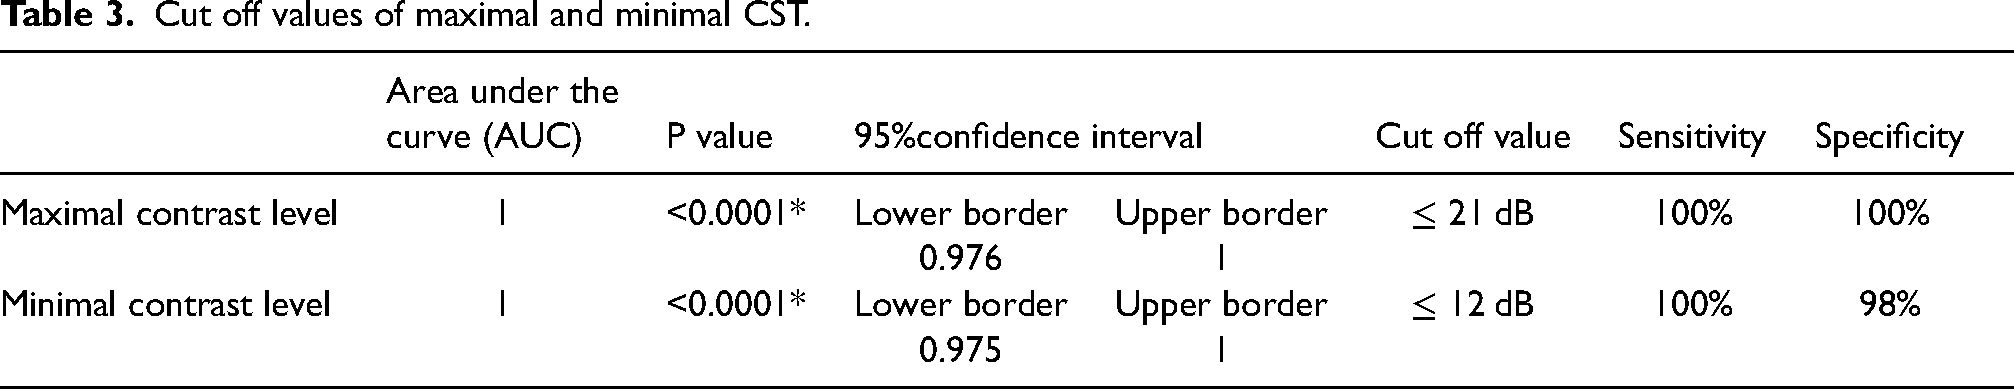
The cutoff value of maximal contrast level at mean frequencies of 2.5 ± 0.9 cpd, and a range of 1.1–4.1 cpd, for differentiation between amblyopic eyes (Group 2) and non-amblyopic eyes (Groups 1 and 3) is ≤ 21 dB. The cutoff value of minimal contrast level at mean frequencies of 13.4 ± 2.6 cpd, and a range of 6.7–18 cpd, for differentiation between amblyopic eyes and non-amblyopic eyes (unaffected eyes of patients and control eyes) is ≤ 12 dB (Table 3, Figure 1,2).
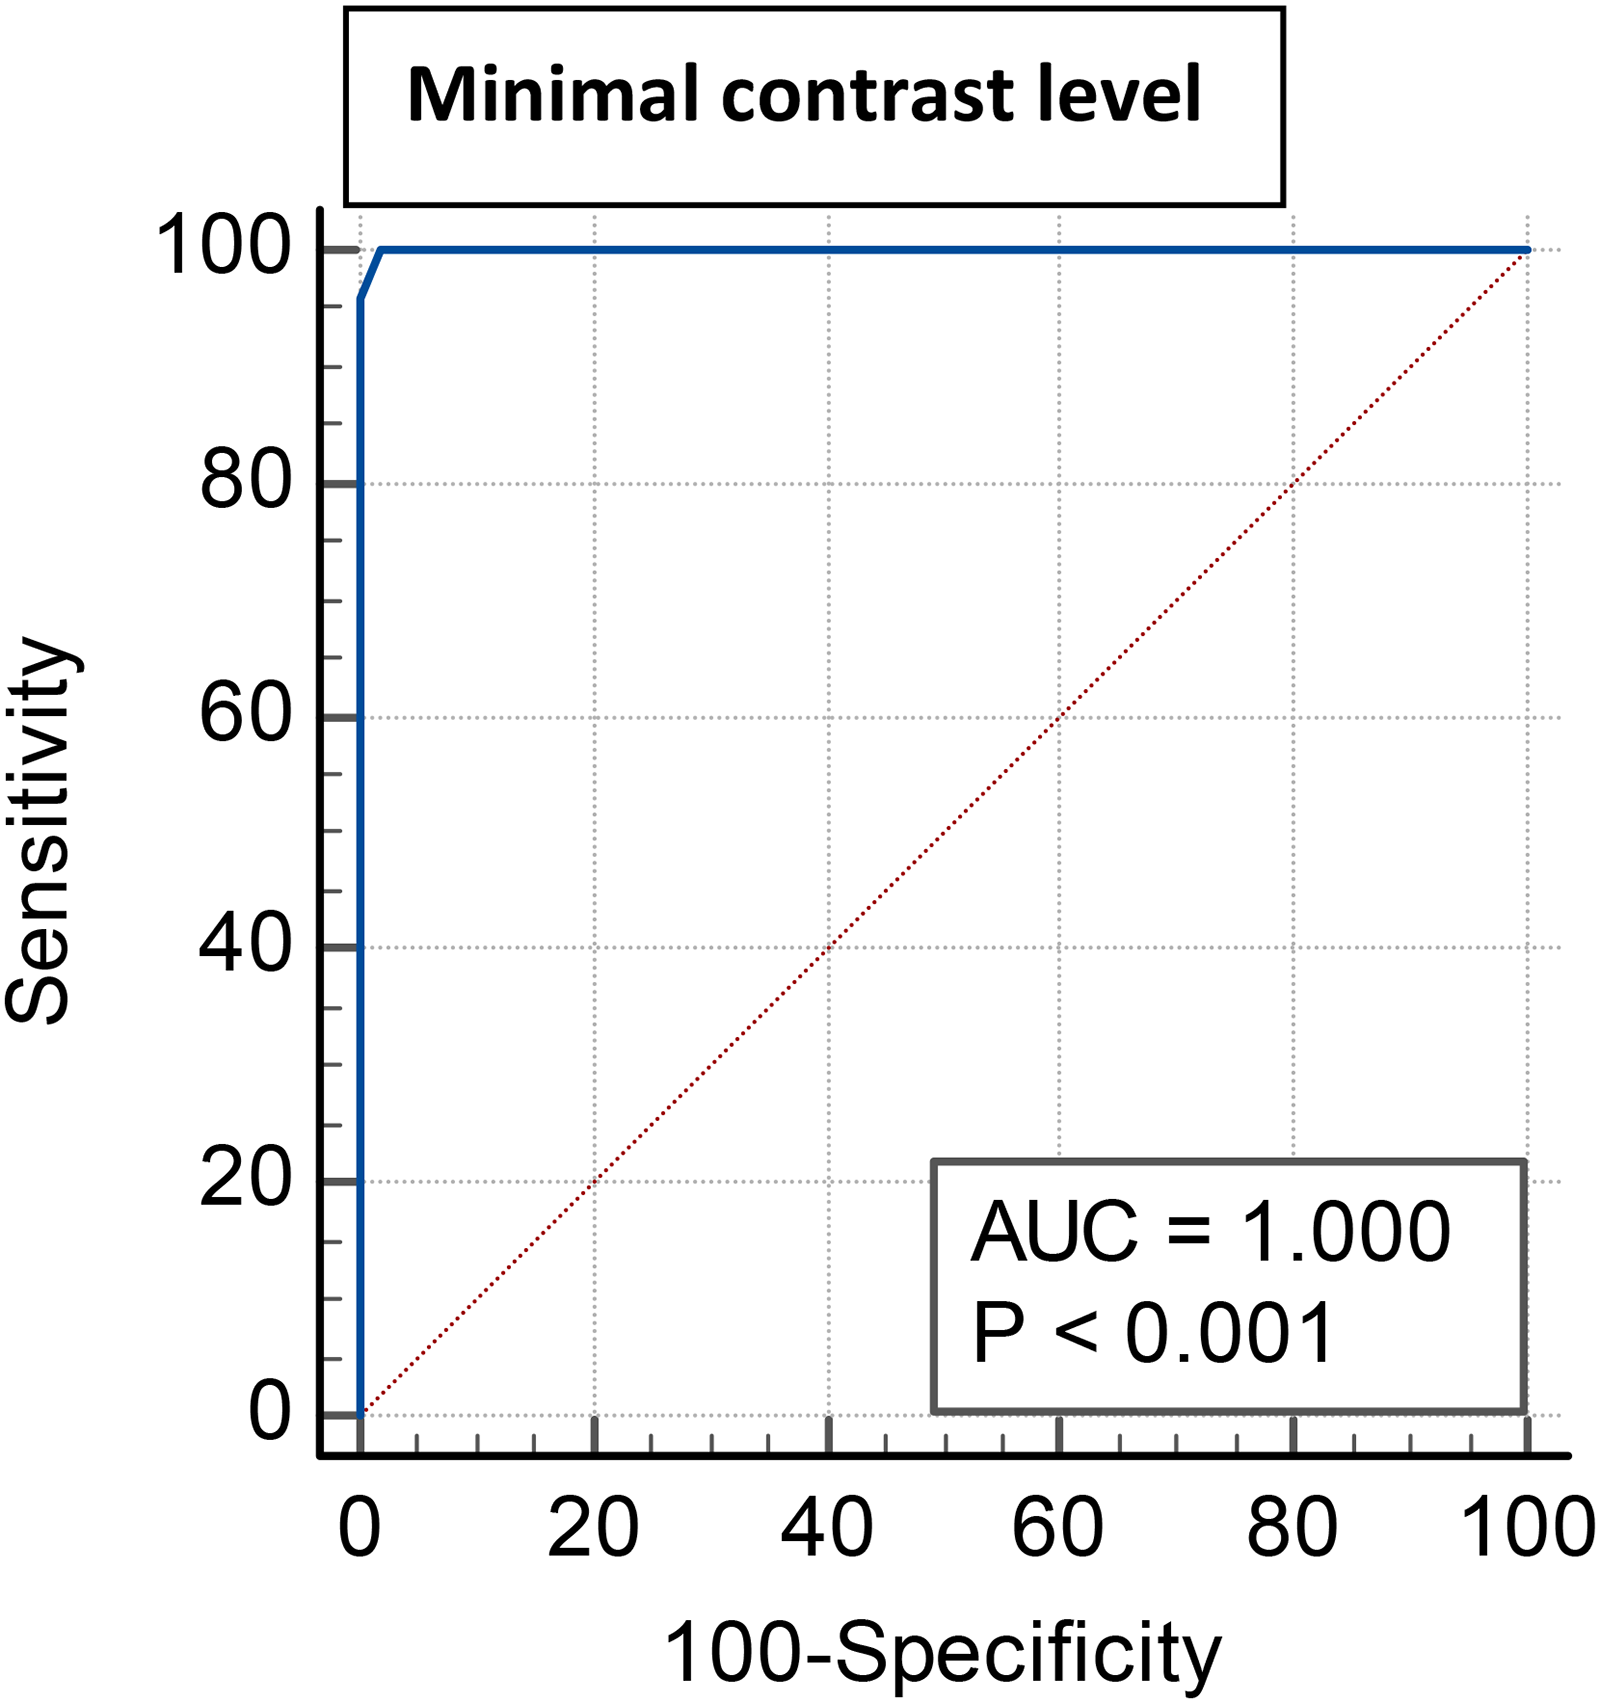
Receiver operating characteristic (ROC) curve showing the cut off value of minimal contrast level at frequencies (6.7 – 18cpd) for differentiation between amblyopic eyes (Group 2) and non-amblyopic eyes (groups 1 and 3).
Cut off values of maximal and minimal CST.
Discussion
When an amblyogenic factor affects the visual system of a developing child, it reduces its natural development, resulting in amblyopia. 7 It has an impact on visual field, contrast sensitivity, and stereo-acuity. 8 This study was conducted to determine which is the most appropriate tool for detecting amblyopia in children who underwent patching therapy with variable compliance and duration (the mean duration of patching was 2 to 6 h per day for approximately 6 months to 1 year).
The diagnosis of amblyopia can be made using electrophysiological or psychophysical techniques based on the patient's reactions to stimuli or with diminished contrast. A decrease in amplitude and an increase in latency of the P100 wave are the most commonly reported findings among authors who have researched the visual evoked potentials in amblyopia. 9
In the current study, the mean P100 latencies of PVEP in amblyopic eyes (Group 2) were statistically longer at check sizes 15° and 60°compared to the control eyes (Group 1) and non-amblyopic eyes (Group 3). Many authors found that P100 latency in amblyopic eyes was significantly delayed compared to the control group.10,11 Other authors stated that amblyopic eyes showed a significant delay in P100 latency of PVEP in comparison to the non-amblyopic and control eyes, which may be related to prolonged conduction between the retina and cortex.12,13 The same was found by Azmy and Zedan (2016) who reported such significant delay in P100 latency of PVEP of amblyopic eyes when compared to non-amblyopic eyes in strabismic amblyopia. 14
In the present study, the amplitude of the P100 response of the PVEP showed no significant difference between Group 2 and Group 3, either in anisometropic (Group 2A) or strabismic types (Group 2B), which was consistent with Azmy and Zedan (2016) 14 and De Mendonça et al. (2013), 15 who stated that there was no significant difference in the P100 amplitude of the PVEP between both eyes in unilateral strabismus. Additionally, in the present study, there was no statistically significant difference in the P100 latency of the PVEP in Group 2 between Group 2A and Group 2B, which was in agreement with Chung, Hong, Lee, and Han (2008). 16
According to the International Society for Clinical Electrophysiology of Vision (ISCEV), each laboratory can determine its own normal values by utilizing its own stimulus and recording settings.5 Therefore, in our lab, the P100 response of the PVEP was considered abnormal if the latency was more than 120 ms. Accordingly, in the current study, the P100 response latency was delayed (more than 120 ms) in 10% of Group 2 (5 out of 50 eyes).
Azmy and Zedan (2016) stated that there was a statistically significant reduction in the latency of P100 of PVEP after applying occlusion therapy in strabismic amblyopia. 14 However, in the present study, there are no available pre-occlusion values, as participants had already started the occlusion therapy.
Gitanjali, Baig, Ather, and Rao (2017) showed that over the course of occlusion therapy, amblyopic eyes had a decrease in P100 latencies and an increase in N75-P100 amplitude, which were connected to the improvement in visual acuity in amblyopic eyes. 17 Consequently, the PVEP might be seen as a valuable objective method for assessing the success of occlusion treatment in amblyopic eyes.
The sensitivity and specificity of the PVEP's P100 delay in identifying amblyopic eyes were unsatisfactory. The prognosis rather than the diagnosis can be estimated using latency as a metric. 18
Regarding visual acuity, our study yielded a significant negative correlation between visual acuity and P100 amplitude using logMAR in amblyopic eyes, which was consistent with Jeon & Kyung (2012). 19 However, De Mendonça et al. (2013) stated that there was no relation between mean visual acuity and mean P100 amplitude. 15
A crucial and promising criterion in identifying visual impairment is contrast sensitivity. The parvocellular and the magnocellular pathways are the two routes that connect the retina to the brain. The visual cortex (V1) may receive and process information from both. 20 While the magnocellular system is sensitive to low spatial frequencies, the parvocellular system is selectively responsive to moderate to high spatial frequencies. 21 The magnocellular circuit is primarily responsible for mediating the perception of low contrast stimuli. Loss of contrast sensitivity is probably caused by a magno-system flaw. 22
One of the primary effects of amblyopia is a decrease in contrast sensitivity, which is especially pronounced in anisometropic amblyopia.23,24,25,26
The results of the contrast sensitivity test are displayed graphically with the frequency in Hertz (Hz) on the x-axis and the contrast level in decibels on the y-axis (dB). We found that the maximal and minimal contrast levels were significantly lower in group 2 compared to groups 1 and 3, with no significant difference regarding the spatial frequencies.
On this subject, the literature produces inconsistent findings. According to certain research, amblyopia's contrast sensitivity levels are normal or almost normal at low spatial frequencies, while they are reduced at high spatial frequencies.27,28,29,30,31 However, some contrast sensitivity studies only found deficiencies in amblyopes at high spatial frequencies, while others found losses across the board.32,33
Comparing the companion eyes of amblyopes to healthy, age-matched controls, other investigations discovered that they had normal values at all spatial frequencies.34,35 Additionally, Maehara et al. (2011) observed that normal eyes were typically normal but amblyopic eyes had lower contrast sensitivity. 36
Five clinically treated amblyopes with a mean age of 10.6 years were the subject of a study by
In the current study, the cut-off value of maximal contrast level at range frequencies of (1.1–4.1 cpd) for differentiation between Group 2 with both Groups 1 and 3 was ≤21 dB, which is highly sensitive in detection of amblyopia. Additionally, we found that the cut-off value of minimal contrast level at range frequencies of (6.7–18 cpd) for differentiation between Group 2 with both Groups 1 and 3 was ≤12 dB, which is highly sensitive for amblyopia.
Far as we know, no studies have calculated cut-off values of contrast sensitivity in amblyopic eyes.
In conclusion, the contrast sensitivity test is considered a promising non-invasive psychophysical tool in detecting amblyopia in children who have undergone occlusion therapy for a variable duration, together with PVEP which is more related to the prognostic value.
Footnotes
Declaration of conflicting interests
The author(s) declared no potential conflicts of interest with respect to the research, authorship, and/or publication of this article.
Funding
The author(s) did not receive financial support for this article's research, authorship, and/or publication