
Abstract
Purpose
Visual outcome in patients with neovascular age-related macular degeneration is variable. We aimed to evaluate for association between socioeconomic status visual acuity in neovascular age-related macular degeneration.
Methods
A retrospective single-center study of a consecutive group of neovascular age-related macular degeneration patients was performed. Socioeconomic status was determined for each patient based on the 2008 Israeli census. Medical information was extracted from medical records and included visual acuity and optical coherence tomography parameters. Associations between socioeconomic status and clinical outcomes were analyzed.
Results
A total of 233 patients were included in the analysis. A correlation was found between low baseline visual acuity of the first eye diagnosed with neovascular age-related macular degeneration and low socioeconomic status (r = −0.13, p = 0.049; n = 233). The difference between the visual acuity of the lowest and the highest socioeconomic status categories at baseline was approximately 3 ETDRS lines (p = 0.048). Socioeconomic status and baseline visual acuity of the second eye of the same individual with neovascular age-related macular degeneration were not correlated (r = −0.05, p = 0.95). Socioeconomic status was not associated with the number of anti-vascular endothelial growth factor injections of the first or second eye, or the visual acuity outcome of the first or second eye after 1 year of therapy (p = 0.421, p = 0.9, respectively). Central subfield thickness of the first eye at presentation as measured by spectral-domain optical coherence tomography was associated with socioeconomic status (r = −0.31 p = 0.001).
Conclusion
Individuals of lower socioeconomic status presented at more advanced stage of the disease when developing neovascular age-related macular degeneration in the first eye but not in the second eye. The research underscores the importance of improving referral patterns and awareness for the lowest socioeconomic status classes.
Keywords
Introduction
Variable outcome among different individuals is often evident in patients with neovascular age-related macular degeneration (nvAMD). 1 Identifying the underlying factors that are associated with outcome is important in order to maximize treatment benefits. One potential such factor is the socioeconomic status (SES) of the individual patient. SES may potentially contribute to multiple aspects of treatment outcome, among them time interval from occurrence of symptoms to commencement of treatment, concurrence with treatment, and access to all available therapeutic options. Indeed, SES was shown to be associated with treatment outcome in other disease processes such as glaucoma. 2
Limited data is available with respect to the association of SES and treatment outcome in nvAMD. Previous studies mostly focused on SES and status at presentation with nvAMD and failed to demonstrate connection between SES and visual acuity (VA) at presentation.3,4 However, one study suggested that individuals with age-related eye disease from lower SES are less likely to use eye care services than those with higher SES. 5 To obtain additional insight into the potential role of SES in the treatment outcome, we evaluated for association among SES and visual and anatomical factors, as well as variety of clinical parameters in patients with nvAMD undergoing anti-vascular endothelial growth factor (VEGF) therapy.
Methods
This is a retrospective cohort study. Data were collected from the electronic medical record (EMR) system of the Hadassah medical center, Jerusalem, Israel, on consecutive group of nvAMD patients who were treated with anti-VEGF compounds at the retina clinic between 2006 and 2017. The research followed the tenets of the Declaration of Helsinki and was approved by the local Ethics Committee.
The data that were collected included demographics (age, gender), comorbidities, ocular history, previous treatment for AMD in each eye, and previous eye surgeries, VA (ETDRS), intraocular pressure (IOP), findings in biomicroscopy and ophthalmoscopy. Type and number of injections and OCT (optical coherence tomography) findings were recorded as well.
SES of the patient was determined based on the 2008 Israeli census, published by the Central Bureau of Statistics. 6 The address as provided by the patient and recorded in the EMR was used to fit the economic cluster. Only patients leaving in Jerusalem metropolitan area were added to this analysis.
According to the Israeli census, the socioeconomic level of the population was measured by a combination of 16 characteristics. The data were then stratified into 1616 statistical areas in Israel (most of which representing a small number of nearby streets and several hundreds of houses) using a scale of 1–20, with 1 being the lowest economic cluster and 20 being the highest economic cluster. The economic cluster consisted of (1) demography, including median age, dependency ratio (ratio of persons aged 0–19 and aged 65 and over and persons aged 20–64), and average persons per household; (2) education, including average years in school for persons aged 25–54, percentage of academicians aged 25–54, and percentage of employees in academic occupations or managers; (3) employment and benefits, including percentage of those with income from work aged 15 and above, the percentage of women aged 25–54 who are not in the civilian labor force, the percentage of those with income above two times the average wage, the percentage of those with income below the minimum wage, and the percentage of recipients on income support and income supplement in the elderly, as well as in Holocaust survivors; and (4) standard of living, including average monthly income per person, average number of vehicles used by persons aged 18 and above per household, average number of rooms per capita in household, and percentage of households with a computer and Internet connection. 6
A statistical analysis using SPSS software was performed to identify correlations between the economic cluster and clinical parameters. The analysis was done by considering SES cluster as a continuous variable and also by grouping SES into four categories (category 1 = cluster 1–5, category 2 = cluster 6–10, category 3 = cluster 11–15, category 4 = cluster 16–20). As detailed in the “Results” section, for some of the clinical parameters, analysis was done comparing between the lower cluster (1–5) and the rest (6–20), and by dividing the scale into two parts (1–10 and 11–20).
Power analysis was based on the expected correlation between VA of the first eye with nvAMD at presentation and SES. We assumed that it would be a correlation of at least –0.3, with a two-tailed significance of 0.05 or less and a power of 80%. Under this assumption, a sample size of at least 85 eyes would have been sufficient to prove that a correlation of –0.3 is different from zero.
In order to analyze the associations between two quantitative variables, the Pearson correlation coefficient, as well as the Spearman non-parametric correlation coefficient, was calculated. The comparison of the quantitative variable between two independent groups was carried out using the non-parametric Mann–Whitney test. The comparison of the quantitative variable between three independent groups or more was carried out using the non-parametric Kruskal–Wallis test. Testing change within the study group for a quantitative variable was performed by applying the Wilcoxon non-parametric test. Non-parametric tests were applied as distribution of the data mandate. All statistical tests were two tailed, and a p-value of 0.05 or less was considered significant.
Results
Altogether, 664 nvAMD patients were identified; 53.9% were male and 46.1% were female. Mean age was 77.4 years (SD = 8.7). Complete data which enabled analysis was available on 233 of these patients; 176 of these patients also developed choroidal neovascularization (CNV) in the fellow eye.Twenty-two of the patients belong to classes 1–5, 68 to classes 6–10, 106 to classes 11–15, and 37 to classes 16–20.
Association between VA and SES
When assessing the SES as a continuous variable, there was a weak negative correlation between the VA of the first eye at presentation and SES. A slightly better VA was detected before treatment in patients from higher SES (r = −0.13, p = 0.049; Figure 1(a), Pearson correlation). This finding was also identified when analyzing SES per categories. A lower average VA at presentation was evident in individuals from the lowest SES category (1.0 ± 0.831 logMAR, classes 1–5, n = 22) compared with ones from the highest SES categories (0.67 ± 0.728 logMAR, classes 16–20, n = 37, p = 0.048; Figure 1(b), Mann–Whitney test).
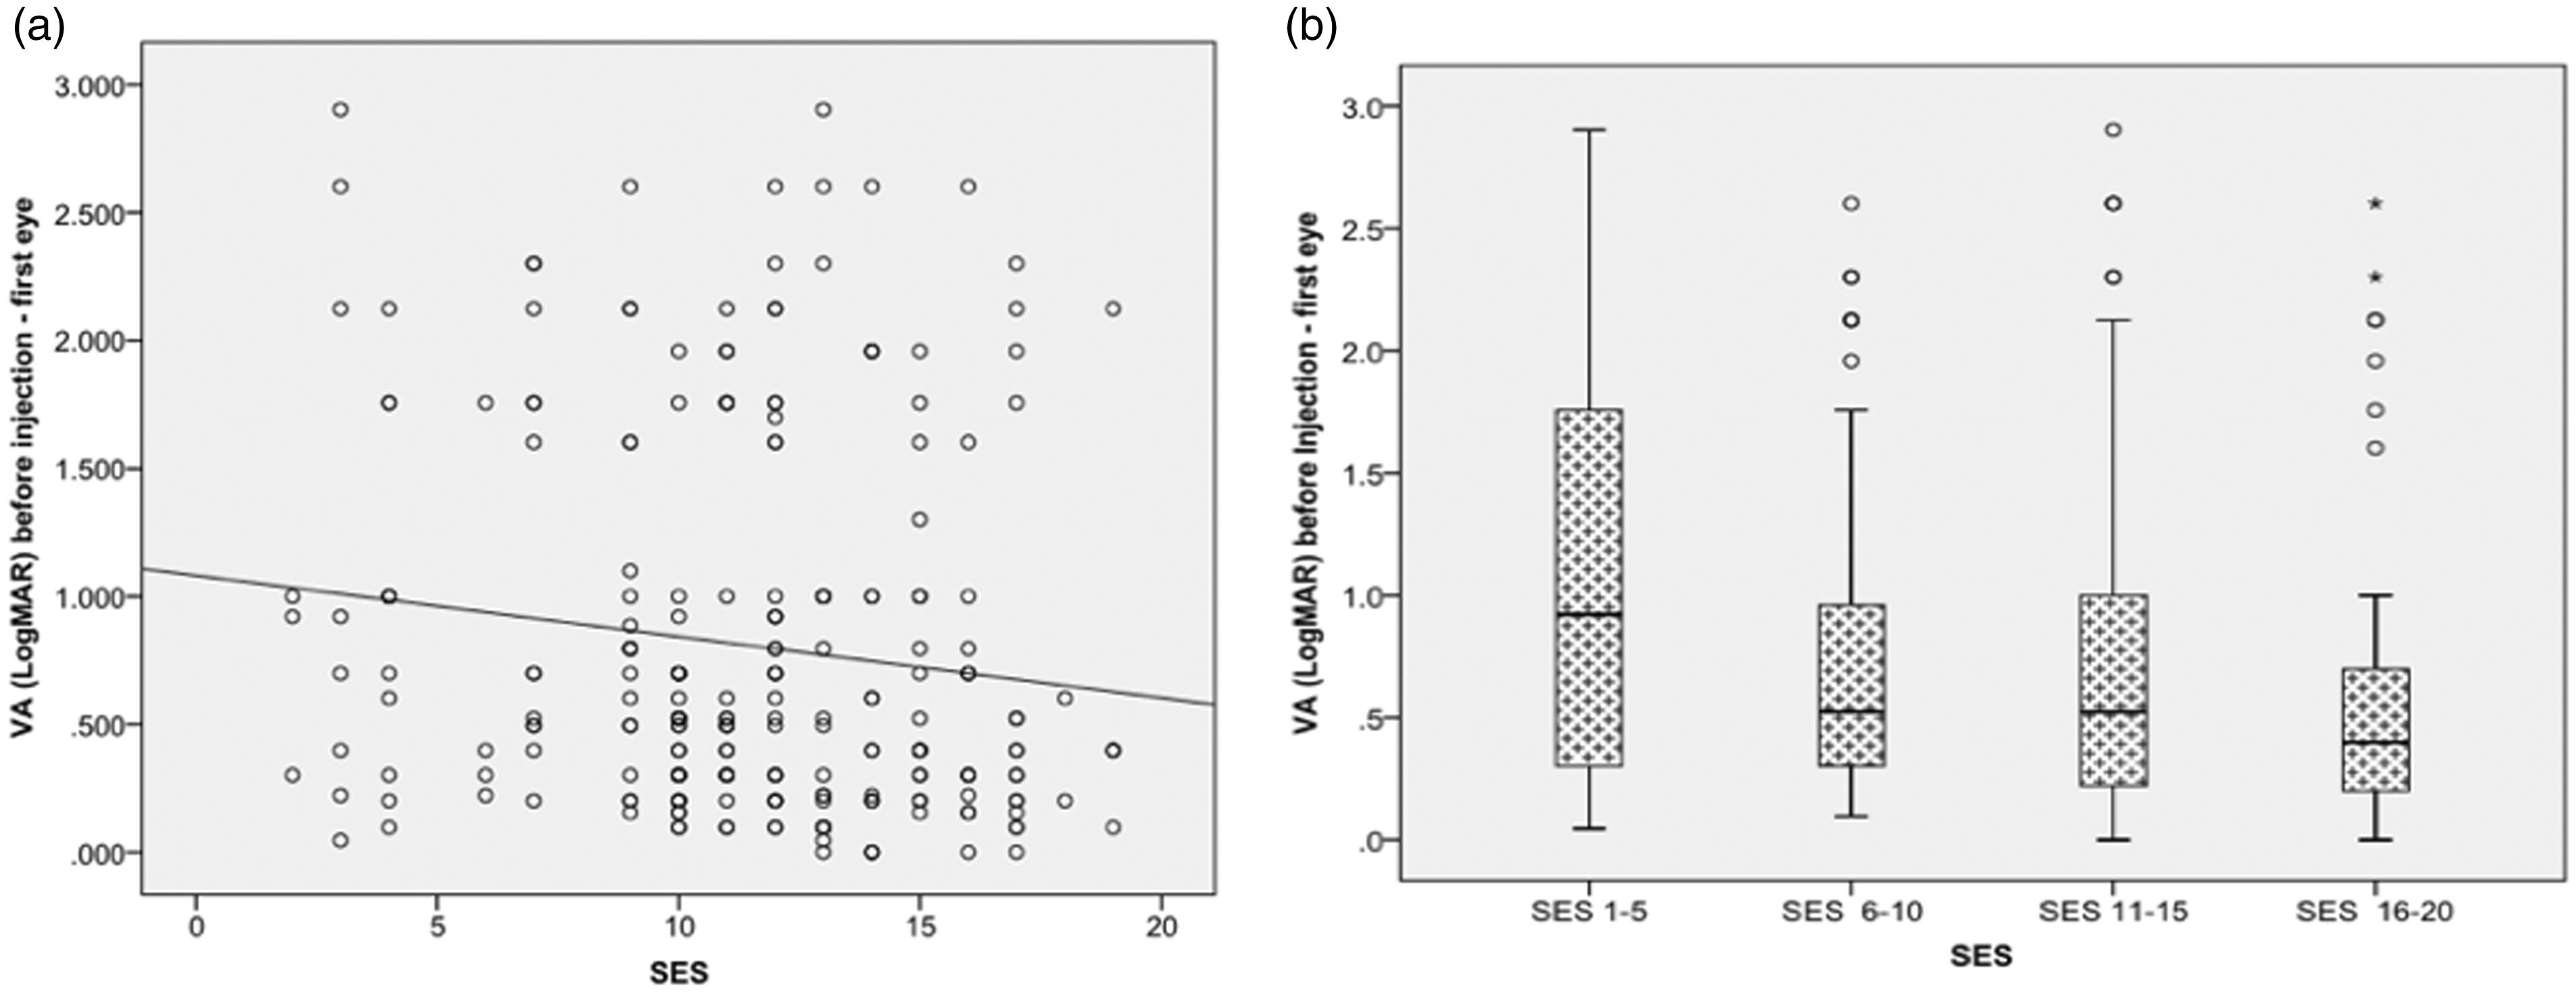
Visual acuity (VA) of the first eye affected by nvAMD at presentation by socioeconomic status. Evaluation of the association of visual acuity at baseline in the first eye affected by nvAMD (n = 233) and SES as a continuous (a) or categorical (b) variable. SES as a continuous variable (x-axis) was plotted versus the VA at baseline (y-axis). A weak negative correlation (r = −0.129, p = 0.049, Pearson Correlation) was detected (a). Panel (b) shows a box-plot where patients were grouped according to the SES into four categories. There was no overall difference in the VA score across the four groups (p = 0.185, Kruskal–Wallis test). Univariate analysis showed that the lowest SES category (n = 22) had lower baseline VA compared with the highest SES category (n = 37) (p = 0.048). SES: socioeconomic status; VA: visual acuity.
Delta VA between the first and second eyes at presentation showed highest difference in individuals of the lowest SES group (p = 0.05, Kruskal–Wallis test). The mean difference between the VA of the first and second eye were 0.93 log MAR for category 1 (classes 1–5), 0.48 for category 2 (classes 6–10), 0.264 for category 3 (classes 11–15), and 0.36 for category 4 (classes 16–20) (Figure 2). This indicates that individuals of lower SES classes tend to present earlier (having better VA) when they develop nvAMD in the second eye compared with the first eye. In accordance with that, at presentation with a new-onset nvAMD in the second eye of the same individual, there was no correlation between the VA of the second eye and SES as a continuous variable, nor when grouping SES into four classes (r = −0.005 p = 0.948, Pearson correlation and p = 0.821, Kruskal–Wallis test, respectively).
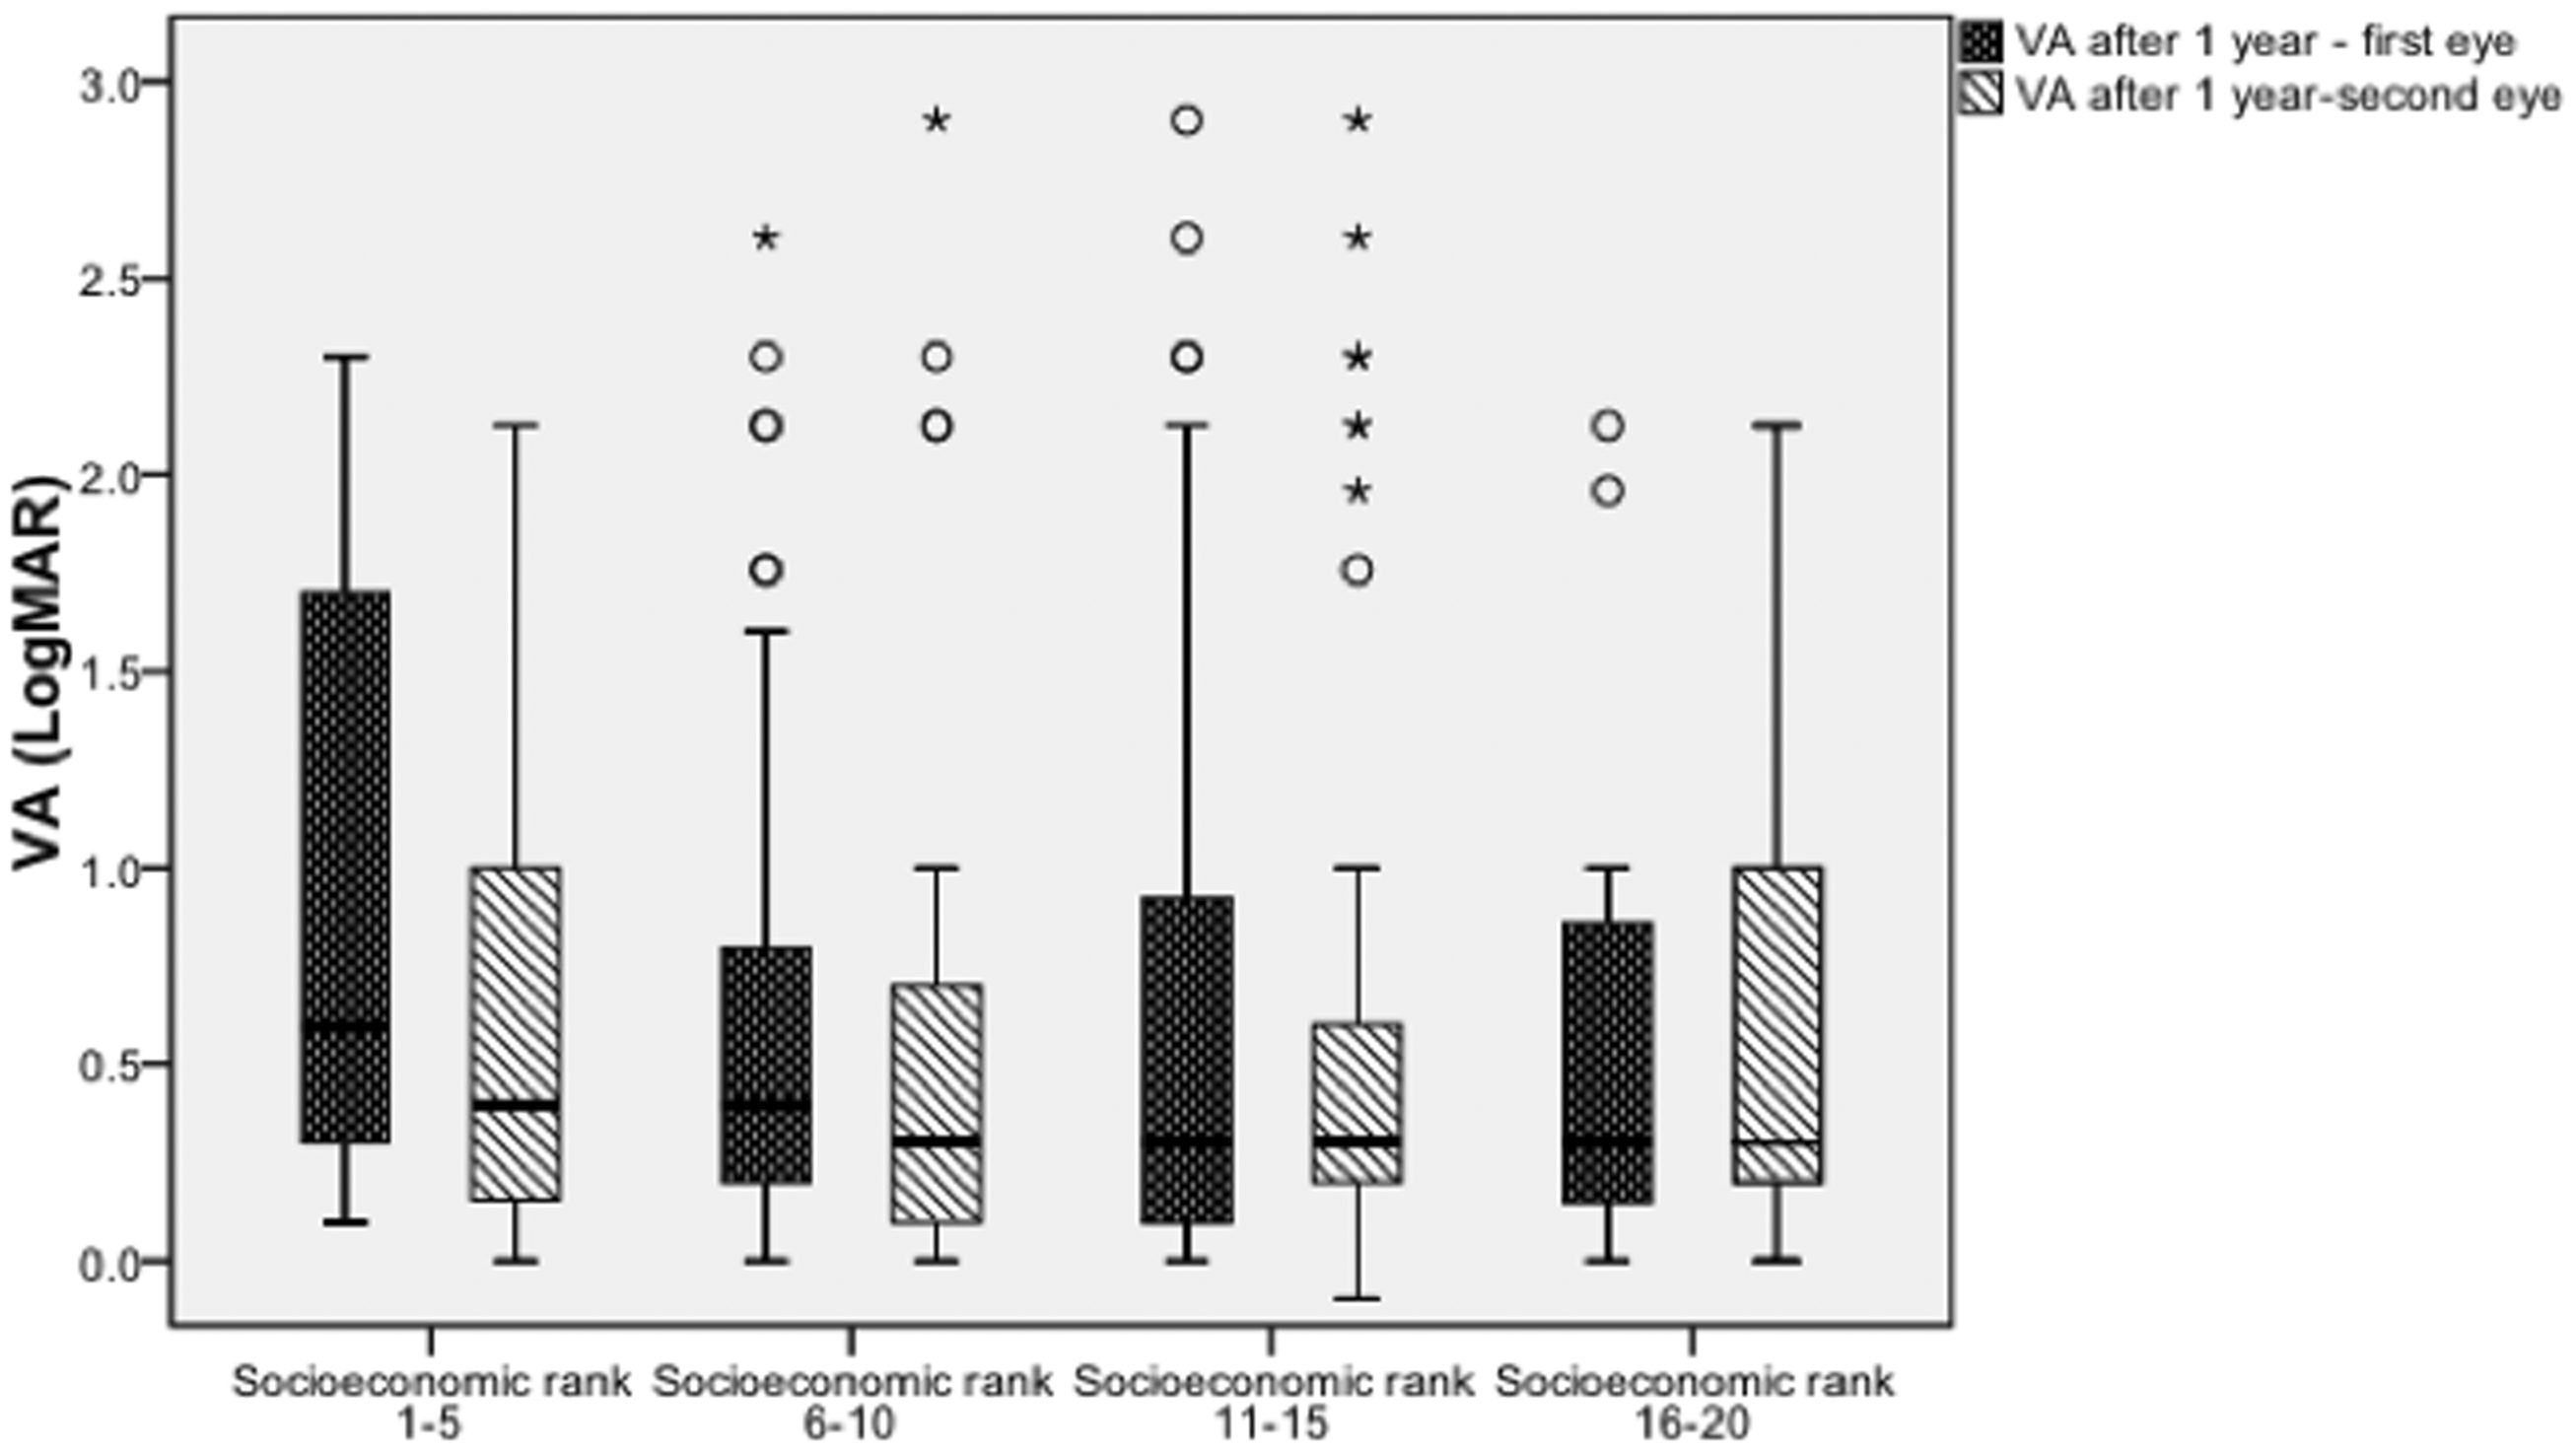
Visual acuity (VA) of first and second treated eye after 1 year of treatment by socioeconomic status (SES). Box plot showing visual acuity (Y-axis) after 1 year of treatment with anti-VEGF compounds in the first (n = 176) and second treated eye (n = 129) of the same individual. No association between VA and SES was found (p = 0.421 for the first eye, and p = 0.90 for the second eye).
SES and VA were also analyzed following 1 year of treatment. When evaluating SES as a continuous variable, it was not correlated with VA in the first (r = −0.14, p = 0.07; n = 176) or second eye (r = 0.007, p = 0.94; n = 129). The data were analyzed for the four SES categories after 1 year for both eyes, and no association between VA and SES was found (p = 0.421 for the first eye, and p = 0.90 for the second eye, Figure 2). There was also no association between the four SES classes and the number of anti-VEGF injections of the first (p = 0.943, Kruskal–Wallis test) or second eyes (p = 0.704, Kruskal–Wallis test) of up to 3 years of follow-up.
In order to identify the association of the lowest SES with the clinical outcome, an additional comparison was performed between the lowest category (clusters 1–5) and the rest of the categories combined (clusters 6–20). The only parameter that was associated with SES was baseline VA of the first eye (p = 0.048). The rest of the parameters, including VA of the second eye at presentation (p = 0.52), number of injections of the first (p = 0.76) and second eye (p = 0.96), VA after 1 year of the first (p = 0.17) and second eye (p = 0.71), were not associated (all analysis performed with the Mann–Whitney test).
Anatomical outcomes and SES
Central subfield thickness (CST) according to spectral-domain optical coherence tomography (SD-OCT) was evaluated for association with SES. These parameters were evaluated at presentation and after 1 year of treatment (Table 1). At presentation, CST of the first eye (n = 111) correlated with SES as continuous variable (r = −0.31, p = 0.001; Figure 3(a)), as well as when analyzed into four classes (p = 0.026, Kruskal–Wallis test). For example, the mean (SD) CST in category 1 (classes 1–5) was 634 ± 307 µm compared with a CST of 345 ± 75 µm in category 4 (Figure 3(b)).
Optical coherence tomography parameters.
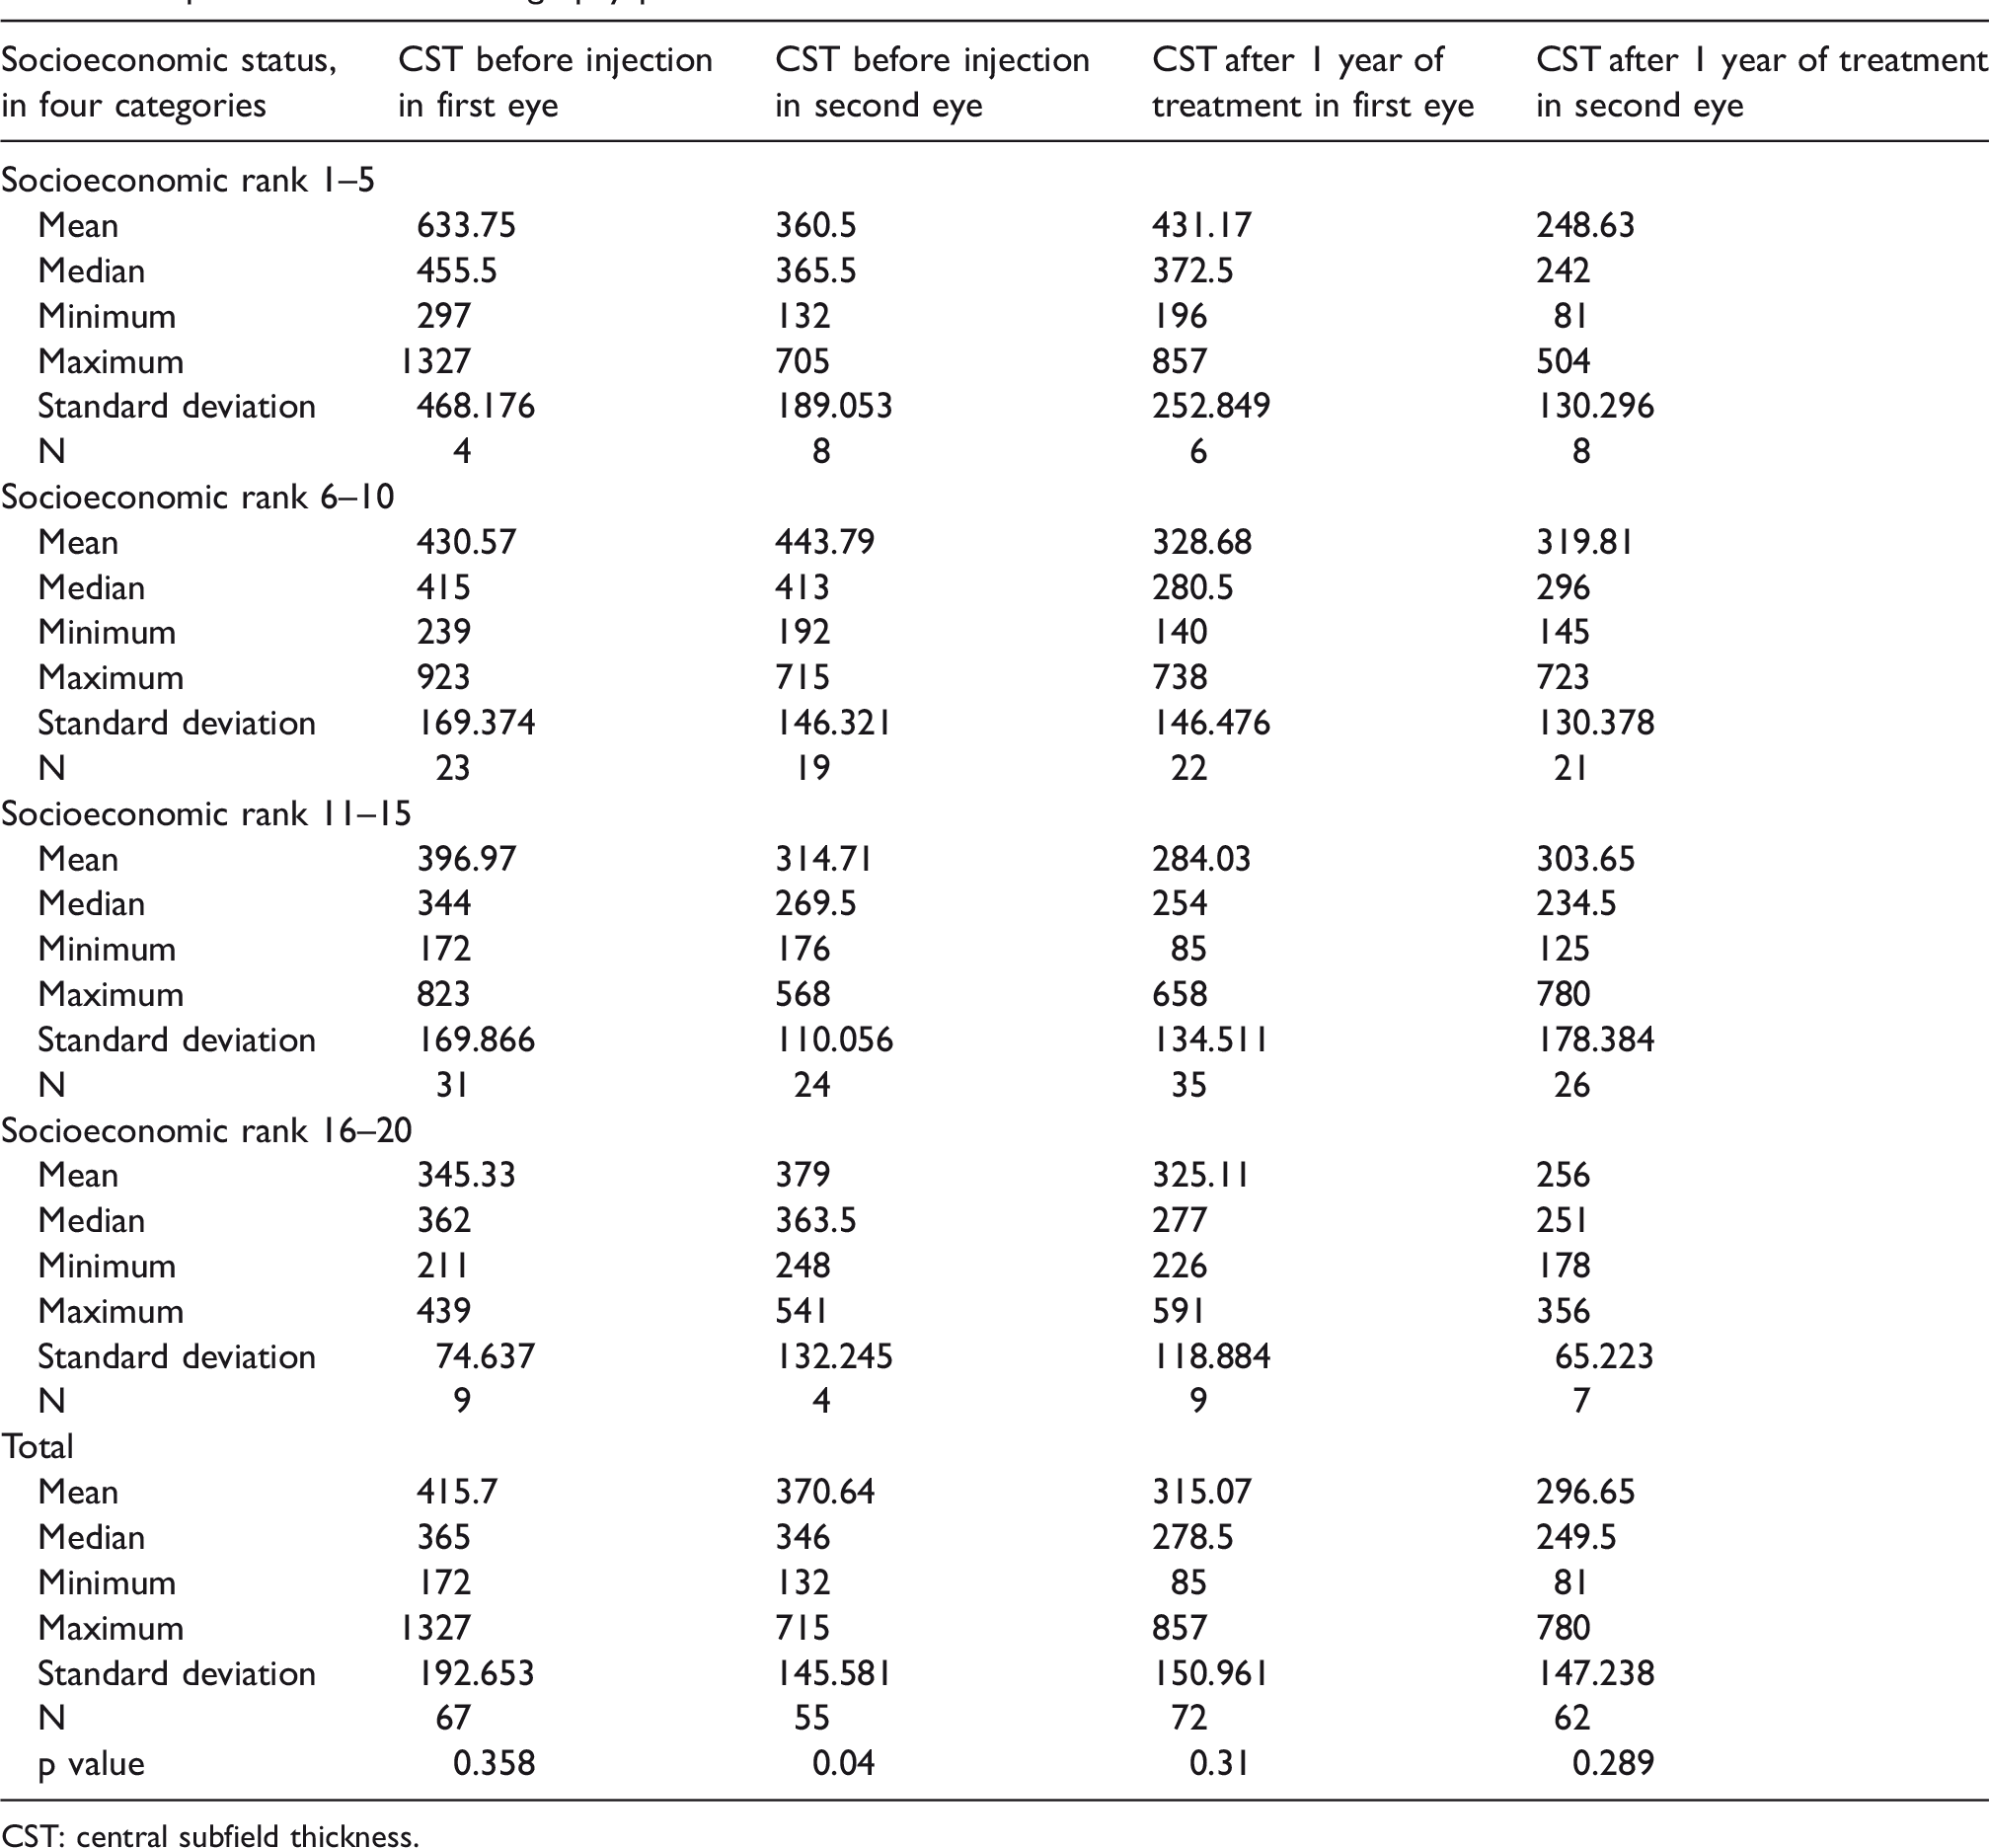
CST: central subfield thickness.
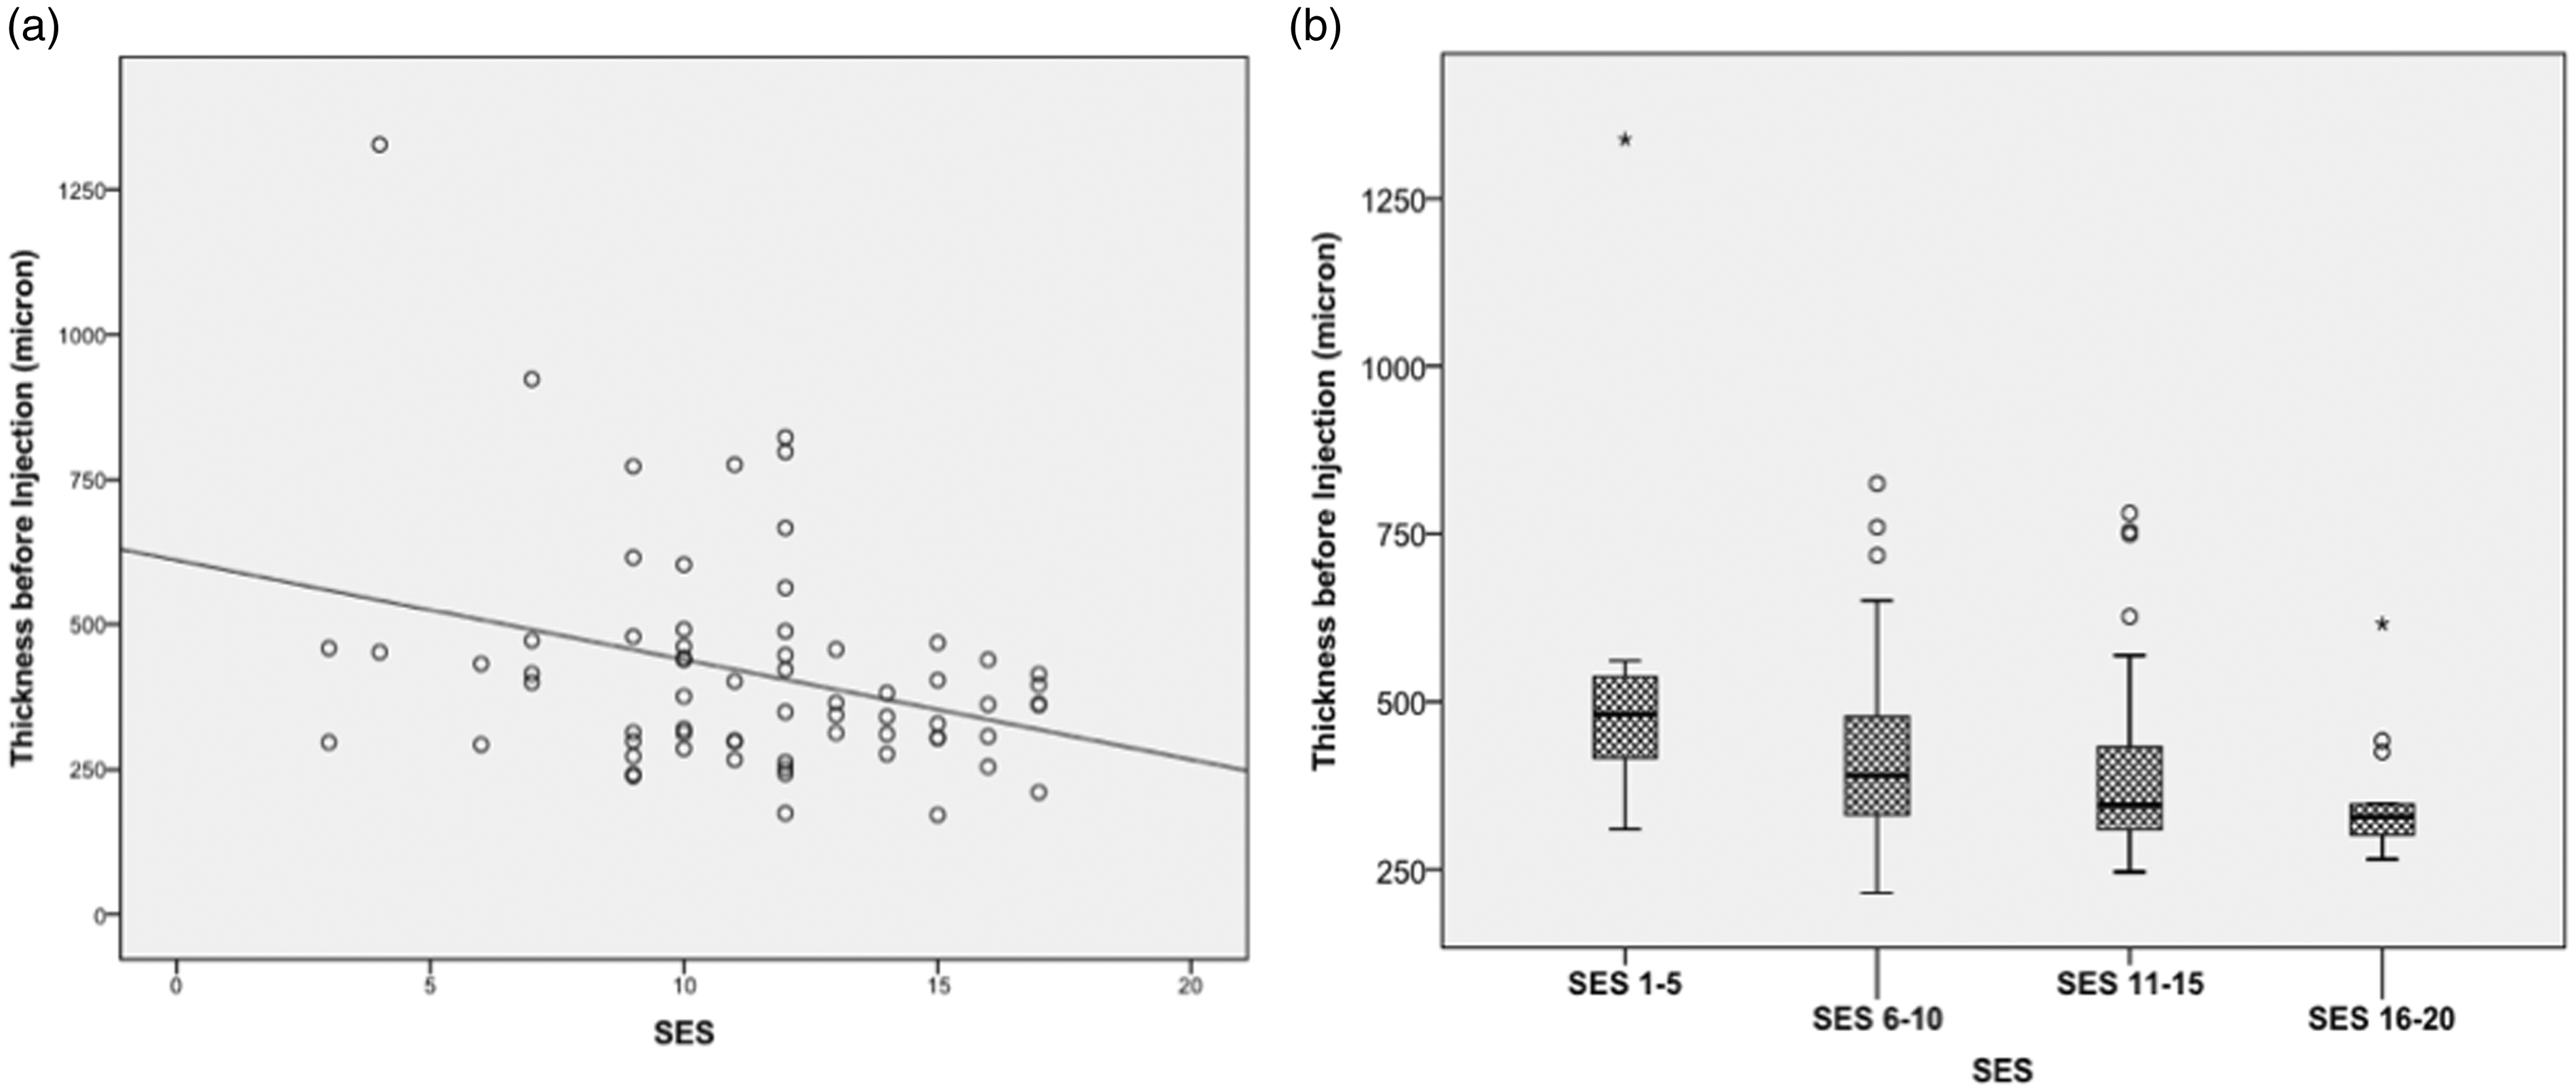
Optical coherence tomography (OCT) central subfield thickness (CST) in association with socioeconomic status (SES). Evaluation of the association of central subfield thickness (CST) at baseline in the first eye affected by nvAMD (n = 111) and SES as a continuous (a) or categorical (b) variable. A negative correlation was detected between SES and thickness when evaluating SES as a continuous parameter (r = –0.31, p = 0.001). The categorical analysis also showed higher CST in lower SES classes when compared with the other three groups (p = 0.026, Kruskal–Wallis test).
For the second eye, CST at presentation with new-onset nvAMD (n = 51) did not correlated with SES as continuous variable (r = 0.026, p = 0.859, Kruskal–Wallis test), or when grouping the eyes into the four SES classes (p = 0.734). These findings are in accordance with the association of SES with VA described above. Similar to the visual outcome data, there was no correlation between the SES and CST following 1 year of treatment.
Discussion
We found that VA at the time of presentation to the retina clinic with a new-onset nvAMD in the first affected eye was lower in patients from lower SES. The magnitude of the difference between the lowest and the highest SES categories was approximately 3 ETDRS lines. Yet, after 1 year of treatment, the mean VA in the first eye was similar across the different SES classes. There was no difference in VA at presentation or following 1 year of treatment across SES in the second eye of the same individual. In accordance with the visual findings, at time of presentation with new-onset nvAMD in the first eye, the macular thickness was inversely associated with the SES. When presenting with nvAMD in the second eye, there was no association between the CST and the SES. The number of intravitreal injections of anti-VEGF compounds given to the first eye or the second eye was also similar across the SES. Results of both VA and macular thickness suggested that lower SES classes had more advanced disease at presentation with nvAMD in the first eye but not in the second eye.
It is important to understand why patients of lower SES present with poorer VA when developing nvAMD in the first eye. It was previously reported that patients of lower SES are prone for under treatment when having certain ophthalmic pathologies. 7 The Salisbury Eye Evaluation Study found ethnicity-associated tendency for specific visual impairment factors, as well as association between VA equal or lower than 20/40 and less ability to visit an ophthalmologist. 8 In glaucoma patients, similar findings associated between employment and vision-related quality of life scores were noted. 9 The nationalized health insurance program in Israel provides equal coverage and access for individuals from all SES groups. Despite these facts, a higher hazard ratio in oncologic patients was associated with more peripheral districts and larger distance from a major referral center in the Israeli population. 10
Limited data exist with respect to the association of SES and treatment outcome in nvAMD. Lower SES was previously associated with impaired access to eye care in the community or to the first appointment at the hospital. 11 As a consequence, such patients might present at a more advanced state having lower vision and thicker maculas. Such late presentation may be the result of unawareness for the need to undergo regular examination, or by the lack of ability to see an ophthalmologist once the disease has manifested. 11 In Israel, the nationalized health care system provides equal accessibility regardless of the SES. First-line therapy is composed of intravitreal bevacizumab injections, and OCT imaging is fully covered. Thus, a potential strategy for prevention of delayed diagnosis of new-onset nvAMD in patients from low SES can be contemplated. Such strategy may involve periodic contacting of elderly individuals through their health maintenance organizations to perform regular annual eye exams.Such exams may improve the detection rate of early AMD, provide an opportunity to familiarize the patient with AMD when present, educate him on symptoms that may mandate urgent exam, and establish the ophthalmologist as a point of contact should such symptoms occur.
Conceivably, relying on an efficient and timely first-line therapy helped to eliminate the difference that was observed at baseline between the SES classes after 1 year of treatment. If the costlier compounds were to be used, such that mandate co-payment, then there would potentially be differences in access to treatment and treatment outcome.
Unlike the findings of this study, Acharya et al. 4 did not found an association between the SES and baseline VA of the first eye as a binary or continuous variable in 240 patients with nvAMD from the United Kingdom. Similarly, Nguyen et al. 12 did not found connection between SES and VA at presentation in Australia. On the other hand, More et al. 13 found similar results to the ones described in this study with patients from lower SES having lower VA at presentation. The difference in the results among the studies may stem from population-specific factors, as well as differences among the health care systems, or SES assessment methodologies. A unique characteristic of our study is the small geographic area where it was conducted. It focused on one city, Jerusalem, where public transportation to the medical center is readily available, thereby eliminating distance as a potential factor in our findings. Another potential source of bias was eliminated as the relative number of patients from each category of SES was similar, providing sufficient representation to all parts of the community.
The fact that SES was determined by address and not on the individual level constitutes a caveat of the study. Yet, the SES score is based on multiple comprehensive parameters related to different socioeconomic aspects of life and was validated by the Israeli census.
In conclusion, the study detected inferior functional and anatomical status at diagnosis with nvAMD in the first eye in patients of lower SES in Israel. Treatment outcome was similar regardless of the SES. The study suggests that patients’ awareness for the importance of early intervention in cases of visual loss is likely an important factor in securing timely commencement of treatment. Specific attention to lower SES should be provided when promoting such awareness.
Footnotes
Declaration of conflicting interests
The author(s) declared no potential conflicts of interest with respect to the research, authorship, and/or publication of this article.
Funding
The author(s) received no financial support for the research, authorship, and/or publication of this article.