
Abstract
The NEET concept has become standard vocabulary when addressing youth disengagement. Across countries, the definition is used to measure young adults at risk of social exclusion. Using sequence and clustering analyses on unique Danish register data, this article presents a longitudinal study of the temporal developments of NEET occurrences. This enables a critical assessment of the quality of the NEET concept as a proxy for measuring young adults at risk of social exclusion. The article demonstrates how four out of five young adults labelled NEET cannot be characterized as being at risk of social exclusion. Using quantitative analyses, the results confirm the criticism of the NEET concept in some of the qualitative literature and find that there is a need to discuss the applicability of the concept nationally to define who is at risk, as well as in cross-national comparisons of young adults not in employment, education or training.
Introduction
When referring to nonparticipation or disengagement among young adults, it has become widespread—in both policy and research—to use the NEET concept, which refers to young adults who are neither in employment nor in education or training. Thus, in contrast to youth unemployment, which is defined as young adults who are active and available for the labour market, the definition of NEET includes a larger proportion of young people, that is, all those young adults not engaged in employment, education or training. Since 2008, the share of young adults defined as NEET has increased in most European countries and is yet to return to the pre-financial crisis rate. 1 The NEET concept has thus been interpreted as an indicator of the present challenges many young adults are facing (Holte et al., 2019). Some even argue that the NEET rate is an indicator of the share of young adults at risk of social exclusion (European Commission, 2010; The Organisation for Economic Co-operation and Development (OECD), 2018; Tamesberger et al., 2014).
In this article, I examine the relevance and applicability of the NEET concept as a way to identify young people at risk of exclusion. Furthermore, I investigate the validity of a criticism of the NEET concept raised in the literature. Specifically, the article questions whether the NEET status, at the individual level, is a temporary or recurring event, thereby adding to the less developed critique, which addresses the importance of exploring NEET in a longitudinal manner (MacDonald, 2011).
The study exploits high quality, longitudinal data from Danish administrative registers and demonstrates that being NEET does not express a risk of social exclusion as such. Accordingly, the article confirms Quintini and Martin’s (2006) finding that, for most young adults, the NEET status is only transitory. In addition, the article clarifies how a sharpened awareness of the national context helps us understand why the NEET concept is not an accurate indicator for young people at risk of social exclusion. In the case of the Danish welfare system, we observe how the subsystem of active labour market policies seems to help mitigate the consequences of entering the NEET category.
By developing a longitudinal framework for studying and understanding NEET occurrences between the ages 16 and 24, the article provides a basis for critical reflection on future applications of the NEET concept and the way in which national policy solutions aimed at young adults who are not in employment, education or training may be designed.
The Call for a Longitudinal Framework
The NEET concept found its way from the British context in the late 1990s, where it addressed young people under the age of 18 who were removed from the unemployment statistics, to today, where it is a central indicator for monitoring the labour market and social situation of youth within the European Union (Hutchinson et al., 2016). The status as a supranational concept can be exemplified by the Europe 2020 strategy, which included objectives for employment and education for young people, as set out in Youth on the Move (European Union, 2010) and the more recent Youth Guarantee 2 that were aimed at combatting youth unemployment and youth disengagement. These initiatives have translated into specific goals across member states to reduce youth unemployment. The development of survey-based NEET indicators by the OECD and Eurostat further reflect the centrality of the NEET concept on the international and European agenda. The NEET statistics enable cross-sectional country comparisons and country-specific profiling of NEET rates. Since 2016, Denmark has had its own register-based NEET indicator (Statistics Denmark, 2017b).
The initial wave of criticisms of the NEET concept pointed out that spurious homogeneity exists. Individuals with significantly different socio-demographic characteristics and individual problems ranging from more to less severe forms of disadvantage are ‘lumped together’ in one NEET category (Andersen, 2017; Furlong, 2006). Changing opportunity structures and a trend towards what is generally phrased as the destandardization of youth transitions have resulted in less predictable and linear routes from post-compulsory education to entering the labour market than in the past (MacDonald, 2011; Roberts, 2009). Being NEET accordingly covers a wide range of situations reflecting issues of churning between low-paid jobs and unemployment, and long-term unemployment or inactivity resulting from multiple disadvantages (Shildrick & Macdonald, 2007), and might even reflect young adults exercising a biographical choice to voluntarily step out of educational or employment activities (Du Bois-Reymond, 1998). Therefore, it is necessary to disaggregate the NEET category and distinguish between different types of vulnerability in order to identify and target actual risk groups.
The lack of disaggregation and the conceptual complexity have to some extent been acknowledged at the European level (Elder, 2015), which has resulted in attempts to divide NEETs into subgroups (Eurofound, 2012, 2016). The latest attempt represents a cross-sectional typology of seven distinct NEET youth profiles (Eurofound, 2016, p.32) as follows.
Re-entrants: those who will soon start work, education or training, that is, those who have already been hired or have enrolled in education or training
Short-term unemployed: those who are seeking and available to start work and have been unemployed for less than a year
Long-term unemployed: those who are seeking and available to start work and have been unemployed for more than a year
Unavailable due to disability and illness: those who are seeking but not available to start work due to disability or illness
Unavailable due to family responsibilities: those who are not seeking work due to caring responsibilities for children or incapacitated adults
Discouraged workers: those who have stopped looking for a job because they believe there are no employment opportunities for them
Other inactive, which is a residual group.
Compared to previous typologies, the 2016-version includes a temporal aspect in that it distinguishes between short-term and long-term unemployment. However, some researchers argue that differentiation between subgroups, based on quantitative ‘counting’, still produces categories that are incompatible with ‘real-life’ NEETs (Holte, 2017). Instead of accepting the quantitative categories as objective truths, this line of research suggests that ‘meeting’ young people constructed as being at risk provides a point of departure, through their lived experience, for critical engagement with categories.
Alongside suggestions on how to explore the built-in heterogeneity among young adults entering the NEET category, the importance of addressing the issue from a longitudinal perspective has emerged in the literature. Critics such as Robert MacDonald argue that the NEET category is too rigid to capture the dynamic flux of youth labour market transitions (MacDonald, 2011). He argues that instead of focusing on discrete episodes of unemployment and inactivity, we need to consider how such episodes fit into longer-term labour market careers (Macdonald, 2009). That is, do NEET episodes represent passing tendencies in the individual trajectory or are they of a more lasting character, and more importantly, for whom. Hutchinson et al. (2016) echo the relevance of a longitudinal perspective by pointing out that we lack a more detailed knowledge of the routes into and out of the NEET status (Hutchinson et al., 2016, p. 708).
Growing out of the theoretical developments on changing youth transitions as well as being a result of increased computational capacity and a rapidly evolving methodological toolbox, a number of quantitative researchers have focused on the sequential characteristics of contemporary post-16 transitions. They address the temporal prevalence of different activities, typically including employment, education, unemployment and inactivity (Albæk et al., 2015; Brzinsky-Fay, 2007, 2014; Dorsett & Lucchino, 2014). While portraying general patterns of school-to-work transitions, this literature pays less attention to the NEET concept.
Exploiting high quality administrative Danish register data, this article aims to address these shortcomings by disaggregating the NEET category with a focus on temporality, specifically regarding the frequency, timing and duration of NEET episodes.
Young Adults in Denmark
Contemporary Western societies all suffered the effects of the financial crisis, and are all experiencing ageing populations and increased global competition, which might explain the broad and relatively rapid adoption of the NEET concept. Such developments have sharpened the political awareness of the need to maximize the employability of their populations (Bengtsson et al., 2015). From this perspective, a large share of disengaged young adults—who are neither improving their skills via participation in education nor gaining experience through labour market participation—constitute a risk and an unrealized potential (The Danish Government, 2013; The Danish Ministry of Employment, 2014). Identifying young adults at risk has thus become a central political priority.
Despite representing one of the lowest levels of youth disengagement within the European Union, the increase in the Danish NEET rate after 2008 was a noticeable change relative to the rates that prevailed prior to 2008. According to the Eurostat NEET indicator, in 2005–2007 the pre-crisis NEET rate for 15–24-year-olds in Denmark was at its lowest point since 2000 ranging between 3.6 and 4.3 per cent. Immediately following the onset of the financial crisis, this rate increased and by 2012, it had reached 7.3 per cent. In 2019, it reached its highest rate to date, measuring 7.7 per cent. 3
Shortly after the economic shock, the Danish Parliament agreed on four so-called youth packages that were launched over a period from September 2009 to August 2012 (Thidemann Faber & Emerek, 2012). The youth packages each addressed different issues and age groups. A substantial part of the initiatives consisted of channelling extra finances in the direction of the municipal jobcentres in order to strengthen their ability to help unemployed and inactive young adults into education or employment (Thidemann Faber & Emerek, 2012). Two reforms that were enacted in this period particularly addressed educational disengagement. The first reform ‘A new chance for all’ was enacted in 2006 and introduced an educational obligation for unemployed young adults below 25 years of age without a qualifying education (qualifying education refers to completed vocational education or training (VET) or higher award) and who had no problems besides unemployment (The Danish Government, 2005). Since the implementation of this reform, unemployed people under the age of 25 are required to engage in educational activities within a certain period after applying for unemployment or cash benefits. The second reform, which was phased in from the beginning of January 2014, extended the educational requirement for eligibility for cash benefits to include the 25–29-year age group, and those with problems in addition to unemployment. (The Danish Government, 2013).
The political action to counteract youth disengagement has been comprehensive as reflected in the most recent policy initiatives. What’s more, the NEET concept has recently begun to emerge in reports from Statistics Denmark, the national authority for the collection and administration of statistical information on the Danish population (Statistics Denmark 2017a, 2017b). Further, both independent as well as state-funded research institutions have used the NEET concept to construct populations of youth on the margins in order to study the trends in size, characteristics and problem loads (Andersen et al., 2017).4, 5 Finally, comparative analyses of youth transitions within a Scandinavian context refer to the NEET concept (Albæk et al., 2015).
Empty Signifiers and Travelling Concepts
Despite political ambitions to reduce the risks faced by individuals and welfare systems, critics have demonstrated the unsuitability of the NEET concept as a tool for identifying target populations and designing policy. To this end, the concept needs disaggregation. Accordingly, the Eurofound has recommended distinguishing between, first, a cross-national comparative use of the NEET concept, and second, using the concept—in its disaggregated form—for designing policy (Eurofound, 2016).
Even though such conceptual distinction sounds straightforward, it creates a dilemma when approached from the level of policy development, in that the articulation of young adults not in education, employment or training becomes an empty signifier (Laclau, 1996). According to Wullweber, the empty signifier is defined as a signifier which becomes detached from its particular meaning in order to provide an empty space that can be filled with universal meaning (Wullweber, 2015, p. 82). In the case of the NEET concept, the particular signifier (in its original British definition) changed into a universal/general signifier when adopted by the OECD and European Commission, and hence into an empty space. Previously, but also co-existing with the NEET concept, there were competing signifiers framing young adults as vulnerable, at risk, marginalized, inactive, excluded and unemployed. Detached from such particular meaning—as reflected in the quote ‘The NEET concept is to increase the understanding of the vulnerabilities of young people in modern societies’ (Eurofound, 2016, p. 6)—one could argue, that the NEET concept comes to signify a universal, empty condition. In this view, the challenge facing the NEET concept is that stated ambitions for reducing the NEET share leaves open altogether the task of defining which young adults are referred to, how many they are and what their exact needs are (Maguire, 2015).
One way of approaching this conceptual conflict is through the theory of travelling concepts (Bal, 2002, 2009). According to Bal, concepts travel across disciplines, historical periods and geographical places, and on their way, they reach different meanings, operational values and scopes (Bal, 2002, p. 24). Rather than insisting on fixed definitions of concepts across disciplines, time and place, she argues that ‘conceptual processes of change need to be assessed before, during and after each trip’. Such assessment is necessary to develop concepts which we can agree to use (Bal, 2009). She further argues that, ‘Agreeing does not mean agreeing on content, but agreeing on the basic rules of the game: If you use a concept at all, you use it in a particular way, so that you can meaningfully disagree on content’ (Bal, 2009, p.18). That is, in order to establish agreement or disagreement on content, it is necessary to be very particular on how a concept is used. In relation to the NEET concept, this point translates into assessing the particular way in which the concept is used. To return to Eurofound’s recommendations for the two particular ways of usage: (a) NEET as a cross-national comparative quantitative measure and (b) NEET as a disaggregated typology of target populations.
The following analysis deals specifically with NEET in its strict function as a quantitative measure. In order to ease the further travel of the concept, the aim is to scrutinize (by way of longitudinal analysis) the degree to which the NEET concept as a quantitative signifier captures young adults at risk of social exclusion. In that sense the analytical aim is to give a precise picture of the conceptual content (who, how many and which needs) when applied to Danish register data in its function as a quantitative measure.
Definitions of NEET Indicators
The Eurostat NEET indicator 6 was developed in 2010 in a collaboration between the European Committee indicator group and Eurostat based on the EU Labour Force Survey (Eurofound, 2016; European Commission, 2010). The indicator is stated to be: ‘…an essential tool for better understanding the extent of the multifaceted vulnerabilities among youth (in modern societies) in terms of their labour market participation and risk of social exclusion’ (Eurofound, 2016, p. 2).
The indicator measures the size of the population based on the following equation:

When measured, the indicator considers as NEET those who did not work in the reference week of the survey and who were not actively engaged in educational activities in the three weeks preceding the survey or in the reference week. The Danish NEET indicator, developed in 2016, has adopted this definition. However, unlike the Eurostat indicator, it does not include non-formal educational activities. Further, instead of using survey data, the indicator is based on the Danish longitudinal register in the Labour Market Accounts (LMA) 7 . Both indicators make use of a general classification of the population as either ‘employed’, ‘unemployed’ or ‘outside the labour force’. An employed individual needs only to have worked for one hour within the reference/measurement week, while a status as unemployed requires having searched actively for a job. Using this definition, students can be classified as employed as well as unemployed even though their primary activity is education (Statistics Denmark, 2017b).
Further, neither the Eurostat nor the Danish indicator considers activities outside the labour force as education or employment when measuring the NEET rate. This means that young adults actively participating in education-like labour market interventions, such as counselling or upskilling, or employment-like interventions, such as job training or subsidized work, are classified as NEET. Finally, the indicators measure the NEET share for different age ranges. The most widely adopted is the 15/16–24-year age range (European Commission, n.d., Statistics Denmark, 2017).
Methods and Data
Methods
The following analysis uses sequence analysis and clustering techniques. Developed for including multiple events within the individual trajectory, sequence analysis enables the longitudinal study of the frequency as well as the duration and timing of NEET occurrences. This allows the character of a NEET status as passing, lasting or recurring to be determined. As opposed to modelling the probability and the duration of NEET occurrences as such, the objective in sequence analysis is to express the overall pattern of a full sequence when considered as a coherent entity (Aisenbrey & Fasang 2010). In that sense, the technique is essentially explorative. By comparing individual sequences, it provides (in combination with clustering) a comprehensive longitudinal picture of temporal patterns and subgroups—in this case within the selected study population. Addressing the question of whether the status as NEET on the individual level is a temporary or recurring event then allows the quality of the NEET concept as a proxy of young adults at risk of social exclusion to be assessed.
Applying the technique involves the following steps. First, the individual sequences are constructed. This step involves constructing a sequence of 108 months (equal to nine years) for each of the young adults included. Instead of specifying sequential activities, such as education, employment, traineeship, inactivity and unemployment, that are standard within the study of youth transitions (Albæk et al., 2015; Brzinsky-Fay, 2007, 2014; Dorsett & Lucchino, 2014), I focus exclusively on being NEET or not. I operationalize NEET as independent NEET occurrences/spells. For each individual the sequential activities thus hold the possibility of being NEET01 and/or NEET02 and/or NEET03 and/or NEET04 and/or NEETPLUS (including five or more NEET occurrences between ages 16 and 24). I operationalize all activities besides NEET as OTHER (including employment or education). Making this decision, I bear in mind the importance of also making visible how NEET occurrences develop in between employment spells and educational activities. The choice expresses the main analytical aim of scrutinizing the temporal development of NEET occurrences while keeping sequence complexity at an interpretatively reasonable level.
Having constructed the sequences, the second step establishes the similarity between them. By pairwise comparison, the Dynamic Hamming dissimilarity measure determines the number of transformations needed to align any two sequences. A cost is assigned to each transformation. Alignments based on the original optimal matching procedure allow for deleting and inserting activities as well as substituting one activity for another. This procedure spawned quite a lot of criticism related to the fact that the researcher thereby changes the temporal structure of the sequence (Aisenbrey & Fasang, 2010). The Dynamic Hamming measure accommodates for this criticism by exclusively relying on data-based and time-dependent transformations. In that sense the measure is entirely data driven (Lesnard, 2006, 2010). Finally, including the output of the alignment procedure in clustering, I explore the sequential patterns on subgroups.
Data
I construct a study population from a randomly selected 10 per cent population sample of individuals born between 1982 and 1989 (inclusive). Using a unique personal identification number, I link this initial sample of 62,639 individuals with the DREAM-register, administered by the Danish Agency for Labour Market and Recruitment. The DREAM register contains weekly information on labour market affiliation, active labour market interventions and receipt of welfare benefits. Finally, I supplement the dataset with information on educational activity from the Danish longitudinal student register and the Danish longitudinal educational registers, both administered and provided by Statistics Denmark.
Based on the NEET definition used by Eurostat and Statistics Denmark, measuring the NEET rate as the number of young people not in employment, education or training divided by the total population of young adults, those with a NEET occurrence (measured during November each year) between ages 16 and 24 were then selected. This reduced the general sample to 26,483 individuals. Further reduction involved deselecting individuals who died during the observation period (44), individuals staying abroad for more than 12 months (10,121) as well as a few with missing information on ethnicity (4). This left a total study population of 16,314 young adults (Appendix A). This sample also holds sociodemographic information on gender, ethnicity, education level (at age 24) and family status (at age 16). The following section describes the results.
Results
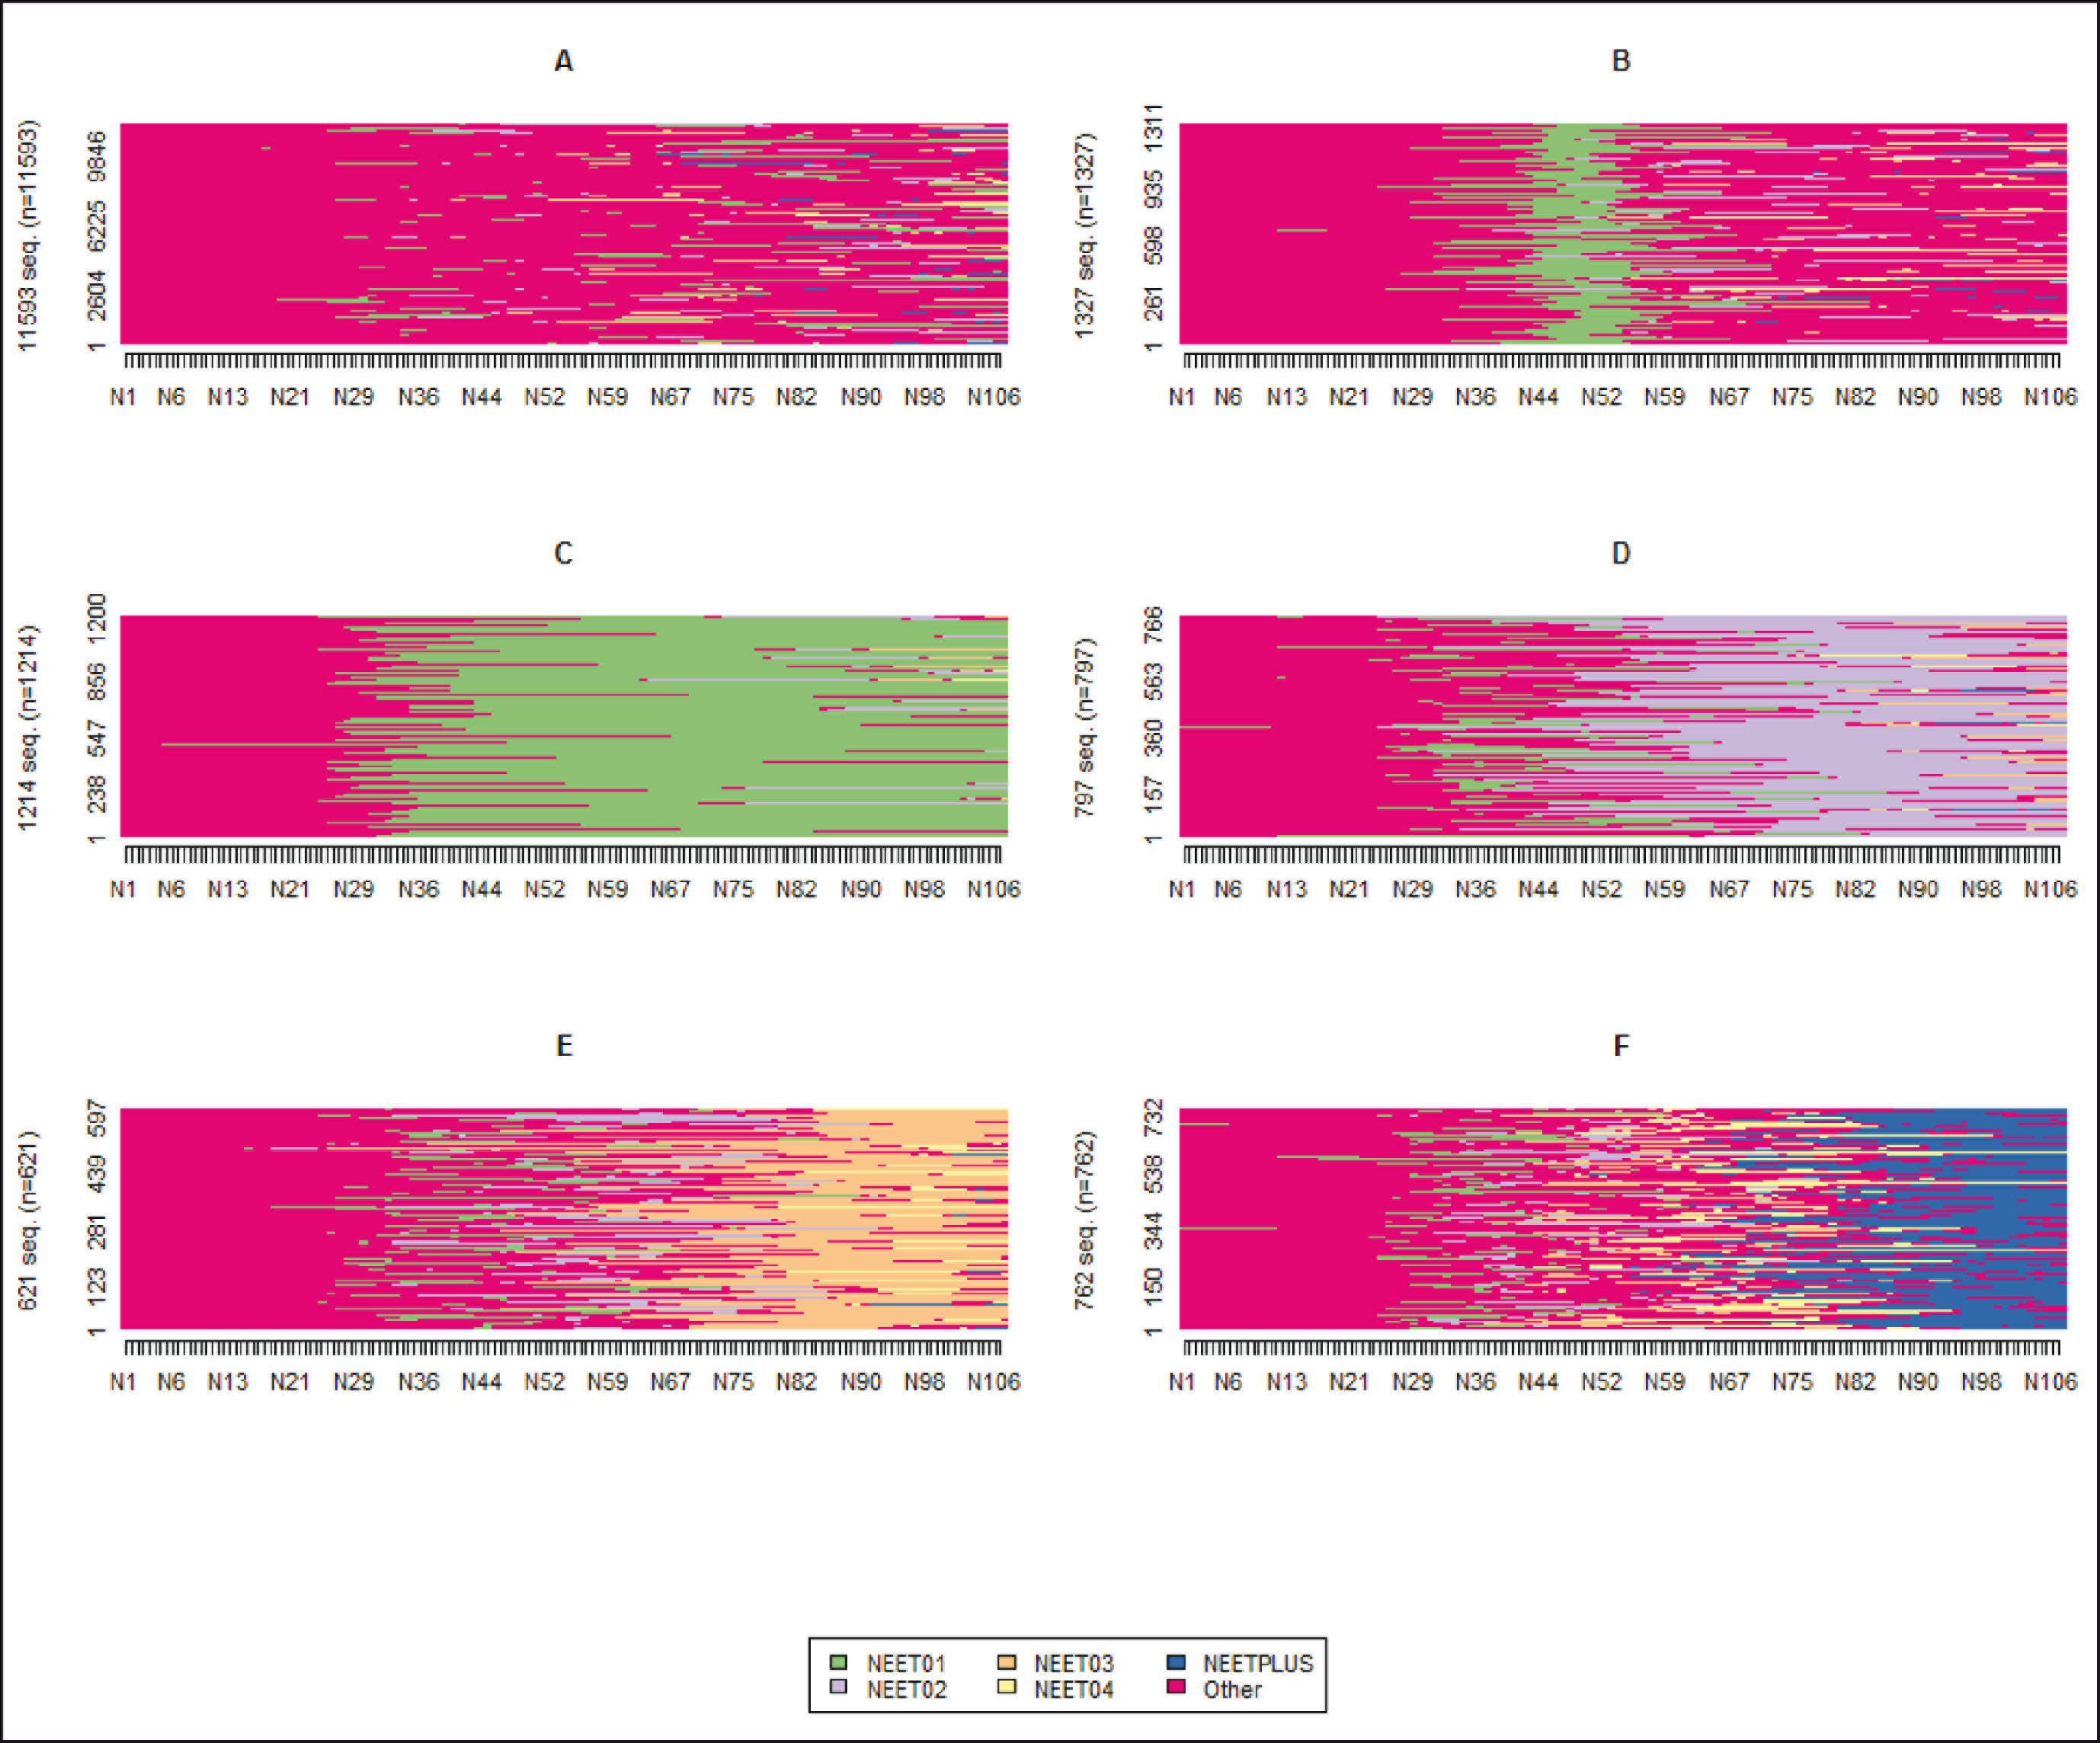
The following presentation illustrates how well the NEET concept, in its definition as a quantitative measure and indicator, identifies young Danes at risk of social exclusion. I present the findings when exploring this question by way of longitudinal analysis with a specific focus on temporality. Based on a clustering procedure and informed by cluster quality measures (Studer, 2013) as well as the analytical aim of paying attention to temporal and sociodemographic differences, the following analysis is based on a six-cluster solution. By choosing six clusters over five allows the distinction to be made between clusters C and D, which demonstrates differences related to the timing and duration of NEET episodes as well as differences in gender distribution, education level and type of system contact. Figures 1a and 1b give visual impressions of the temporal development of NEET occurrences between ages 16 and 24 within the study population. The x-axis expresses the 108-month-long observation period, while the y-axis distributes the number of individuals within each cluster.
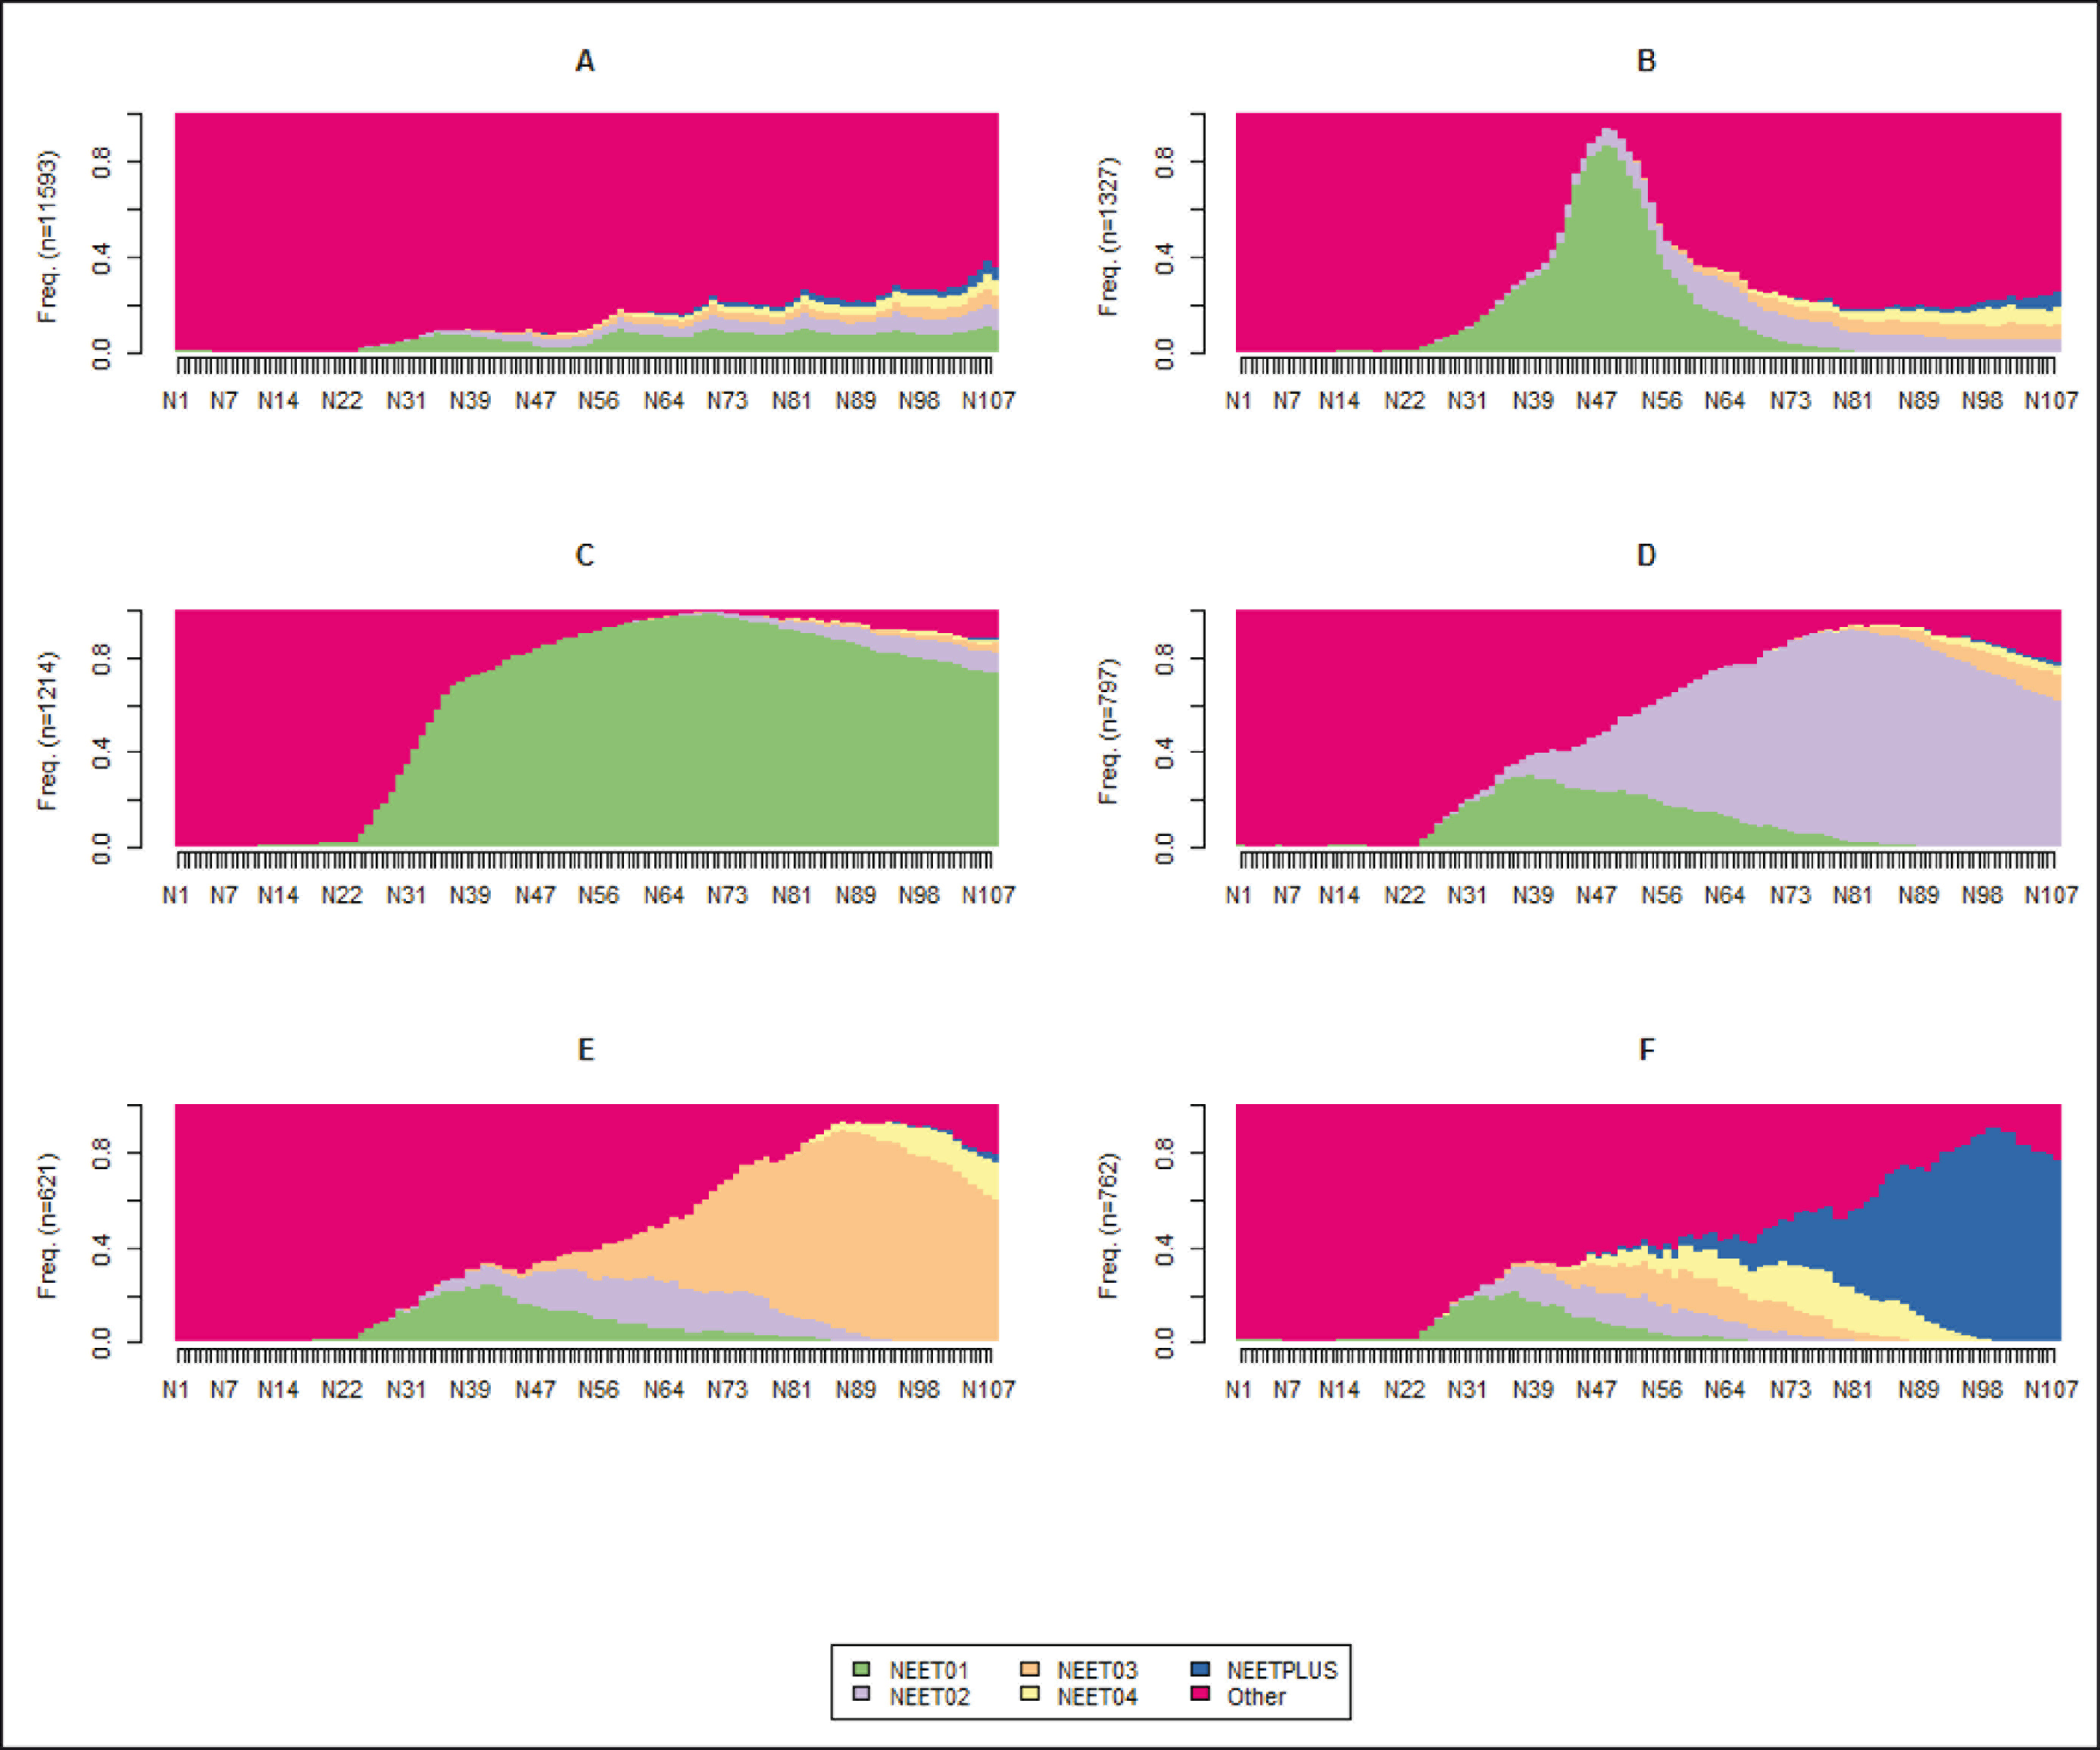
Temporal characteristics
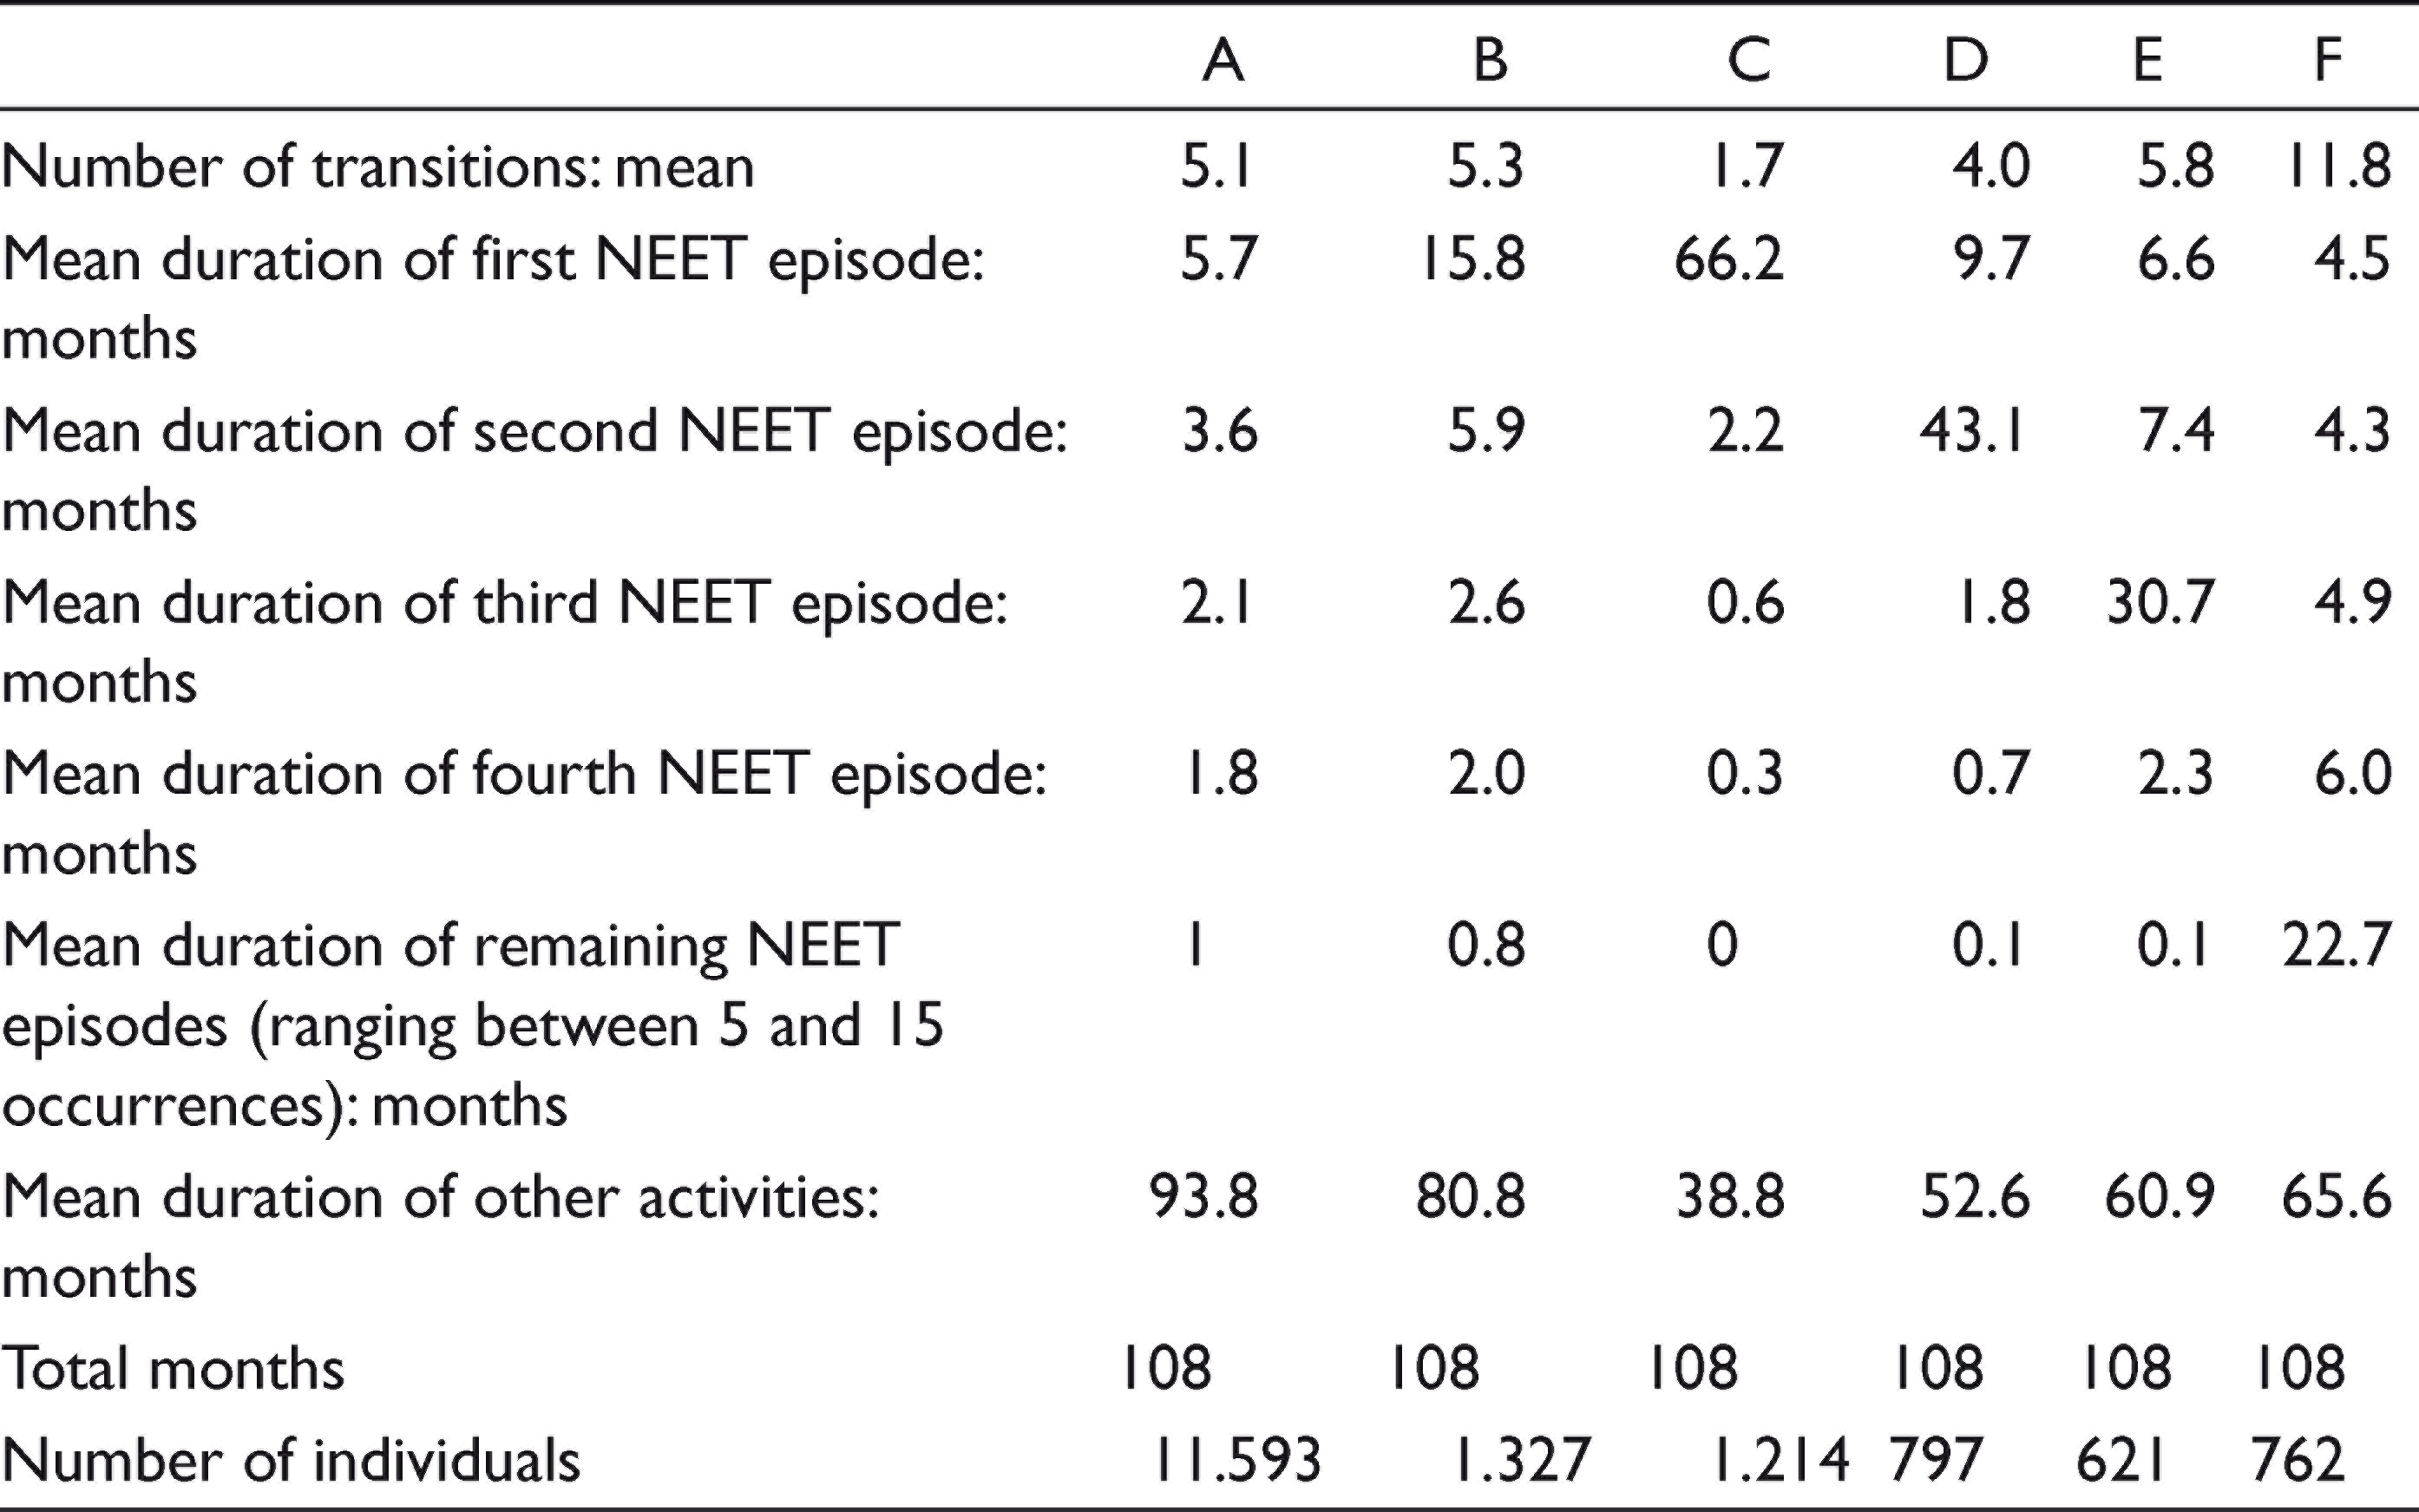
Figure 1a presents the aggregated distribution of activities within each cluster. For example, looking at cluster C, the plot shows how the majority of individuals represented experience an early first NEET occurrence beginning around month 25 (age 18), after which it develops into a long-term episode lasting throughout the observation period. Looking at the same cluster in Figure 1b, which presents the distribution of activities on the individual level, we get a better sense of the timing. We learn that young adults who experience this type of transition become NEET between months 25 and 40 (ages 18 and 20). Table 1 includes temporal aspects of each cluster, such as NEET frequency and duration. Before turning to such characteristics, it is worth noting the differences in cluster size. The pattern described by cluster A absorbs the large majority, or 70 per cent, of the study population. The remaining five clusters range from the smallest cluster E (3.8% of the young adults) to the second largest cluster B (8.1% of the study population).
As is evident from visual inspection, the majority of young adults in the large cluster A experience relatively few and relatively short-lasting NEET occurrences throughout the observation period when compared to other patterns. Table 1 confirms this first impression. Young adults in cluster A thus spend almost eight (93.8 months) out of nine years on activities other than NEET (either education or employment). The remaining year consists of NEET occurrences spread throughout the observation period at an almost seasonal interval (Figure 1a). This might express a tendency to experience unemployment or inactivity during the off-study season from June to August/September, typical for Danish students undertaking upper secondary or higher education.
Young adults in cluster B similarly follow a pattern dominated by other activities than NEET. On average, they spend six and a half years in education or employment. However, very different from young adults in cluster A, those in cluster B experience a long initial NEET occurrence around ages 19 and 20 that lasts approximately one and a half years. Despite the difference in timing of the first NEET occurrence, the pattern in cluster B is also indicative of typically Danish student behaviour, in that upper secondary tracks, such as high school, end around age 19 or 20 in Denmark. For some, this allows time for sabbaticals (e.g., a so-called gap year) before entering further education and even though other NEET episodes might follow this first occurrence, they eventually become shorter.
Similar to cluster C, the pattern in cluster D represents young adults for whom the total time spent as NEET exceeds the time spent on other activities. Figure 1b illustrates how shorter initial NEET episodes, lasting for an average of 10 months (Table 1), develop into much longer second NEET episodes, typically lasting throughout the observation period. Such temporal characteristics indicate young adults for whom the difficulty of staying active in formal education or employment presents itself very early on.
Finally, clusters E and F, which are the smallest clusters, include young adults for whom several NEET occurrences gradually develop into a long-lasting condition. Such temporal patterns reflect potentially more complex situations than the ones reflected in patterns in clusters C and D. This consideration is partly based on the number of NEET occurrences present, with NEETPLUS counting between 5 and 15 NEET occurrences; and partly based on the high number of transitions (Table 1). For example, during the observation period from ages 16 to 24, young adults in cluster F make up to 12 transitions between a status of NEET and other activities, which gives an overall impression of precarious circumstances.
Central Cluster Characteristics, Study Population by Cluster
In summary, the longitudinal framework reveals central aspects related to the temporal development of NEET occurrences. Most importantly, the framework demonstrates that, for nearly 80 per cent of the population, NEET occurrences are relatively brief. Thus, for young adults in clusters A and B there seems to be no immediate risk of social exclusion. For the remainder of the young adults, two very different situations seem to play out. First, regarding the 12 per cent of the population who cluster in patterns C and D, they face difficulties from early on and these difficulties place them outside formal education and employment in the long-term. Second, the remaining 8.5 per cent in clusters E and F hang on to educational and employment related activities for longer. However, frequent and more persistent NEET occurrences interrupt such activities. Finally, the temporal patterns in clusters E and F share a resemblance to previous findings of young adults churning between episodes of education, employment, unemployment and inactivity—signalling precarious transitions (MacDonald, 2011; Shildrick & Macdonald, 2007).
Who Are the NEET’s and What Are Their Needs?
Before concluding, this section supplements the longitudinal analysis of temporal patterns with information on sociodemographic differences between clusters.
In addition to characteristics related to gender, ethnicity, education level and family structure, Table 2 uncovers some of the different activities related to being NEET within a Danish context. This is only possible because of the wide-ranging Danish tradition of recording expenses related to welfare services. Being NEET thus typically involves receiving the minimum welfare benefits in the form of cash benefits or education support (for unemployed non-union members) or unemployment benefits (for union members). The very short version of the history of the past 30 years of active labour market policy represents a movement from welfare to workfare. In Denmark as well as elsewhere this development associates the receipt of welfare benefits with increasing means-testing as well as demands for active participation and comprehensive sanctions if such obligations are not met (Brodkin & Larsen, 2013). This is also the reality for young adults NEET, as reflected in Table 2 in the measures on unemployment-related activation and activation in relation to other NEET statuses. 8 The measures simply register whether or not young adults in the population—by cluster—have ever experienced such activation during the observation period. Far from being a perfect measure, since many will have experienced both, and potentially in different spells, they are included to indicate the level of system contact within the ‘NEET population’. Finally, Table 2 includes information on the proportion of each cluster receiving early retirement benefits.
Descriptive Characteristics, Study Population, by Cluster
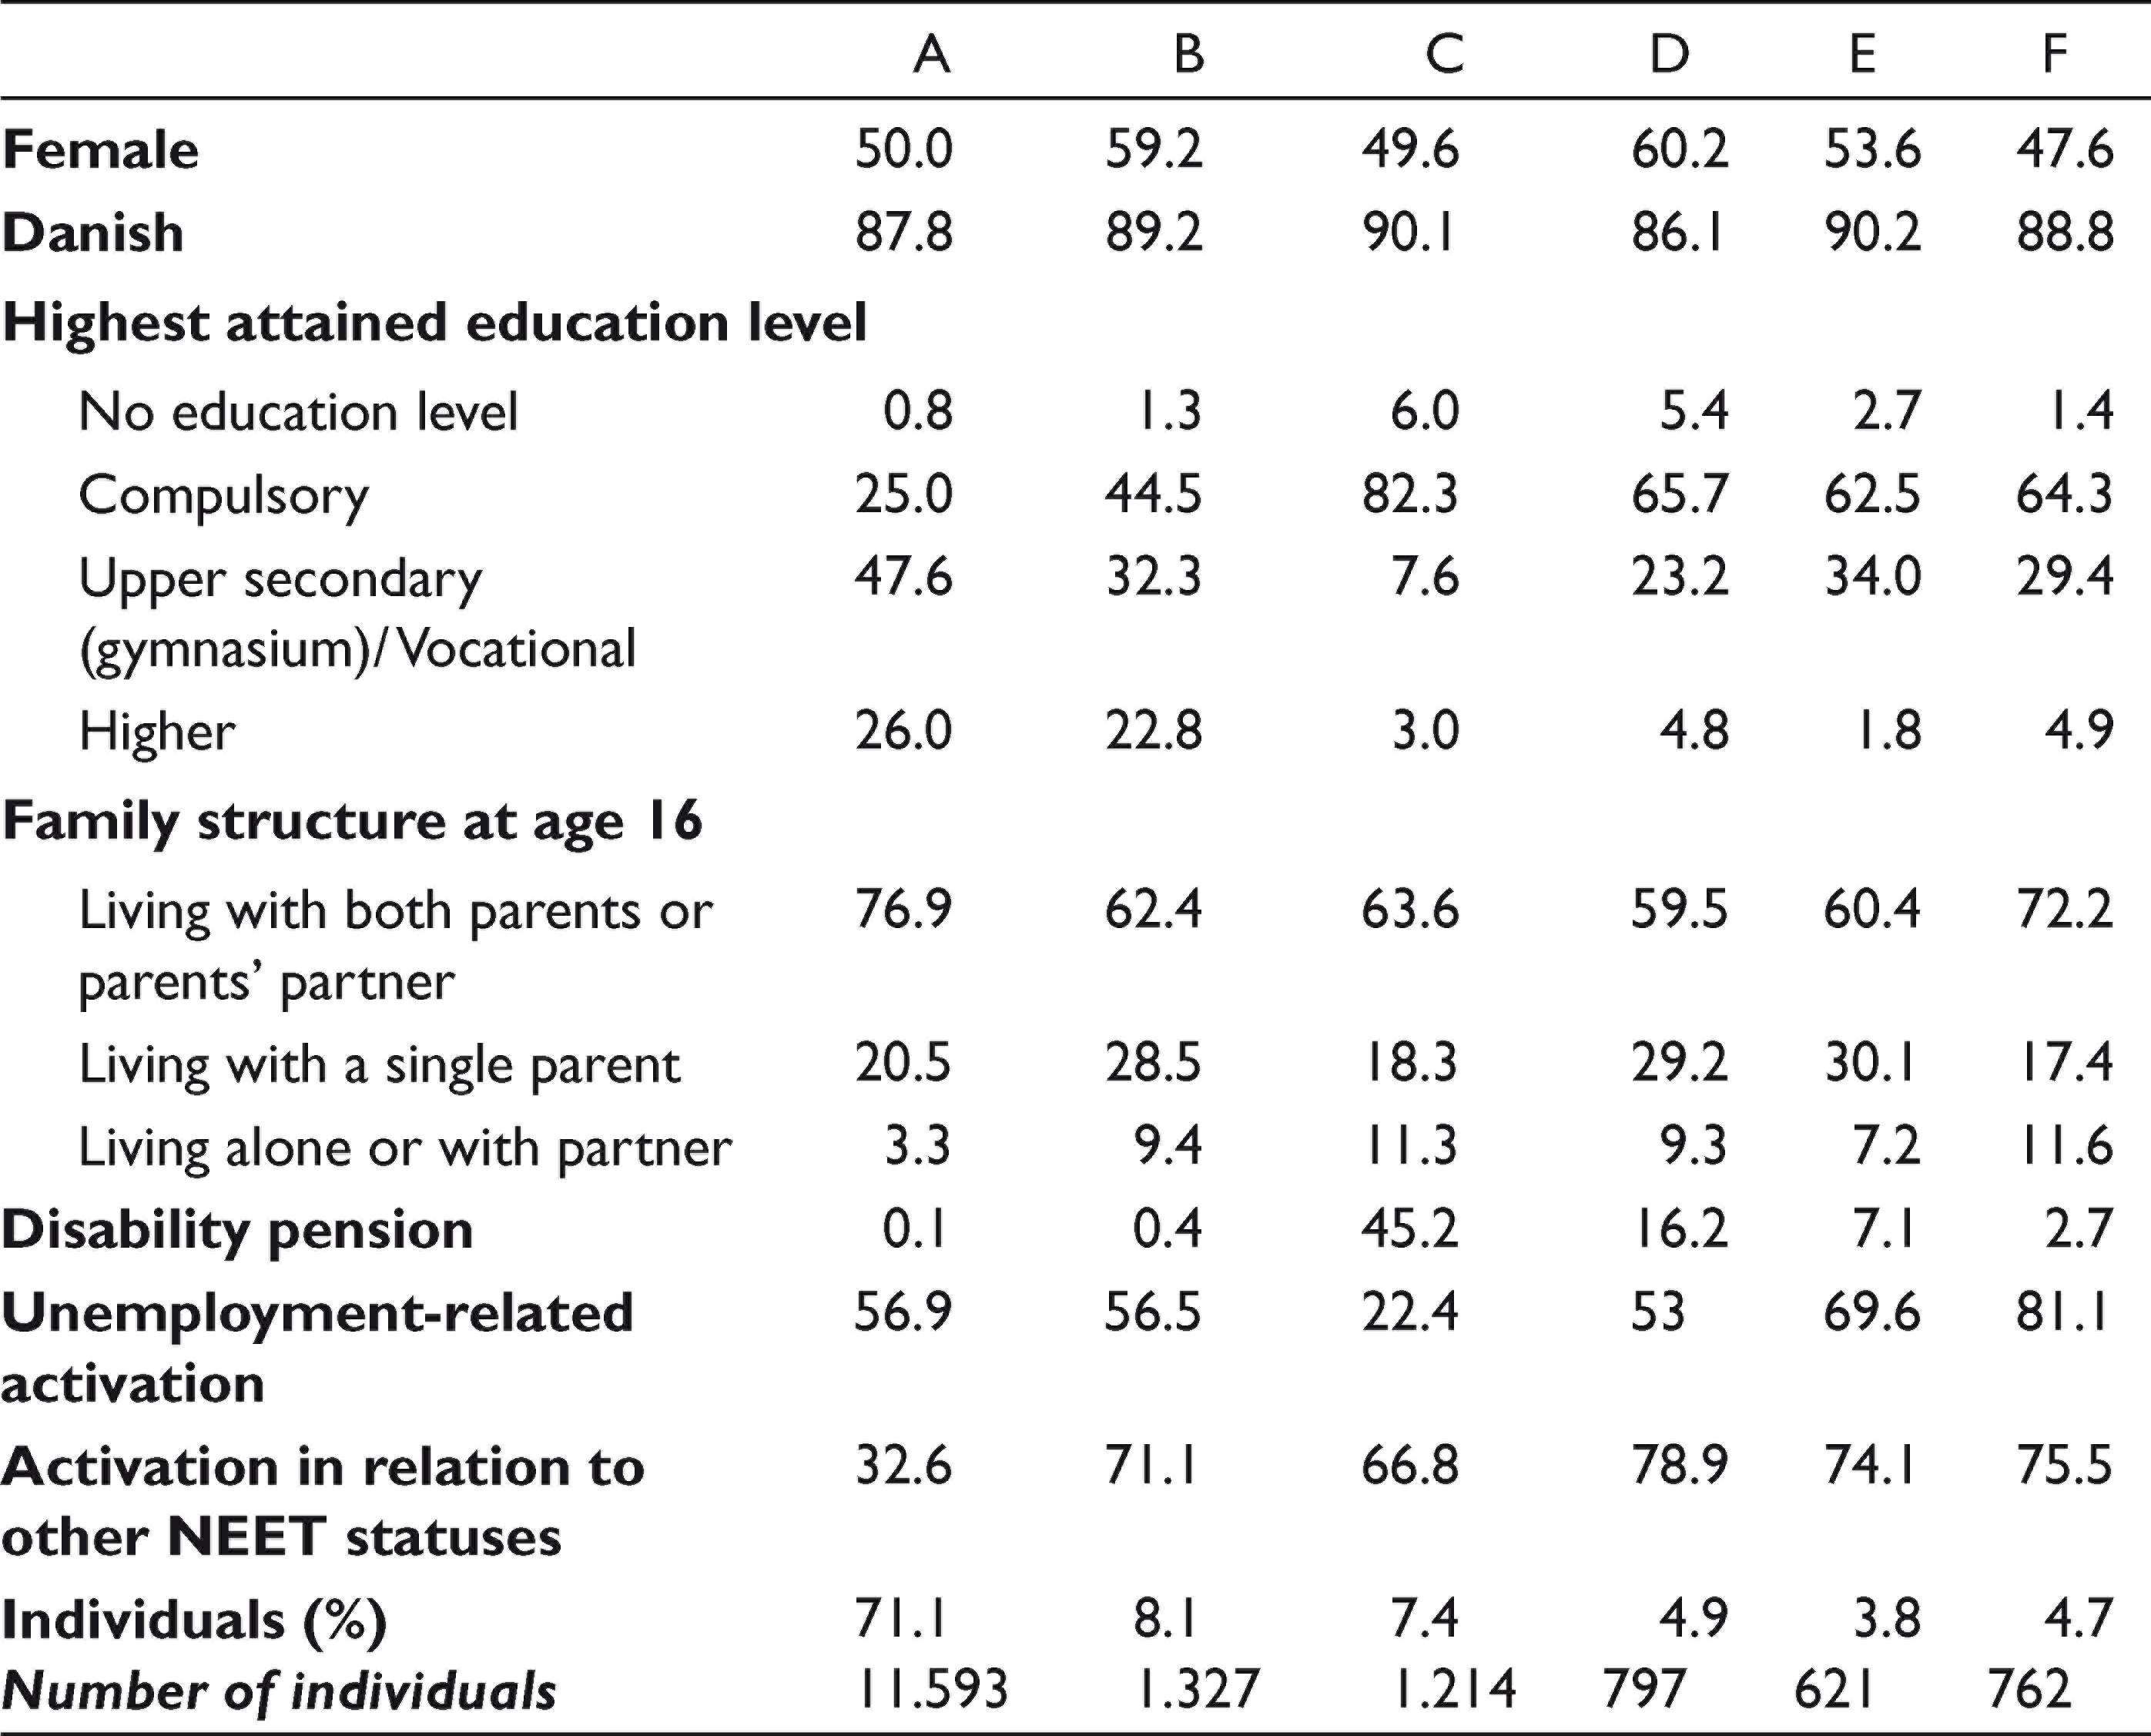
Considering young adults in clusters A and B, Table 2 confirms the findings from the analysis of the temporal patterns, with these groups of young adults mainly accumulating educational capital. The majority of young adults in both clusters attain education levels above compulsory schooling before age 24. However, the fact that more than 50 per cent of the young adults in both clusters have experienced unemployment-related activation reflects a potential instability not immediately visible from the temporal patterns. The fact that 70 per cent of young adults in cluster B have experienced other types of activation in addition supports this interpretation. Compared to the average within the total study population, their family status at age 16 also indicates a more fragile upbringing with almost 38 per cent living with a single parent, alone or with a partner. This is not the case among the large majority in cluster A.
Turning to the two clusters C and D, representing young adults for whom NEET occurrences turn long-term early on, we learn from Table 2 that such patterns reflect disability and illness; 45 per cent of the young adults in cluster C, are in receipt of a disability pension before the age of 24. The low education levels, with no more than 10 per cent attaining levels above compulsory school, further reflect an early exit from education. Among young adults in cluster D, we find that the highest share (close to 80%) of participation is in activation typically aimed at clarifying levels of capability, competence and employability and 16 per cent already receive an early disability pension. Young adults in cluster D also differ from most others with regard to family structure at age 16. With nearly 40 per cent (compared to an average of 27% of the total population) living with a single parent, alone or with a partner, their transitional difficulties might also reflect broken family histories. Cluster D further includes a majority of females (60%).
Finally, Table 2 further substantiates the precariousness indicated by the temporal patterns for young adults in clusters E and F. Table 2 demonstrates that between 70 and 81 per cent of the young adults in those clusters have participated at some point in unemployment-related activation. This combination of young adults who, despite massive system contact, repeatedly return to a status as NEET, signals a significant policy challenge.
Conclusion
In this article I adopt the standard definition of the NEET indicator as developed by international organizations, such as Eurostat, and apply it to Danish longitudinal data to assess the quality of the NEET concept as a proxy/signifier for young adults at risk of social exclustion.
The findings demonstrate that the NEET concept, when used as a quantitative indicator, captures four different groups of young adults whose temporal patterns reveal risks of social exclusion. Overall, such patterns split up into two main characteristics. While the first one represents a pattern of early NEET occurrences that rapidly develop into a long-term condition, the other main characteristic represents a potentially more complex condition in that it involves a combination of early and frequent NEET occurrences. This involves a relatively long period between ages 18 and 24 in which NEET occurrences and other activities, such as education and employment, replace each other until NEET activities develop into a much more permanent state. Unfolding how NEET occurrences develop within a longitudinal framework thus reveals central characteristics that are difficult to capture from a cross-sectional perspective. The churning between episodes of NEET and episodes of employment or education, as is characteristic for young adults in cluster F, captures a potentially precarious situation, which a cross-sectional framework might mistake for short-term unemployment.
The four clusters represent 21 per cent of the study population, while the remaining 79 per cent reflect a large majority for whom NEET occurrences are relatively brief and remain so throughout the observation period. Defining their situation as expressing risk of social exclusion seems to be quite an overstatement. Using the NEET concept, in its definition as a quantitative cross-sectional indicator, the analysis reveals that in four out of five cases young adults NEET seems far from being at risk of social exclusion. Based on these findings, the strength of the NEET concept, as a proxy for young adults at risk of social exclusion, is not convincing.
Returning to Bal’s argument that it is necessary to develop concepts based on specifying the particular way in which the concept is used, the low accuracy with which the quantitative cross-sectional NEET indicator captures young adults at risk of social exclusion indicates a misleading conceptual use of the NEET term. Instead of labelling young adults NEET as being at risk of social exclusion, international organizations might consider a more neutral, but literal, use of the term NEET as (simply) capturing young adults outside education and employment. In order to identify those for whom NEET represents a risk of exclusion, this study demonstrates the necessity for longitudinal analyses, preferably on an individual level.
In stating this, it becomes important to include the national dimension of the findings. One of the metaphors used within Danish active labour market policy is that of a revolving door. When people arrive at the municipal job centre to apply for financial assistance, the aim is to turn the situation around as quickly as possible. With this in mind, one possible interpretation is that young adults in clusters A and B, of whom more than half participated in unemployment-related activation, have received help to return to formal employment or education. A situation of accumulating difficulty, such as repeated difficulties in gaining a foothold in the labour market, might have been avoided for individuals in these clusters. However, for the young adults in cluster F, of whom more than 80 per cent have participated in unemployment-related activation, this system contact has not been able to help them redirect the disturbing course of their trajectory.
This analytical distinction, revealed by the longitudinal framework, confirms the necessity, also demonstrated in recent comparative studies (e.g., Holte et al., 2019), to discuss the relevance and applicability of the NEET concept across different welfare settings. The findings from the Danish case suggest that the low accuracy with which the NEET concept captures the risk of exclusion reflects a social structure that provides young people with opportunities, benefits and services as well as ensuring them a minimum standard of living. Characteristic of this social structure is also a comprehensive tradition for interventions of both a social and labour market related nature that are set in place to manage ‘risk’ when it appears. That is not to say that NEET occurrences do not express a cause for concern within a Danish or Scandinavian context but highlight that the social structure mitigates the consequences of entering NEET. Instead of being a precise proxy for young adults at risk of social exclusion, the social structure, in this case the Danish welfare system, adds a further dimension and potential ambiguity to the NEET concept. This is an important lesson to bear in mind in international comparisons. In the context of the Danish welfare structure, in order to identify those young adults who do have a risk of dropping out of education and the labour market, this study demonstrates that we would want to aim for a more targeted identification strategy. Based on the longitudinal framework presented here, three recommendations can be formulated. First, we need a more complete picture concerning the sociodemographic characteristics of young adults following patterns C to F. This might improve the targeting of interventions aimed at creating equal access to educational attainment in early life. Second, despite the high level of system-contact, the inability to remedy the situation for young adults in clusters E and F suggests system failure and a potential need for more personalized welfare services. Finally, this type of intervention would not be possible without ‘meeting’ and listening to the lived experiences, as suggested by Holte (2017), of the young adults who pose a significant political challenge.
Footnotes
Declaration of Conflicting Interests
The authors declared no potential conflicts of interest with respect to the research, authorship and/or publication of this article.
Funding
The authors received no financial support for the research, authorship and/or publication of this article.
Sample statistics
Table A1 below presents distributions for the study population as well as for the full cohort sample of individuals born between 1982 and 1989.
The descriptive statistics in Table A1 determine that apart from gender and birth cohorts the study population differs when singled out from the total population on all included background characteristics. First, the ethnic composition is different with a markedly higher share of ethnic Danes within the study population. This can to a large extent be attributed to the deselection of young adults abroad for more than a year, since almost all were 1st generation immigrants. Looking at the total level of education attained, Table 1 shows large differences with 40 percent of the study population gaining no or only a compulsory level compared to 18 percent in the full sample. The differences at the highest education level are equally large but with reverse signs. Considering the education levels of the young adults’ parents they reflect a generally lower socioeconomic status within the study population. Including information on family status at age 16 it shows that larger shares within the study population live with a single parent and alone or with a partner. This initial profiling of young adults with at least one NEET-occurrence between age 16 and 24 indicates differences from the full sample worth investigating.