
Abstract
Despite a growing interest in multi-omic research, individual investigators may struggle to collect large-scale omic data, particularly from human subjects. Publicly available datasets can help to address this problem, including those sponsored by the NIH Common Fund, such as the Genotype-Tissue Expression (GTEx) database. This database contains genotype and expression data obtained from 54 non-diseased tissues in human subjects. But these data are often underutilized, because users may find the browsing tools to be counterintuitive or have difficulty navigating the procedures to request controlled data access. Furthermore, there is limited knowledge of these resources among nurse scientists interested in incorporating such information into their programs of research. This article outlines the procedures for using the GTEx database. Next, we provide one exemplar of using this resource to enhance existing research by investigating expression of dopamine receptor type 2 (DRD2) across brain tissues in human subjects.
Since the completion of the Human Genome Project in 2003, scientists have been eager to incorporate genomics information into their programs of research (Gibbs, 2020). However, investigators can find themselves limited by small effect sizes and excessive noise in analyses, which drives up the sample size required (Li et al., 2018). These large sample sizes can be prohibitive from both a recruitment and a cost perspective for clinical research projects, which hinders the progress of precision medicine from becoming a translational reality.
As a solution to this problem, the NIH Common Fund plan was incorporated as a key piece of the NIH Roadmap for Biomedical Research. One facet of the NIH Common Fund supports the creation of datasets with molecular and phenotypic data in both mouse models and human subjects. These datasets include the Genotype-Tissue Expression database (GTEx; https://gtexportal.org/home/), 4DNucleome (https://www.4dnucleome.org/), Illuminating the Druggable Genome (PHAROS; https://druggablegenome.net/), Knockout Mouse Phenotyping Program (KOMP; https://www.komp.org/), Library of Integrated Network-based Cellular Signatures (LINCS; http://www.lincsproject.org/), Metabolomics Workbench (https://www.metabolomicsworkbench.org/), Integrated Human Microbiome Project (iHMP; https://www.hmpdacc.org/ihmp/), Molecular Transducers of Physical Activity Consortium (MoTRPAC; https://www.motrpac.org/), and the Human BioMolecular Atlas Program (HuBMAP; https://hubmapconsortium.org/).
Despite the creation of these excellent resources, the datasets may be underutilized, and nurse scientists may be unaware of these data and/or the relevance that the data may have for their research interests (Brennan & Bakken, 2015). Once becoming aware of the resources, some nurse scientists may not find the access procedures and other tools intuitive or may otherwise have trouble navigating the information (Learned et al., 2019). Privacy concerns for human subjects present their own challenges (Amann et al., 2019). However, the benefits of accessing large, publicly available omics databases are far-reaching, from providing scientists the statistical power that is needed to generate new hypothesis-driven questions, to allowing the access to additional samples that support independent discoveries (Amann et al., 2019; Brennan & Bakken, 2015; Learned et al., 2019). Data derived from these existing repositories can strengthen the premise of a grant application or could be used as a reference set to design new informatics tools (Amann et al., 2019; Brennan & Bakken, 2015; Learned et al., 2019). Nurse scientists can leverage all these benefits and work, in conjunction with geneticists, statisticians, and bioinformaticists, to bring this information to the scientific community.
One of these public datasets that may be of particular use for the nursing science community is the GTEx. The GTEx project was launched in 2010 and includes information on whole-genome sequencing and RNA-seq data from nearly 1,000 deceased adult donors across 54 non-diseased tissue types ranging from blood to brain and from skin to lung. Some of these tissues included are easily accessed (such as blood), but others (such as brain) are not easily collected. Investigators may use this resource to determine how genotype affects gene expression within and across any of the 54 different tissues. Such information is useful for a variety of projects within the scope of biological and physiological approaches to nursing science. Some investigators may make use of these data to compare expression profiles from diseased tissues obtained from patients to the normal tissues found in the data set. Others may be interested in understanding the downstream effects of a particular genotypic variant on expression in a particular tissue. Still others may be interested in the embedded sample viewer files offered for each tissue.
The purpose of this paper is to describe the process for successfully navigating the GTEx dataset, with the goal to increase the use of this excellent resource among the nursing and health science community to enhance ongoing research. We also provide an exemplar demonstrating successful navigation of the data. The resulting information was used to help grow our own research in neurological injury and disease, by investigating the expression of a dopamine receptor gene across human brain tissues.
Description of GTEX Dataset Navigation
The search engine embedded in the GTEx site allows searches by gene, variant, and tissue (www.gtexportal.org/home/). The portal also houses an image viewer feature. Inquiries can be made through the portal to check sample and tissue distributions, to browse and search data by various parameters, and to query areas of the genome that are associated with expression in a particular tissue (expression quantitative trait loci; eQTL).
The current version of the database was released on August 26, 2019 (GTEx analysis V8: dbGaP accession phs000424.v7.p2). Sample sizes for each tissue type range from four to 706, with both genotype sequencing and RNA-sequencing (expression data) available on each tissue. Details on the sample counts by tissue, along with information on the number of donors per tissue, can be found at https://gtexportal.org/home/tissueSummaryPage. The platforms used for expression data include Illumina TrueSeq RNA sequencing and the Affymetrix Human Gene 1.1 ST Expression Array. Genotype data were collected by whole genome sequencing (HiSeq X; Agilent or ICE target capture), Illumina OMNI 5 M Array or 2.5 M SNP Array, or the Illumina Human Exome SNP Array. Detailed enrollment, consent verification, and standard operating procedures for sample handling and collection procedures can be found on download from https://biospecimens.cancer.gov/resources/sops/library.asp. Analysis methods and procedures can also be found on download from https://gtexportal.org/home/documentationPage#staticTextAnalysisMethods. Overall, the GTEx subjects are 67.1% male and 32.9% female, 84.5% Caucasian, and 12.9% African American. A total of 16.5% fall in the age range of 20–39 years, 15.4% in the 40–49 range, 32.1% in the 50–59 range, and 36% were aged 60 or above. All patients were deceased at the time of tissue collection.
Using the GTEx Portal Tools
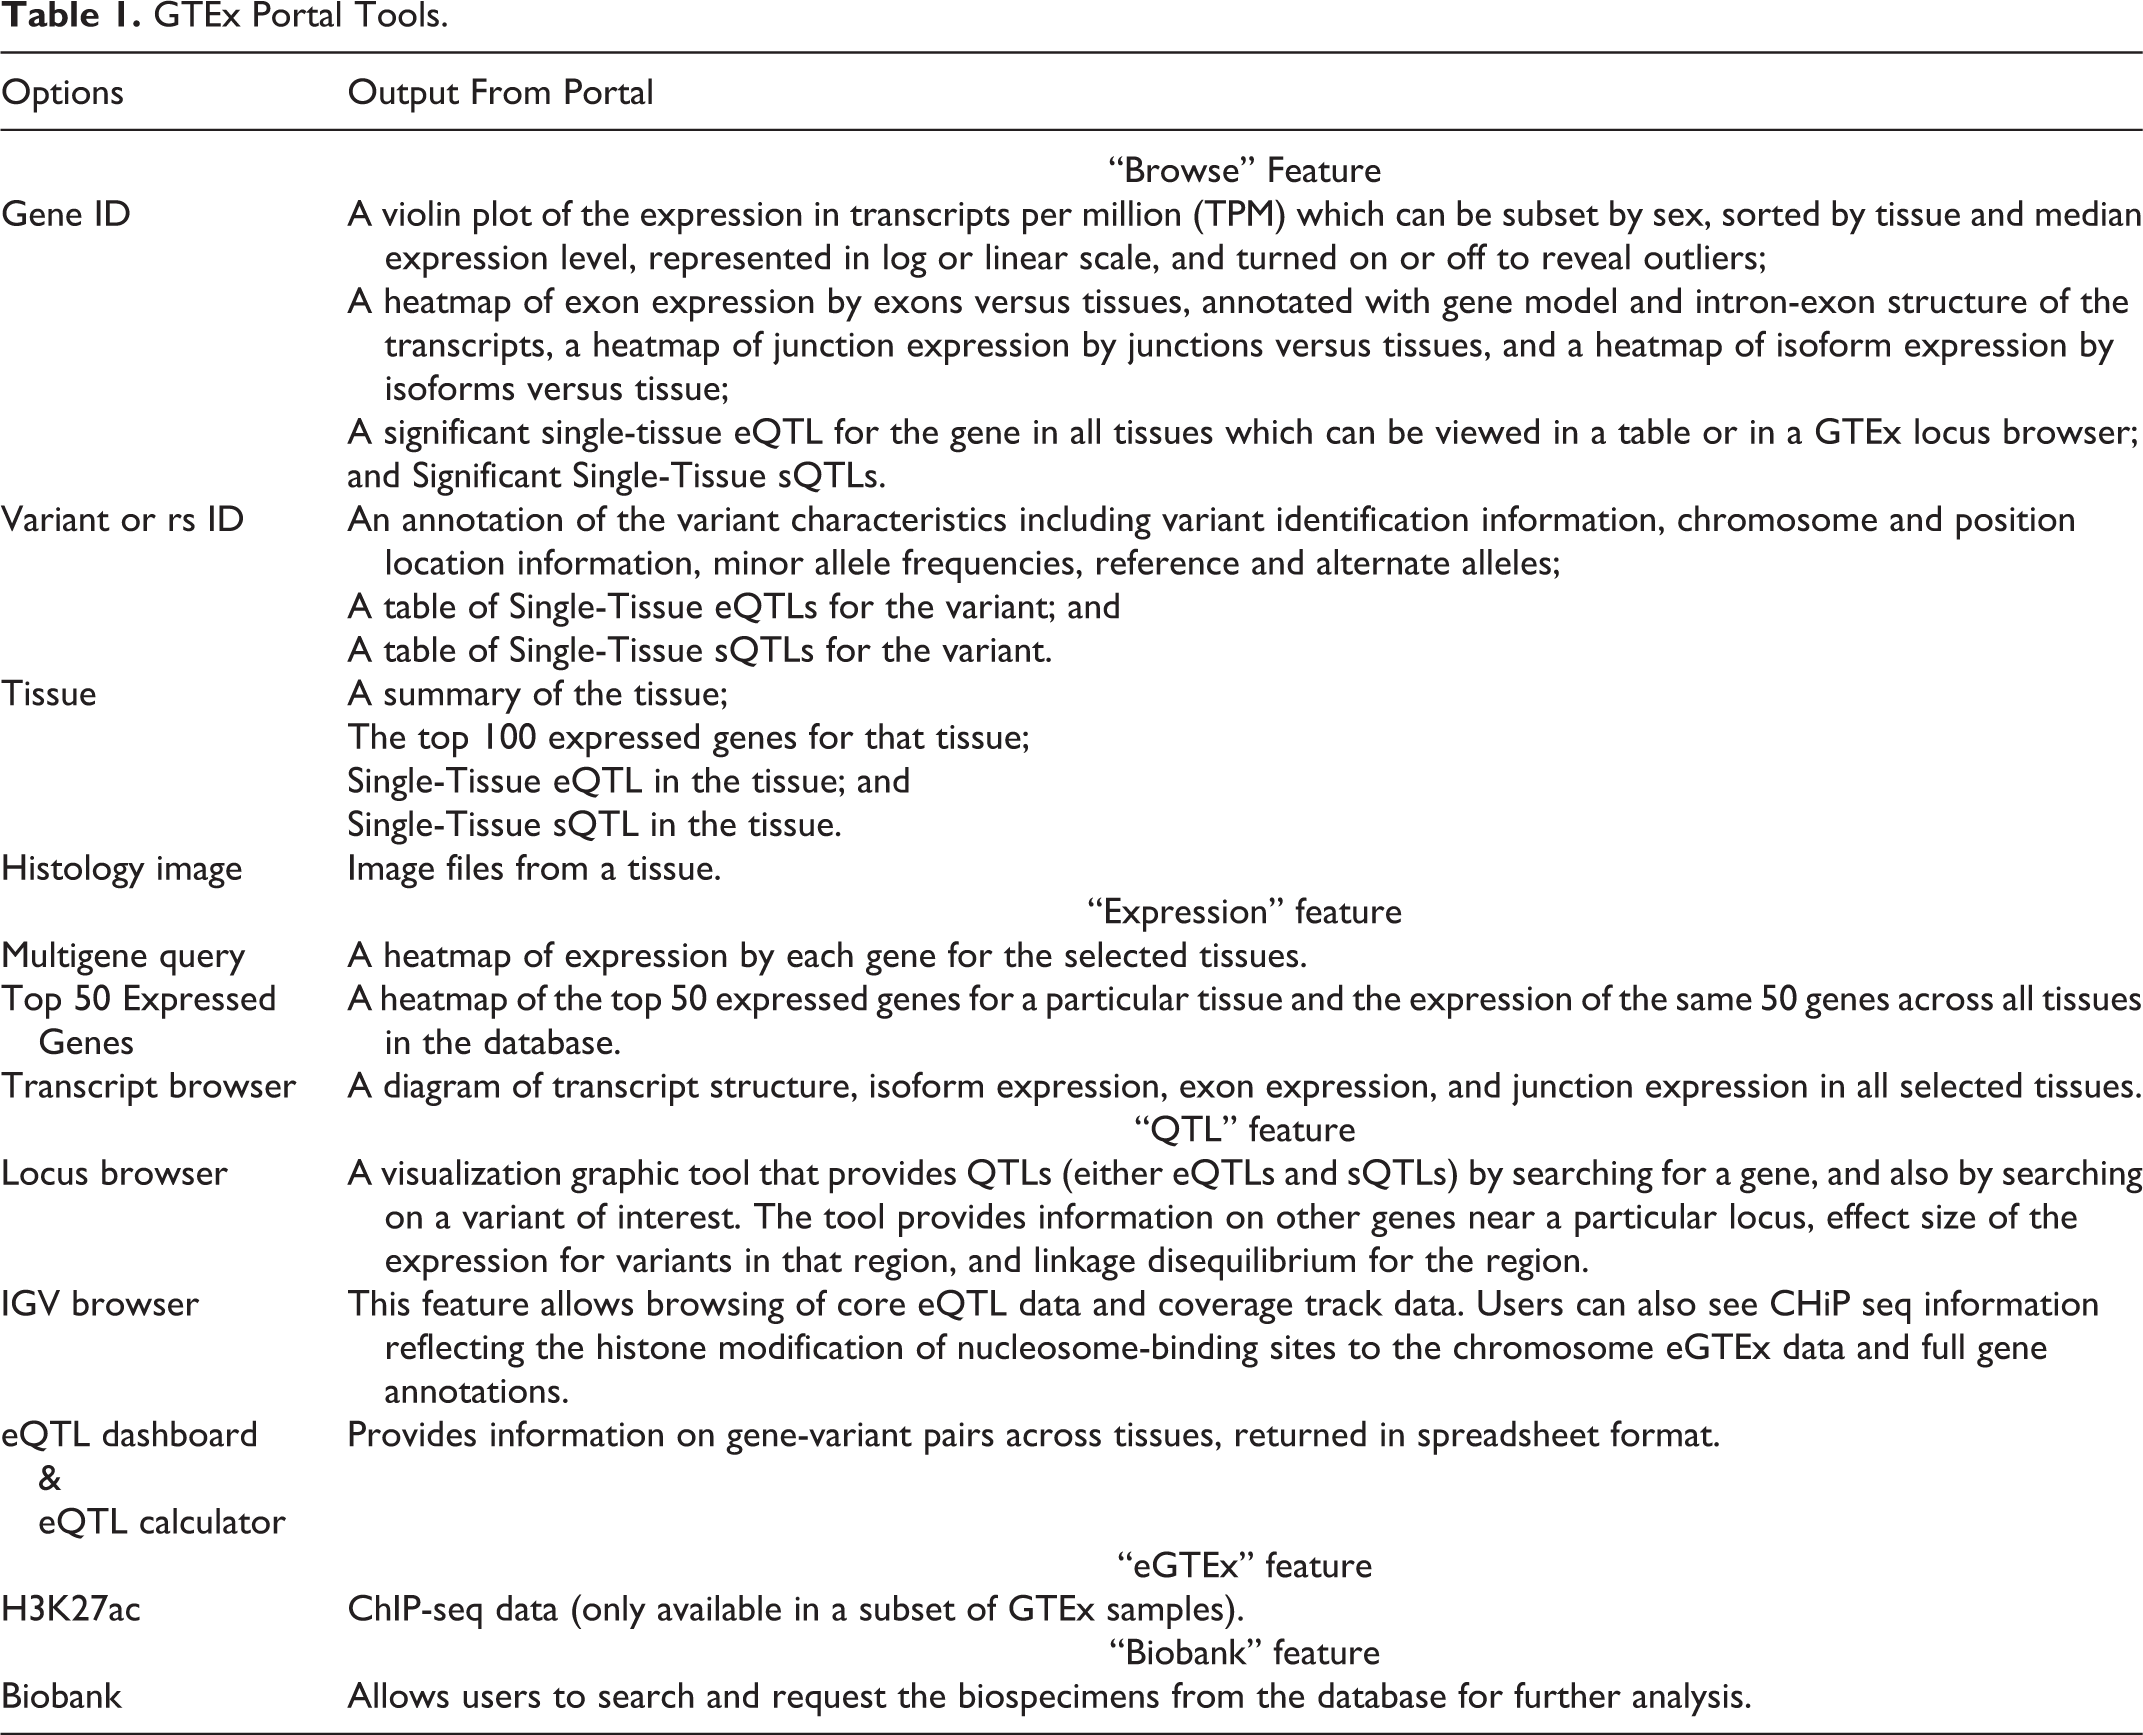
The first pass in using this GTEx dataset is to query the portal tools. There are several search options available (Figure 1 and Table 1).
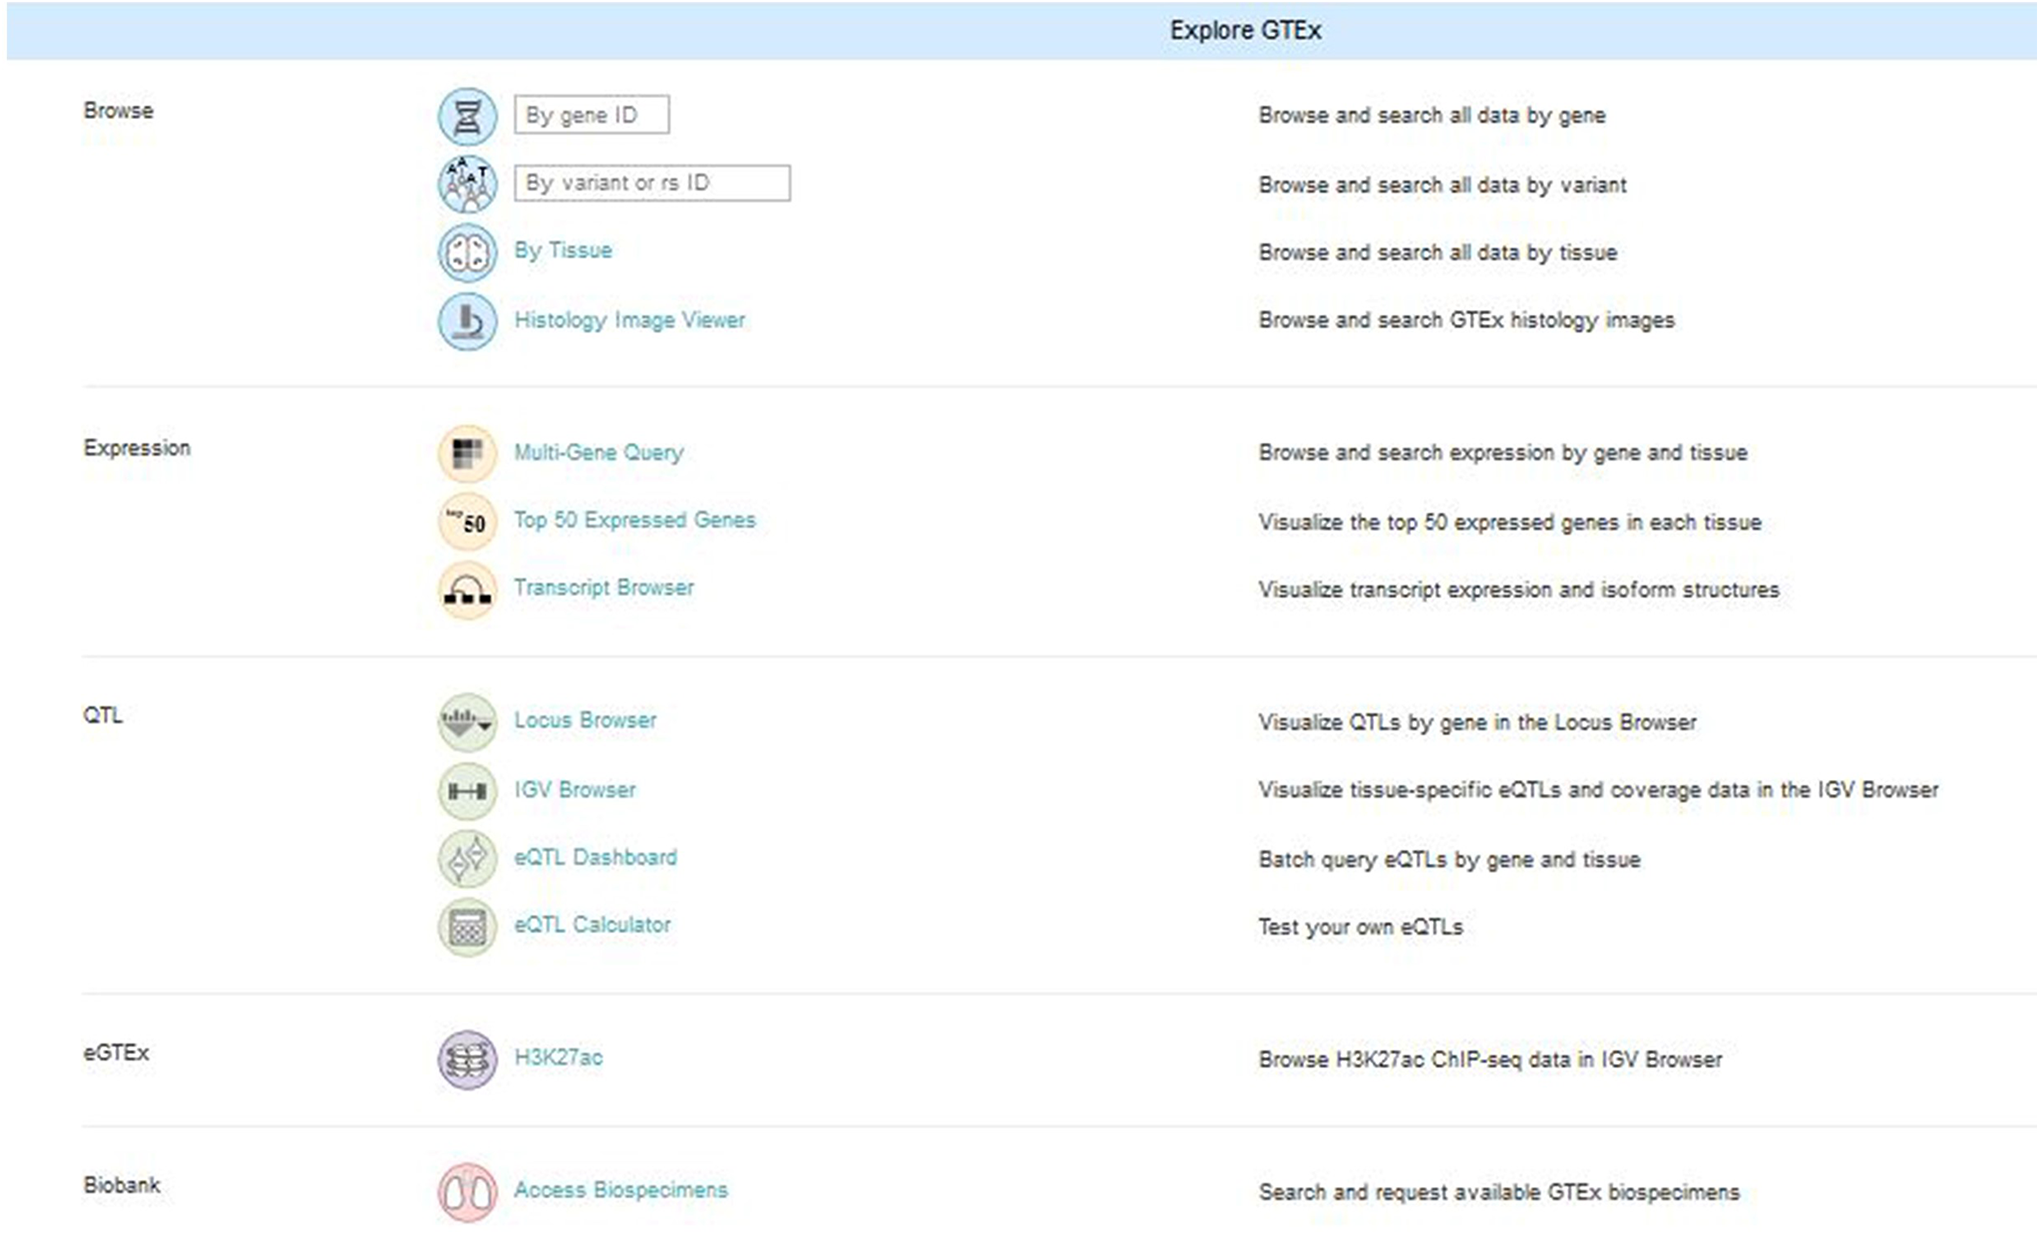
GTEx portal search options.
GTEx Portal Tools.
Limitations of the Portal
Despite all of these highly useful features, there are some limitations of the GTEx portal. One limitation is that users of the GTEx portal cannot directly compare gene and variant expression across two or more tissues concurrently. This is purposeful so as to not mislead users, as careful normalization procedures are needed, along with the knowledge of the number of cells that contributed to the sample pool for the resulting expression data to be correctly interpreted. (See Zhao et al., 2020, for an excellent resource on this topic). Another limitation for the use of GTEx data is that all samples were collected from deceased subjects, which may alter expression data, and must be considered in the interpretation of any results. Furthermore, for clinically relevant work, there are few open access phenotype options in the portal for consideration of expression by demographic variables (such as by sex), and searches cannot be limited to only those of a selected demographic group with the portal options. While the individuals in the dataset are described as generally healthy individuals, clinical phenotype data are not available in the portal to either confirm this description or to describe any prior medical history. If further detail on any clinical history is needed, the portal options rapidly become limiting. For higher level synthesis across tissues, or for selection of particular subgroups of subjects, access to the controlled data set is required.
Requesting Access to GTEx-Controlled Data
Individual investigators seeking access to GTEx-controlled data must apply through the National Center for Biotechnology Information’s (NCBI) database of Genotypes and Phenotypes (dbGaP) at https://dbgap.ncbi.nlm.nih.gov/. Users need to login to their personal dbGaP account to request access and will also need an active and up-to-date NIH eRA commons account (https://public.era.nih.gov/commons/). Applicants must be permanent employees of an institution and are usually tenure-track professors or senior scientists; laboratory staff or students/trainees are not eligible to apply for their own access. Some institutions may require Institutional Review Board approval prior to accessing the data; interested parties should carefully consult with their human subject protections officers and policies early in the process. Procedures that should be followed for an authorized user to access the controlled data have been summarized here (Figure 2). Once access has been granted, full details about accessing GTEx protected data can be found at https://gtexportal.org/home/protectedDataAccess. While authorized users may download smaller controlled-access files from GTEx by simply logging in to their dbGaP account, under the “Authorized Access - My Requests” tab, larger sequence files require additional procedures. For these larger files, the applicant will need a Terra account and an eRA Commons account. A Gen3 account is optional but is required for downloading data without egress fees. Once logged in to the Terra platform, the menu in the upper left of the screen includes a link to the user profile, which allows an option to link the Terra account to an eRA Commons ID. There will be a several-hour delay in syncing the eRA Commons ID and the Terra workspace. Once access has been granted and the accounts are synced, the data will appear as one or more workspaces on the applicant’s Terra workspaces page. The applicant can clone the workspace(s) to the applicant’s own workspace to analyze the data on the cloud or download the data to a local computer following the instructions found at: https://anvilproject.org/learn/reference/gtex-v8-free-egress-instructions. An advantage of this system, unlike previous GTEx access procedures, is that the files will no longer need to be decrypted.
Exemplar of How GTEx Data Can Enhance a Program of Research
In order to demonstrate the utility of this resource, we provide an exemplar from our own research that investigates multi-omic contributions to recovery after neurological disease and injury. In this exemplar, we consider 12 brain tissue samples (amygdala, anterior cingulate cortex, caudate, cerebellar hemisphere, cerebellum, cortex, frontal cortex, hippocampus, hypothalamus, nucleus accumbens, putamen, and substantia nigra) and spinal cord tissue, all available in the GTEx dataset. Our exemplar focuses specifically on the dopamine receptor type 2 (DRD2), a gene known to have high expression in neural tissues. Genetic variations in this gene have been associated with a variety of conditions including stroke (Stanfill et al., 2016, 2017), Parkinson’s disease (McGuire et al., 2011), weight gain (Stanfill, Hathaway, et al., 2015; Stanfill, Conley, et al., 2015) and binge eating (Kessler et al., 2016), with alcohol consumption (Clarke et al., 2017), and substance addiction (Buhler et al., 2015). Our work to date has focused mainly on genotypic changes in DRD2, but it is reasonable to hypothesize that alterations in the sequence could alter this expression in the brain, whether they are directly involved in the coding itself, or whether these variants could act as regulatory variants that alter gene expression and/or splicing (Kaalund et al., 2014; Stanfill & Cao, 2020; Zhang et al., 2007). Such information would provide a biological explanation of the association of the genotype variations with symptoms of neurological disease and could suggest further functional and mechanistic follow-up. However, it is not possible to obtain brain tissue samples from living human subjects, and data are lacking on how the variations affect expression in different regions of the brain. The GTEx dataset provides this information, using brain and spinal tissues obtained from deceased subjects.
Use of Portal Tools
For this work, we began by using the portal tools for our gene of interest (DRD2). Our tissues of interest were any of the 12 different brain tissues listed and spinal cord, as represented in the GTEx dataset. First, we used the options under the GTEx portal “Browse.” From this portal option, we first searched by gene ID alone (DRD2). This initial search returned a violin plot of gene expression across tissues (Supplementary Figure 1). The portal can also return more detailed information, such as the median read count per nucleotide base, intron-exon structure in the mRNA (Supplementary Figure 2), junction expression (Supplementary Figure 3), and mRNA isoform expression (Supplementary Figure 4).
Within the GTEx portal “Expression,” in the GTEx Multi-Gene Query, we could visualize data from DRD2 and also consider any other genes of interest. In our example, ankyrin repeat and kinase domain containing 1 (ANKK1) could be added, as it is closely linked both by physical distance in the genome and by function to that of DRD2. When entering these two genes versus the selected tissues, expression data across the tissues are visualized by a heatmap. A particular tissue of interest can be selected or a group of several tissues can be selected. Under the Top 50 Expressed Genes option, a tissue of interest can be selected, such as Brain-Amygdala. Then a heatmap is provided of the top expressed genes of the selected tissue in comparison to the expression of these same 50 genes over all other tissues in the dataset.
Use of Controlled GTEx Data
Although the portal options were useful in visually exploring the data, for our team, the full dataset was needed to simultaneously determine expression of multiple genes and multiple genetic variants in a pathway (for instance, for all of the genes within the dopaminergic pathway, with specific variants considered within each gene), and across multiple different tissues. While we could consider each of the tissues of interest using the portal options, we were not able to directly compare or investigate correlations in expression simultaneously across tissues. Furthermore, we wished to obtain more specific phenotype data for each donor. After following the procedures outlined in Figure 2 and obtaining Institutional Review Board approval from the University of Tennessee Health Science Center (#19-06937-NHSR), under dbGaP Project #23636 we were able to gain access to the controlled data of the set: General Research Use (phs000424.v8.p2.c1), NHGRI. Obtaining access to the controlled data set also allowed us to include some basic demographic characteristics for sample donors (e.g., age, sex, race, and body mass index). A total of 288 subjects were included in the analysis (28% female, 91% Caucasian, mean age of 60 years (range 53–65 years), and mean BMI of 27.29 (range 24.4–30.9). Given that DRD2 is ubiquitous across the brain, we not surprisingly found that the expression level is highly correlated across these tissues, which were measured by Spearman correlation (Figure 3). Next, we further investigated the overlap of the most significant variants associated with DRD2 expression across anterior cingulate cortex, cortex, frontal cortex, and hippocampus. These regions were selected because they were high expressors of DRD2, and the function of these brain regions makes them key for phenotypes of interest. For each variant in DRD2, we tested association of the number of alternative alleles with non-zero expression of DRD2 by rank-based Spearman correlation in each of the four tissues. The Benjamini and Hochberg method (Benjamini & Hochberg, 1995) was used to control false discovery rate and the cutoff value was set to 0.1. From this, we found that nine variants in DRD2 were significantly associated with expression levels in all four of these tissues (Supplementary Figure 5). There were 15 variants that were specifically associated only with DRD2 expression in the cortex, 26 variants that were significantly associated with expression in cortex, anterior cingulate cortex, and hippocampus, and 28 significantly associated with expression in frontal cortex, hippocampus, and cortex.
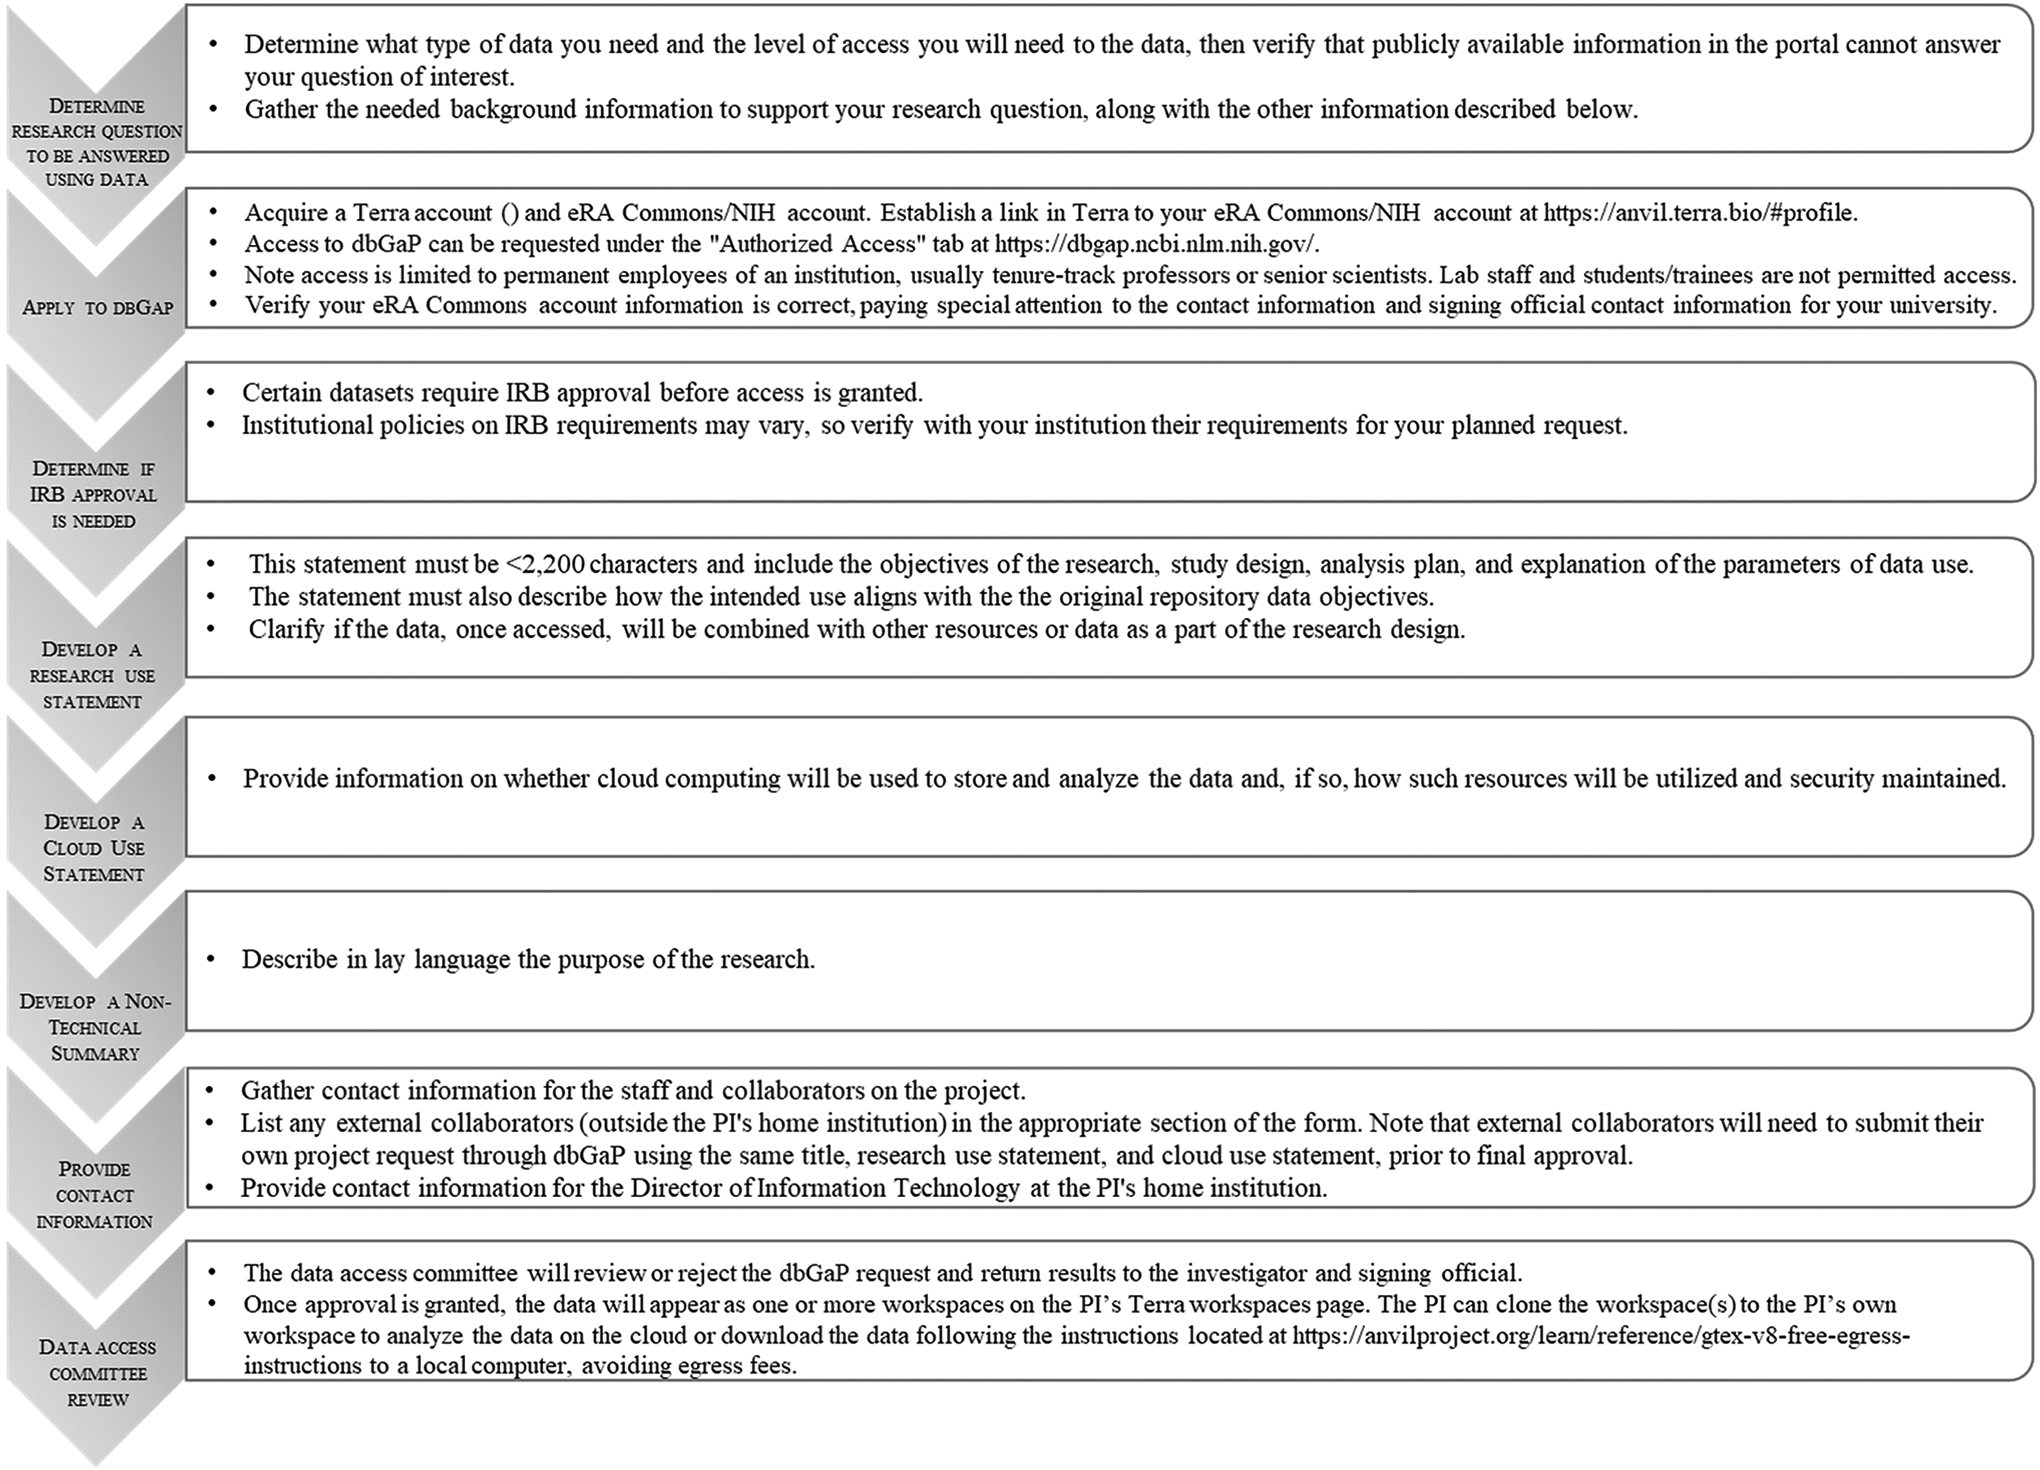
Summary of procedures required to access GTEx-controlled data.
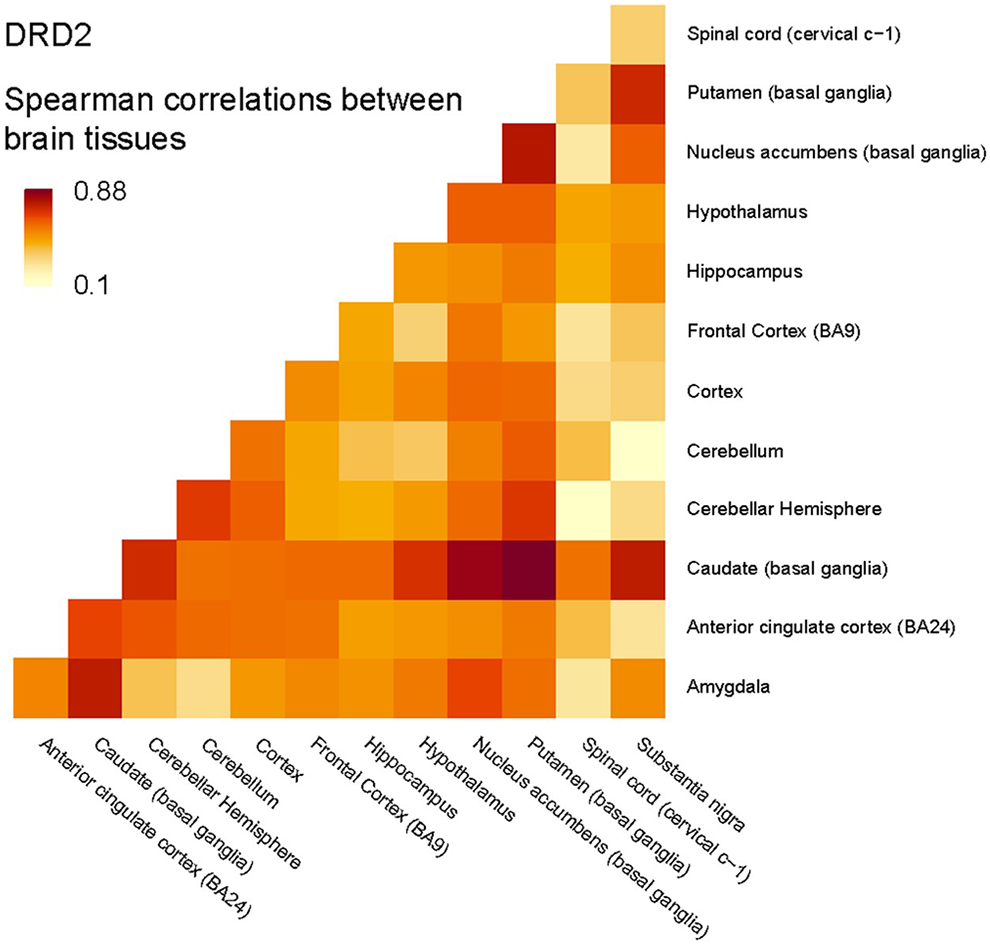
Spearman correlations between brain tissues.
As mentioned previously, our team’s work is in neurologic injury and disease, and DRD2 variations are well-known to be associated with these conditions (Buhler et al., 2015; Clarke et al., 2017; McGuire et al., 2011; Stanfill & Cao, 2020; Stanfill et al., 2016, 2017). The information provided by the GTEx portal has enhanced our program of research by demonstrating how DRD2 is expressed across several different brain tissues that cannot be easily accessed in our living subjects. By expanding our inquiry to the controlled dataset, we have learned that a set of specific variants in DRD2 are associated with alterations in expression across our key brain regions of interest. Such information has enhanced our program of research by generating new hypotheses and suggesting new questions for our group. For instance, could these variants that alter expression also be associated with the likelihood of specific symptoms in our patients? When we consider the function of each brain region, we can hypothesize on particular symptoms that might occur, if expression were altered in these areas. Use of the GTEx dataset provides the evidence to justify further investigations in clinical populations. As another example, since genotype can be measured in more accessible tissues than brain, could we use this information to pre-treat at-risk persons to prevent the development of a new disease? Or would such biomarkers have the potential to become future diagnostic and therapeutic targets? While our group continues to mine the controlled dataset and compare our discoveries with other work to answer such questions, we hope that this exemplar can drive the development of similar types of questions for other research teams.
Discussion
The GTEx dataset is a highly useful resource offered by the NIH Common Fund to provide large-scale genotype and expression data for health research. Although there is a learning curve in effectively using the portal options to query the database, such an investment of time can lead to large gains in enhancing existing research areas. The GTEx dataset can be helpful in testing the feasibility of proposed research questions, in generating new hypothesis-driven questions, and in supporting the findings from other projects. Here, we have described the process needed to successfully navigate the GTEx dataset portal tools and request access to the controlled data. We are hopeful that this information will increase the use of this excellent resource among the nursing and health science community. For additional information and instructional videos, please see https://gtexportal.org/home/videos.
Supplemental Material
Supplemental Material, sj-jpg-1-brn-10.1177_1099800421994186 - Enhancing Research Through the Use of the Genotype-Tissue Expression (GTEx) Database
Supplemental Material, sj-jpg-1-brn-10.1177_1099800421994186 for Enhancing Research Through the Use of the Genotype-Tissue Expression (GTEx) Database by Ansley Grimes Stanfill and Xueyuan Cao in Biological Research For Nursing
Supplemental Material
Supplemental Material, sj-jpg-2-brn-10.1177_1099800421994186 - Enhancing Research Through the Use of the Genotype-Tissue Expression (GTEx) Database
Supplemental Material, sj-jpg-2-brn-10.1177_1099800421994186 for Enhancing Research Through the Use of the Genotype-Tissue Expression (GTEx) Database by Ansley Grimes Stanfill and Xueyuan Cao in Biological Research For Nursing
Supplemental Material
Supplemental Material, sj-jpg-3-brn-10.1177_1099800421994186 - Enhancing Research Through the Use of the Genotype-Tissue Expression (GTEx) Database
Supplemental Material, sj-jpg-3-brn-10.1177_1099800421994186 for Enhancing Research Through the Use of the Genotype-Tissue Expression (GTEx) Database by Ansley Grimes Stanfill and Xueyuan Cao in Biological Research For Nursing
Supplemental Material
Supplemental Material, sj-jpg-4-brn-10.1177_1099800421994186 - Enhancing Research Through the Use of the Genotype-Tissue Expression (GTEx) Database
Supplemental Material, sj-jpg-4-brn-10.1177_1099800421994186 for Enhancing Research Through the Use of the Genotype-Tissue Expression (GTEx) Database by Ansley Grimes Stanfill and Xueyuan Cao in Biological Research For Nursing
Supplemental Material
Supplemental Material, sj-jpg-5-brn-10.1177_1099800421994186 - Enhancing Research Through the Use of the Genotype-Tissue Expression (GTEx) Database
Supplemental Material, sj-jpg-5-brn-10.1177_1099800421994186 for Enhancing Research Through the Use of the Genotype-Tissue Expression (GTEx) Database by Ansley Grimes Stanfill and Xueyuan Cao in Biological Research For Nursing
Footnotes
Acknowledgment
The authors would like to thank Mr. Curtis Roby for his editorial assistance with this article.
Author Contributions
Stanfill, A contributed to the conception, design, acquisition, analysis and interpretation. She drafted the manuscript, critically revised the manuscript, gave final approval, and agrees to be accountable for all aspects of work, ensuring integrity and accuracy. Cao, X contributed to conception, design, acquisition, analysis, and interpretation. He drafted the manuscript, critically revised the manuscript, gave final approval, and agrees to be accountable for all aspects of work ensuring integrity and accuracy.
Data Accessibility Statement
The raw data used in this work are available upon request to the
Declaration of Conflicting Interests
The author(s) declared no potential conflicts of interest with respect to the research, authorship, and/or publication of this article.
Funding
The author(s) disclosed receipt of the following financial support for the research, authorship, and/or publication of this article: This research was funded by the Office of the Director, National Institutes of Health (OD), with National Institutes of Health/National Institute of Nursing Research Grant number R01NR017407-02S1 (PI: Stanfill).
Supplemental Material
Supplemental material for this article is available online.
References
Supplementary Material
Please find the following supplemental material available below.
For Open Access articles published under a Creative Commons License, all supplemental material carries the same license as the article it is associated with.
For non-Open Access articles published, all supplemental material carries a non-exclusive license, and permission requests for re-use of supplemental material or any part of supplemental material shall be sent directly to the copyright owner as specified in the copyright notice associated with the article.