
Abstract
Finite element modelling has been used to study the forming mechanism of thermoplastic fibre metal laminates (FMLs) at elevated temperatures. Experiments on thermoplastic FMLs with the same settings as the model have been performed, whilst for the first-time digital image correlation (DIC) strain measurements were carried out on the edge of the specimens during the thermoforming process. The finite element model was validated by comparing its outputs with the DIC data using the orthogonal decomposition approach. The shape of the curved tip and the damage on the cohesive bonding surface were measured and compared to model results. A comprehensive understanding was acquired of the forming mechanism of FMLs. The validated model demonstrated good predictions of strain field evolution, interlayer damage, and curved tip radius of specimens at different temperatures. The development of validated models may contribute to the industrial application of FMLs by enabling manufacturers to confidently optimise forming quality whilst maintaining low operating costs.
Keywords
Introduction
Fibre Metal Laminates (FMLs) are hybrid composites bonding metallic sheets and fibre-reinforced composite matrix together. In engineering applications, FMLs have advantages compared to conventional monolithic materials as they have high: specific strength, specific stiffness, fatigue resistance and damage tolerance. Thus, the wider application of FMLs may contribute to the reduction of operating costs and emissions of flight vehicles. The major limitations to the application of FMLs lies in their high manufacturing costs and cycle-times. Therefore, innovative constituents, structures, and manufacturing techniques for FMLs are needed to reduce these costs and cycle-times. Recently, significant improvements in FMLs have been found by replacing the conventional thermoset polymer matrix with a thermoplastic polymer matrix. 1 Thermoplastic FMLs are reshapeable, which means they can be formed to desired shapes from flat sheets with an integral forming process such as deep-drawing, similar to metal materials, providing them with a lower cycle-time and manufacture cost compared to thermoset based FMLs.
Thermoplastic FMLs combine metal sheets and fibre reinforced plastic sheets with diverse mechanical properties, which bring challenges to the forming quality. The lower ultimate strain of fibre reinforced plastic sheets than metal sheets may cause the early failure of the former. 2 Interlayer delamination may be caused by the difference in material properties of the constituent materials under elevated temperature, including the coefficients of thermal expansion, the viscoelastic behaviour of polymer, metallic elastic-plastic behaviour, as well as interlaminar tension and shear strengths.3–5 To improve the formability, the potential factors affecting the quality of FMLs have to be investigated. The selection of constituent metal and composite materials has been associated with the formability of FMLs, as the use of materials with higher ductility may minimise the defects in the forming process from both tearing and wrinkling.6–8 The control of the forming temperature is a significant method to improve the formability, as the material properties vary with temperature. An increase in temperature results in reduced stiffness and increased ductility of the material. The final products formed under a relatively higher temperature showed less cracking damage caused by the tensile stresses and less distortion such as spring-back caused by the high elastic modulus.9,10 However, high forming temperatures can result in variations in the mechanical properties of the composite matrix due to it exceeding the glass transition temperature. An excessively high forming temperature can also result in degradation of the strength of the bonding interface between the metal and composite matrix, causing delamination between plies. Therefore, the forming temperature should be controlled in an appropriate temperature window during the forming process.11,12
The internal structure also influences the mechanical properties and formability of FMLs. The 2/1 lay-up, with two metal skins and one fibre-reinforced composite core, has been the primary lay-up for FMLs in previous studies. The use of metal skins thicker than the composite core reduces the severity of wrinkling,8,13 but increases the amount of spring-back in bending areas. The use of a composite core thicker than the metal skins slightly reduces the amount of springback,10,11 but raises the probability of fracture due to the increased tensile strength and thickness reduction of the metal skins. 14 The lay-up sequence of composite laminates with reinforced unidirectional (UD) or woven fibres also affects the formability of FMLs as they provide anisotropic material properties to the structure. It has been shown in a previous study that the variation of 0° and 90° oriented UD glass fibres with respect to the bending direction has a remarkable influence on the degree of spring-back after bending. 10 FMLs with [45°/-45°] oriented woven glass fibres have shown a dramatically higher allowable tangential strain in the bending area compared to [0°/90°] oriented fibres, enabling greater elongation, lower forming loads and reduced spring-back. 11 FMLs with a carbon fibre reinforced polymer lay-up of [0°/45°/90°/-45°] at their core have a higher degree of isotropy and thus show less wrinkling and higher thickness uniformity compared to counterparts with a [0°/90°]2 lay-up. 15
Except for the internal structure, the optimization of the mould design has also been studied for the improvement of forming quality of FMLs. A large bending angle of FMLs formed by moulds has been found to increase the risk of cracking on the outer metal skin because of the high longitudinal tensile strains. 10 This risk can be relieved by proper selection of the punch mould tip radius. 14 The blank holder force is another key factor affecting the formability, as a low blank holder force results in wrinkling on the flange and sidewall area, and a high blank holder force can cause tearing fracture on both the metal and reinforced fibre materials.2,16,17 Similar to the temperature, the blank holder force should be controlled within a proper working range during the forming process.
The finite element method (FEM) has been widely used in the study of the mechanical properties and formability of FMLs,2,5,16–22 as the FEM is able to simulate the complex behaviour of hybrid materials in FMLs with a low operational cost. To prove the reliability of the models, they need to be validated by comparing them with experimental data to ensure the difference between the simulation and experiment is within an acceptable tolerance. In previous studies, the extent of wrinkling and tearing defects, and the thickness variation of the final products were used to validate the models.2,5,16,17 However, the reliability of the above validation method was low because the experimental data was only acquired from a small number of features rather than an entire deformation field. This means defects and mechanics are not thoroughly assessed. Digital image correlation (DIC) is a non-contact, full-field optical method which is particularly useful for displacement and strain measurements. It has been used to study variations in the strain field during the deformation of FMLs and related materials.23–26 However, the technique has not been used to analyse the deformation mechanism of FMLs during the thermo-forming process.
Apart from finite element modelling, several other numerical methods can be leveraged in the study on the mechanical properties of composite materials, such as finite difference method, Bezier multi-step method, and differential quadrature method. Finite difference method solves differential equations by approximating derivatives using difference equations, which is particularly suitable for solving problems in structural mechanics defined on regular grids. 27 Bezier multi-step method uses Bezier curves for solving differential equations in multiple steps, which has showed advantages for solving time-dependent problems. 28 Differential quadrature method approximates the solution of the partial differential equations using a weighted sum of function values at certain discretized points, which has been applied in structural and thermal analysis. 29 In this study, FEM was selected due to its robust capability in simulating complex material behaviours and boundary conditions in the thermal forming of FMLs.
The introduction of DIC measurements into the forming experiments of FMLs enables a quantitative validation of FEM models based on the comparison of strain at the critical deformation zone. Quantitative validation provides greater confidence in the reliability of a model, as it demonstrates its consistency with the physical behaviour shown in the experiments. The quantitatively validated model can then be used to predict the results of forming conditions that have not been experimentally tested, enabling optimization of FML forming with a low operating cost. In this study, DIC measurements were used to acquire strain fields on the edge of FML specimens during a forming process under different conditions. A FEM model was built to simulate the same forming process as the experiment. The model was validated by comparing its outputs with the DIC data using the orthogonal decomposition approach. 30 The model was further assessed by comparing simulation outputs with experimental measurements of the surface shape changes and interlayer damage.
Experimental method
The experimental work can be divided into two main parts. Firstly, FML specimens were prepared in the form of flat sheets, and then the sheets were formed at temperature with a V-shape forming mould under varying conditions. The flat FML sheets were produced from two 1.6 mm thickness aluminium 2024-O skin layers, two pieces of 0.75 mm thickness woven glass fibre + polyamide 6 (PA6) core layers (65G-PA6, Comfil, Denmark), and two pieces of 0.55 mm thickness PA6 bonding support layers between the skin and core layers. The selection of these thicknesses was made in order to produce FMLs of around 5 mm to 5.5 mm total thickness, such that the edge area was large enough for the DIC measurements. The thickness of the composite laminate is close to that of the aluminium laminates in order to minimise the probability of facture and the amount of spring-back of specimens at the same time. The raw component materials were cut into 250 mm by 225 mm sheets to fit the size of the hot press (APV-2525, Meyer, Germany) for bonding the materials into a FML flat sheet. Before pressing, the bonding quality of the aluminium was enhanced by surface anodization.31,32 Here, a 10 – 15 % sulphuric acid anodization (performed by Karas Plating ltd, UK) was used for the surface treatment of the aluminium plates. After anodization, the flat plates were stacked in a hot press with the sequence of Al/PA6/GF + PA6 prepreg/GF + PA6 prepreg/PA6/Al. The materials were pressed under a pressure of 0.35 MPa and were heated to 220°C with a heating rate of 10°C per minute to ensure the PA6 was just melted during the pressing process. After reaching the target temperature, the pressure was maintained for 1 hour under a stable temperature between 220°C and 223°C to create a good bond between the layers. The pressing temperature was no more than 223°C to prevent too much PA6 from being squeezed out of the laminate. The plates were then naturally cooled down to room temperature, and then the pressure was released. The FML flat plates were finally cut into 120 mm by 25 mm flat specimens with an average thickness of 5.3 mm using a waterjet cutting machine (Maxiem Waterjets 1530, OMAX, USA). A cross-section through one of the flat FML specimens is shown in Figure 1. A cross-section view through a flat FML specimen prior to forming. Four reinforcing glass fibre layers and two PA6 bonding support layers can be seen.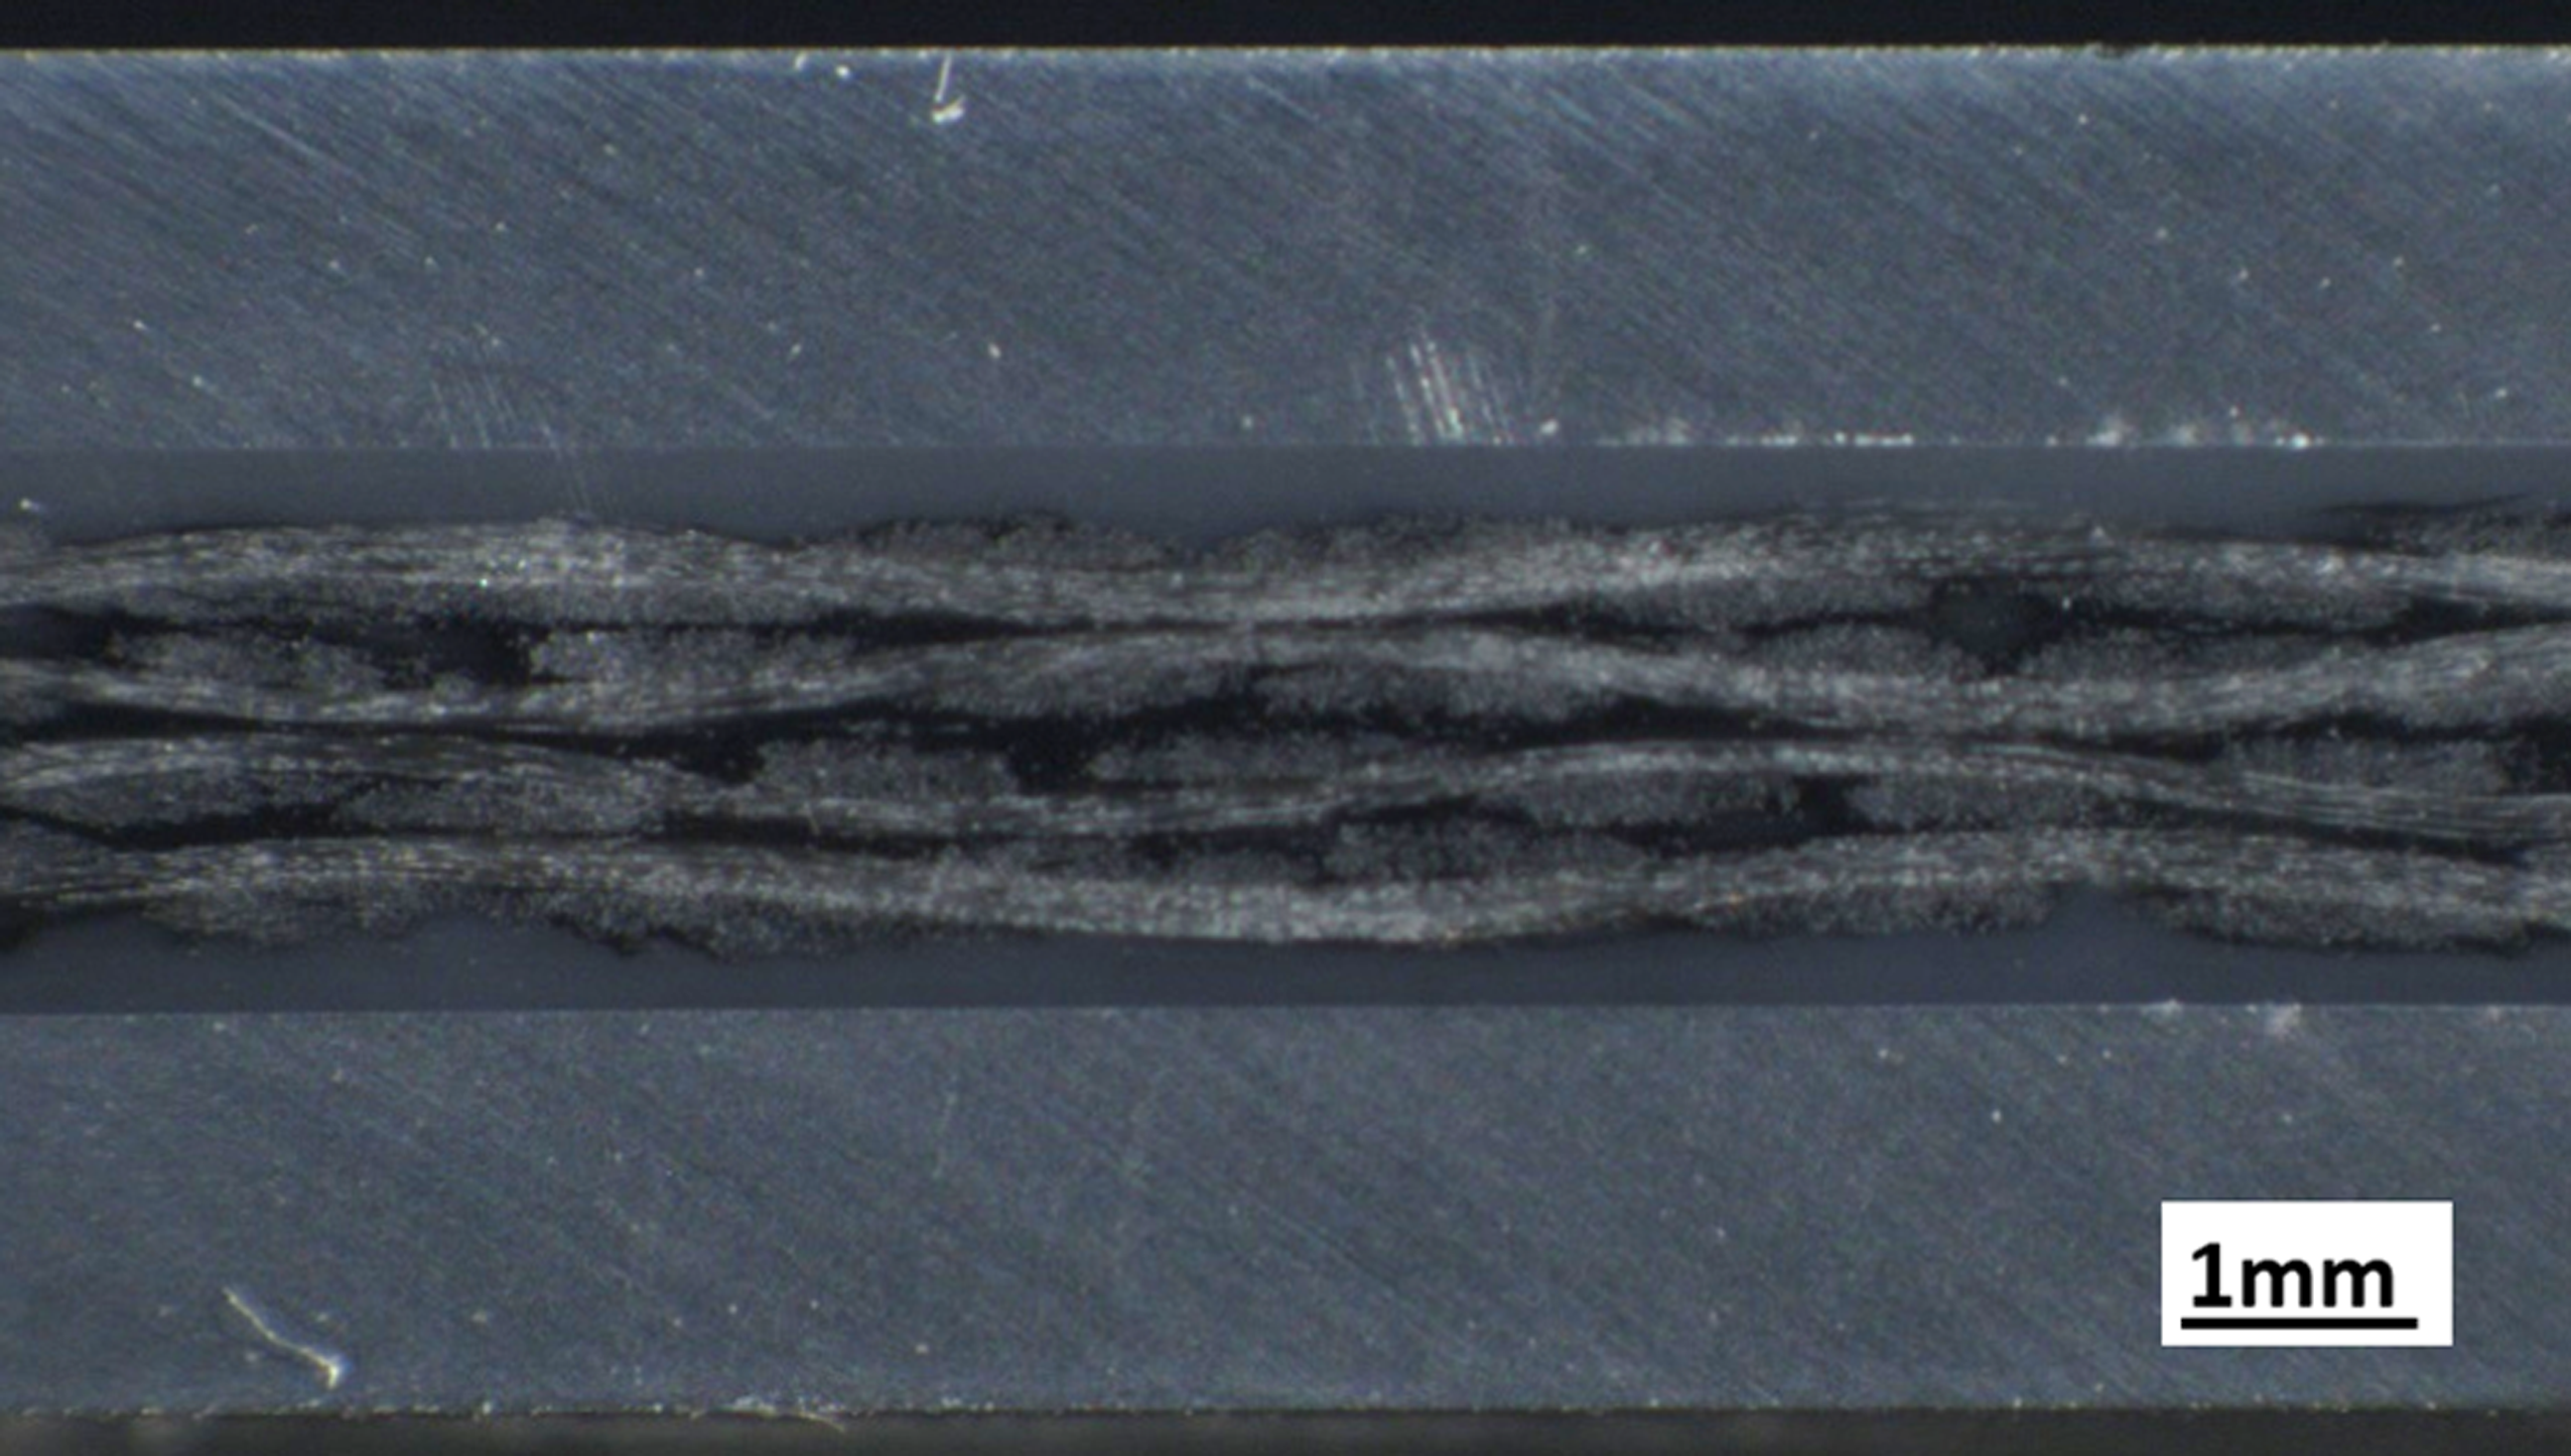
To form the flat FML specimens into a V-shape, a pair of moulds with a bending angle of 90° and a punch radius of 4 mm were fixed onto a 200-ton hydraulic press (P.J Hare Ltd, UK). The bending angle of 90° was chosen as it is the maximum corner angle that would be found in most shell structures. The dimensions of the moulds are shown in Figure 2. The lower mould consisted of a pair of stoppers to fix the specimens in the correct position. Four cylindrical thermo-statically controlled heaters (Max K, ELMATIC, UK) were mounted inside four pre-drilled holes in the moulds to enable temperature control. The radii and positions of the holes are shown in Figure 2. Four thermocouples were fixed to the moulds to ensure that the specimen can be uniformly heated, and two thermocouples were fixed on the specimen to monitor the forming temperature throughout the process. A microbolometer (Thermoimager TIM VGA, Micro-epsilon, Germany) was also used to monitor the temperature variation of the entire mould area. During the forming process, the specimen was fixed in the mould and pre-heated to the target temperature by the heaters. The pre-heating ended and the forming experiment started when the temperature of the specimens reached the target temperature, with a temperature tolerance of ±1°C. In the forming process, the specimen was pressed by the mould into a V-shape at a pressing speed of 2 mm/s. The power of the heating system was controlled in order to minimise the temperature variations during pressing and maintain a stable temperature for 2 minutes after the end of the pressing process. Then the heaters were turned off and the specimen was allowed to cool naturally to room temperature with the press closed. Dimensions of the V-shape forming moulds and the positions of holes for heaters (top), and the experimental setup of the moulds within the press, annotated to show: the specimen, heaters, thermocouples, and DIC system (bottom). The thickness of the moulds was 60 mm.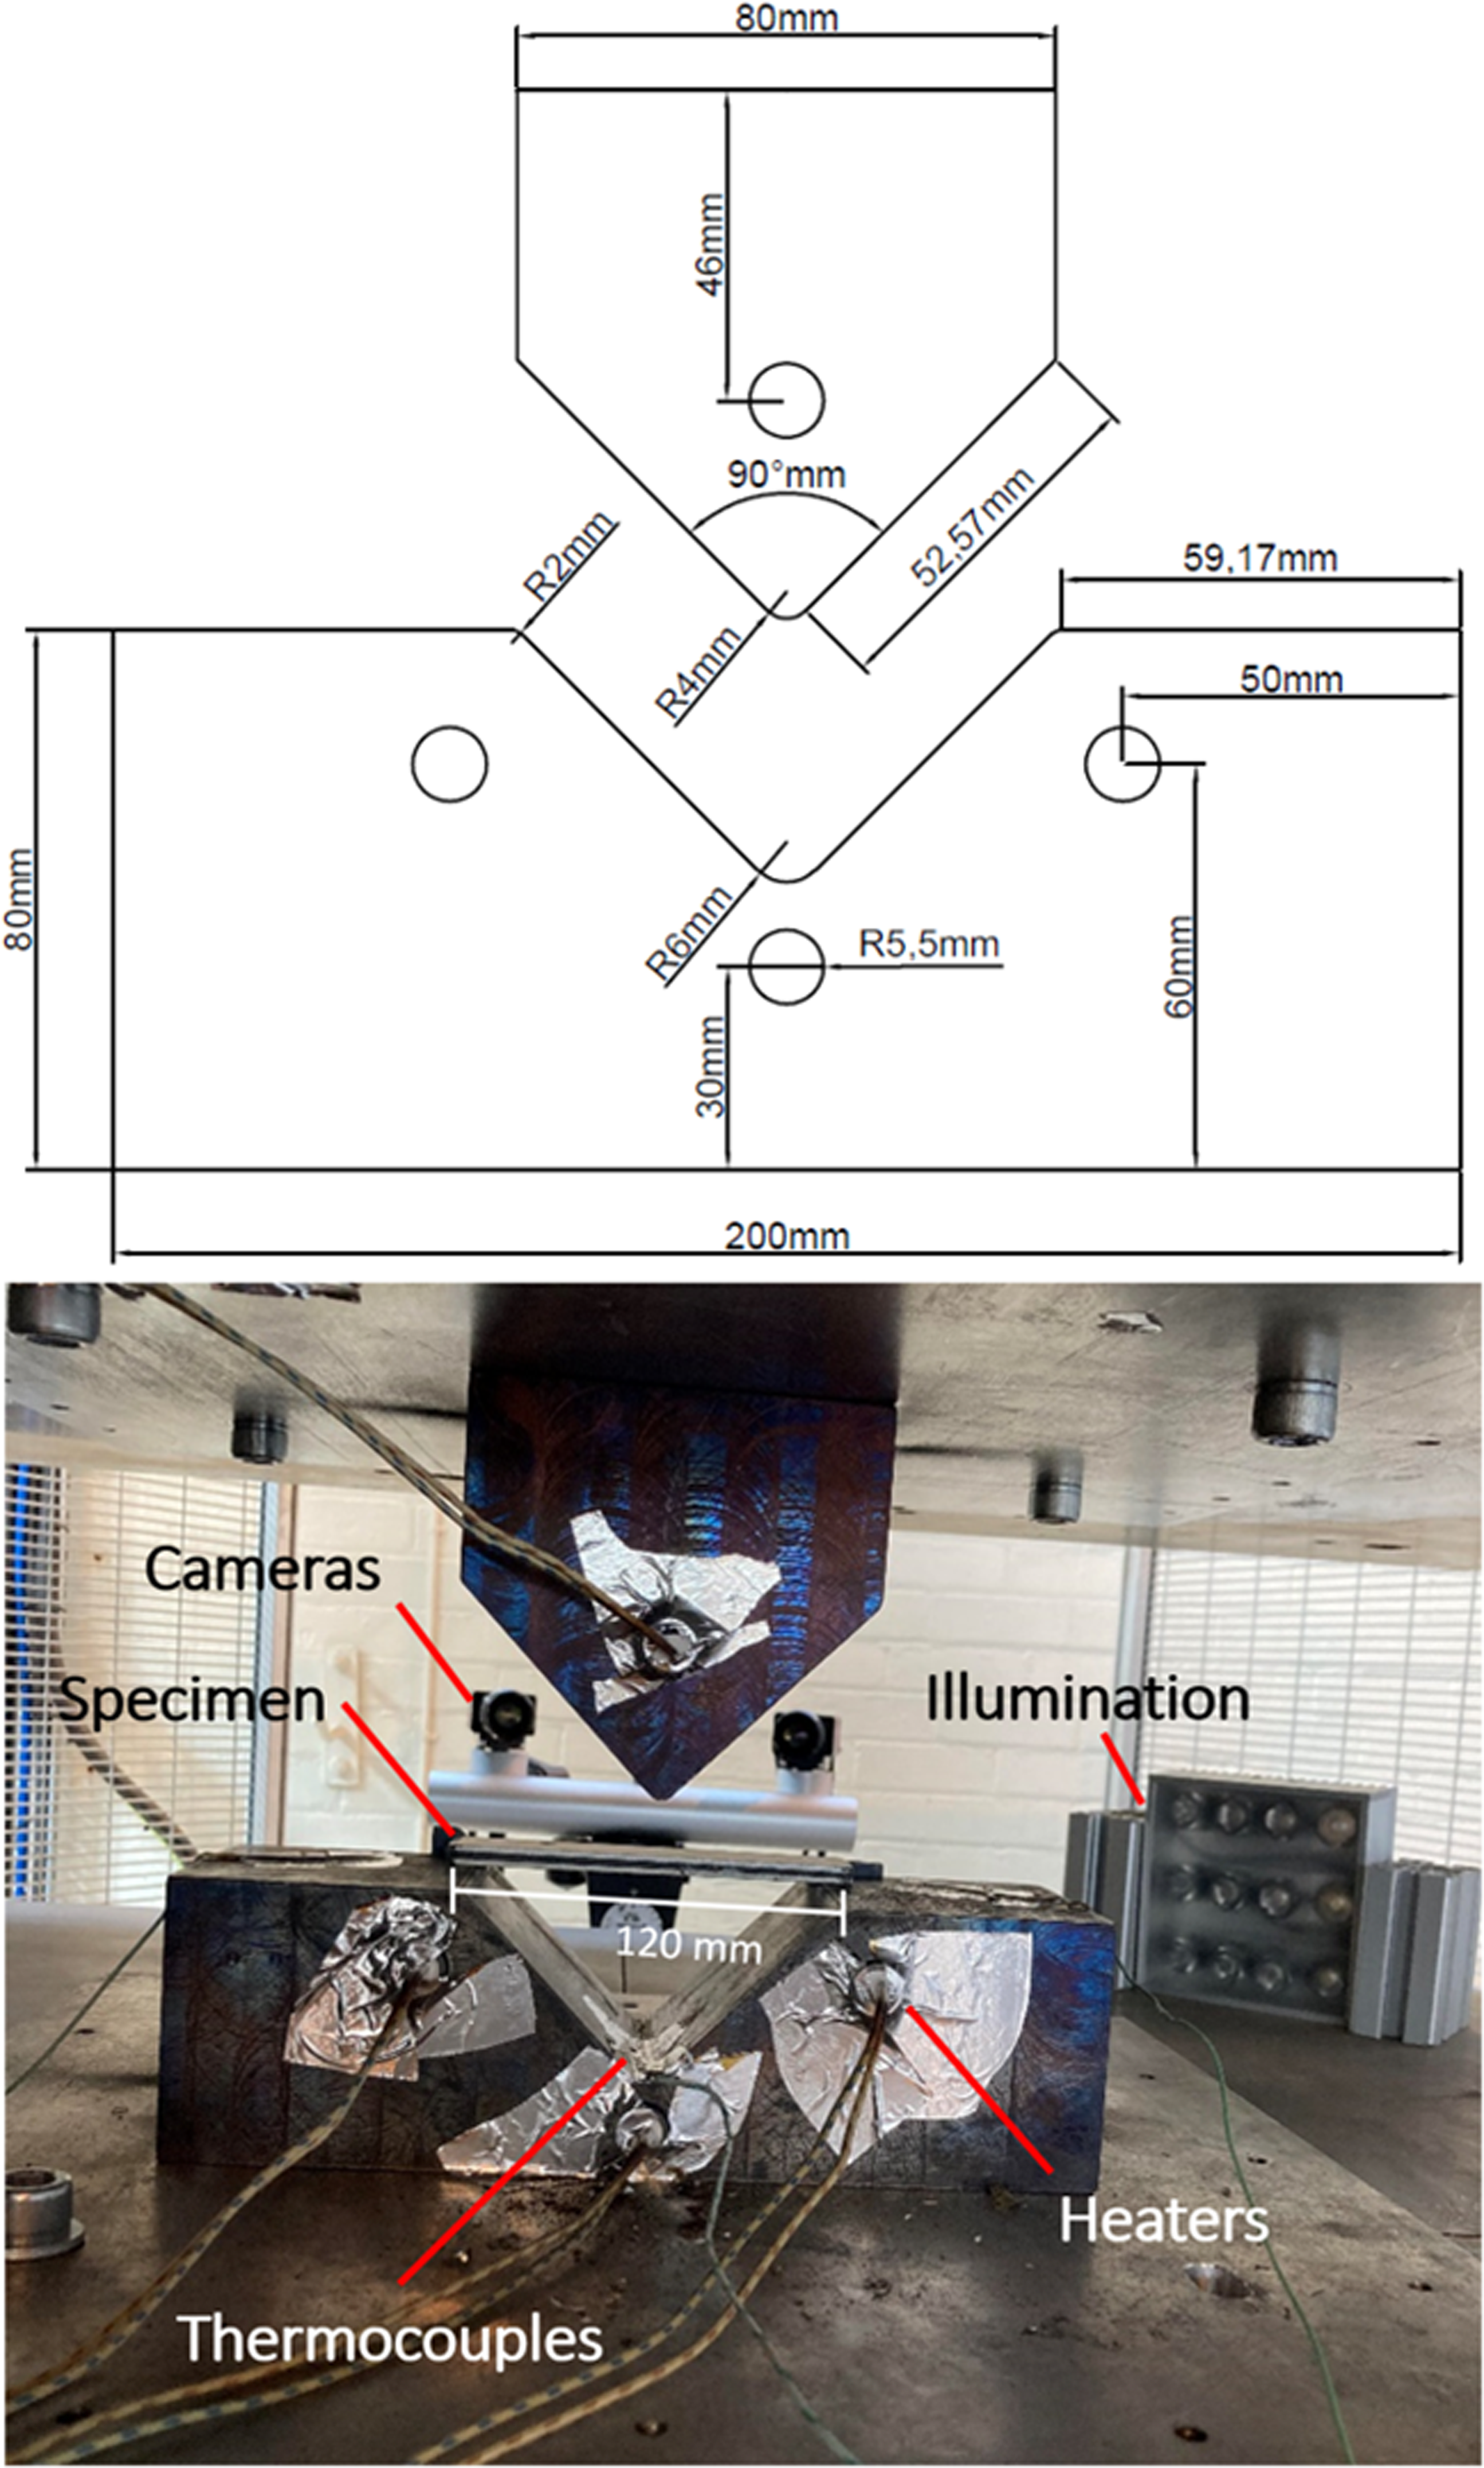
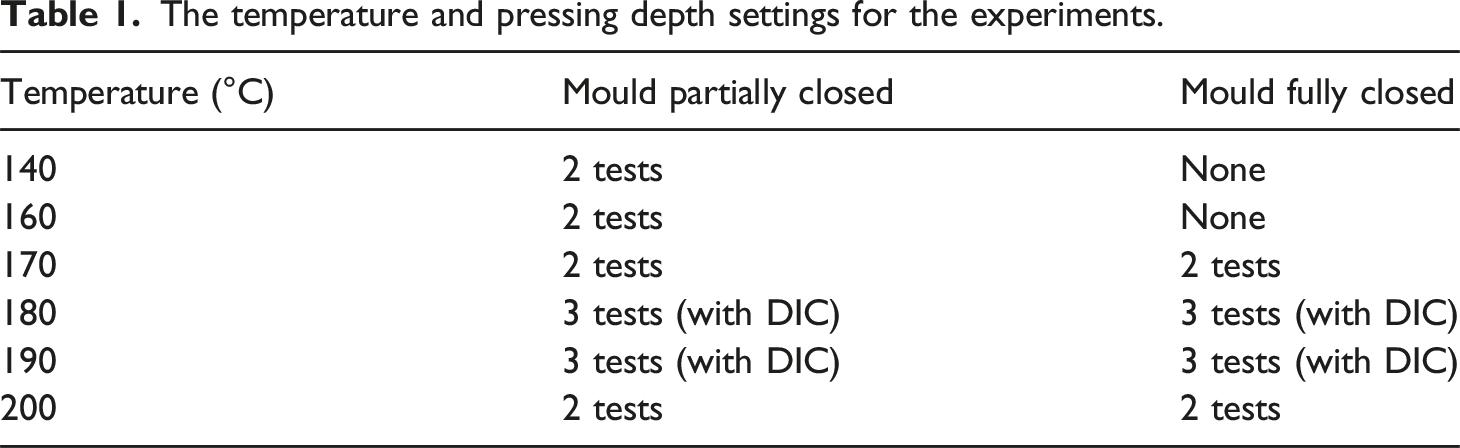
Trials were conducted at six different temperatures of: 140, 160, 170, 180, 190, and 200°C. From these trials, two forming temperatures were identified as suitable temperatures for the experiments with DIC: 180 and 190°C. These two temperatures were chosen because interlayer slippage was expected to happen at around 190°C, which would result in clear differences between the strain fields at 180°C and 190°C. For these experiments, one edge of each specimen was sprayed white, and then a fine speckle pattern sprayed on top using black spray paint. This created a random and high contrast surface pattern with appropriately sized speckles suitable for high spatial resolution DIC measurements. The forming process was recorded at a frequency of 5 Hz by a stereoscopic DIC system (Q-400, Dantec Dynamics, Germany) focusing on the edge-area of the specimen, which is shown in Figures 2 and 3. The DIC system consisted of two cameras (Manta GigE, Allied Vision, Germany) equipped with 50 mm lenses, at a standoff distance of 220 mm, and stereo angle of 32°. When the press was moved to a depth of 46.3 mm it resulted in a fully closed mould when containing a 5.3 mm thickness V-bended specimen, so the first pressing depth in the test was 46.3 mm. A slightly smaller pressing depth of 45.8 mm, which caused the mould to be partially closed, was also tested to study the potential influence of the pressing depth on the forming quality. As shown in Table 1, the experiments without DIC measurements were repeated twice for each combination of temperature and pressing depth. The tests with DIC were repeated three times for each combination of settings. Finite element model of the mould (with front and back faces hidden) and specimen. The orange frame indicates the side area of specimens monitored by the DIC system during the forming process, with a close-up view shown in the inset. The temperature and pressing depth settings for the experiments.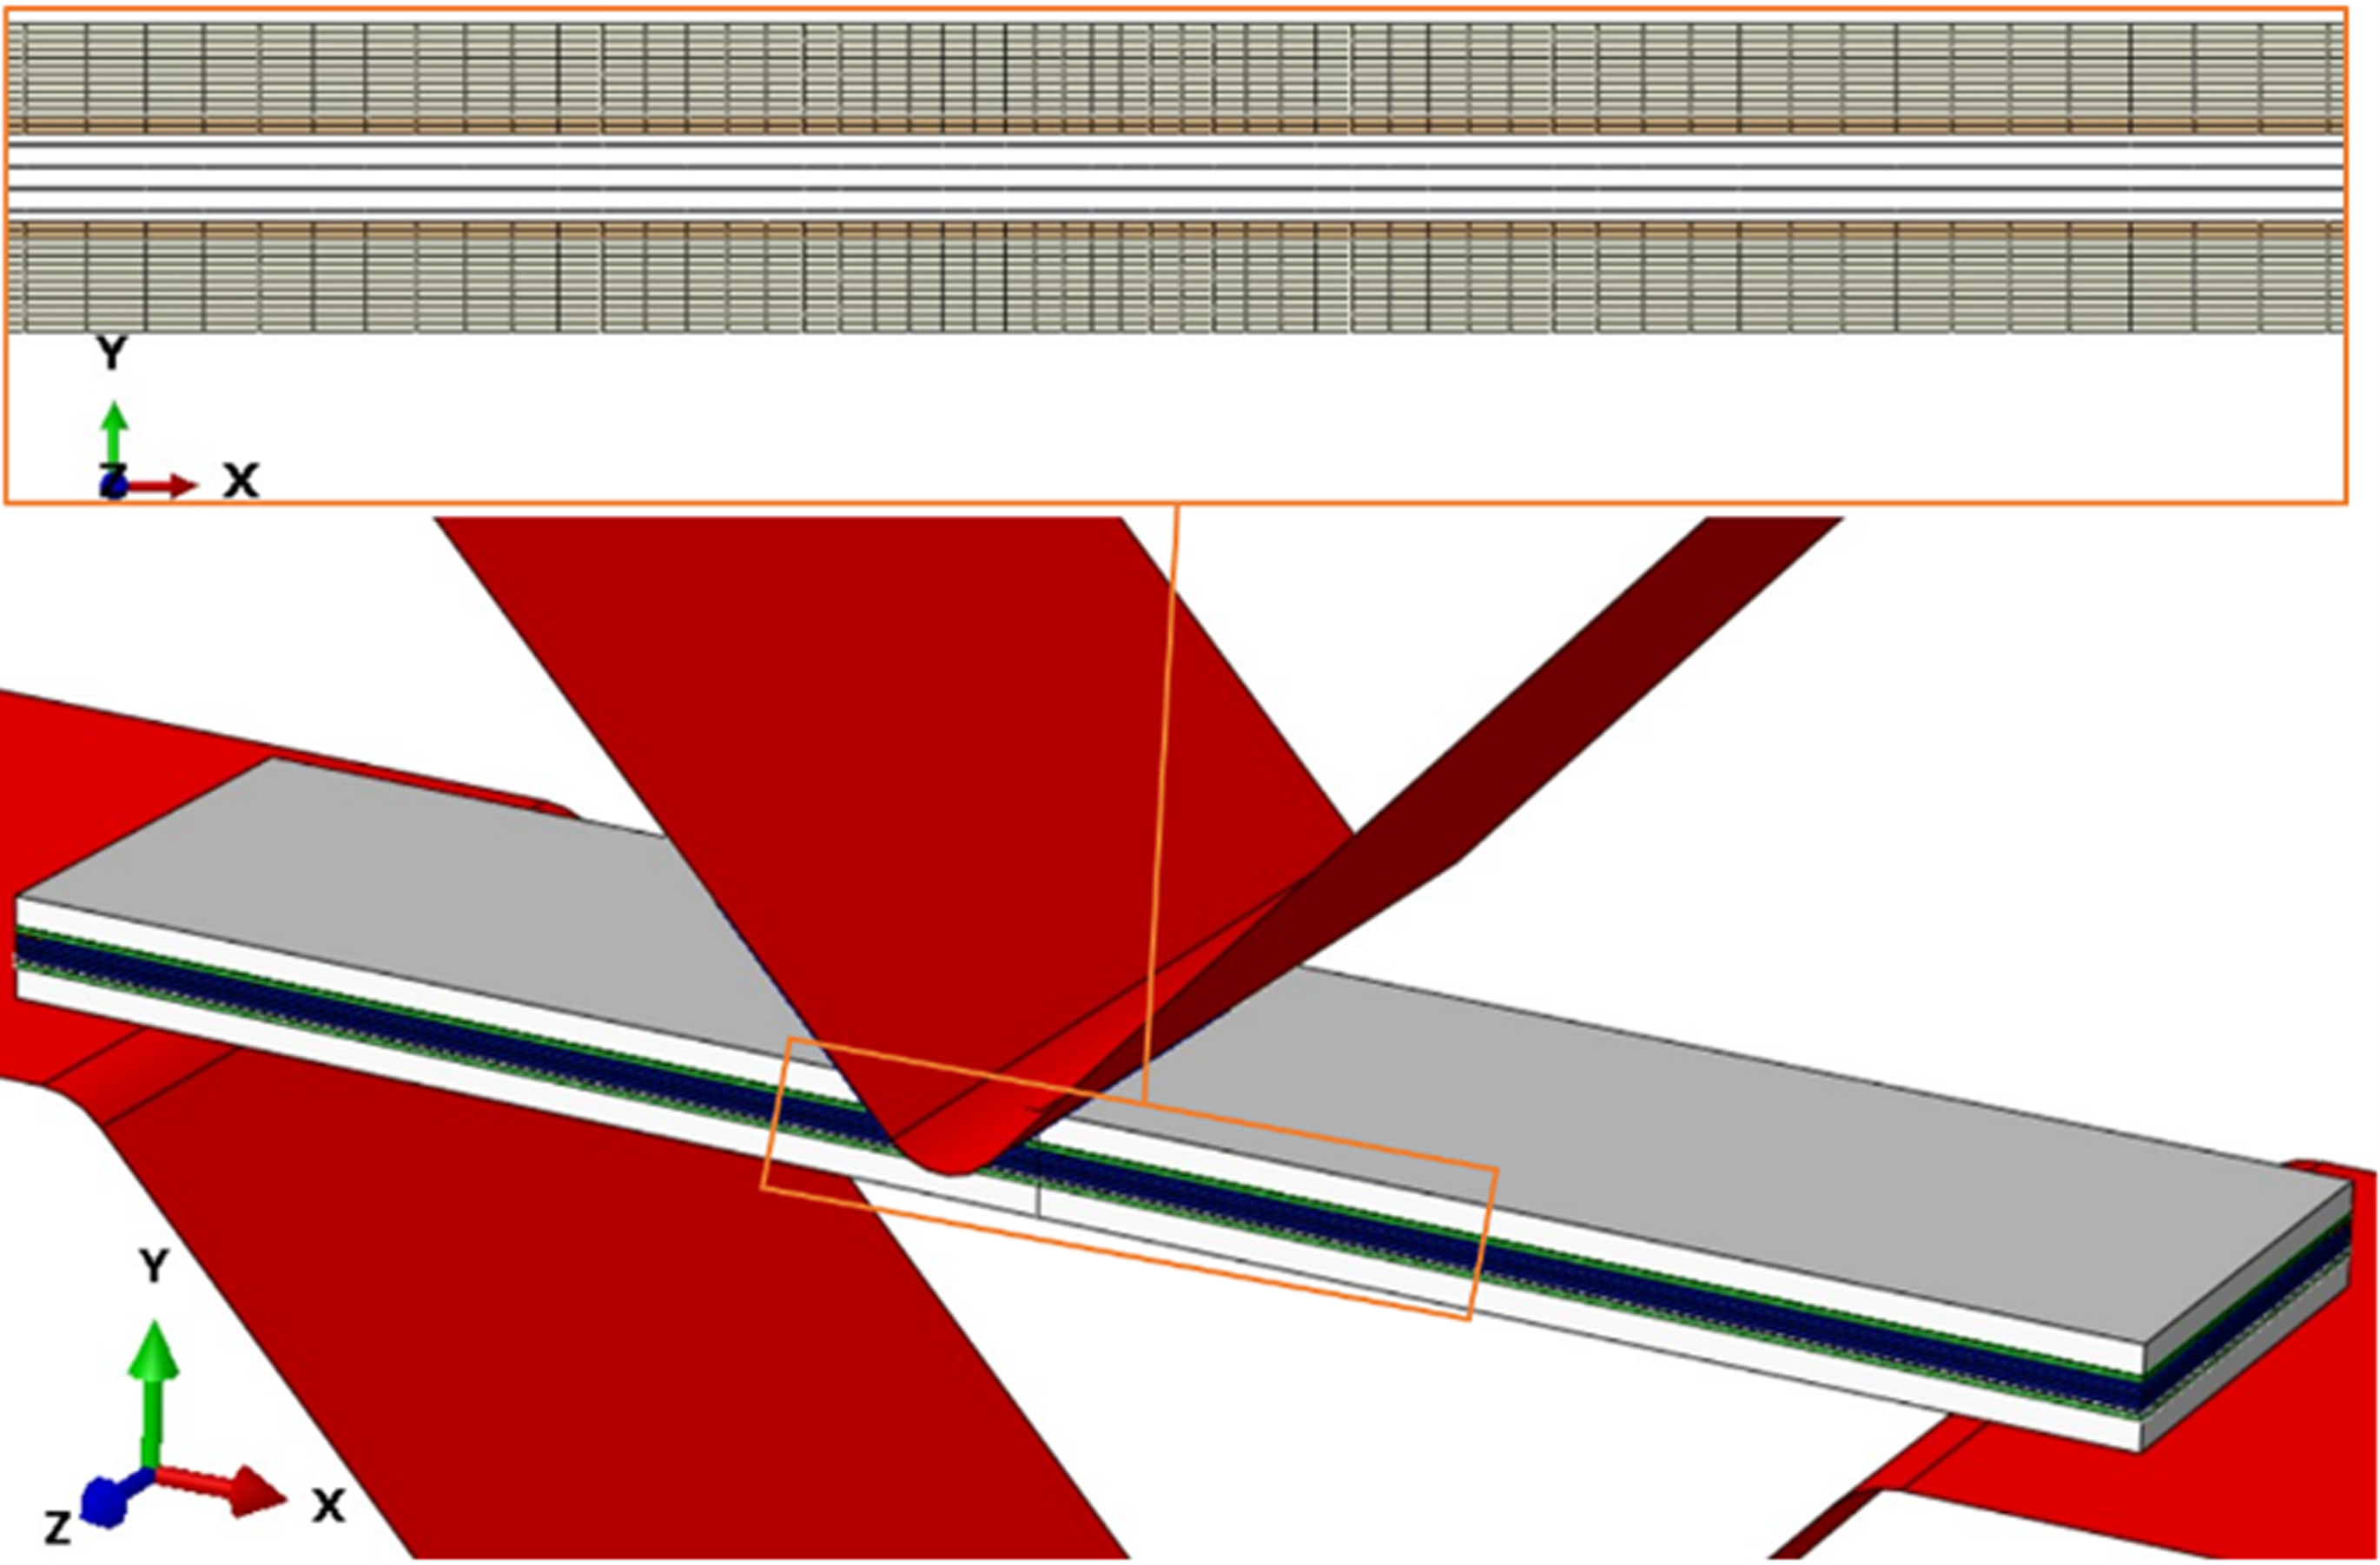
After pressing, the specimens were removed, and a speckle pattern applied to the tip region of the specimens. The same DIC system was then used to measure the geometric shape of the curved tip. The shape of the curved tip was approximately cylindrical, and the deviation between the grid points measured by DIC on the real curved tip and a perfect cylinder, with the closest radius to the real curved tip, was determined. The idealised cylinder was assumed parallel to the x-axis and thus represented by the equation,

A pulse-echo ultrasound C-scan machine, consisting of an ultrasonic flaw detector (Epoch 4Plus, Olympus, Japan) and a programmable 2-axis scan system (Midas Ltd, UK) was used to measure the delamination between the aluminium and the composite in the FMLs caused by the forming. The flat side of the formed specimens were put on a horizontal platform and immersed in water. The specimens were scanned using a 10 MHz focused transducer with a pre-programmed path, and the gate was set to record the amplitude of echoes from the first interface in the material. Amplitudes were recorded every 0.1 mm along the path, with the spacing between lines being 0.2 mm. No C-scan assessment was conducted on the formed radius of the specimens because the flat transducer could not work on a curved surface.
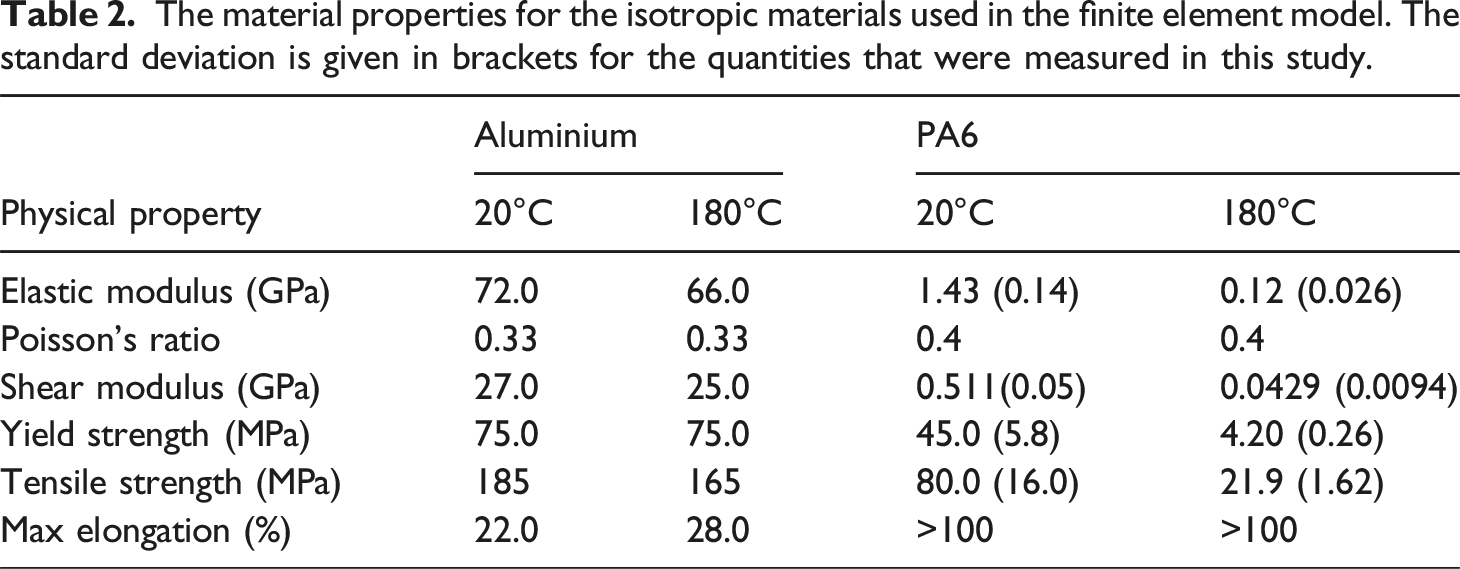
The material properties for the isotropic materials used in the finite element model. The standard deviation is given in brackets for the quantities that were measured in this study.
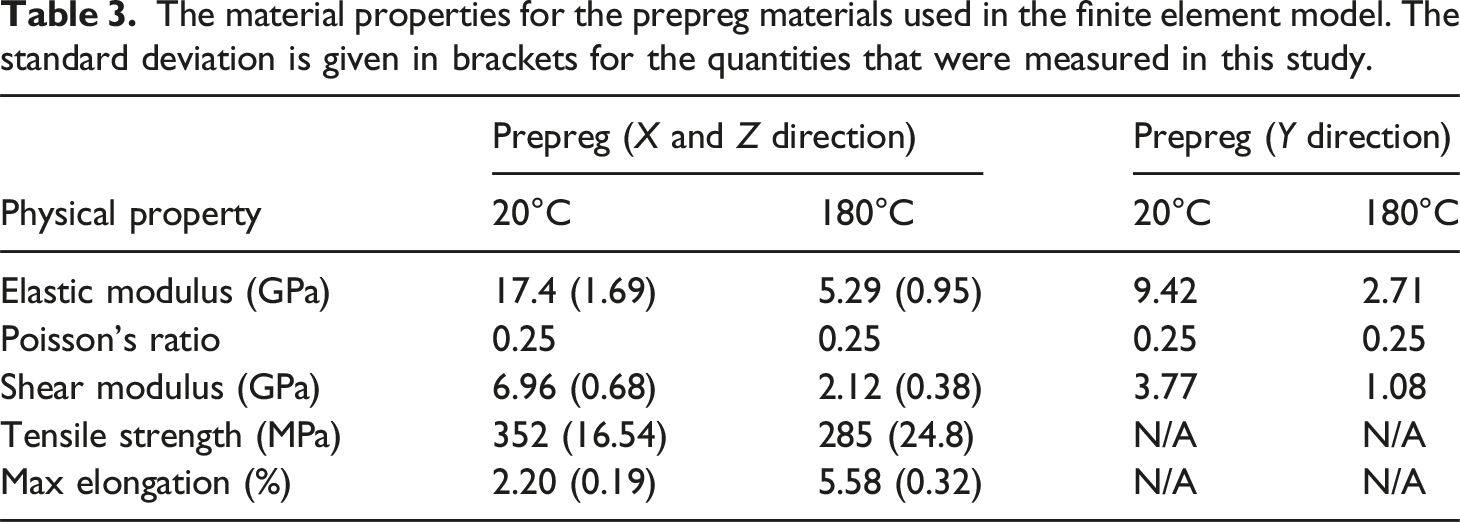
The material properties for the prepreg materials used in the finite element model. The standard deviation is given in brackets for the quantities that were measured in this study.
Delamination caused by interlayer shear stress is the dominating damage mode at the bonding area between the aluminium and composite layers during the forming process.37,38 To determine the shear bonding strength within the specimens, tests were conducted on joint specimens with a double lap joint structure which was the same as those used in 39. These tests were conducted at temperatures of 180°C and 200°C with the same Instron machine and heating chamber. For these tests, the material components and the thickness in the bonding area were the same as for the FML flat plates. The bonding area was 18 mm by 35 mm at the centre of the specimen which was heated to the required temperature by the heating chamber during the test. A thermocouple was fixed on the bonding area of the specimen to ensure that the correct temperature was achieved during the test. The upper clamp, which gripped the composite core, and the lower clamp, which gripped the aluminium skins, pulled the composite core out from the aluminium skin at a fixed rate of 5 mm per minute. The pulling out of the composite core from the aluminium skin layers caused shear failure in the bonding area of the specimen. Therefore, the maximum shear stress at the bonding area was determined. The test was repeated three times for each temperature and the average was used for the model. The average maximum shear stress was 3.85 MPa at 180°C with a range of 3.68 MPa to 4.08 MPa. The average was 1.54 MPa at 200°C with a range of 1.42 MPa to 1.67 MPa. The traction-separation behaviour of the joint specimens was recorded during the double lap shear tests, and all the specimens showed linear traction-separation behaviour until failure.
Modelling the manufacturing process
Finite element modelling was carried out using the commercial finite element analysis software ABAQUS/standard (Version 6.14, Dassault Systèmes, France) to simulate the same forming process as the experiment. The pressing mould and FML specimen were built in the model with the same dimensions as used in the experiment and the mesh prior to pressing is shown in Figure 3. The aluminium and PA6 layers were modelled with 3D solid elements with reduced integration (C3D8R), and for simplification, the glass fibre reinforced PA6 composites were modelled with four layers of 2D shell elements with reduced integration (S4R). Therefore, the potential damage initiation on the four primary fibre layers in the fibre reinforced composite, which is shown in Figure 1, could be simulated based on the built-in Hashin 2D failure criteria available in the commercial code Abaqus.40,41 Double bias meshing with a bias ratio of five and an element number of 99 was used along the length direction of the specimen to create a high mesh density at the location where deformation was expected to be highest whilst ensuring a relatively low computation time. A uniform meshing with a mesh size of 1.5 mm was used along the width direction, and a uniform meshing with a mesh size of 0.15 mm was used along the thickness direction. An overall count of 43,758 C3D8R elements and 6732 S4R elements were used in the model. The mesh sensitivity was checked to ensure high accuracy whilst minimising computation time.
During the shear bonding strength tests discussed in the experimental method section, the bonding areas showed a linear traction-separation behaviour. Therefore, the bonding between the adjacent composite core and the aluminium skin was modelled by the surface-based cohesive behaviour module in ABAQUS, which offers a linear elastic traction-separation behaviour between the two contacted surfaces, so that individual cohesive elements are not needed.
41
The linear elastic behaviour is defined as: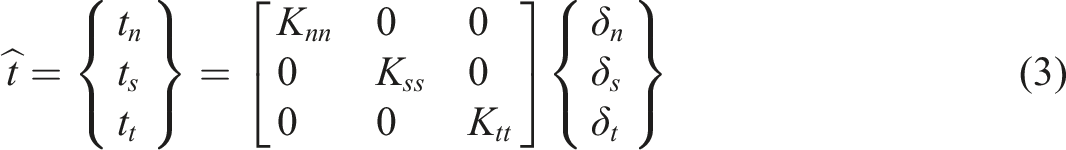
For the material properties at the forming temperature of 180°C of the aluminium 2024-O, PA6, and glass fibre reinforced PA6 used in the simulation, the data shown in Tables 2 and 3 was used. For the simulations at other temperatures, linear interpolation and extrapolation were used. The dominating contact stress for the interlayer delamination is the shear stress,
37
the maximum contact stresses The temperature field acquired by the microbolometer at the end of the forming process.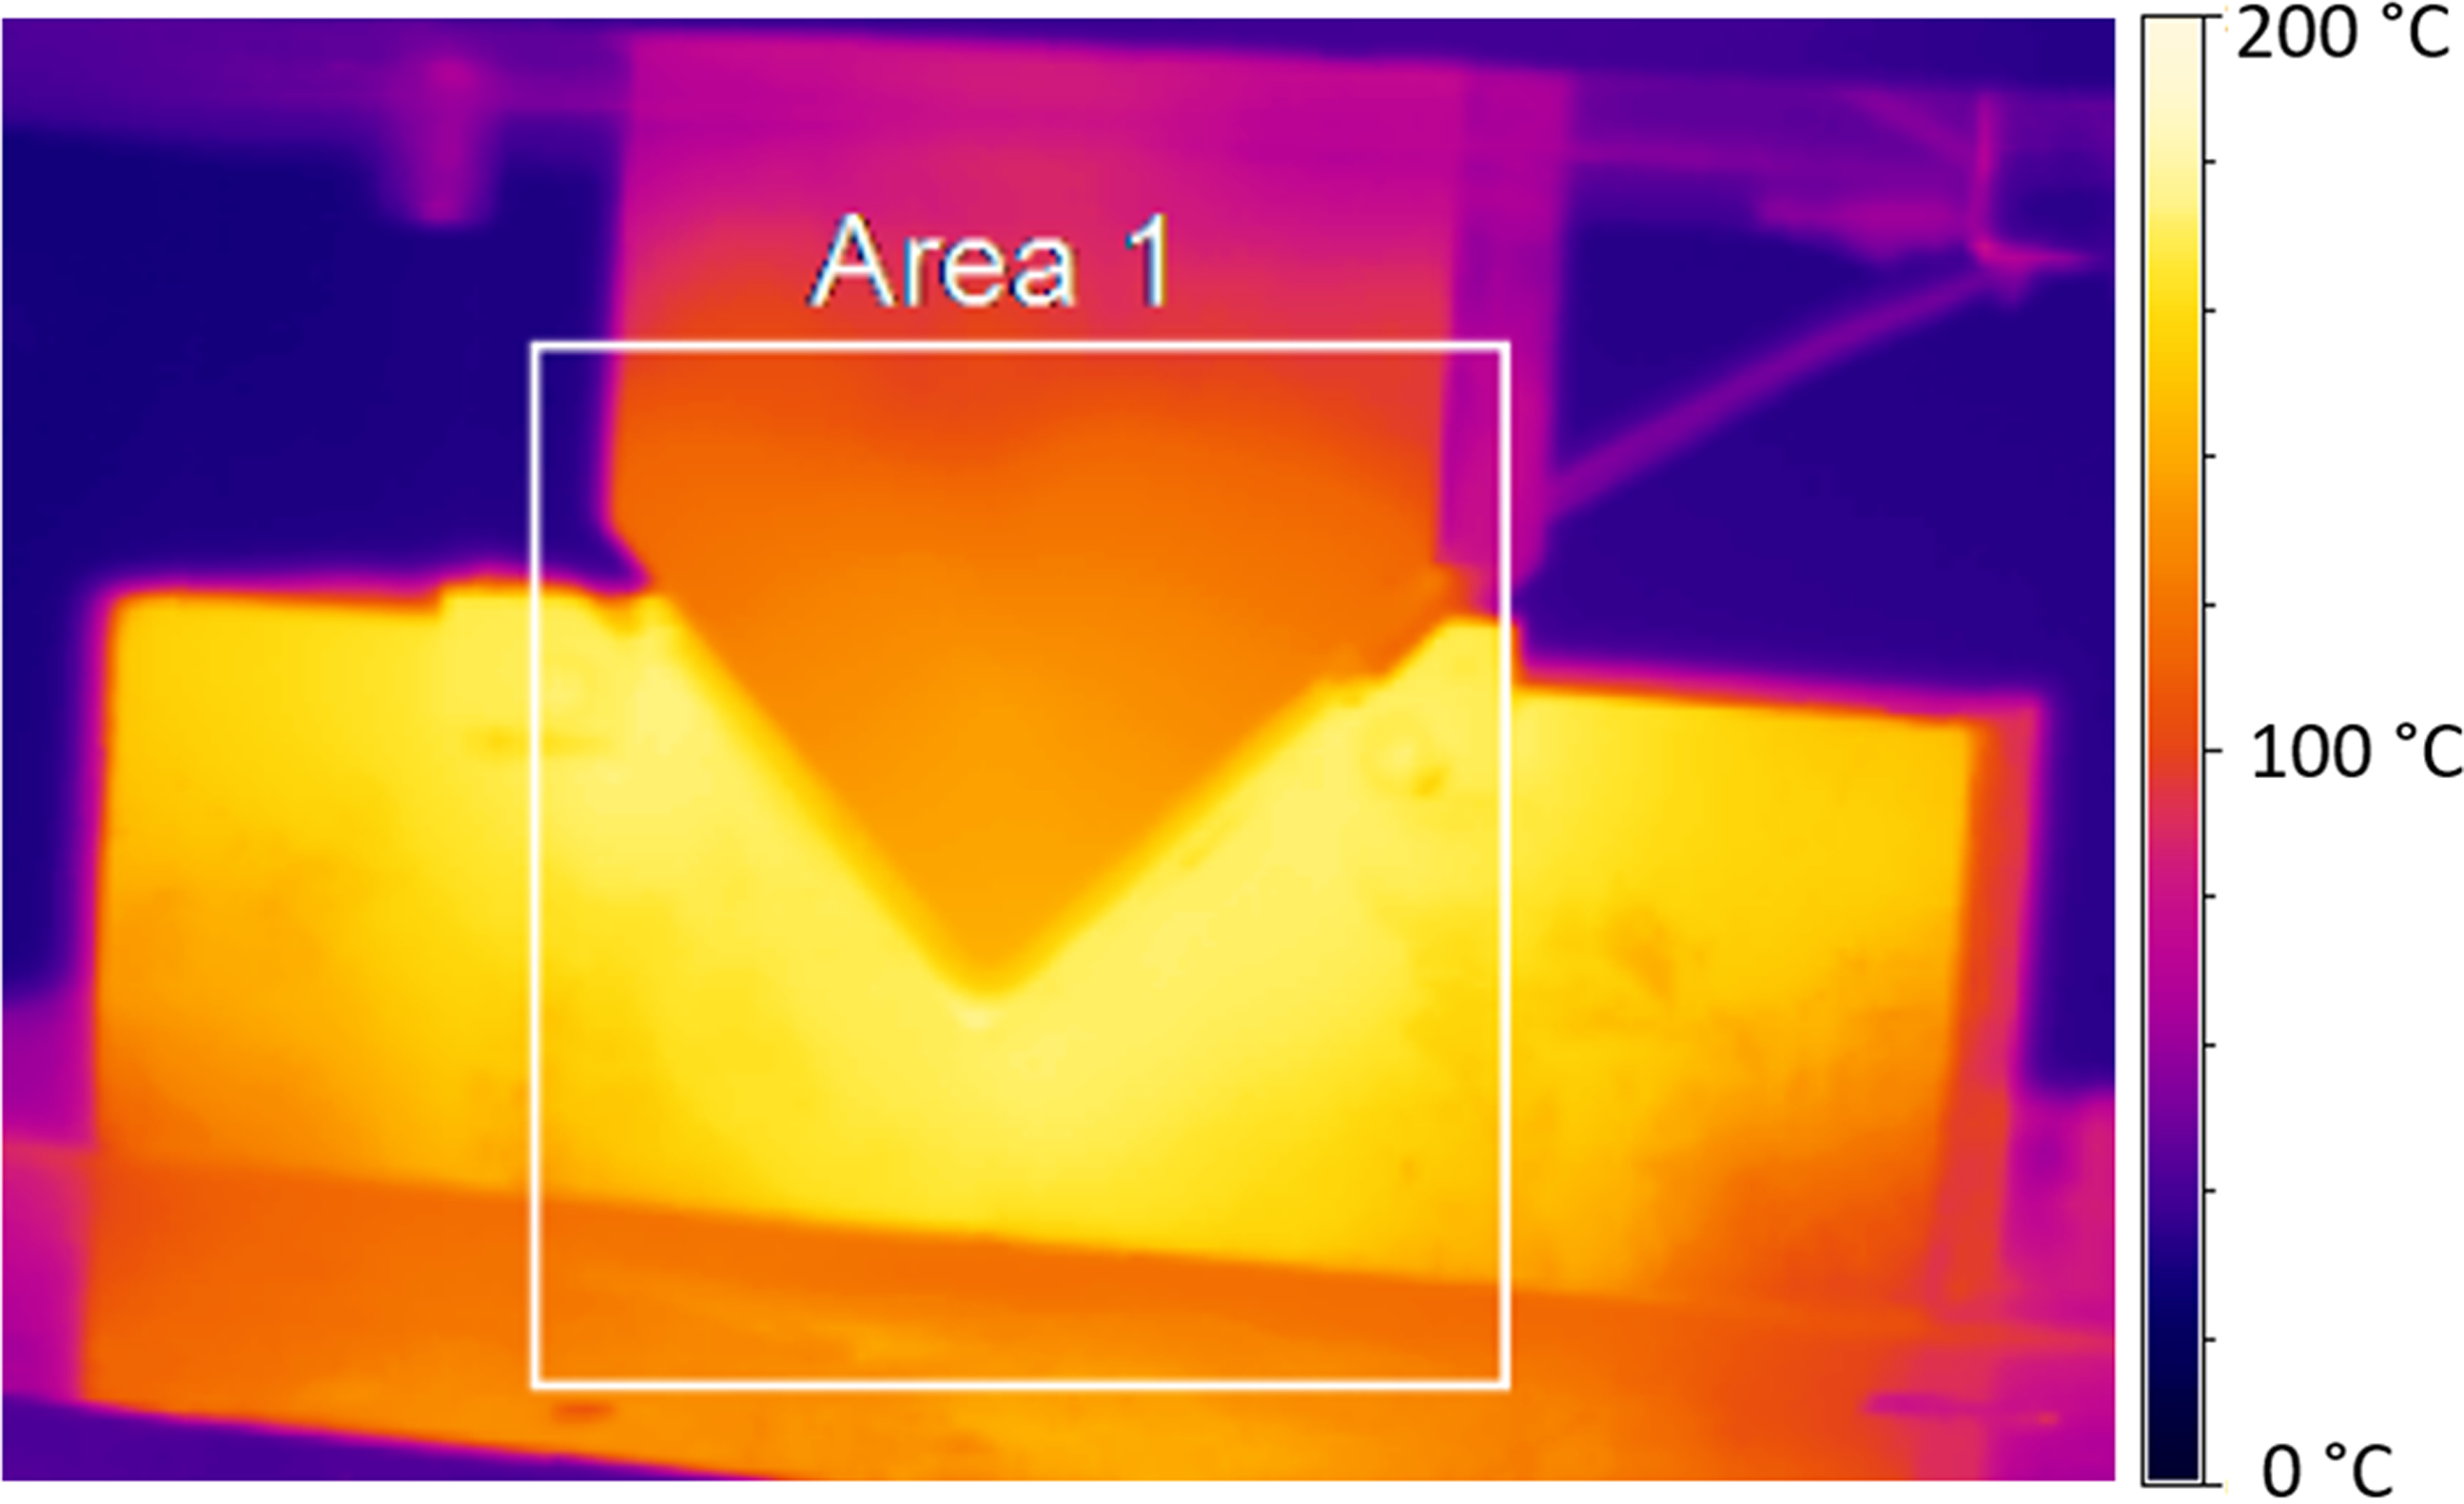
Results
Quantitative validation using strain measurements
The side edge strain field acquired from both the experiments and simulations at the end of the forming process were cropped to areas with the same dimensions. These were then processed using orthogonal decomposition to obtain feature vectors with a lower level of data dimensionality. In this study, the strain fields were decomposed using a QR factorization-based decomposition algorithm.
42
After decomposition, the strain field can be reconstructed from the feature vector and the representation error calculated as:


If there are data points outside the region defined by equation (6), then the model is invalid and would require refinement. The flow chart for the validation process is shown in Figure 5. The tolerance of Flow chart representation of the validation and refinement process for the model based on experiment results.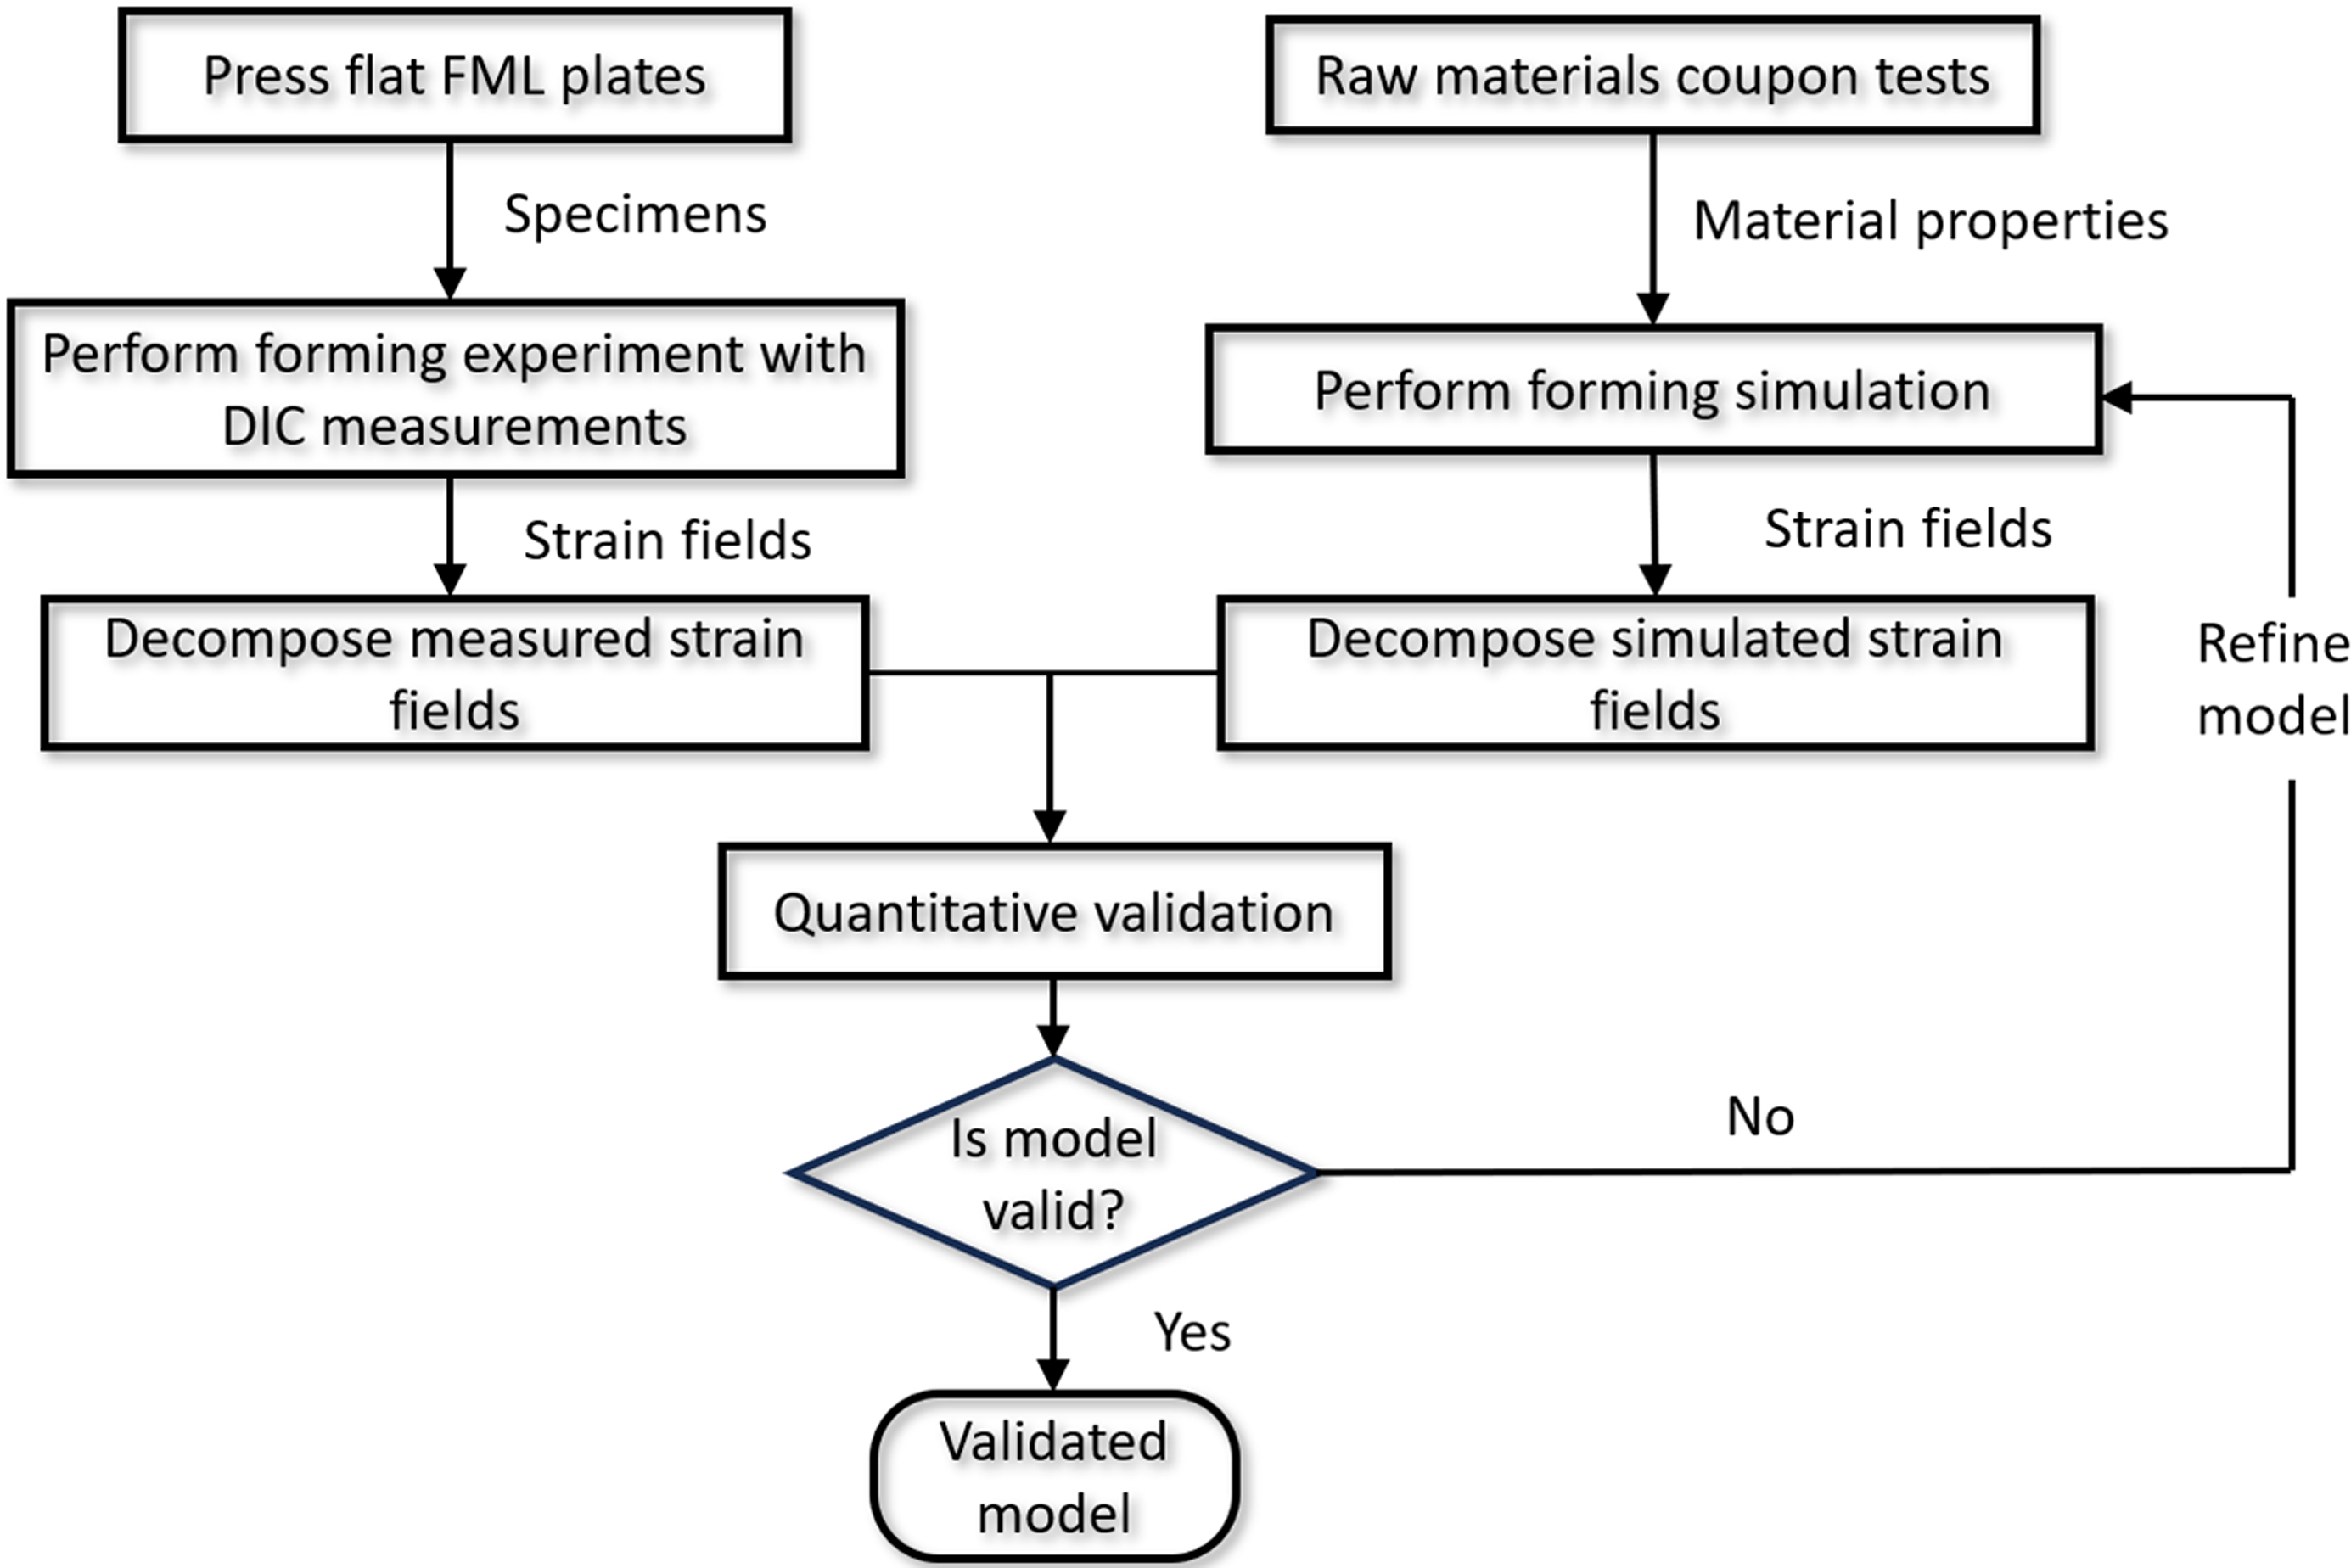
Different measurement systems could potentially be used to reduce
The DIC measurements from the six experiments at 180°C were used to validate and refine the model. Afterwards, the validated model was used to predict the forming behaviour of an FML at 190°C, and the side edge strain field from the model was quantitatively compared with the strain fields from the six forming experiments at 190°C with the same method mentioned previously.
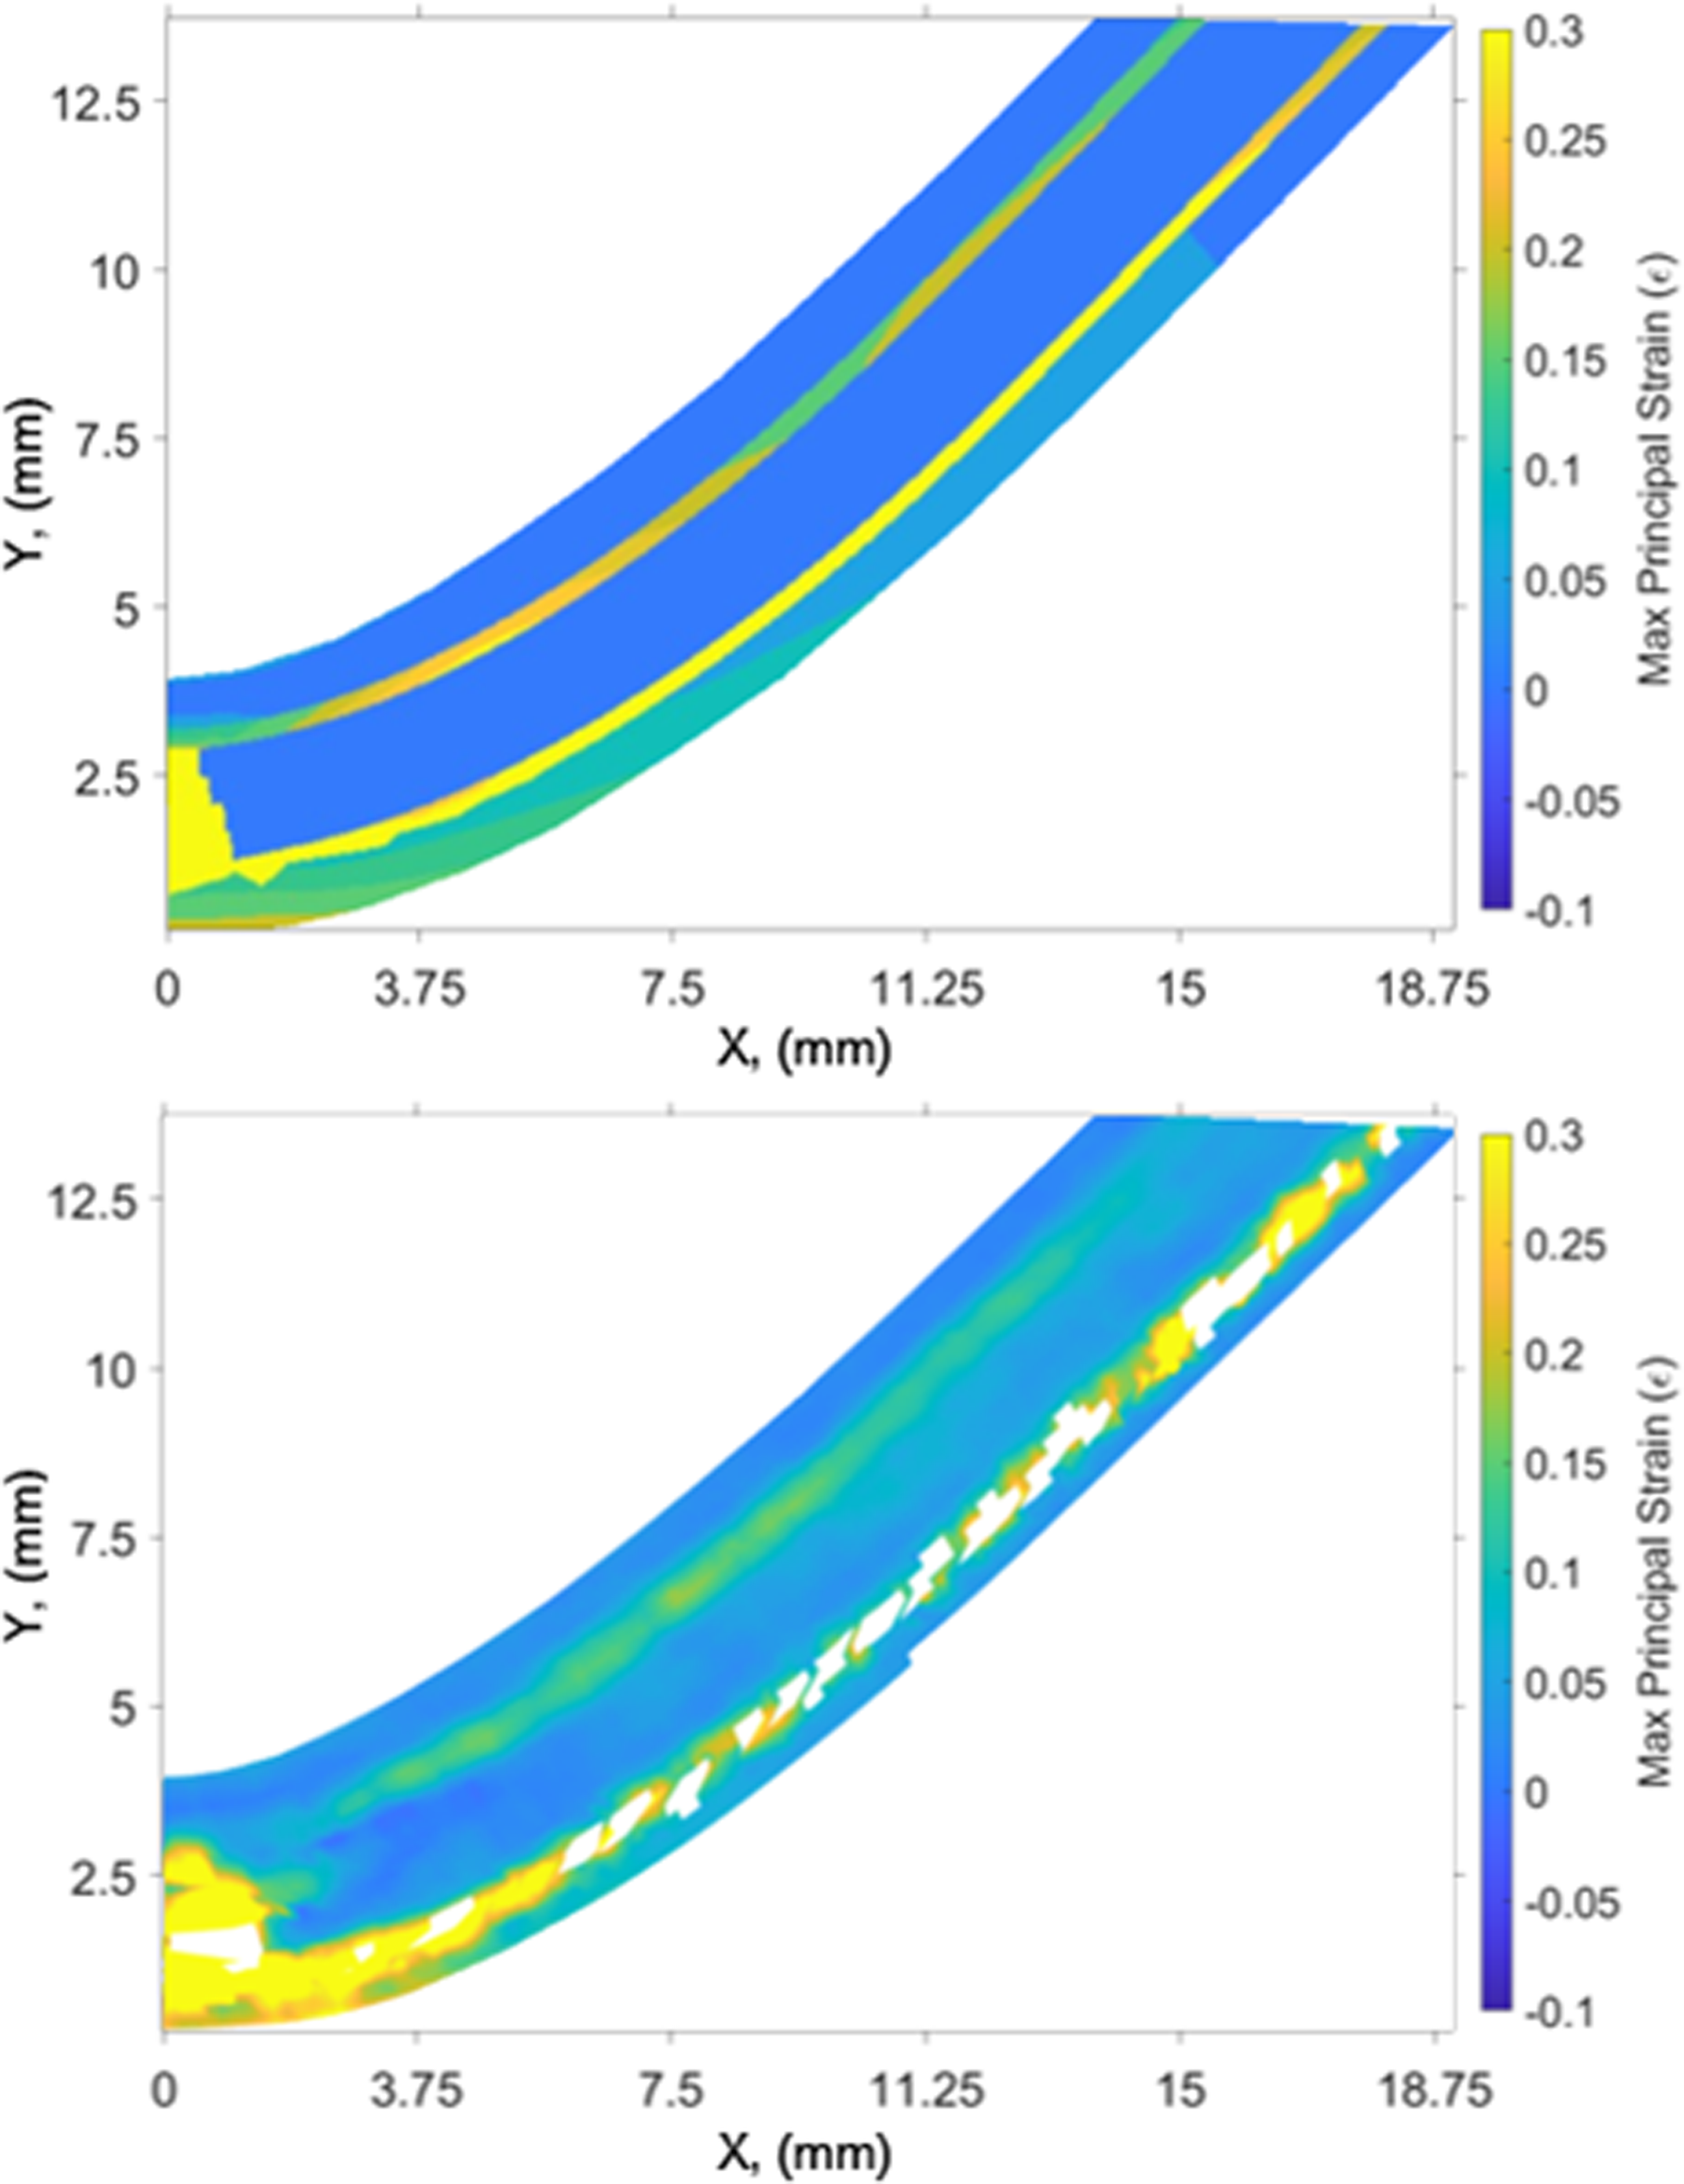
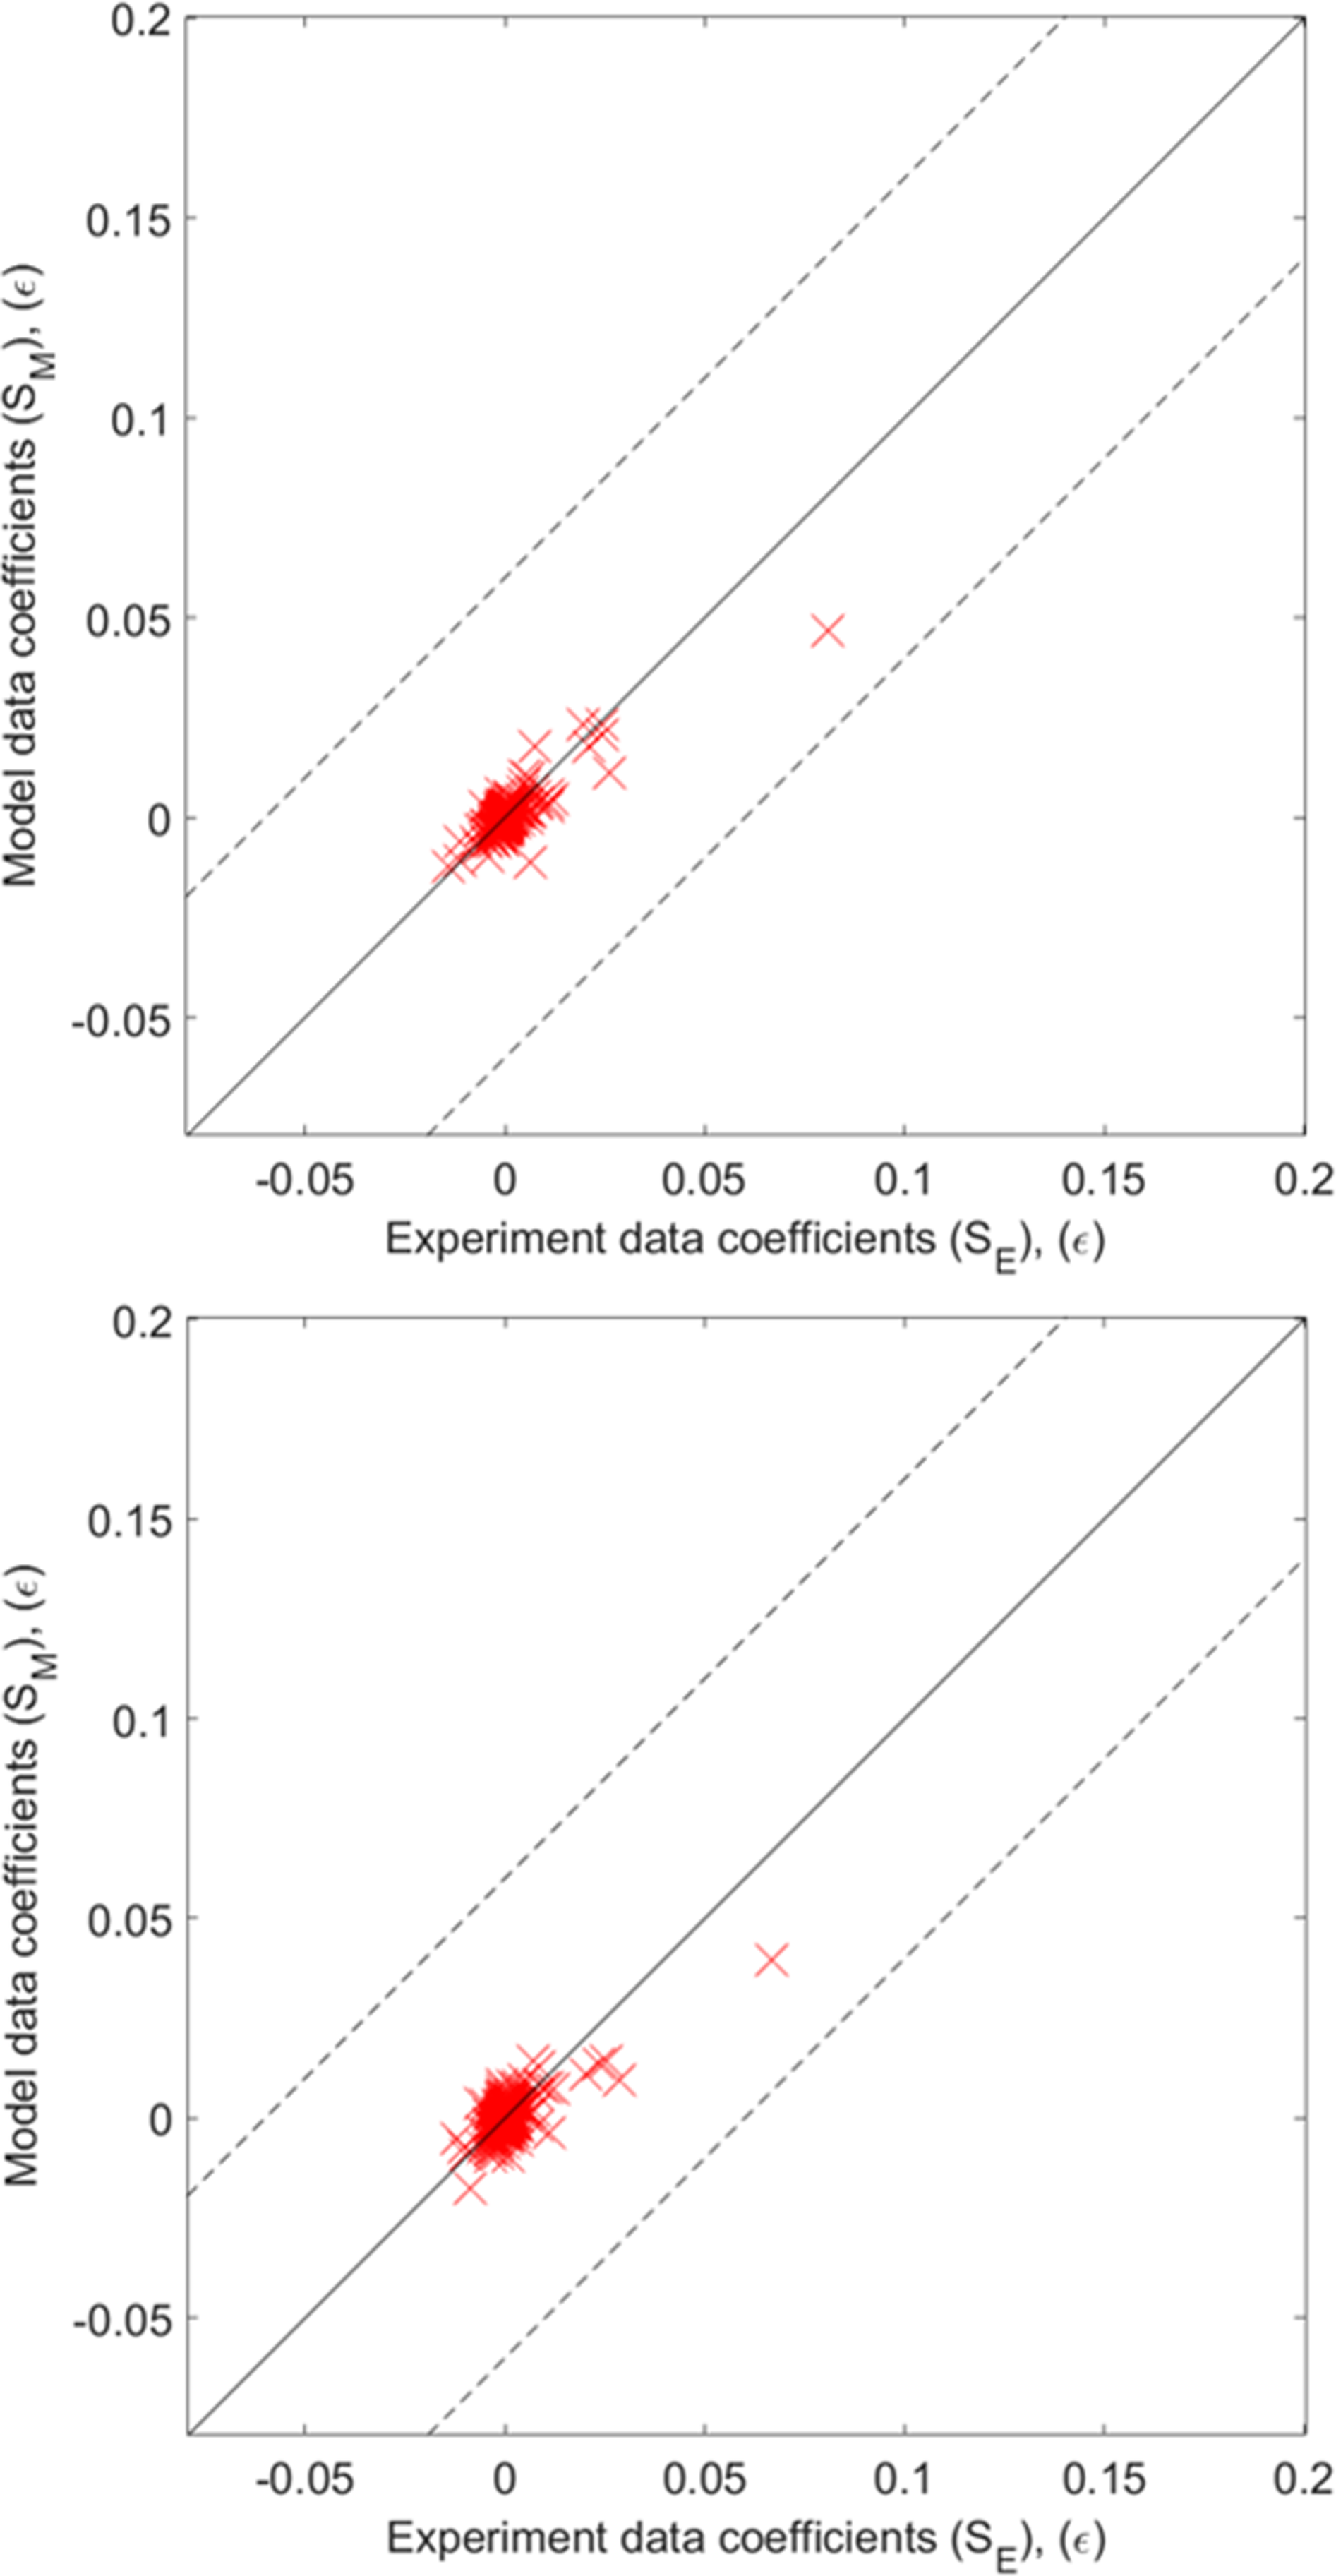
The two samples of the comparison between the strain field of the maximum principal strain in model and experiment at 180°C and 190°C are shown in Figures 6 and 7. The coefficients representing the strain fields from the model and experiment shown in Figures 6 and 7 were plotted in Figure 8 with the acceptable region for the validation, defined by equation (6), shown with dashed lines. All the coefficients were within the acceptable region when each model was compared to data from the 12 validation experiments at 180°C and 190°C. This means the model was successfully validated at both temperatures. Edge maximum principal strain fields predicted by the model (top) and experiment (bottom) at 180°C at the end of the forming process. Edge maximum principal strain fields predicted by the model (top) and experiment (bottom) at 190°C at the end of the forming process.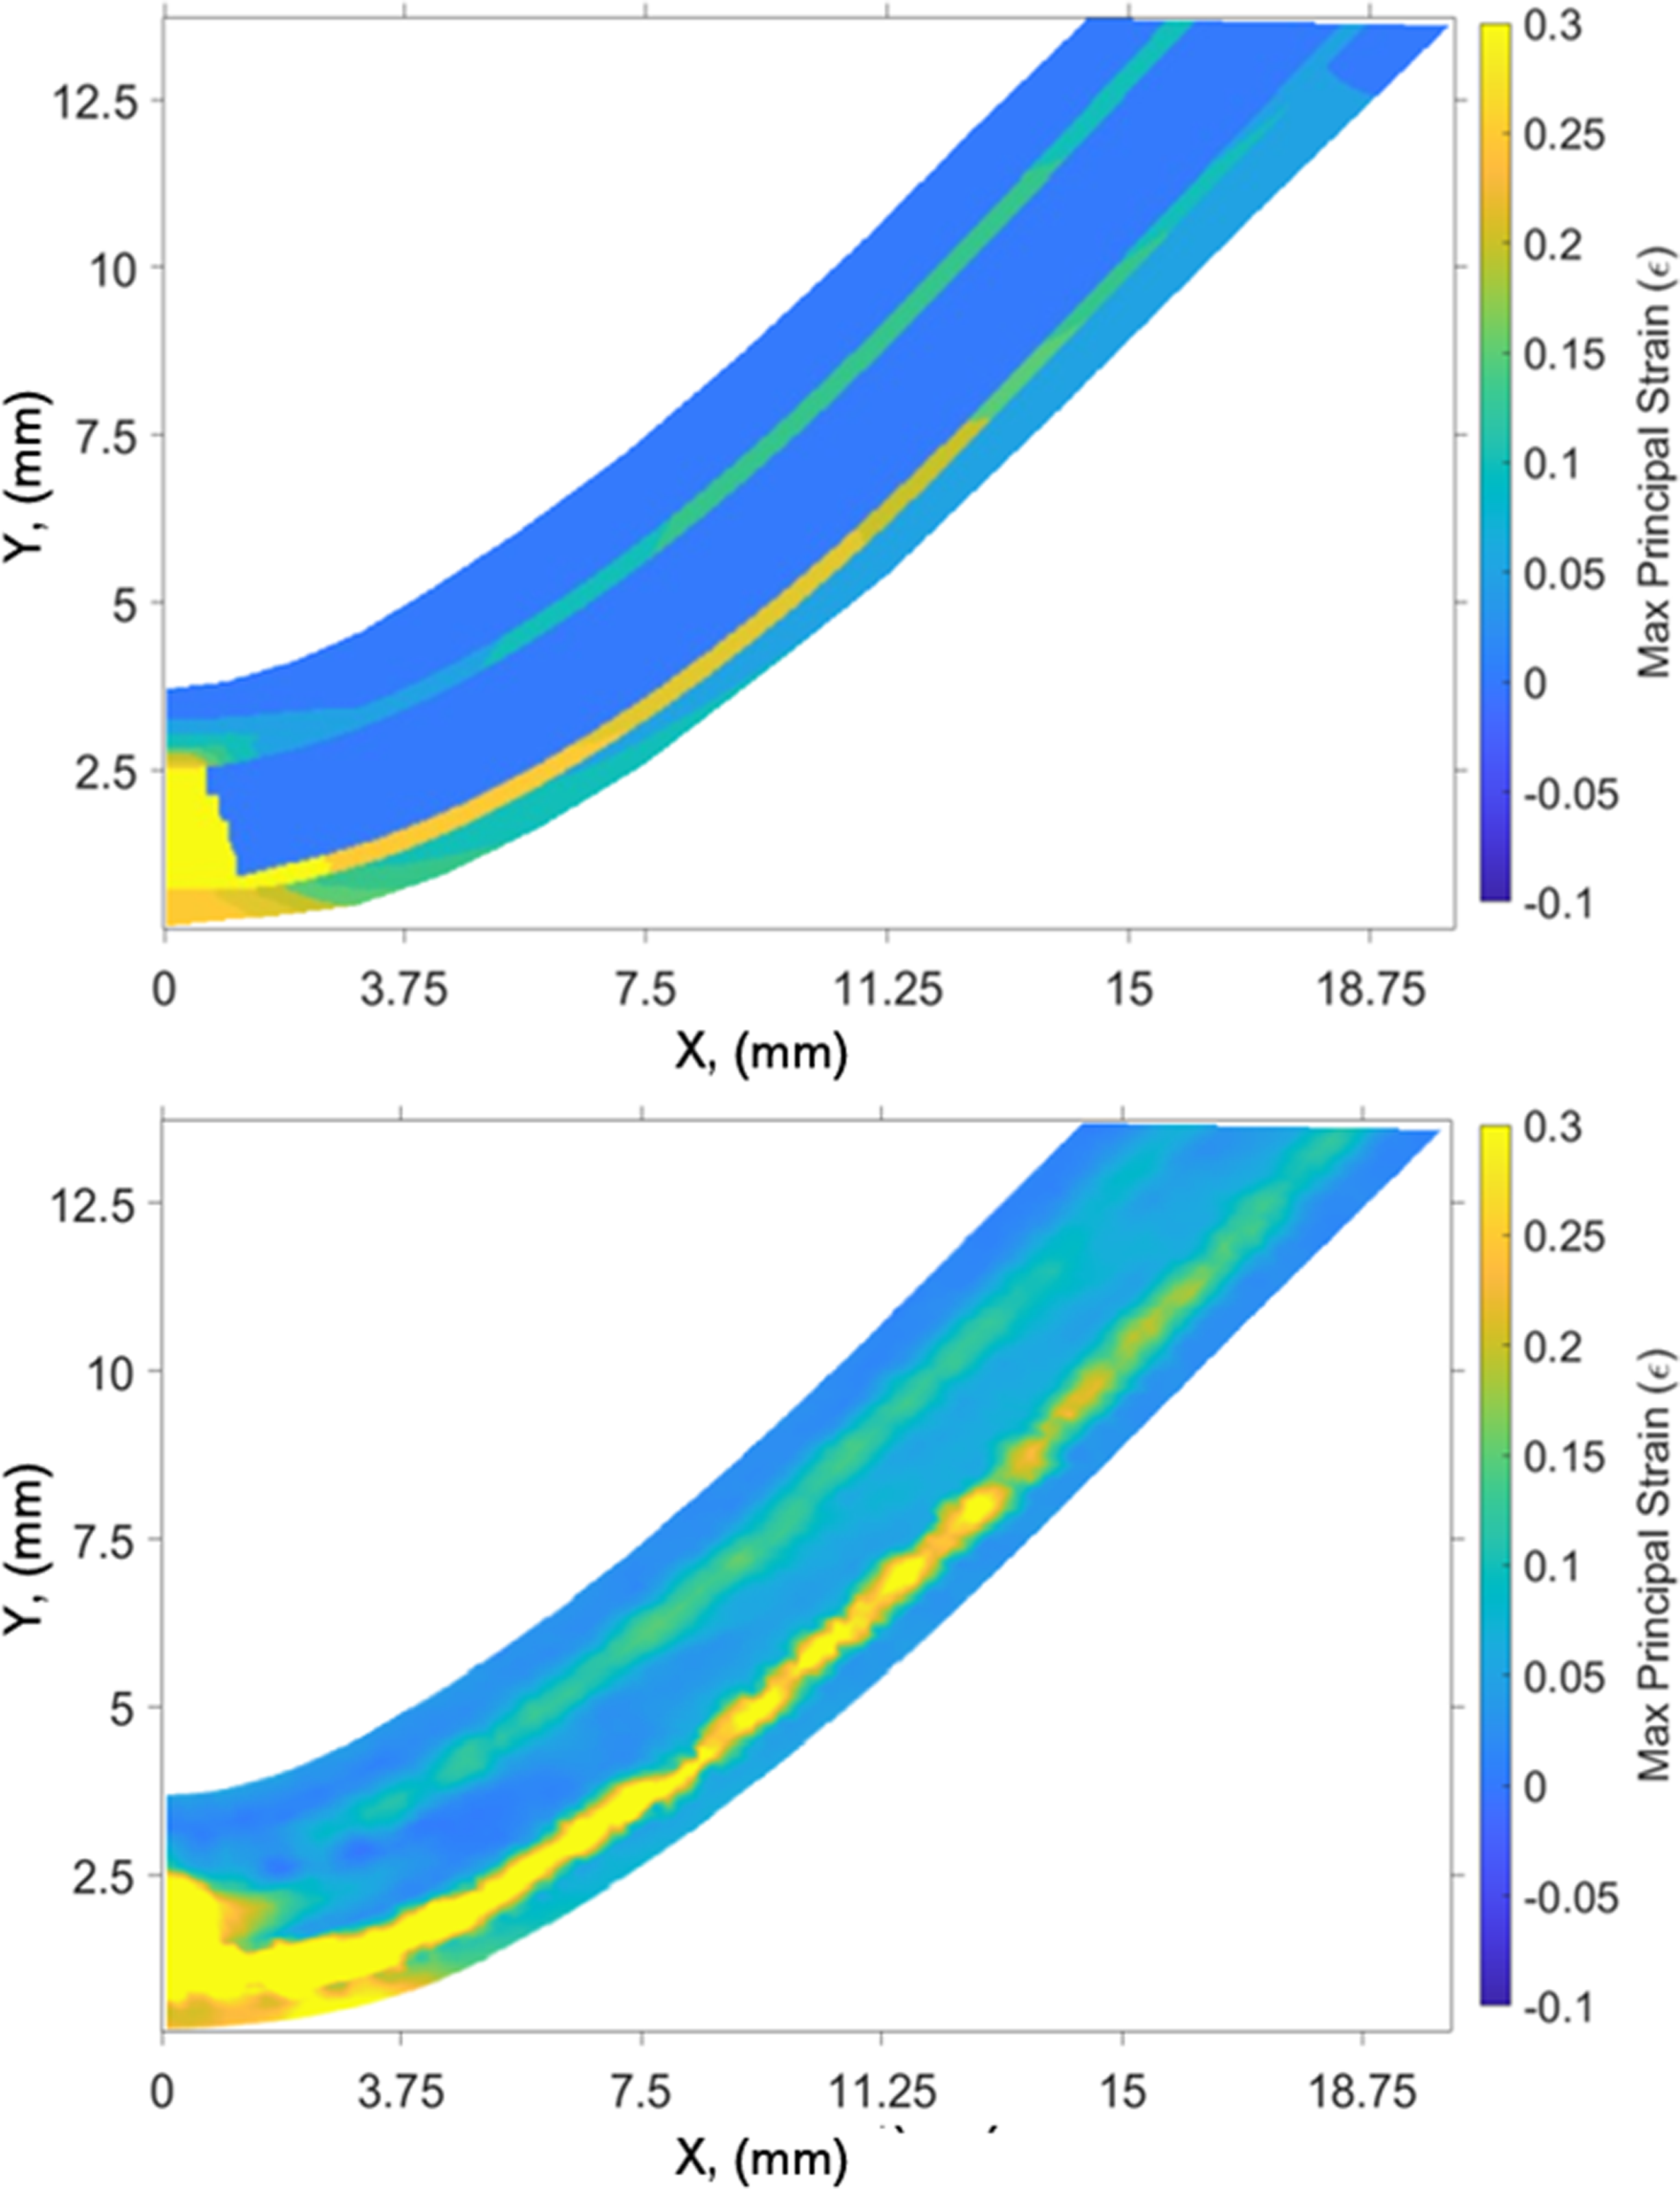
Qualitative comparison of data
The specimens formed by the V-shape forming process at the six temperatures from 140°C to 200°C are shown in Figure 9. At 140°C and 160°C, the specimens were fractured along the centre axis from the glass fibre reinforced composite core to the lower aluminium skin. This was due to the high tensile stresses on the bending area in the skin and the temperature not being high enough to provide sufficient ductility for the aluminium skin to deform. At 170°C and 180°C, no visible defects were observed in the formed specimens, which is likely attributed to the improved ductility of the materials due to the higher temperature. At the tip area of the bended specimens, the width of the bottom aluminium skin was reduced, and the width of the upper aluminium skin was increased due to Poisson’s effect. At 190°C, the right side of the specimens showed slippage between the bottom aluminium skin and the composite layer, which caused a stepped shape at the right end of the specimen. According to the results of the shear bonding test, the slippage indicates the weakening of the interlayer bonding strength due to the high temperatures at the bonding interface. The left side of the specimens showed no obvious damage with the bonding between the bottom aluminium skin and the composite layer still present. At 200°C, full delamination occurred on the right side between the bottom aluminium skin and the composite layer. Whilst the two layers rebonded at the end of the forming process, this caused a more significant stepped shape between the two layers at the right end. Severe damage occurred along the centre axis of the composite layer at the tip region, because the composite core became the bottom of the structure after the delamination, and so was no longer at the neutral axis. This meant that the reinforcing glass fibres were broken due to the excessive tensile stresses caused during the forming process. The failure modes represented in the experiments were correctly predicted by the model. The specimens formed by the V-shape forming process at temperatures from 140°C to 200°C. The specimens were fractured at 140°C and 160°C, and showed evidence of debonding at 190°C and 200°C. The edge of the 190°C specimen looks different as its speckle pattern is shown.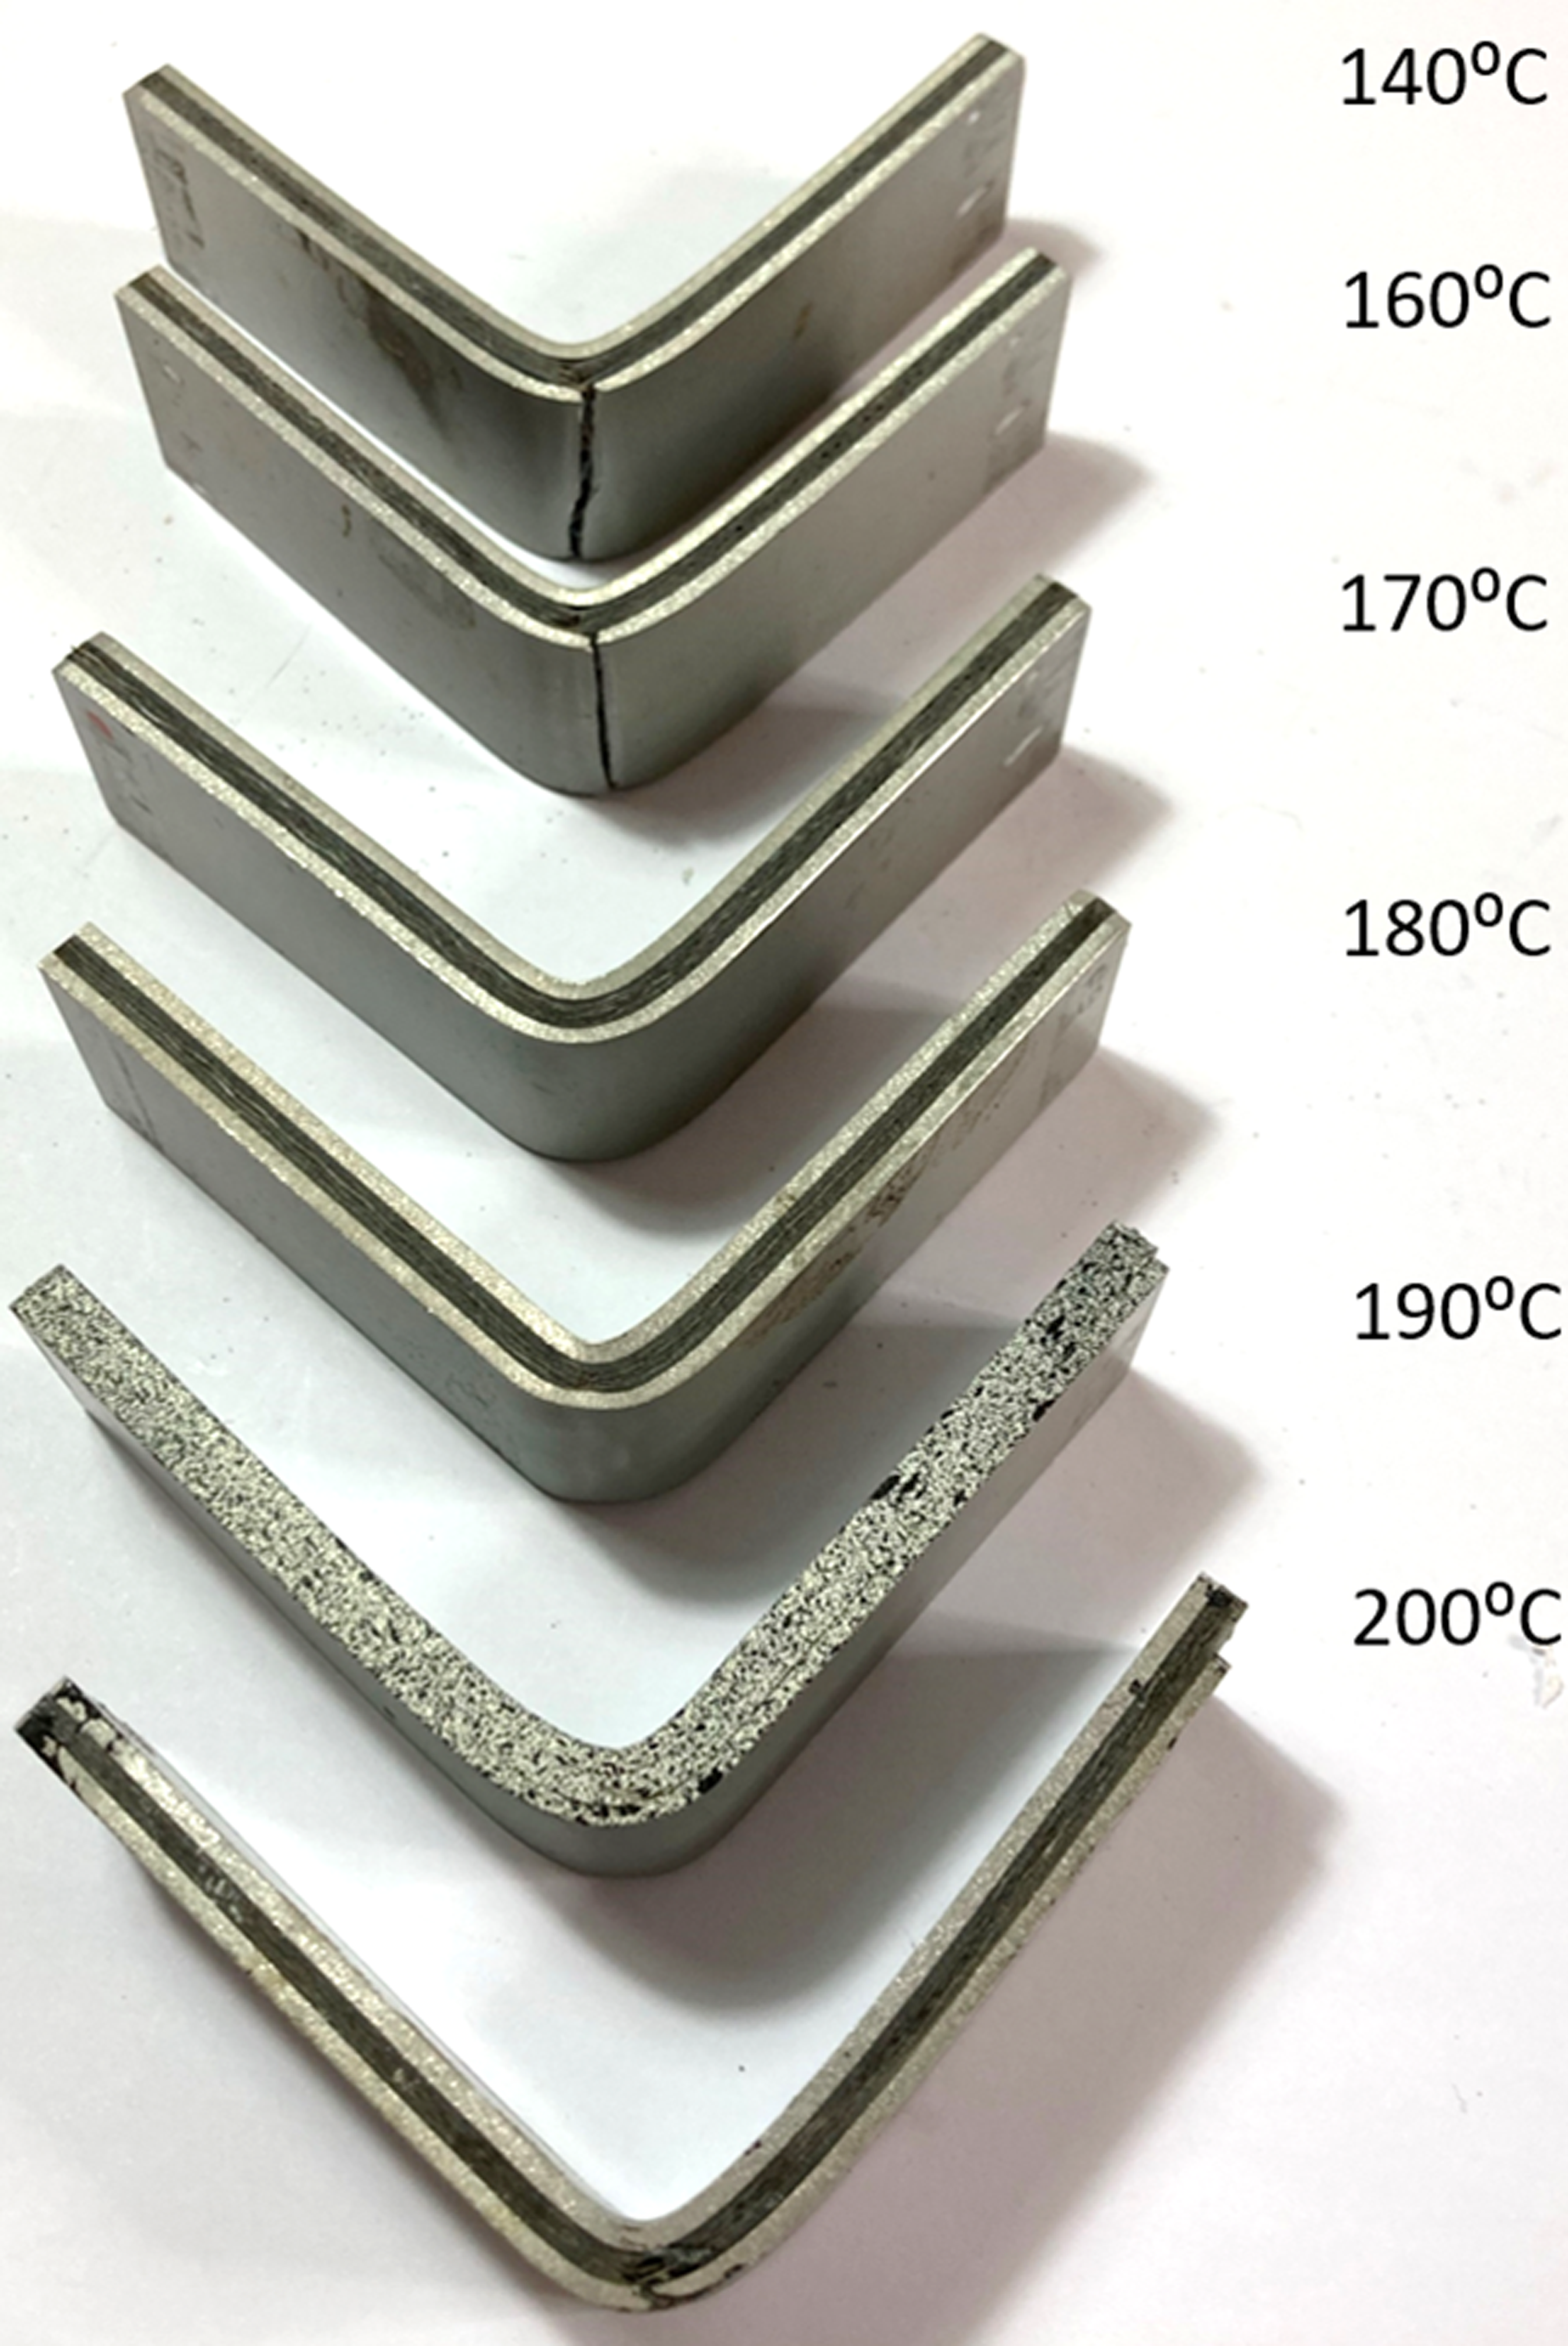
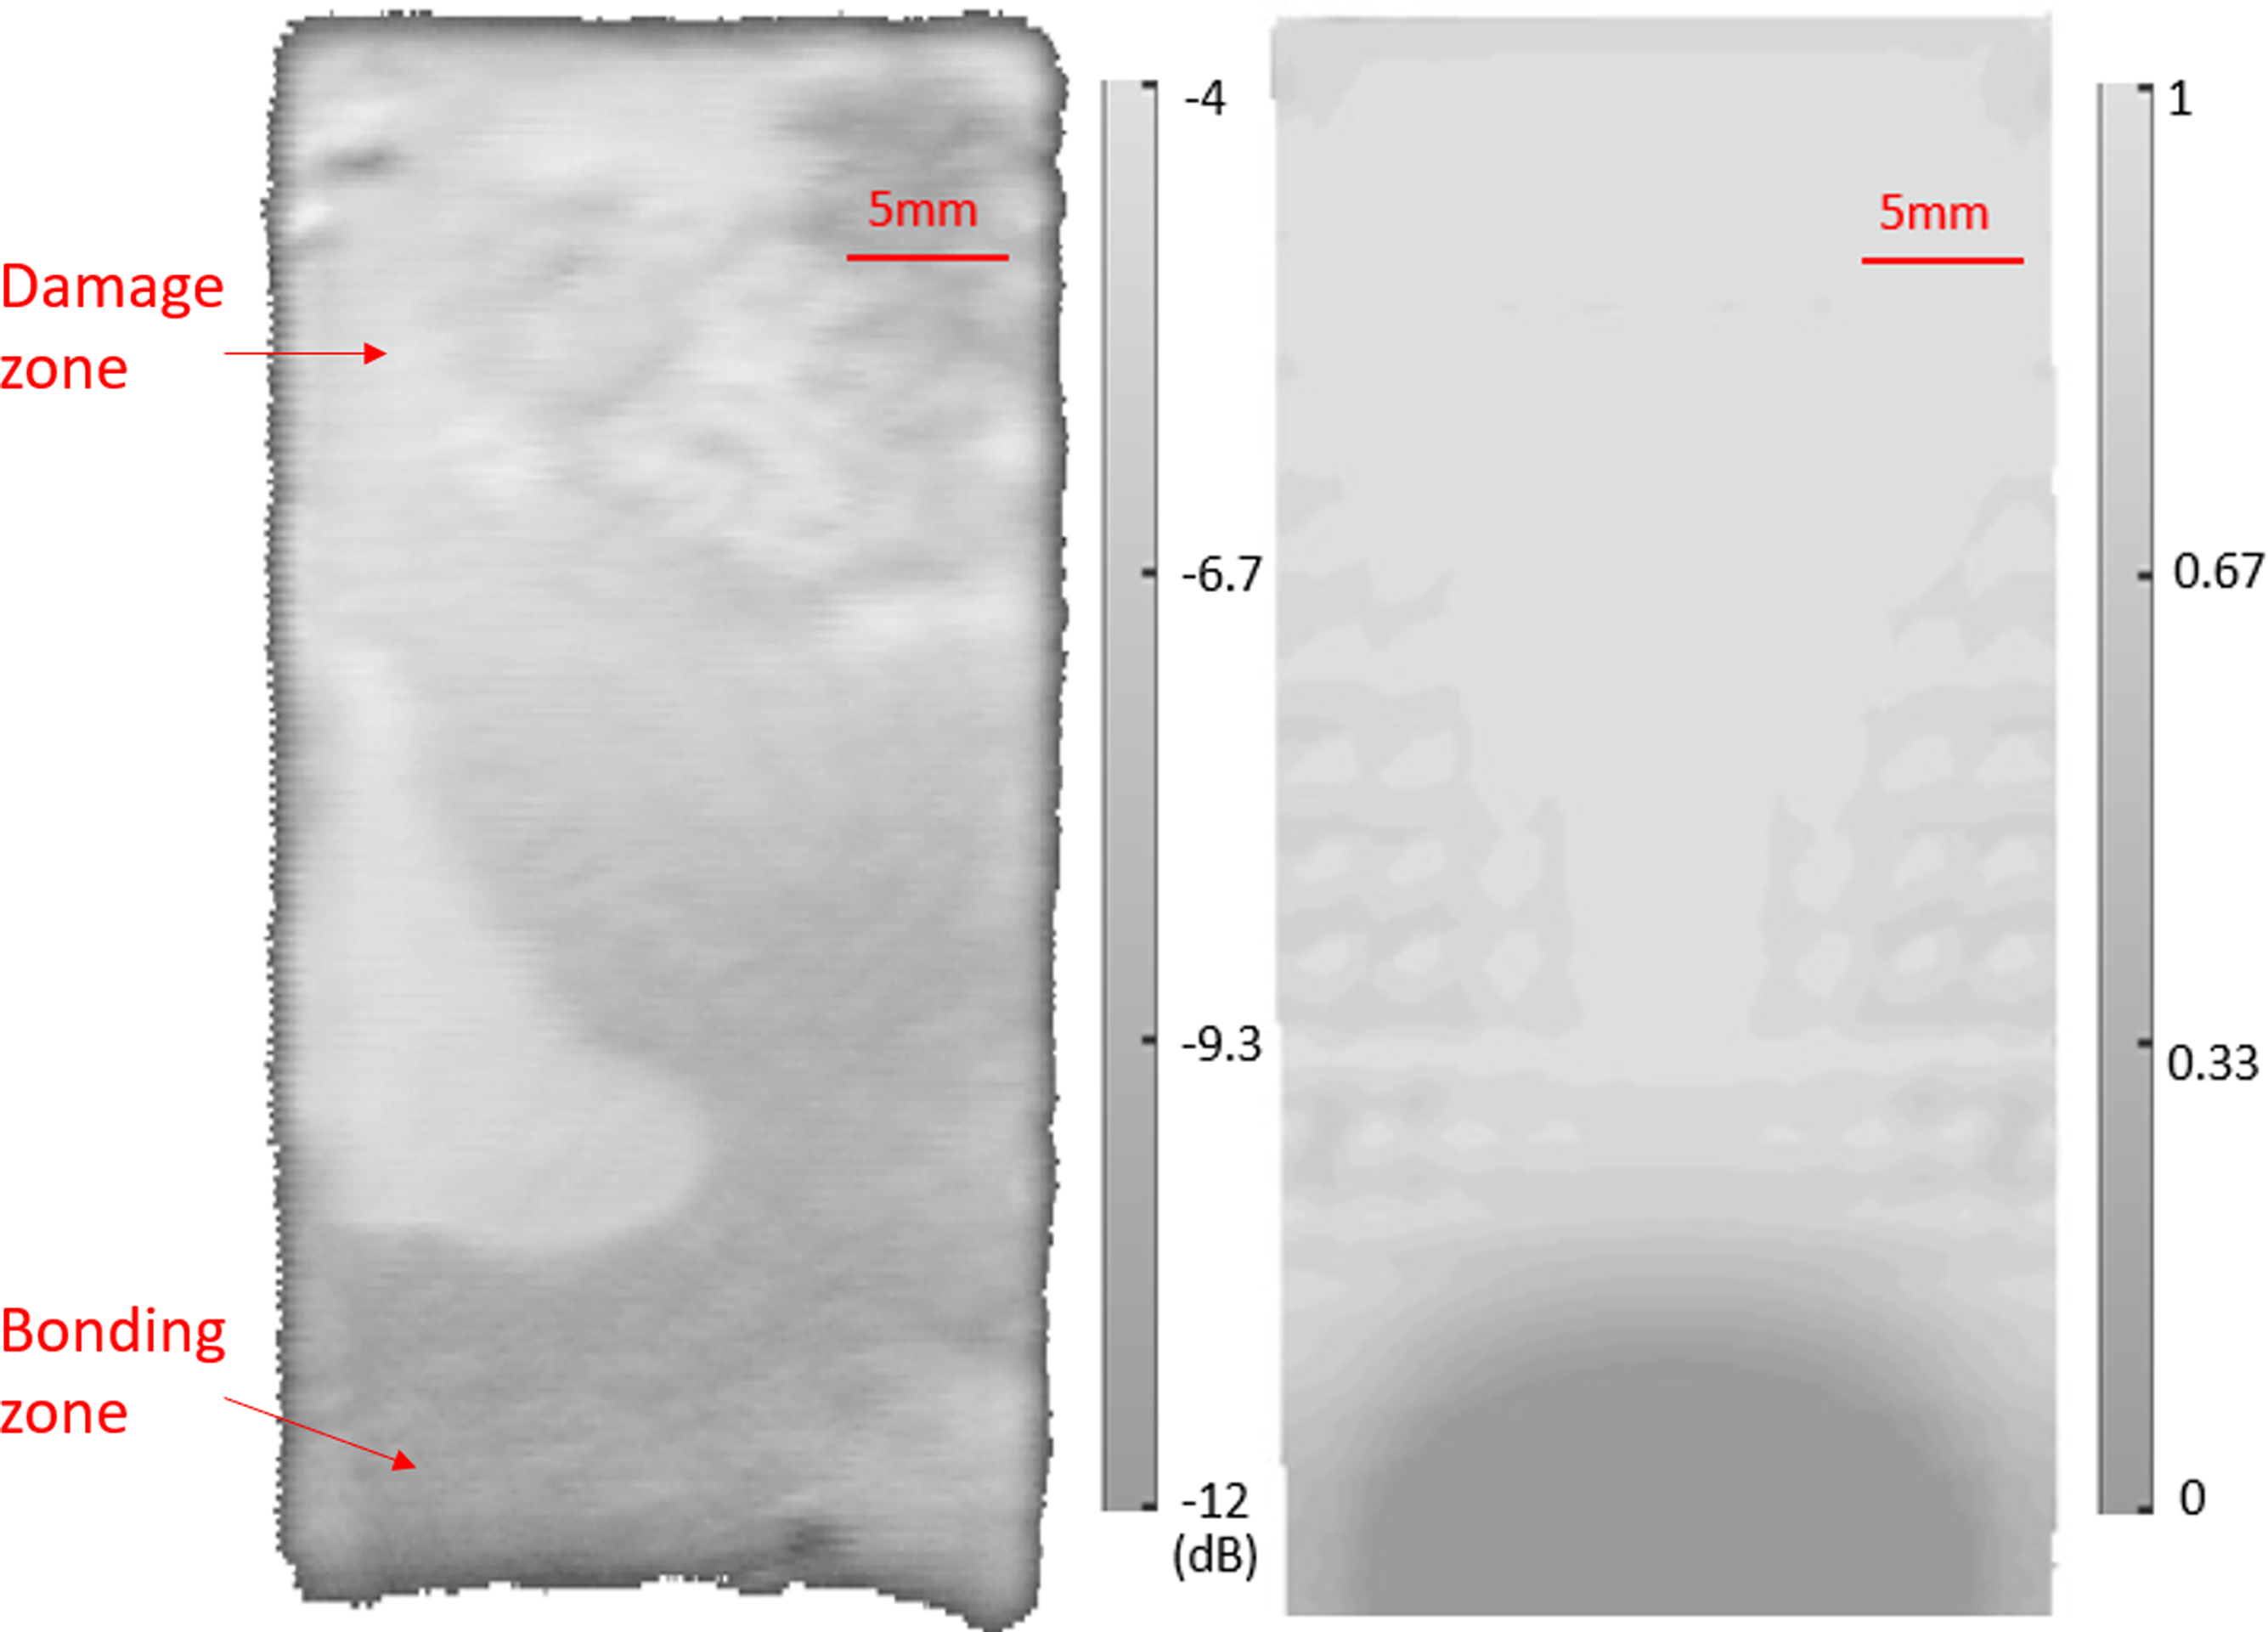
The damage to the cohesive bond between the bottom aluminium skin and the composite core, along the straight side of the specimens after the forming process, were measured using C-scan ultrasound and compared to the corresponding model results. The delaminated area in the C-scans is indicated by the brighter colour, indicating that a stronger echo was received from the interface due to the damaged bond, and this was compared to the scalar stiffness degradation for the cohesive surface predicted by the model. At 180°C, the damage zone on the straight side was adjacent to the curved tip, and the area from the end of the straight side to the edge line of the damaged area was considered as the bonding zone; this is shown in Figure 10. The average length of the bonding zone at the two pressing depths were compared between experiment and simulation, and the model results showed a larger undamaged area. In the experiment, the length of the bonding zone was 31.24 mm when the mould was partially closed, and 32.68 mm when the mould was fully closed. In the model, the length of the bonding zone was 40.02 mm when the mould was partially closed and 40.20 mm when the mould was fully closed. The bonding length in the model result was higher than the experimental result, and the fully closed and partially closed mould caused insignificant differences to the bonding length in both the experimental and modelling results. Figure 11 shows that at 190°C, both experimental and modelling results indicate delamination occurred along almost the entire flat portion of the specimen due to the interlaminar delamination. A large bonding zone remained adjacent to the curved tip at this temperature. The area of the bonding zone in the experimental results were larger than the area in the modelling results. The bonding surface between the bottom aluminium skin and composite core of a formed specimen (left) and model result (right) at 180°C. The left colour bar indicates the intensity of the ultrasound echoes, and the right colour bar indicates the scalar stiffness degradation of the cohesive surface. The bonding surface between the bottom aluminium skin and composite core of a formed specimen (left) and model result (right) at 190°C. The left colour bar indicates the intensity of the ultrasound echoes, and the right colour bar indicates the scalar stiffness degradation of the cohesive surface.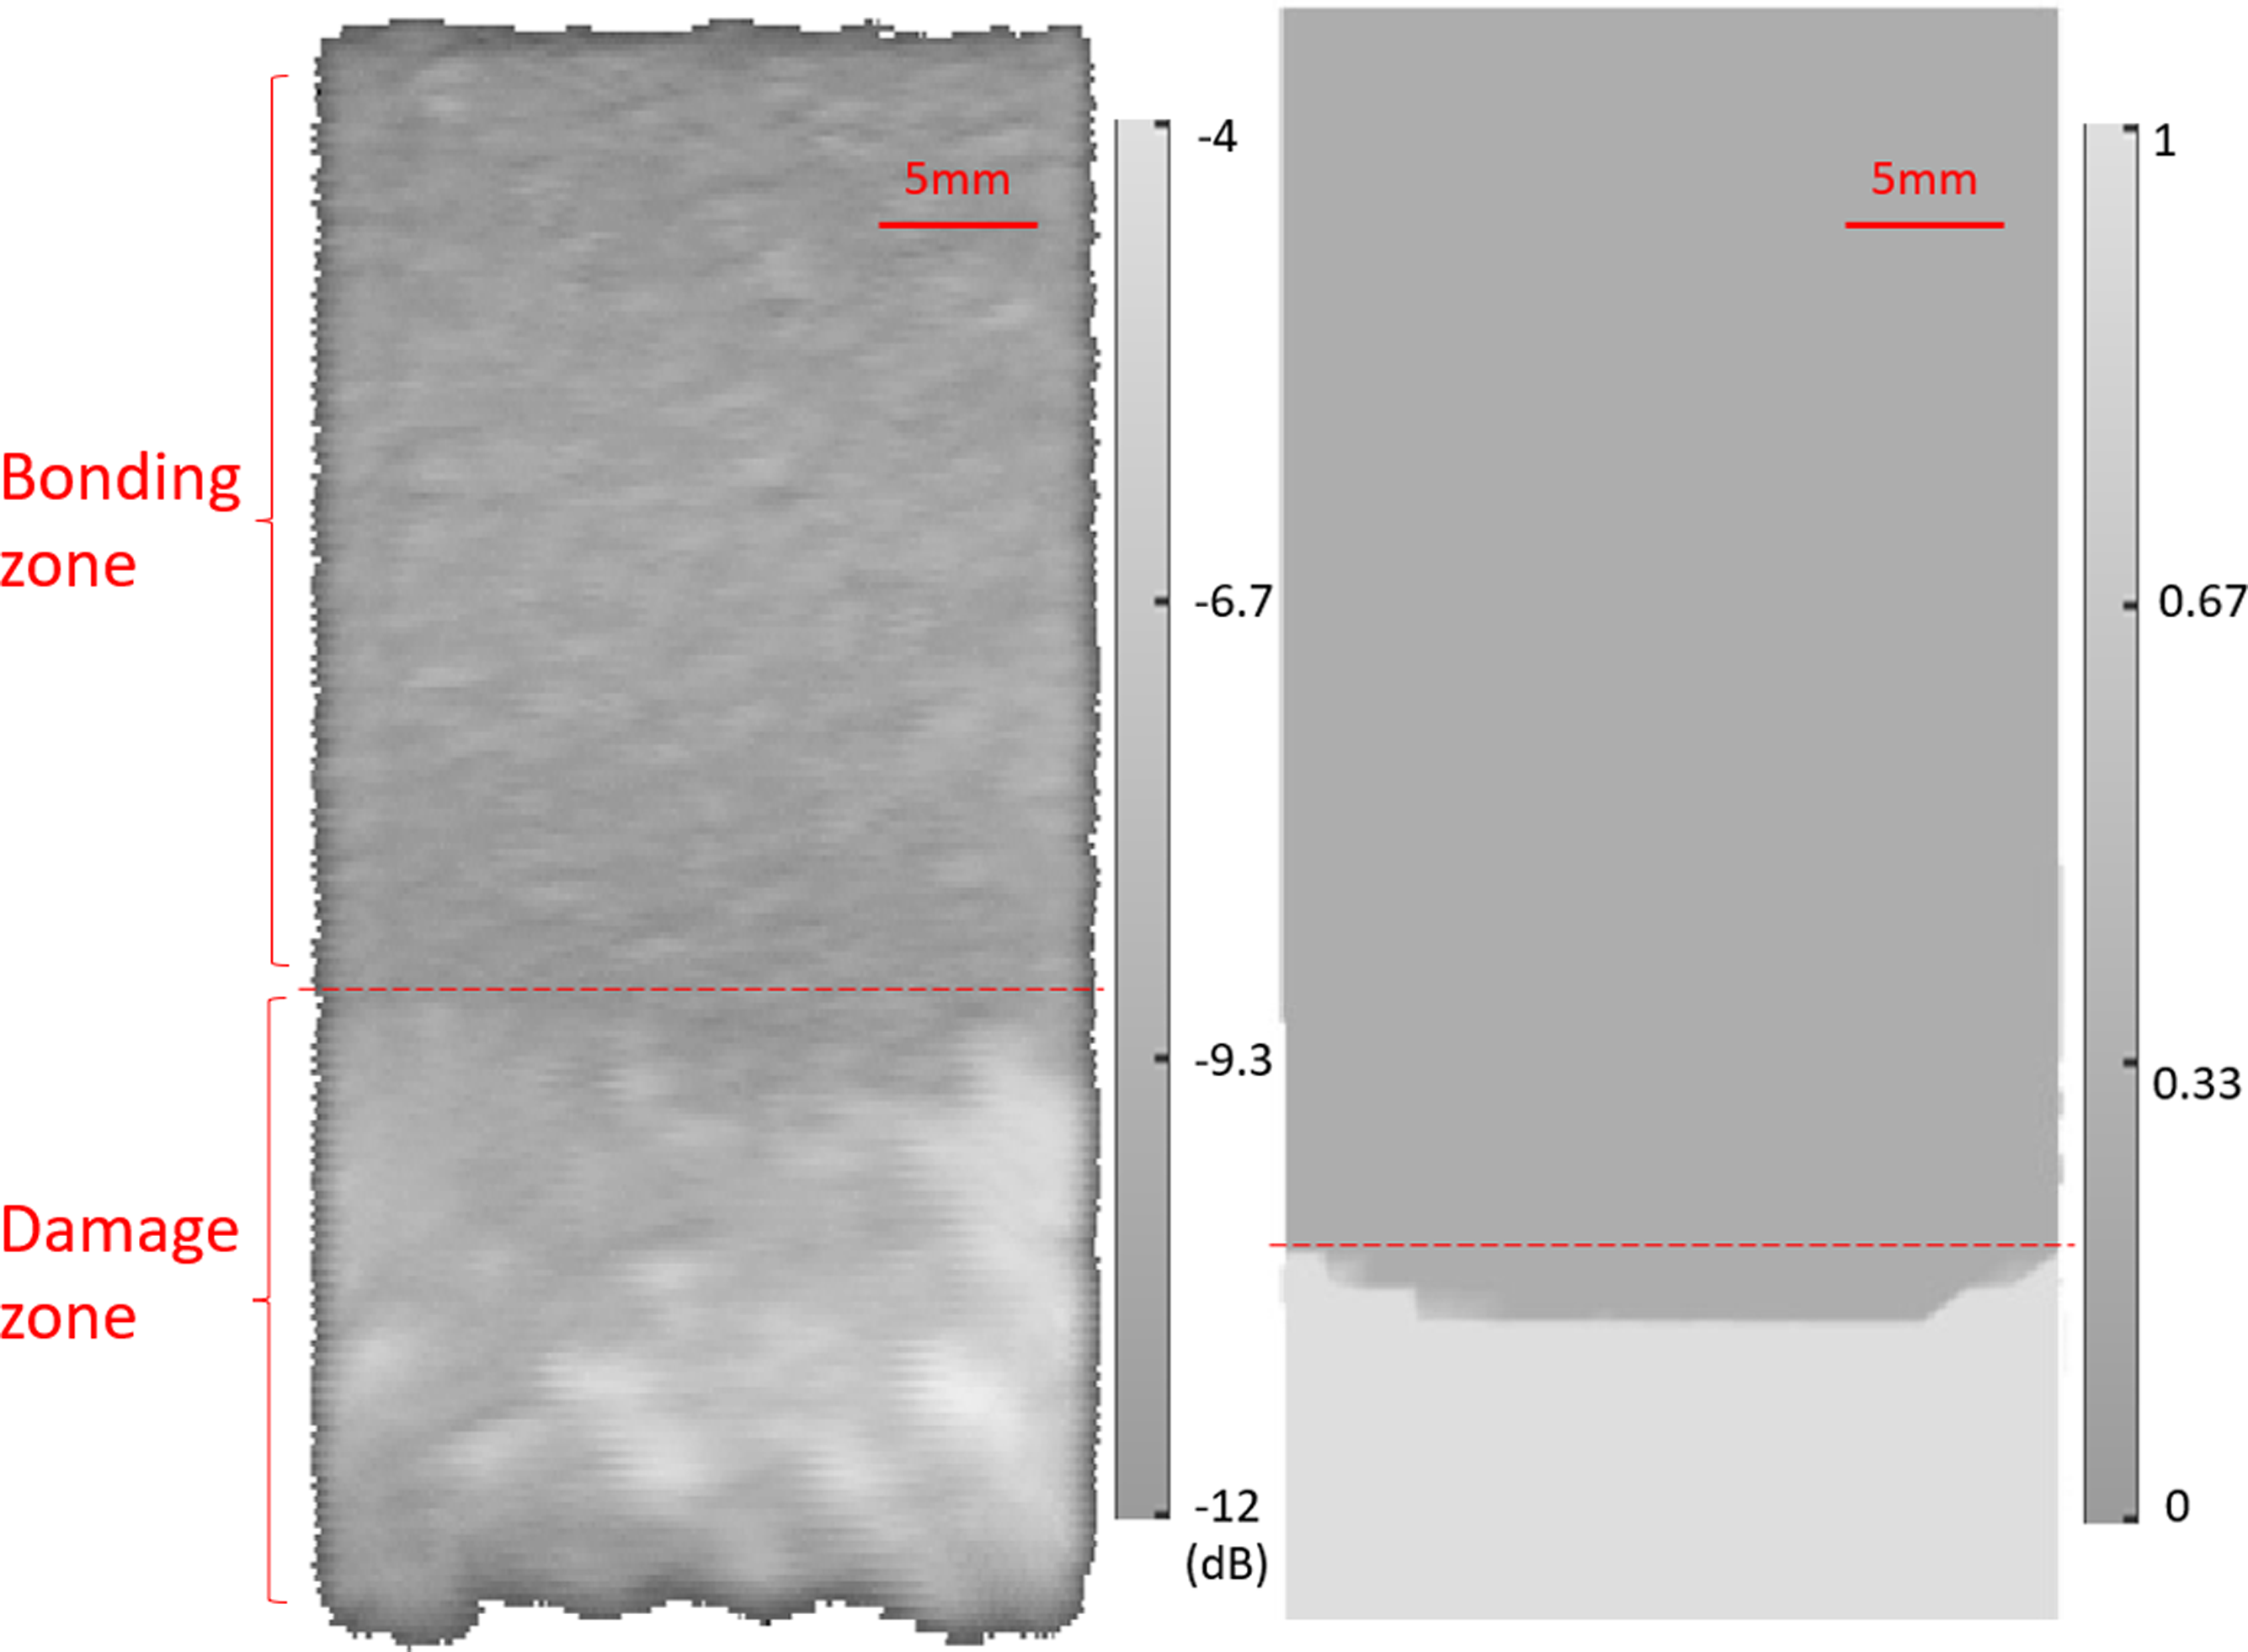
The approximate tip radii of the specimens for the experiment at 180°C were 10.12 mm and 9.43 mm when the mould was partially closed and fully closed, respectively. The radii for the model at 180°C were 9.86 mm and 9.21 mm when the mould was partially closed and fully closed. Both the experimental and modelling results showed that the approximate tip radius was reduced with increasing pressing depth. The surface profiles at the curved tips of the formed specimens in both experiment and model were compared with the surface profile of the fitted standard cylinders, shown in Figure 12. The left and right edge of the specimens bulged outside the surface of the fitted cylinders due to Poisson’s effect. The surface of the formed specimens slightly wrinkled along the length direction, and the surface profile of the experiment specimens showed a more severe variation from the fitted cylinders compared to the modelling results. The shape difference between a fitted cylinder and the curved tip of a simulated specimen (top), and experiment specimen (bottom). The shape difference map has been unwrapped from the cylinder such that it is shown on a 2D plane, thus the y-axis shows the angular position of the grid points.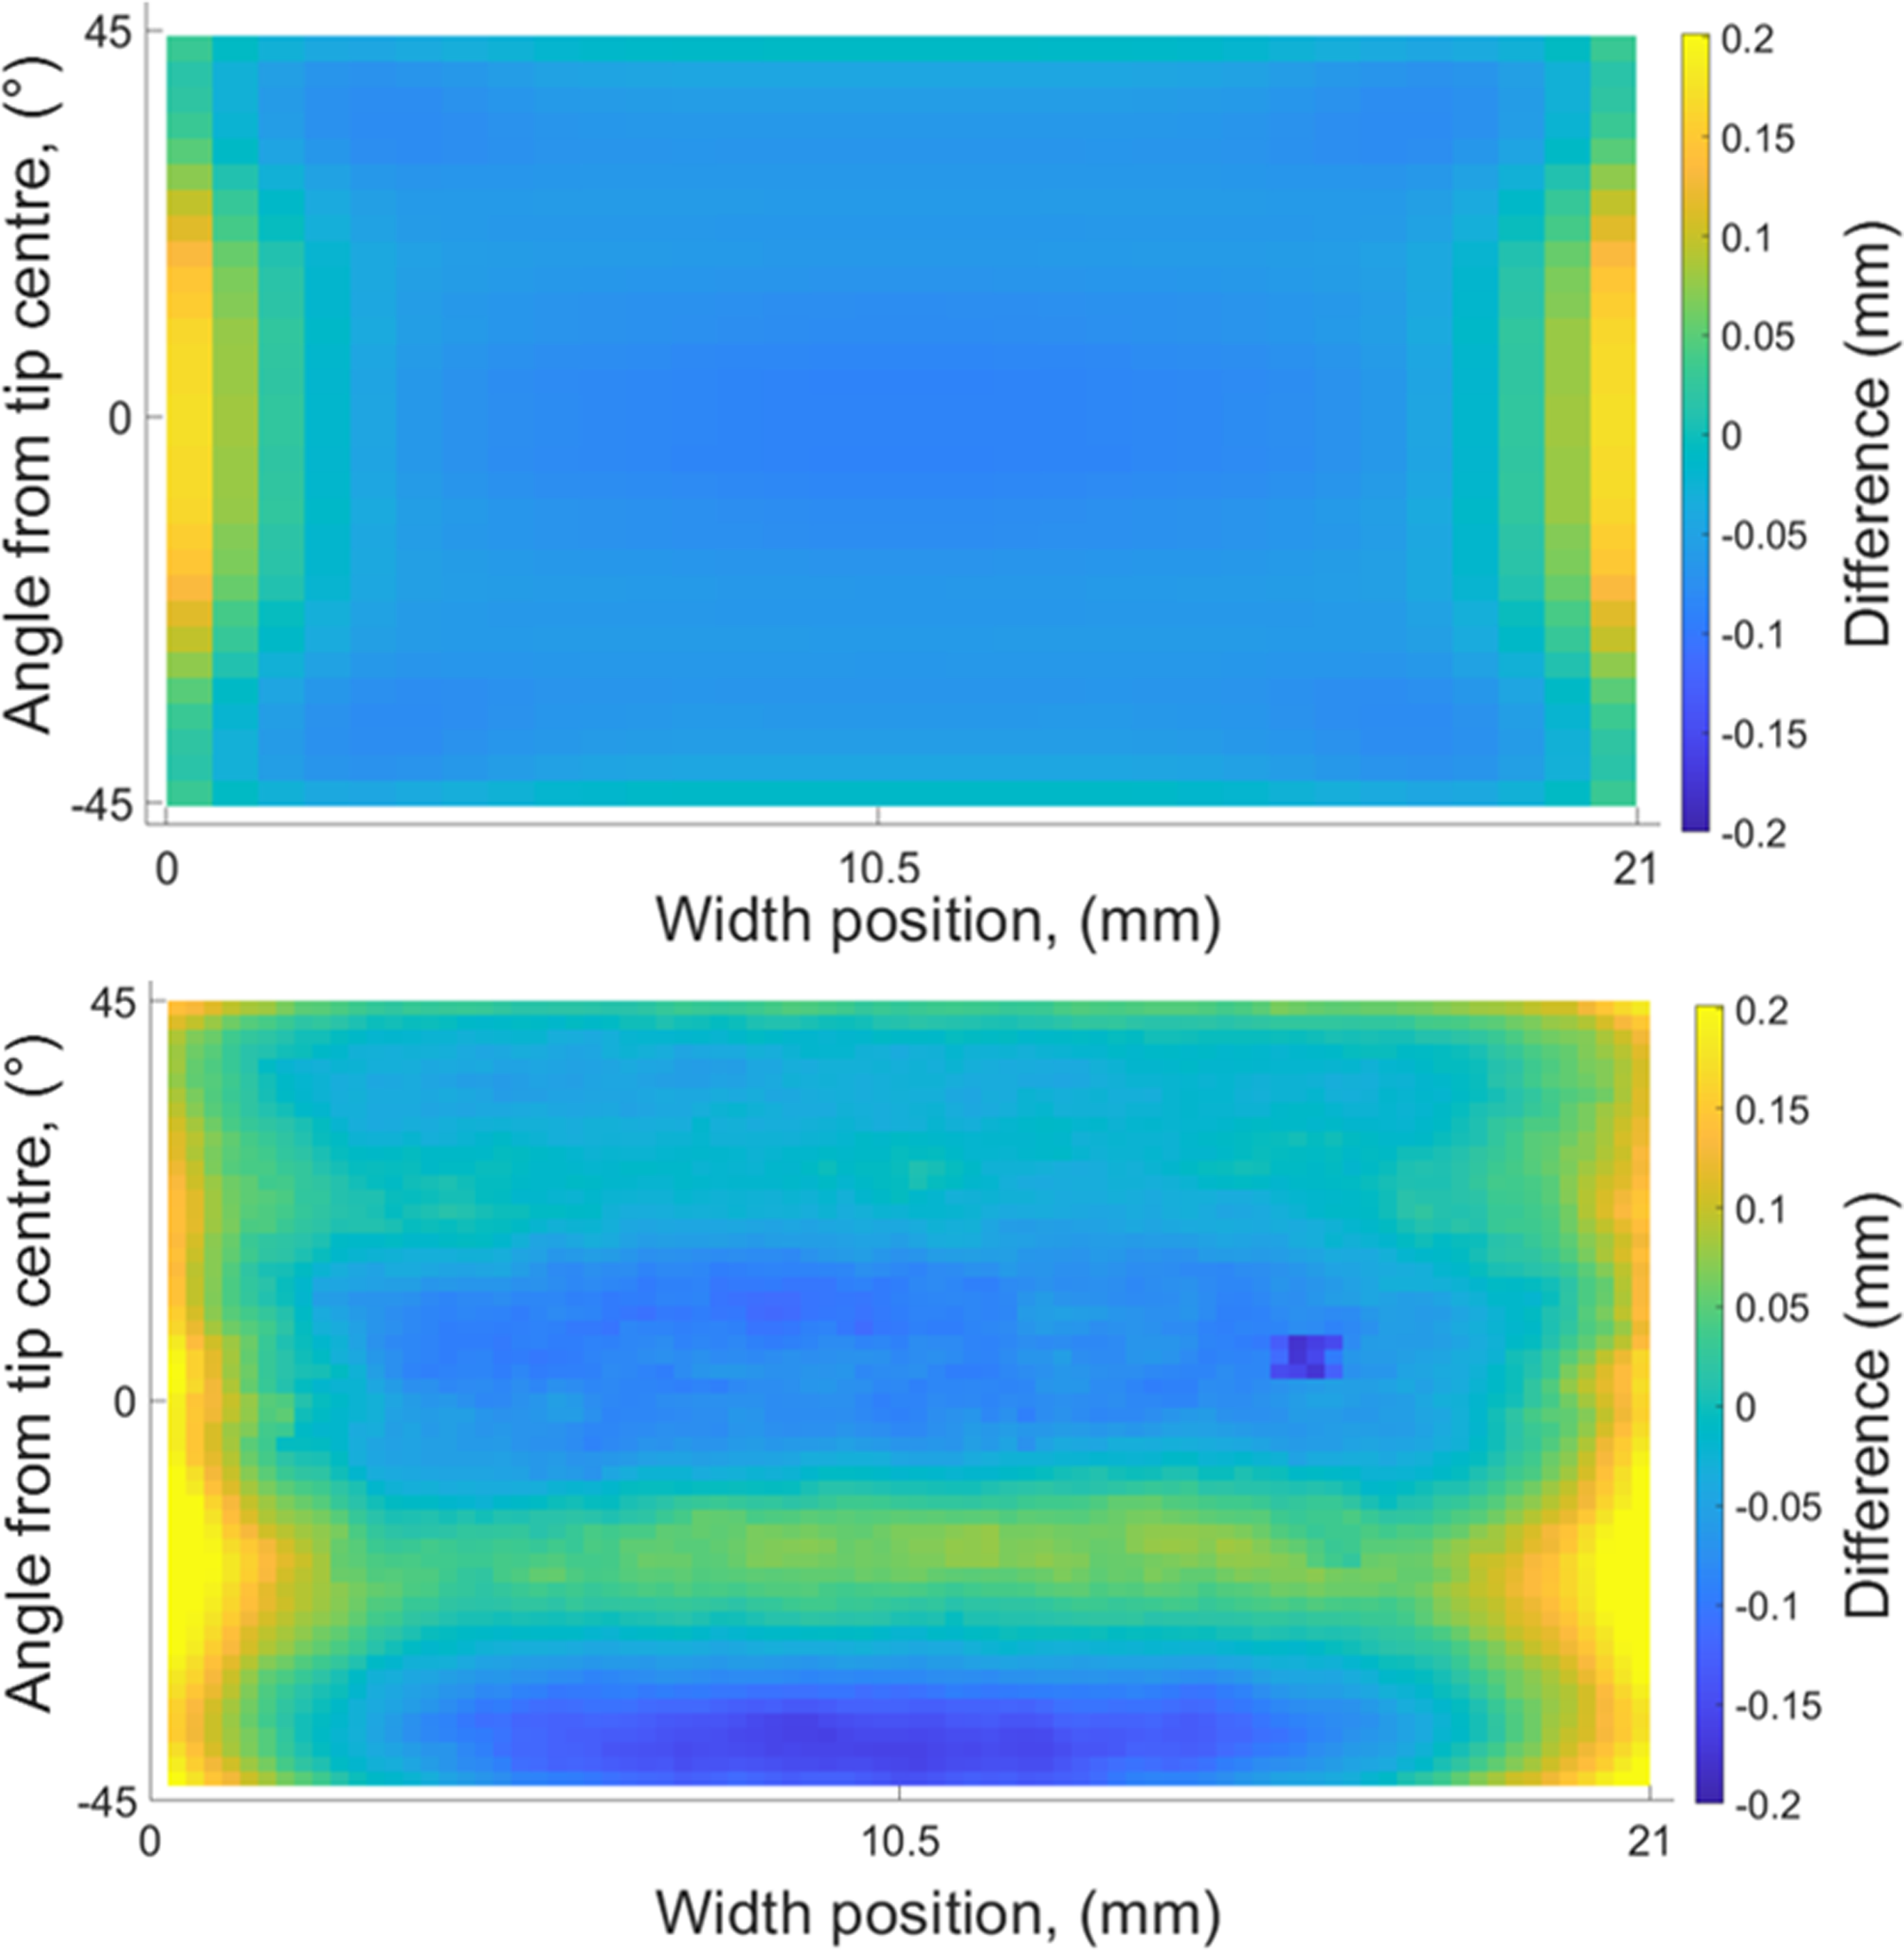
The cross section of the tip area of a specimen formed at 180°C was polished and observed by an optical microscope (Epiphot TME, Nikon, Japan) with a magnification of 20 times, which is shown in Figure 13. Two damage modes were observed in the glass fibre reinforced composite layer: the damage on the warp yarns along the longitudinal direction was caused by the fracture of constituent fibres, while the damage on the weft yarns perpendicular to the longitudinal direction was caused by the separation of constituent fibres. No evidence was found of damage to the PA6 matrix. The cross section of the tip area of a specimen formed at 180°C. Two damage modes were observed on warp and weft yarns in the glass fibre reinforced composite layer.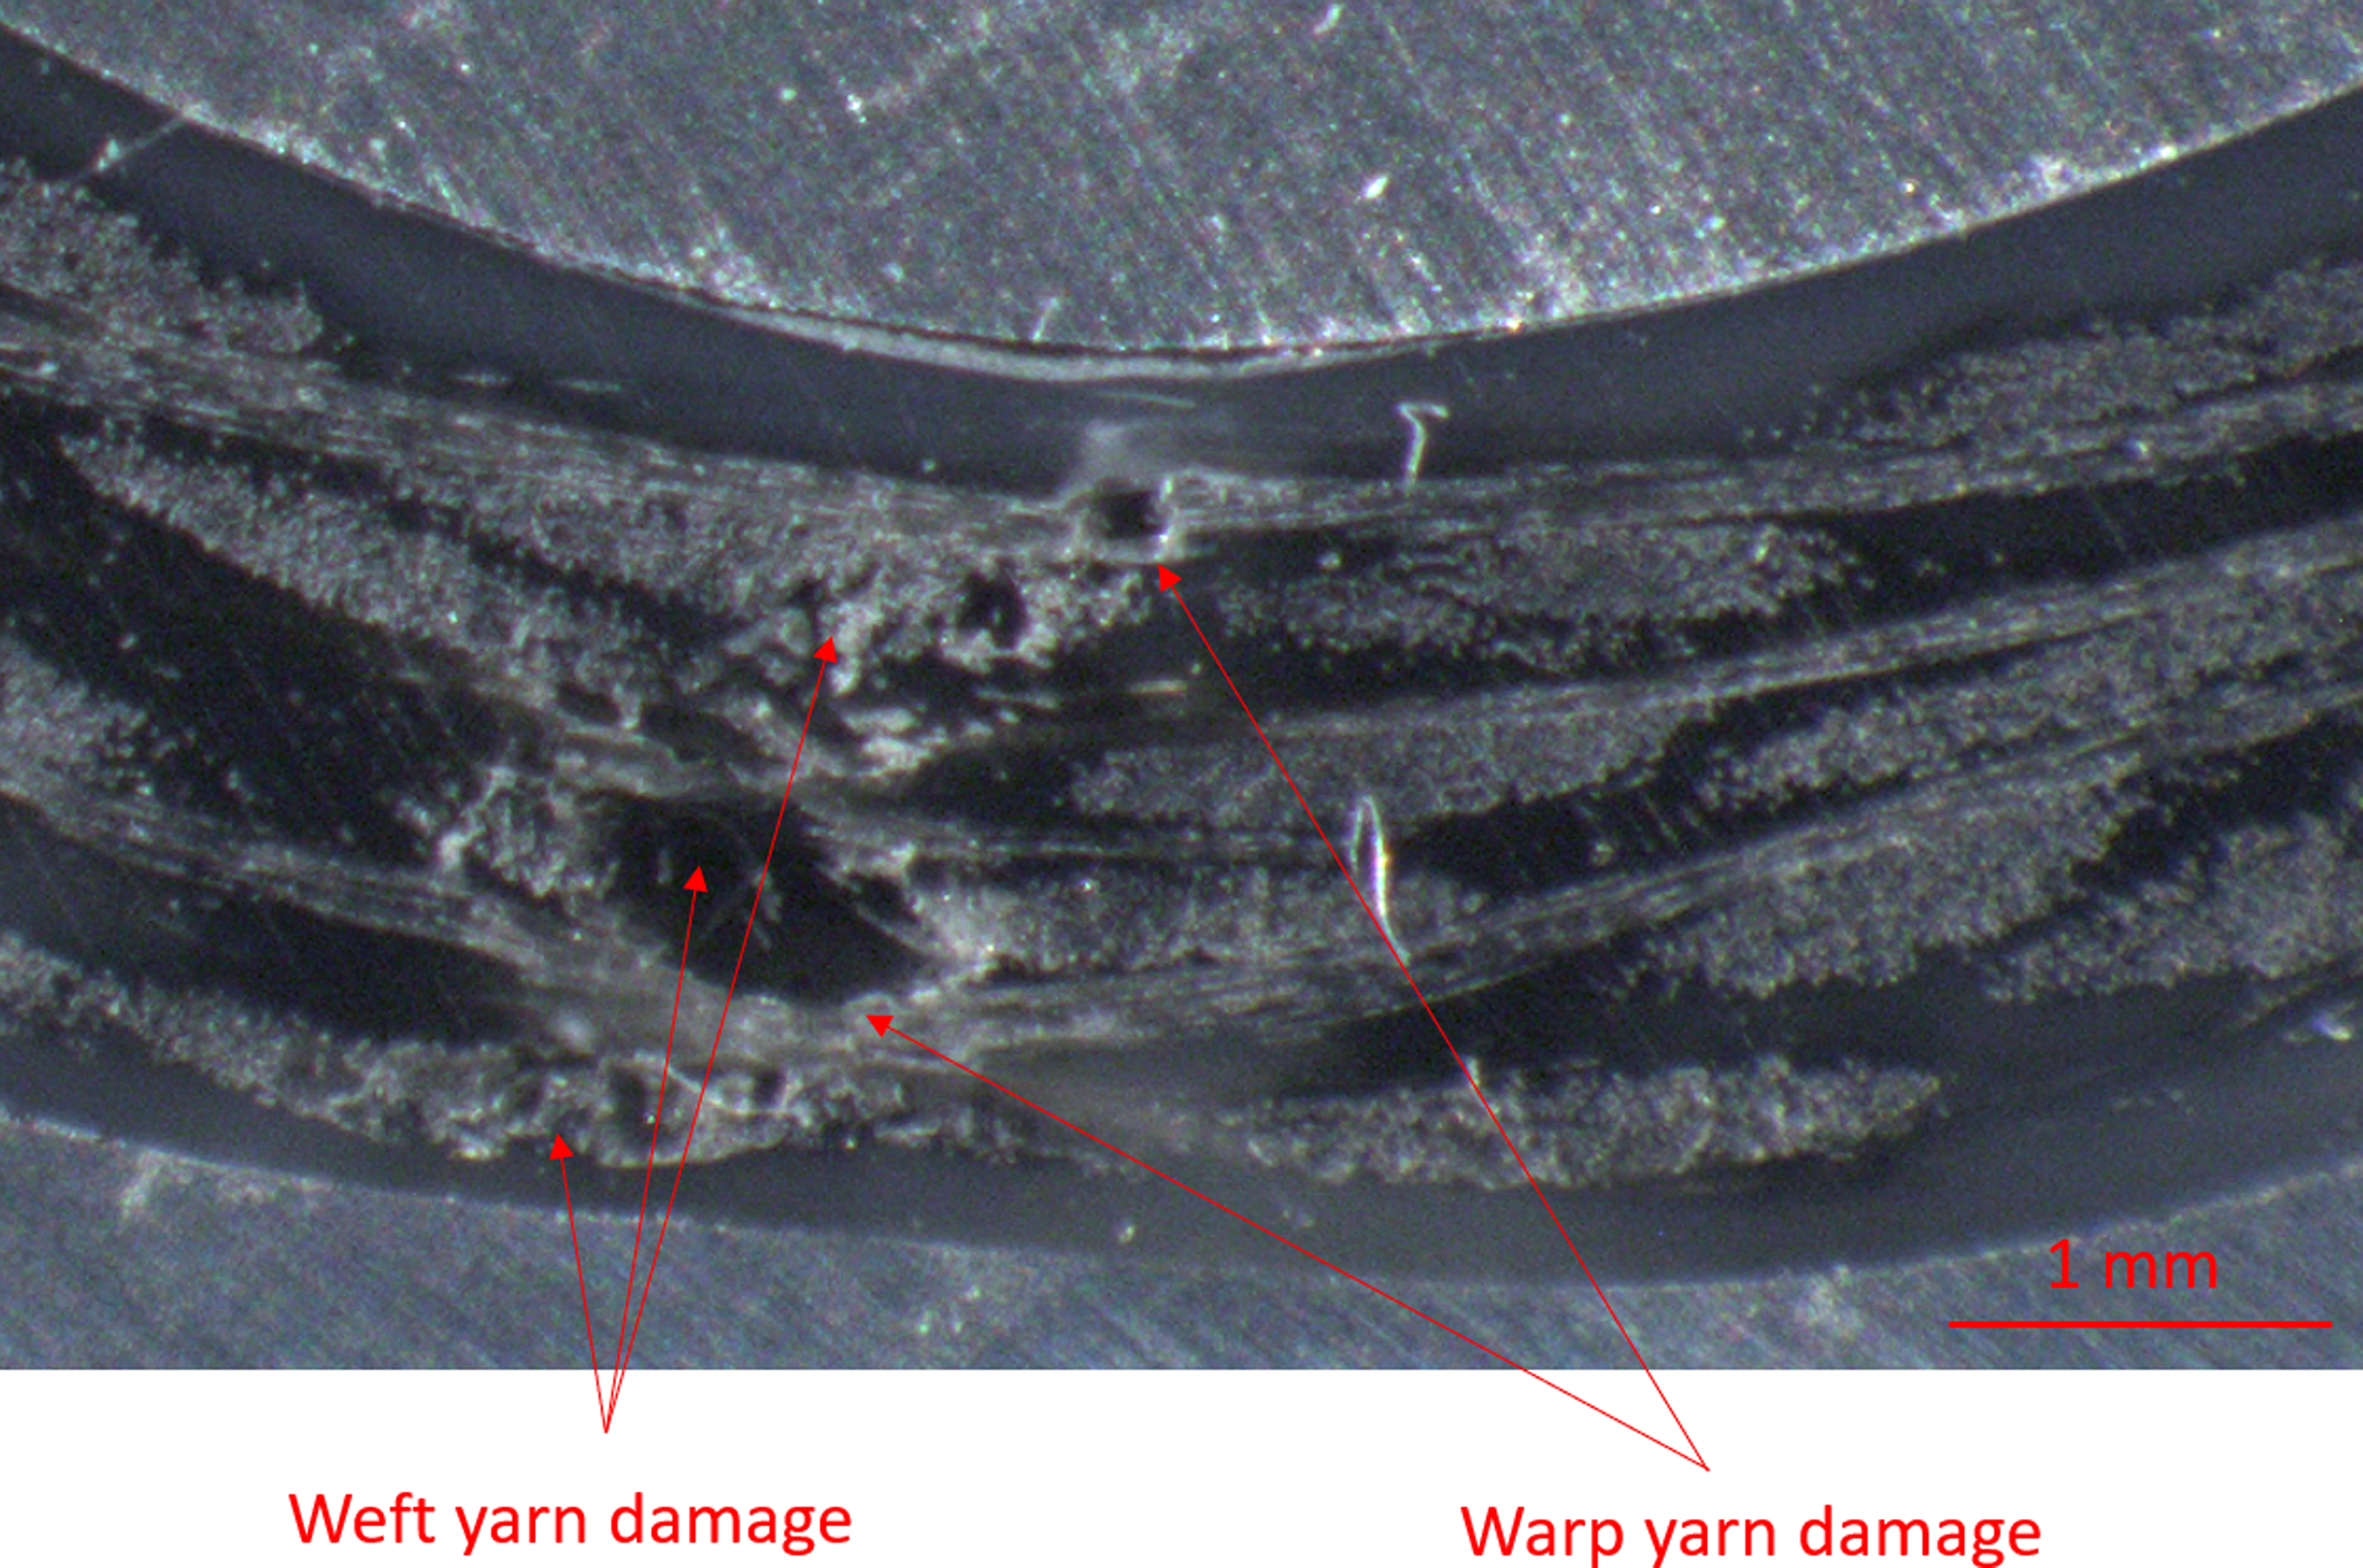
Discussion
Based on the investigation of the strain field on the edge of FML specimens, this study has provided a more comprehensive understanding of the mechanisms of FMLs during the forming process. For the curved tip of the V-bended specimens at 180°C, both the bottom aluminium skin and the composite core experienced high tensile strain in excess of 0.2 ε. As shown in Figure 6, the bottom aluminium skin showed a longitudinal tensile strain (in the length direction of the specimens) that varied from 0.2 to 0.3 ε, and the composite core showed a longitudinal tensile strain of more than 0.3 ε which indicated a significant stretching of the PA6 matrix and likely damage to the reinforcing glass fibres due to the maximum elongation of the prepreg being 0.0558 ε. The strain magnitude in the glass fibre reinforced PA6 layer changed more rapidly along the length of the specimen compared to the aluminium skin and PA6 layer. With the strains measured in the layer changing from a high-strain zone with over 0.3 ε of longitudinal tensile strain to a low-strain zone of less than 0.05 ε. This strain distribution in the composite core indicated fracture of the reinforcing glass fibres, while the strain field can still be measured because the PA6 matrix has a large maximum strain of more than 1 ε, as is shown in Tables 2 and 3. This assumption has been supported by the damage modes of the composite layer observed in Figure 13. This suggests that the longitudinal tensile strain should be minimised to prevent the fracture of the reinforcing fibres. This could be achieved by using fibres with a higher tensile strength or reducing the thickness of the FML. This could also be achieved by using +/-45° glass-reinforced composite plies which will have a higher strain capability in the longitudinal direction.
The strain distribution at the tip area of the specimens at 190°C was similar to the strain distribution at 180°C, which is shown in Figure 7. At both temperatures, the transverse compressive strain (i.e. in the thickness direction of the specimens) was concentrated on the upper part of the upper aluminium skin, which means the neutral axis was shifted to the upper skin, and the interlayer bonding was sufficient at the curved tip of the specimens. The strain magnitude in the bottom aluminium skin was found to be smaller at 190°C than at 180°C, which may be caused by the weaker bonding between the bottom aluminium skin and composite core along the straight side at 190°C. The shape of the strain concentration zone on the composite core at 190°C was more irregular than the zone at 180°C, showing a higher degree of damage of the reinforcing glass fibres. The comparison indicated that the higher forming temperature at 190°C not only caused interlaminar delamination along the side, but also caused more severe damage in the composite core at the curved tip.
The maximum principal strain concentration zones on the straight side of the specimens at both 180°C and 190°C appeared on the PA6 layers between the aluminium skin and glass fibre reinforced PA6 core, which is shown in Figures 6 and 7. The strain magnitude at the PA6 layer adjacent to the bottom aluminium skin is higher than that of the PA6 layer adjacent to the upper aluminium skin. The experiment on the V-shape forming of the specimen can be divided into two phases. 46 The first phase extends from the start of the bending process until the time the specimen touches the upper mould. The second phase includes the remainder of the forming process during which the two sides of the specimen experience a pressing load by the mould in order to form the flat sides. In this study, the strain magnitude of the PA6 layer in the second phase was significantly higher than that in the first phase, which may indicate that the strain concentration zones on the PA6 layers were mainly formed by the pressing load from the moulds which occurred in the second phase. The strain concentration zone appeared only on the PA6 layers because the stiffness of PA6 is dramatically lower than aluminium and prepreg at temperatures above 180°C, which is shown in Tables 2 and 3. The larger strain magnitude on the PA6 layer adjacent to the bottom aluminium skin, compared to that of the PA6 layer adjacent to the upper aluminium skin may be caused by the relatively higher temperature at the lower layer, so that the lower layer shows a higher degree of elongation under the transverse compression from the moulds. As shown in Figure 7, the strain magnitude on the upper PA6 layer in the experiment result is about 0.05 ε higher than that in the model result, which may be caused by temperature variation along the thickness direction of the specimens in the experiment. The speckle pattern on the PA6 layer was damaged due to the severe shear deformation between the bottom aluminium skin and composite core at 190°C, causing blank strips on the lower PA6 layer in the DIC strain map, as shown in Figure 7. There were no blank strips in the same area at 180°C, shown in Figure 6, which supports the idea that the deformation can be reduced by the selection of the proper forming temperature. The prediction on the side edge strain field caused by the forming process would be more accurate if the mechanical properties of the constituent materials were directly measured at the maximum temperature of 200°C, however the amount of extrapolation was limited and the in-depth validation based on strain data confirmed good model performance.
As has been mentioned in the results, the damage to the cohesive bonding surface between the bottom aluminium skin and PA6 layer in the C-scan ultrasound and model results showed a similar morphology, while the specific damage area measured from the experimental results was different from the model results. The reason may have been that the damage evolution of the cohesive bonding surface is sensitive to various factors such as the temperature and the loading condition on the bonding surface during the forming. Therefore, the 28.4% longer bonding zone in the model results compared to the experiment results at 180°C was considered as acceptable. By introducing studies on more intermediate forming temperatures such as 185°C, additional insights into the precise transition between the current understanding on the interlayer deformation and damage progression at 180°C and 190°C could potentially be acquired. This investigation would need more experiments and modelling work, which could be carried out in further studies.
Compared to the model result, the curved tip of specimens in the experimental results showed a 2.5% larger radius value and more severe surface wrinkling, which can be observed in the shape measurement data shown in Figure 12. The difference was caused by the larger strain magnitude on the lower PA6 layer and bottom aluminium skin in the experiments, which can be supported by the strain field in Figure 6. For simplification, the stress-strain relationship of the PA6 layer was modelled by elasto-plasticity, and that of the PA6 matrix in the prepreg was modelled together with the reinforcing glass fibres by linear-elasticity up to the onset of failure. In real practice, PA6 shows viscoelasticity-viscoplasticity above the glass transition temperature at 60°C, 47 which cause the degradation of its stiffness. This may be the reason of the higher deformation extent of PA6 material and the adjacent aluminium skin in the experiment. As has been mentioned in the modelling section, the thermal expansion of the materials has not been considered in the model, which may also cause a small but consistent deviation between the experimental and modelling results. In future studies, the accuracy of the model could be further improved by considering the thermal expansion of materials and applying a more complicated viscoelastic-viscoplastic constitutive model for PA6.
The study primarily focuses on 2/1 lay-up of FMLs, while the concept of the quantitative validation workflow for numerical models could be generalized to alternative lay-ups with different fiber orientations or layer thickness ratios, because the fundamental thermal forming mechanism explored in this study remain valid. Further work could make use of a similar methodology to analyse the influence of various lay-up configurations of FMLs, enabling a broader application of the quantitative validation workflow.
The DIC strain field measurements provide substantial information about forming mechanisms and how they affect forming quality for the deep drawing of FMLs for applications such as V-shape and U-shape forming. However, it is often difficult and costly to apply the technique for each variation of the specimen structure and mould design. Also, DIC strain measurement cannot be applied to the deep drawing of FMLs in closed moulds such as box shape forming. In this work, the FEM model was quantitatively validated using orthogonal decomposition to demonstrate the reliability of the model predictions. Once validated, such a model – so long as it is not substantially changed – can be used to optimise forming processes. This optimisation can be done with increased confidence that the predictions, and thus the optimal solution, are correct. The approach could be used by a manufacturer such that changes to production processes can be predicted and issues solved more efficiently. It also enables new component geometries to be tested virtually, reducing the amount of physical testing required for new products, leading to lower costs during product development and more agile manufacturing.
Conclusions
In this work, thermoplastic based fibre metal laminate (FML) plates were formed by a pair of moulds into a V-shape at elevated temperature from 140°C to 200°C. For the first time a digital image correlation (DIC) system was used to measure the evolution of the strain fields on the side edge of the FMLs during the thermo-forming process. The details provided by the measurements allow an in-depth understanding of the forming mechanisms of FMLs, which could be used to improve the forming quality of FMLs in industrial applications.
Finite element modelling of the forming process of FMLs was quantitatively validated using an orthogonal decomposition method. This was used to compare experimental and model strain fields on the edge of the laminates. The validated model was used to predict the shape of the curved tip and the damage condition of the specimens at 180°C and 190°C, and the data for the experiment results was measured by DIC and ultrasonic C-scan. Compared to the experiment results, the model has successfully captured the overall tendency of deformation characteristics of FMLs, showing the reliability of the validated model. Validated models could be applied to the optimization of manufacturing parameters in the thermal forming of FMLs, such that the optimised settings for a process could be determined by simulation, reducing costs.
Footnotes
Author contributions
QL: Methodology, Validation and Writing - Original Draft. WJRC: Supervision and Writing - Review & Editing. ZG: Supervision and Writing - Review & Editing.
Declaration of conflicting interests
The author(s) declared no potential conflicts of interest with respect to the research, authorship, and/or publication of this article.
Funding
The author(s) received no financial support for the research, authorship, and/or publication of this article.
Data availability statement
Data is available upon request.