
Abstract
Designing highly stressed offshore renewable energy composite structures (e.g. wind and tidal turbine blades) necessitates characterisation of woven fabric composite under off axial loading. In this work a combined method of finite element analysis, digital image correlation and microscopy is used to assess the effect of ply orientation on the tensile/shear properties and failure modes of woven glass fibre reinforced polymer composites. Full field strain maps obtained by the digital image correlation method were used to evaluate the damage development and the inhomogeneity of strain localisation. The development of finite element models of mechanical test specimens is based on the analysis of micro-mechanical models of representative volume elements using a homogenisation technique in order to calculate the effective orthotropic properties. The agreement between numerically and experimentally calculated strains obtained in the elastic regimes indicates that stress analysis conducted by numerical methods is useful when characterising the effect of ply orientation on mechanical behaviour. Strain measurement conducted by the digital image correlation method indicated that there is a strong relationship between the strain distribution and the microstructure/ply orientation. In addition, it was found that the levels of localised tensile strain are higher than the global strain indicating the structural heterogeneity of the composite material. Finally, microstructural analysis of tension and shear test specimens showed that the main failure modes are de-bonded fibres, fibre pull out, in-plane/inter-laminar shear cracks and delamination.
Introduction
Selection of woven fibre reinforced polymeric (FRP) composite materials and optimisation of the lay-ups, stacking sequences and ply orientation of these materials in the design of internal geometry of load bearing composite structures (e.g. wind and tidal turbine blades) necessitates a better understanding of the their mechanical behaviour, as these materials show complex failure modes when subjected to the tensile and shear stresses generated in service. This is not only due to the inhomogeneous nature of these materials involving localised strains upon the deformation but also due to the fibre-matrix interfacial properties and their elastic-plastic interaction 1–3 which causes FRP materials to experience multiple failure modes and stress redistribution between fibres and matrix upon tensile and/or shear deformation. Employing full field measurement techniques can contribute to map the strain distribution, consequently, stress-strain response can be evaluated, and the strain localisation affected by the stress redistribution between fibres and matrix can be investigated. Among full field measurement methods, digital image correlation (DIC) has been used in many fields of solid mechanics including determination of stress-strain response and elastic constants ,4–9 observation of crack propagation and damage assessment ,10–16 investigation on residual stress ,3,17–22 static and dynamic damage analysis .23–28 However, the correct determination of mesoscopic deformation of heterogeneous composite materials and the influence of material structure heterogeneity on the tensile and shear strains have not been carefully investigated by this technique.
The micro-mechanical behaviour of composites and their failure mechanisms strongly depend on the elastic-plastic interaction between constituents (fibres and matrix), fibre-matrix interfacial properties and the fibre orientation with respect to main loading direction .2,3,29,30 This is mainly due to the inhomogeneous pattern of strain upon the deformation. In other words, once a FRP laminate is subjected to mechanical deformation, strain localisation in the heterogonous plastic flow pattern can be observed causing failure of fibres, the matrix and affecting interfacial de-bonding, finally leading to total failure of the composite. From this point of view, experimental studies have been conducted to identify the strain localisation mechanism inside composites. It has been found that, matrix type and the fibre-matrix interfacial strength have a substantial effect on micro-mechanical causes of such a complex failure process .31–35
Cross-ply composite laminates whose reinforcements are mainly two-directional are prone to delamination. This is due to the lack of reinforcement in through thickness direction which results in relatively low shear strength and stiffness. In addition, localised strains in the polymer matrix which is constrained by neighbouring fibres increase the likelihood of composite failure. Instead of the conventional method of instrumenting specimens with two-element strain gauge rosettes, DIC makes it possible to reach very high strain resolution levels and to avoid the problem of position dependence related to the heterogeneous nature of the strain and strain localisation phenomena. Thus, the use of DIC to measure the strain fields and to investigate the inhomogeneous nature of woven fabric has been increasingly studied .36–38
In terms of defining shear strength in the Iosipecsu shear test method, it is still questionable as to which load magnitude should be used. Although, the ASTM standard test method for shear properties of composite materials by the V-Notched beam defines the ultimate shear strength considering the lower of ultimate force or force at 5% engineering shear strain, some investigators have considered the stress value corresponding to the ultimate load as the shear strength. For example, the first load drop in stress-strain curves was used to define the shear strength by Bhatanagar et al. , 39 but Kashaba et al. has defined the shear strength as the ratio of the load just prior to the non-linear behaviour, to the cross-sectional area between the two notches . 40 In the present paper, using a method based on DIC strain fields to detect the onset of in-plane/inter-laminar cracks and delamination which were simultaneously observed by microscopic techniques, the uncertainty about which stress and/or strain should be used as the measure of the material property is addressed by defining the most appropriate failure criteria in accordance with these failure modes.
Although using unidirectional composite results in better structural performance for the most load bearing composite structures, in offshore renewable energy composite applications such as wind and tidal turbine blades due to the multi-directional loading, optimised composite lay-ups with different stacking sequences of plies (e.g. [45/-45/0/90/90/0/-45/45] in the leading edge panels, [45/-45/0/-45/45] in the spar box structure and [45/-45/-45/45] in the shear webs and trailing edge) are strongly recommended .41–44 As a result, characterisation of FRP composite laminates and in particular the effect of ply orientation on both mechanical properties and failure modes of the composite materials studied by the present work is useful to predict the failure and durability of these structures. The objective of the present work is to carry out uniaxial tension and shear tests on specimens made of epoxy resin reinforced with woven glass fibre mats (with different off-axis angles) to obtain strain measurements and to characterise the failure progression by the means of the DIC system. Finite element (FE) analysis of tension and shear test on GFRP with different off-axis angles, allows the analysis of the effect of fibre orientation on failure modes determined by microstructural analysis. Moreover, full field strain maps were obtained to show the areas on the specimen surface where delamination/damage occurs. The strain maps obtained showed the inhomogeneity of strain distribution and its dependence on the fibre orientation. Using the strain field analysis feature of DIC, localised strain in the polymer matrix responsible for failure can be mapped and monitored and, as a result, complex microscopic mechanical aspect associated with the strain distribution in these materials can be investigated. A better understanding of microscopic mechanical performance of woven fabric composites under deformation can make the use of these materials more reliable and increase the design safety of engineering parts which are manufactured from them.
Methodology
Material characterisation
The material studied is a cross-ply woven composite with an epoxy resin matrix reinforced with E-glass fibres manufactured using vacuum assisted resin infusion process. In this method, biaxial plain woven glass fibre mat (0°–300 gr/m2, 90°–300 gr/m2) was cut to give ±45° and 0°/90° material and then stacked to create symmetric laminate. The reinforcement layers were placed in a sealed and closed vacuum mould (i.e. between a mould and vacuum bag) and then resin is drawn into the mould under vacuum, displacing the air through openings in the bag. This continues until the mould is occupied completely by resin. After a room temperature cure for 48 h, the laminates were oven cured at 80°C for 3–5 h. Volume fractions of approximately 40% were achieved at an average thickness of 5 mm. The laminates were cut into tensile and shear test coupons using a water-cooled diamond abrasive disc.
Microstructural analysis techniques based on SEM and X-ray 3D micro-computed tomography (μ-CT) were also used to reveal the geometry and orientation of fibre bundles (Figure 1). Structurally the reinforcement material consists of longitudinal and transverse bundle of fibres in a form of plain woven fabric, that is orthogonally oriented. The sinusoidal shape of the longitudinal cut bundles and the ellipsoidal cross-sections of the perpendicular cut bundles are clearly distinguishable in Figure 1. Table 1 lists the fabric specifications obtained by X-ray CT scan and SEM analysis. Trapped air in the composites that is not removed during manufacturing can lead to the creation of voids in the cured composite. Based on ASTM D2734 ,
45
the void content of woven GFRP composite studied in this work is calculated around 1.3%. An example of scanning electron micrograph (SEM) of the entrapped air bubbles and the voids distributed throughout the GFRP composite samples is provided in Supplementary information. Micrograph of woven GFRP laminate. (a) The SEM reveals the cross section of microstructure with biaxial fibre orientation. (b) 3D reconstructed volumetric model obtained by μ-CT. Fabric and yarn specifications obtained by X-ray CT scan and SEM.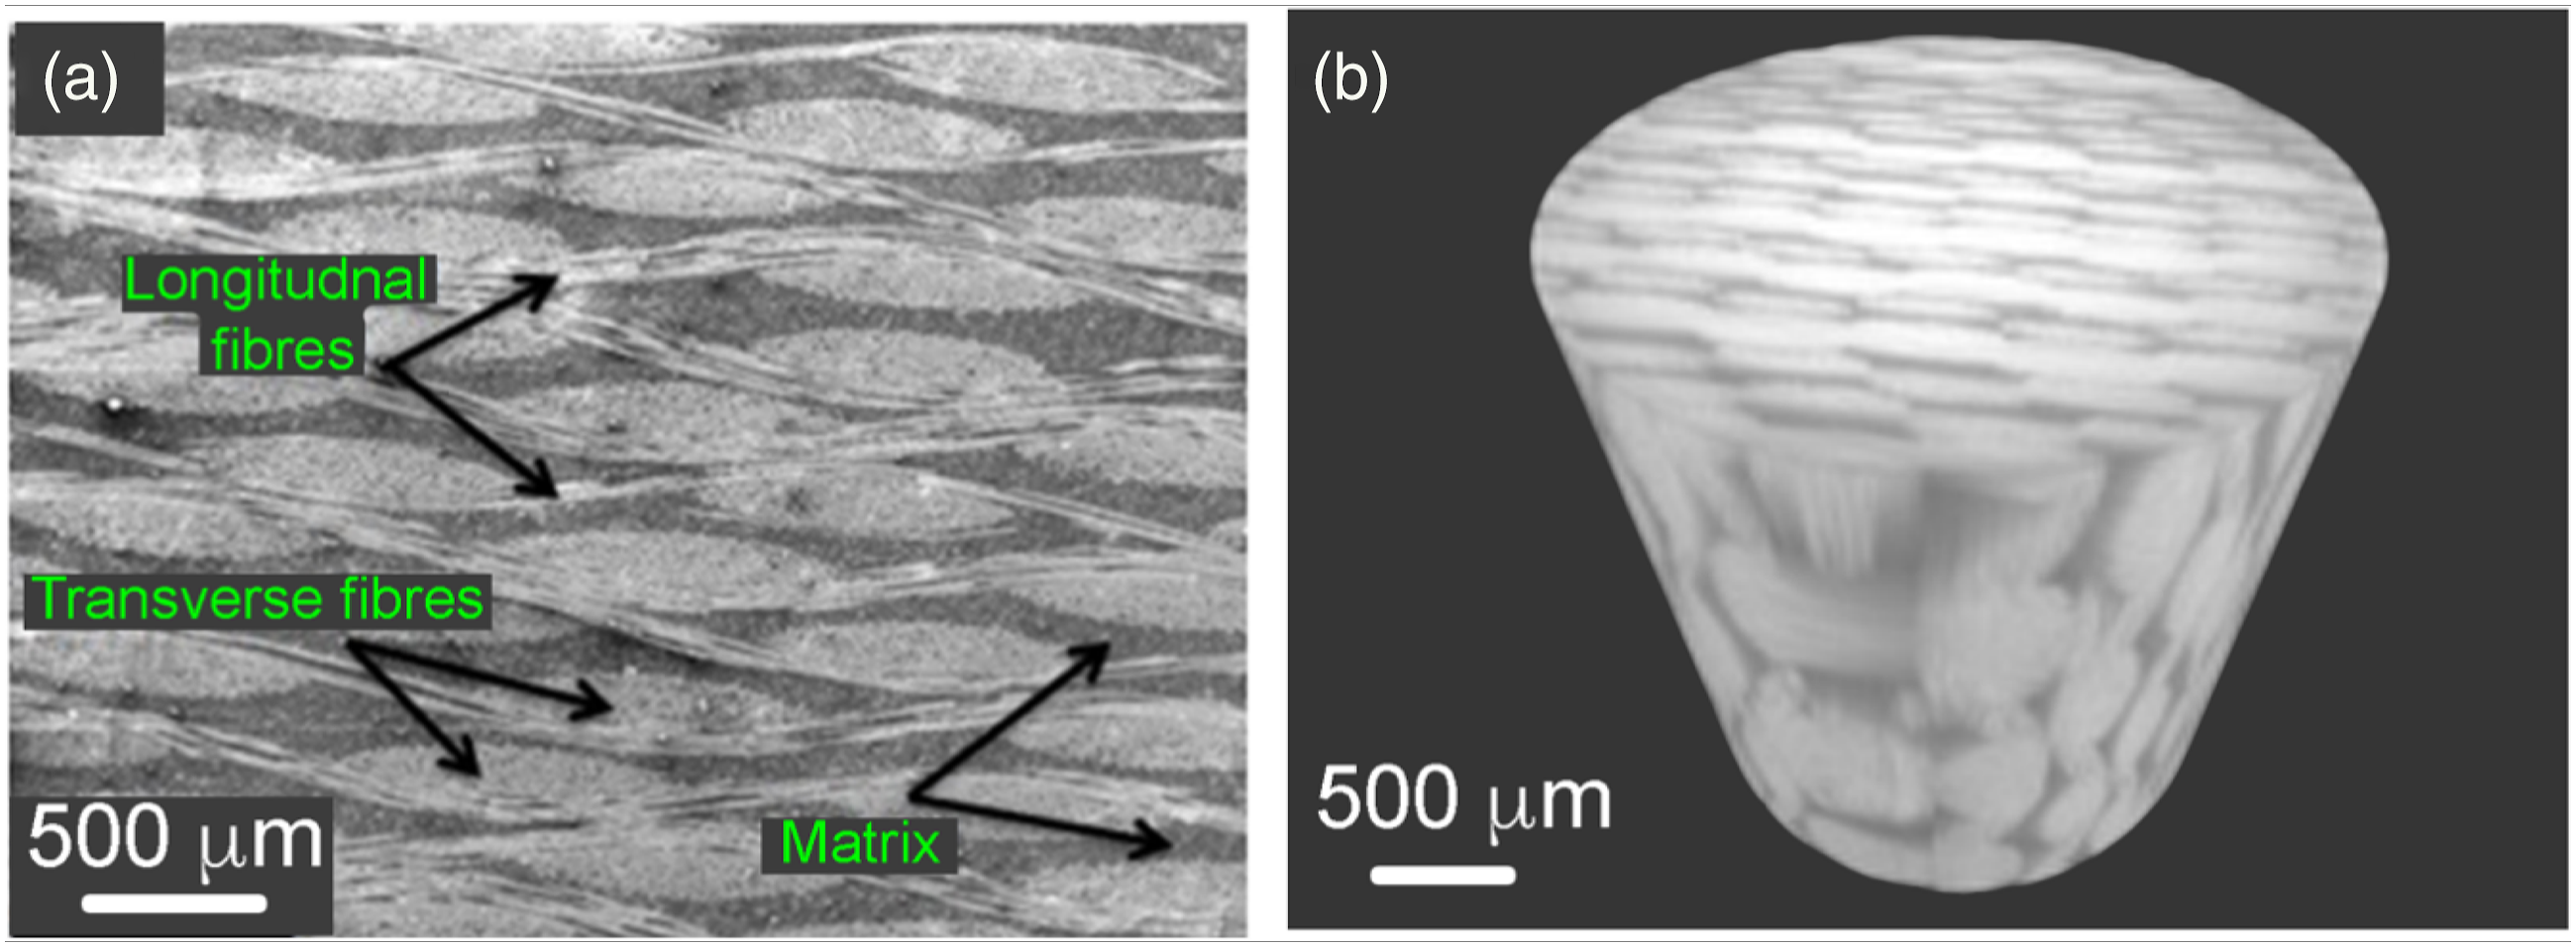
X-Ray micro-computed tomography
X-Ray micro-computed (μ-CT) measurements were carried out using an X Radia/Zeiss Versa XRM 410. The system consists of a micro-focus X-ray source operating at 150 kV, within a maximum power of 10 W. The highest achievable resolution is 0.9 μm. A spot size of <5 μm is obtained at 4 W. A precision object manipulator with two translations and one rotation facilitates rotating the sample for the acquisition of tomographic data, raising/lowering the sample to select a region of interest and translation along the optical axis to adjust the magnification. The X-ray detector consists of an X-ray scintillator screen which is fibre optically coupled (at an image ratio of 3.7:1) to a high resolution (1024/1024 pixel) cooled 2 k × 2 k 16bit CCD X-ray camera.
Quasi-static tensile and shear test
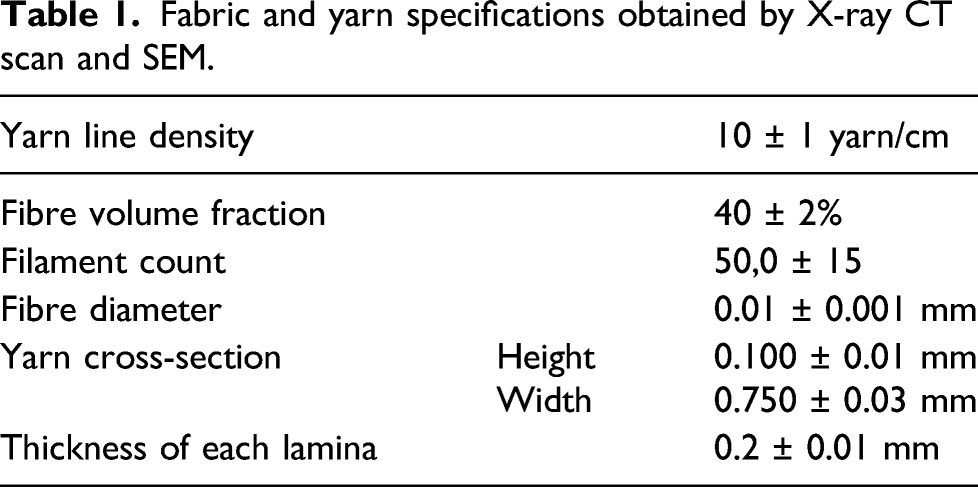
Tensile and Iosipescu shear test specimens with (0°, 90°) and ±45° ply orientation were machined from woven fabric composite plates and then mechanical tests were conducted in accordance with the relevant ASTM standards 46,47 using a Tinius Olsen Universal testing machine (fitted with a 25 kN load cell with ±0.5% accuracy) in conjunction with a video gauge (DIC measurement set up) as shown in Figure 2(a). For Iosipescu shear testing, a minimum of two orthogonal virtual strain gauge elements provided by the DIC software (VIC-2D) is required, canted about the loading axis in the notch roots of the specimen, as shown in Figure 2(b), and mounted at +45° and −45° to the loading axis. For tensile testing, the virtual extensometer provided by DIC software was used in a two-point tracing configuration for longitudinal and transverse measurements to build the stress-strain curves and to measure the Poisson’s ratio. Following the recommendation of the ASTM standards mentioned above, five specimens were tested with a standard head displacement rate of 2 mm/min. In terms of failure location most specimens failed within the gauge length; however, occasionally, some samples failed outside the gauge length. In these cases, new test specimens were produced, and mechanical tests were repeated until a successful result was produced. Experimental set up for mechanical testing and virtual strain gauges. (a) Tensile testing set up equipped with DIC. (b) Virtual extensometer provided by DIC software to measure the strain on shear test samples. (c) Virtual extensometer provided by DIC software to measure the strain on tensile test samples.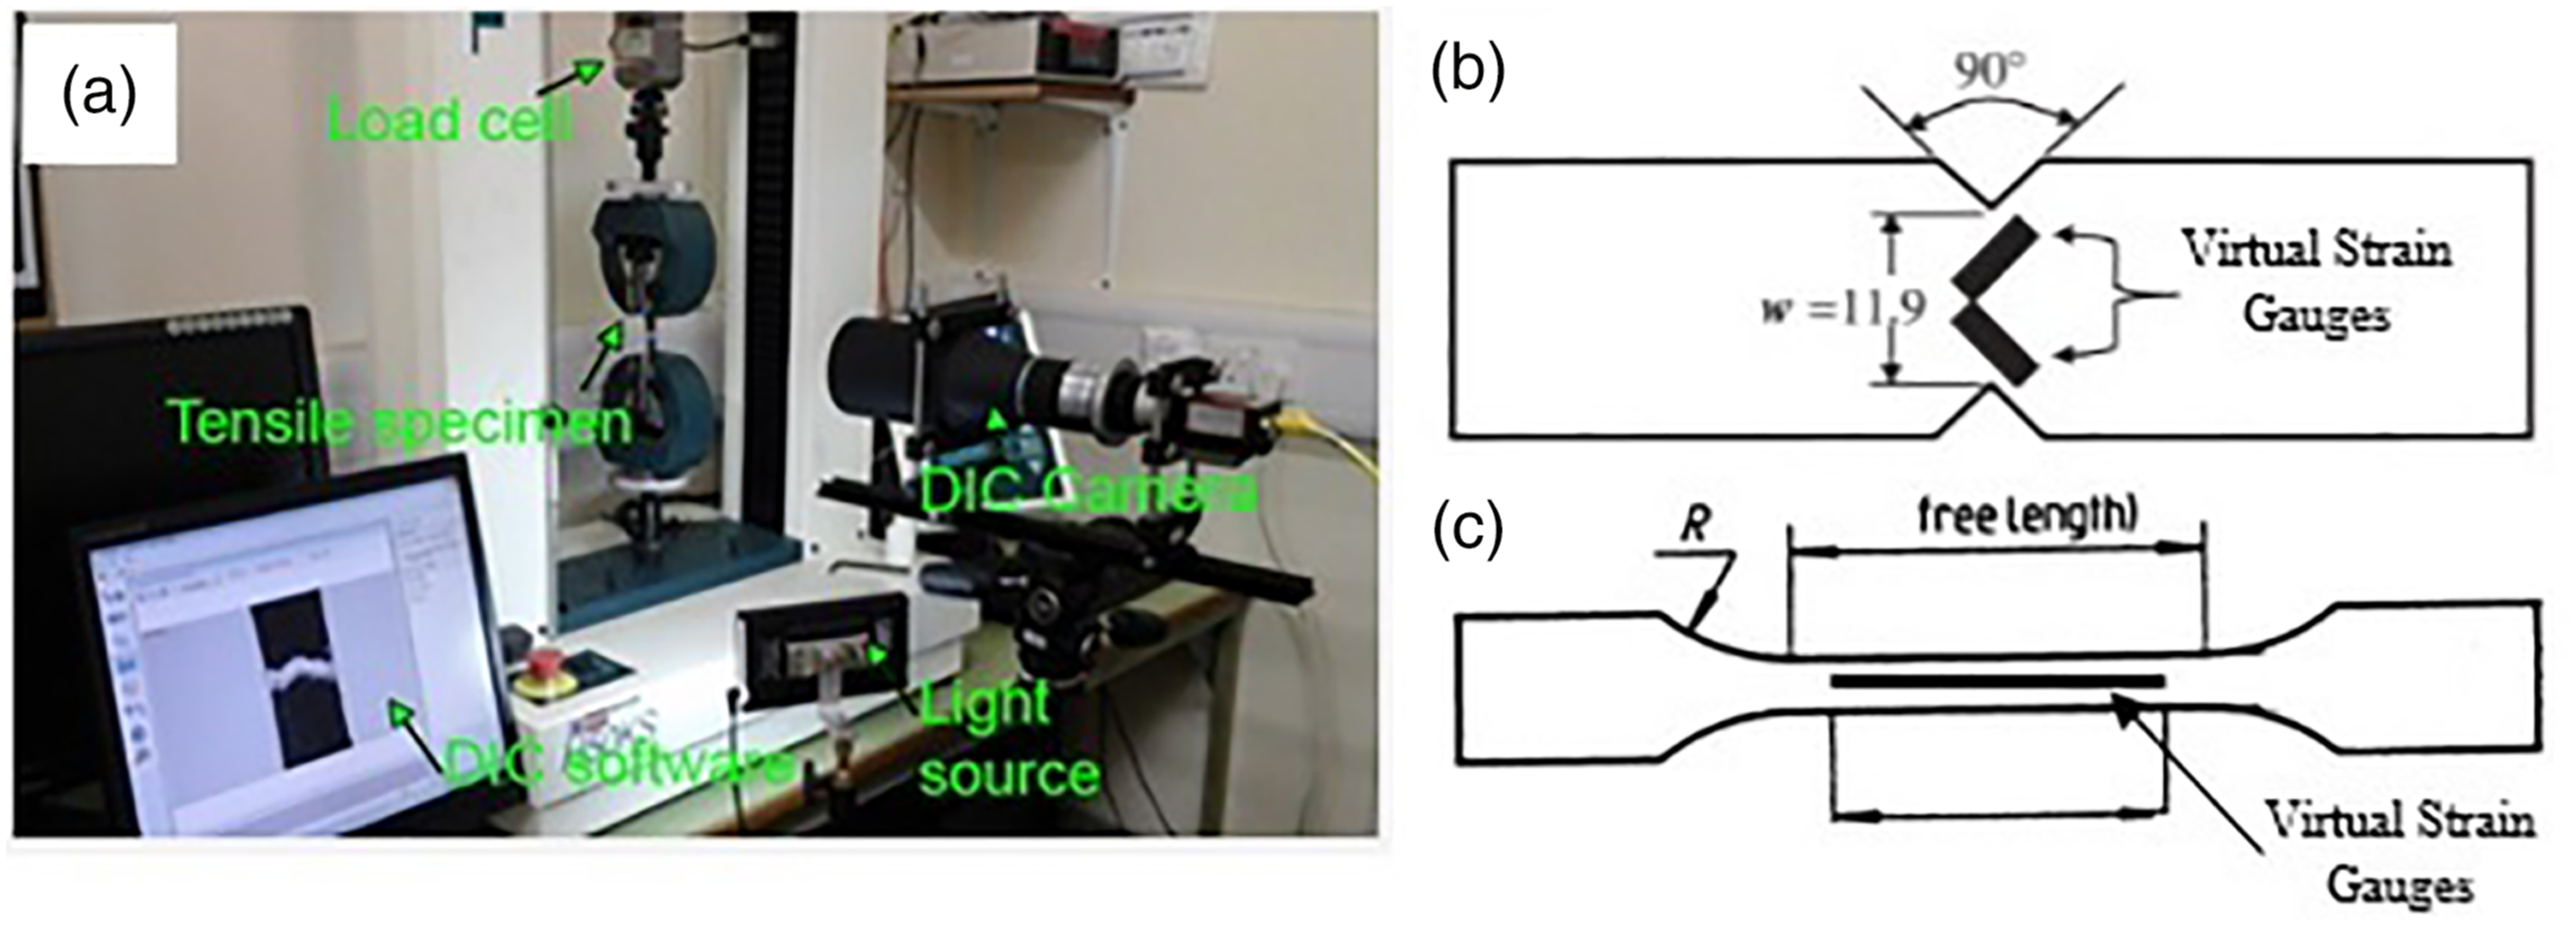
In order to map the strain fields and build the stress-strain curves, DIC measurement set up using an optical imaging apparatus (Figure 2) was used. The camera is positioned with its optical axis perpendicular to the surface of specimen, imaging the planar specimen surface while the specimen is subject to the loading. The camera (IM-CAM-037, IMETRUM, UK) features a spatial resolution of 0.0055 mm/pixel with the speed of 50fps and was equipped with lenses of 0.193 magnifications with the working distance of 309 mm. During the test, the aperture was adjusted to its minimum value to achieve a maximum depth of focus. Digital grey scale images of the surface contrast were taken every second during straining. Displacements detected by comparing these images and searching a matched point from one image to another, were then numerically differentiated using mathematical algorithms in the VIC-2D software 48 to give the full field strain maps. A customised vibration free stage was used to carry out the experiments. By correlating two un-deformed images, a calibration of the DIC procedure was executed 49,50 in order to estimate the experimental error. The estimated residual error was 0.035%, which is below the acceptance level of 0.04% .49,50 Therefore, final data presented in this study is not smoothed or filtered.
Data analysis using DIC
As mentioned earlier, the series of digital images were processed using the VIC-2D software. The region of interest for tensile and shear test specimens was defined on each initial image of the samples (Figure 3). In order to avoid edge effects (e.g. micro-cracks) caused during the machining of the test coupons, 0.25 mm space was masked at the edges of test specimens in the software and no data was obtained from these regions. The facet size was set to a value of 15 pixels equivalent to 142 μm and the step size was set to a value of 7 pixels which is equivalent to a spatial resolution of 66.5 μm. Selection of efficient parameters (i.e. steps size and the size of subset) during the digital image correlation analysis of heterogeneous laminated fibre glass composite materials has a significant impact on the measurement of strain fields and displacements .
51
In order to obtain full field strain maps for each specimen, the gradient tensor of displacement/strain were calculated at each deformation stage. The final strain map for tensile test specimen which was derived as an approximation of the strain tensor was then presented in terms of the components of normal strains (i.e. longitudinal and in-plane transverse) and in-plane shear strains. The images of spray coated (a) shear and (b) tensile test specimen showing stochastic speckle pattern and the region of interest for the strain analysis, schematic drawing illustrating the fundamentals of DIC system indicating (c) reference image (before deformation) and (d) distorted image (after deformation).
Sample preparation for surface strain mapping
Speckle patterns were applied by alternately spraying white and black acrylic paint onto the test specimen surface prior to mechanical testing. Care was taken to ensure that these paints were applied uniformly across one surface of each sample. The optimal quantity and dimensions of spray droplets, shadowing effects and how these affect the brightness of sample surface are important influences to be considered before starting video imaging of the surface of the test specimens. For example, if the speckle patterns (stochastic spot pattern) is bigger in size, it is required to make the facet size and the step size bigger as well and therefore the spatial resolution is reduced. Also shadowing effects can change the grey intensity levels in a facet, and thus the DIC system will not be able to identify the same facet leading to the loss of information.
Finite element modelling
The FE model characterises the design of tensile and shear test specimens using orthotropic properties of woven GFRP material and it incorporates the boundary conditions with the internal lay-up of composite determined from the microstructural analysis. In the first stage of FE modelling of the tensile and the shear test, a design modelling tool is used to create a shell model of the test specimen. The model integrates the geometry of test specimen used in experiment in accordance with the ASTM standards .46,47 The Surface function is used to generate a thin surface, then it is transferred into the ANSYS Composite Processor (ACP) of FE program where engineering constants of the laminae, ply orientation/thicknesses and stacking sequences of the laminae are all defined. Figure 4 shows the FE mesh and the boundary conditions imposed on the FE model of tensile and shear test coupons. All the specimens in this study are modelled using a linear shell element (shell 181) .
52
It is a four-node element with six degrees of freedom at each nodes (three translations in the x, y and z directions, and three rotations about the x, y and z axes). A mesh sensitivity study was also conducted and the convergence criteria (i.e. stabilisation of stress) is met at the mesh density used on the FE model of the mechanical test specimens. Convergence is gained with the use of approximately 1000 elements. By using the shell element type, a state of plane stress is adopted, therefore, the equations used in the stress analysis of the FE model of the tensile and shear samples are applied to the plane stress condition and the constitutive equation which relates the stress to strain is defined by classical laminate plate theory as detailed in
53
(see Supplementary information). FE mesh of (a) tensile and (b) shear test specimens and optimisation of boundary condition.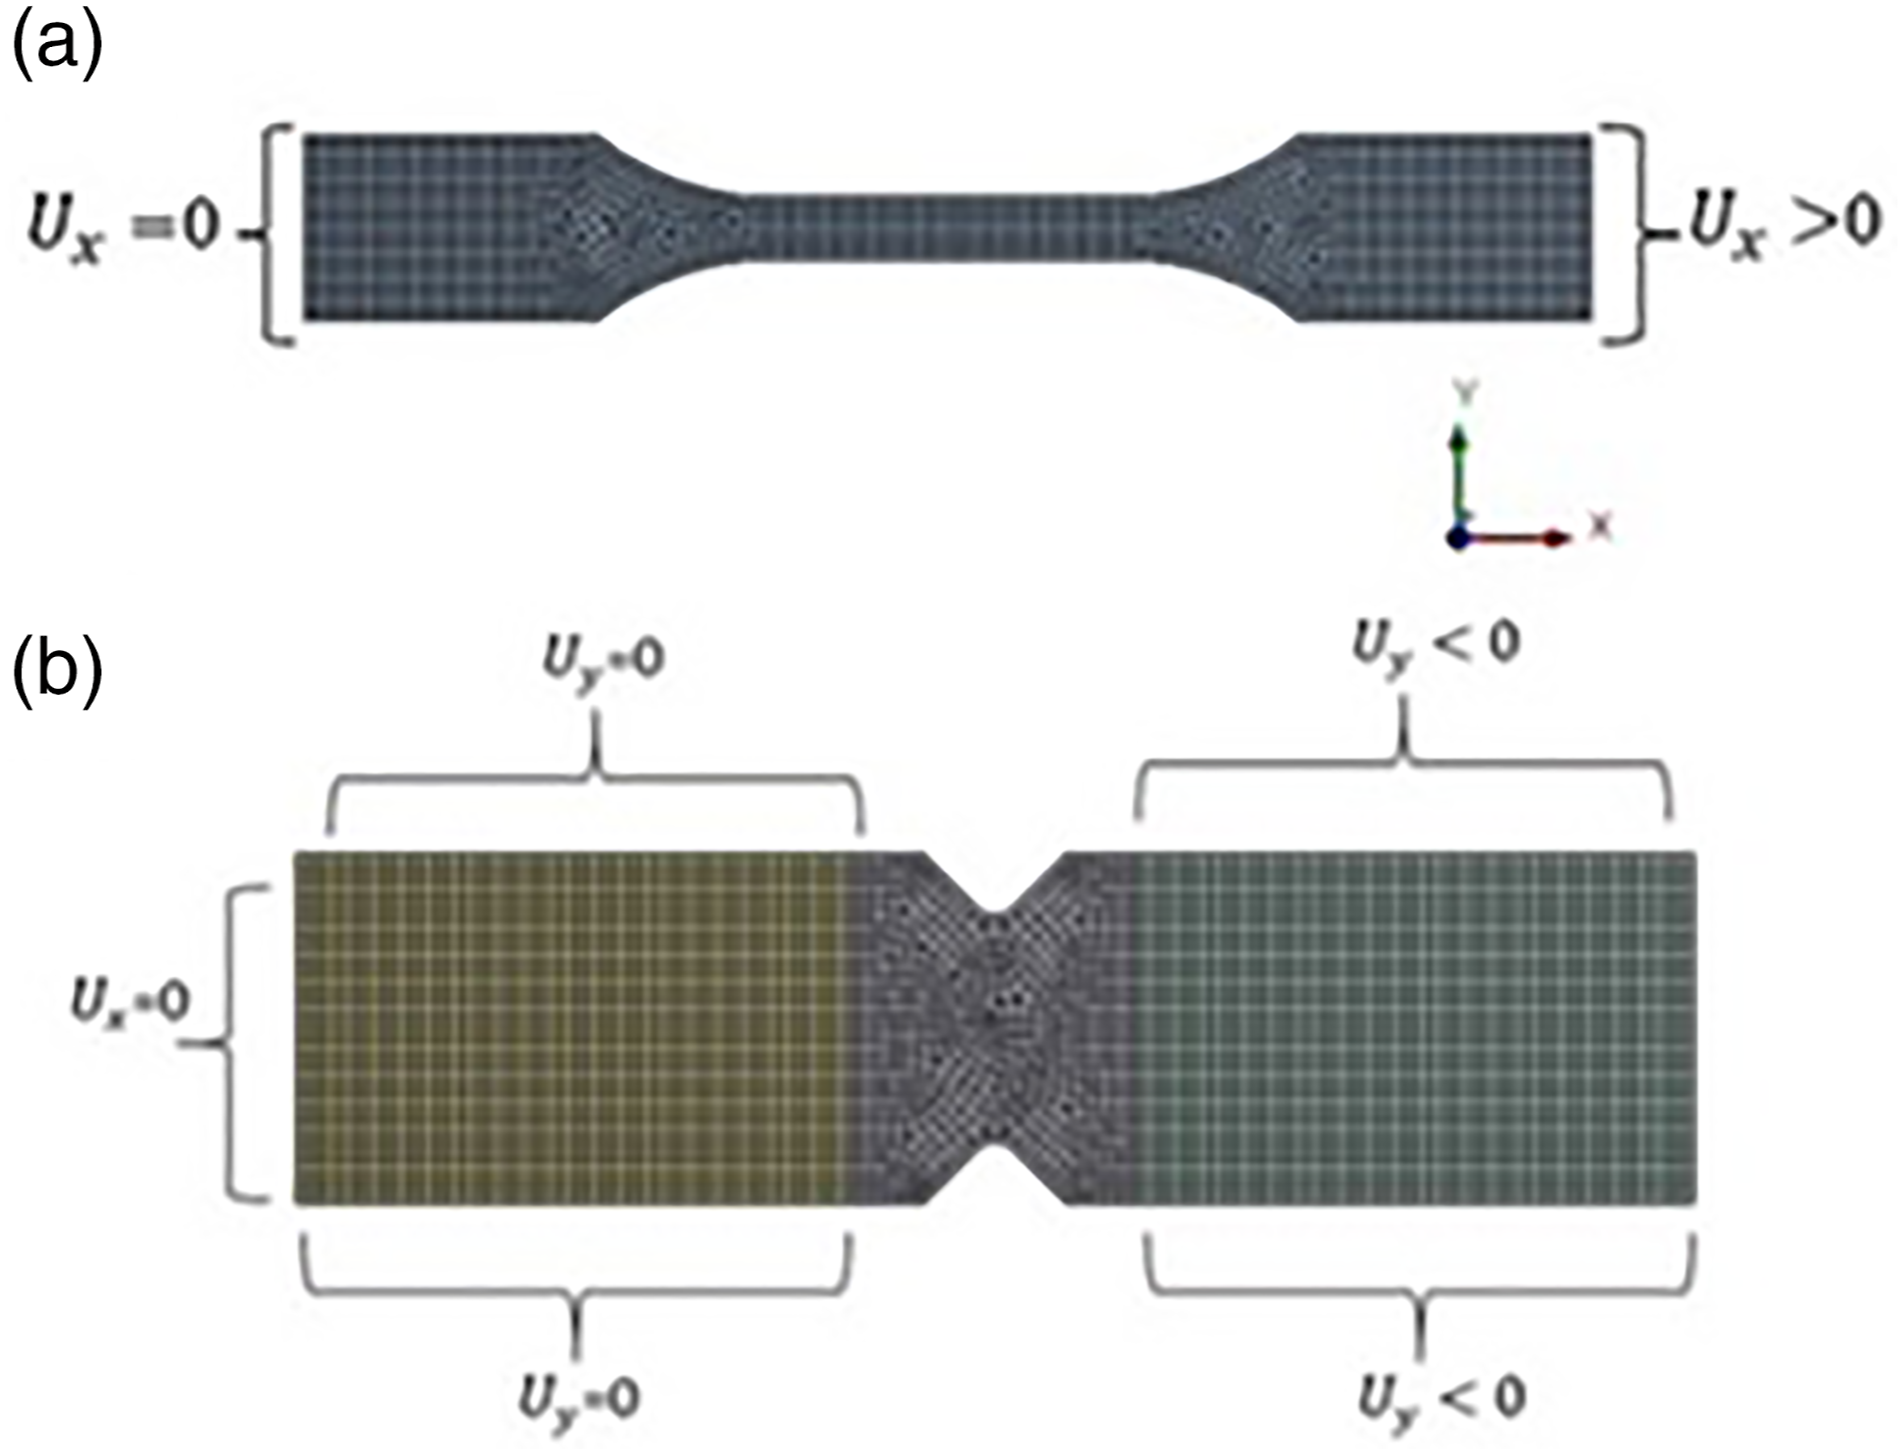
Representative volume element of the woven fabric composite
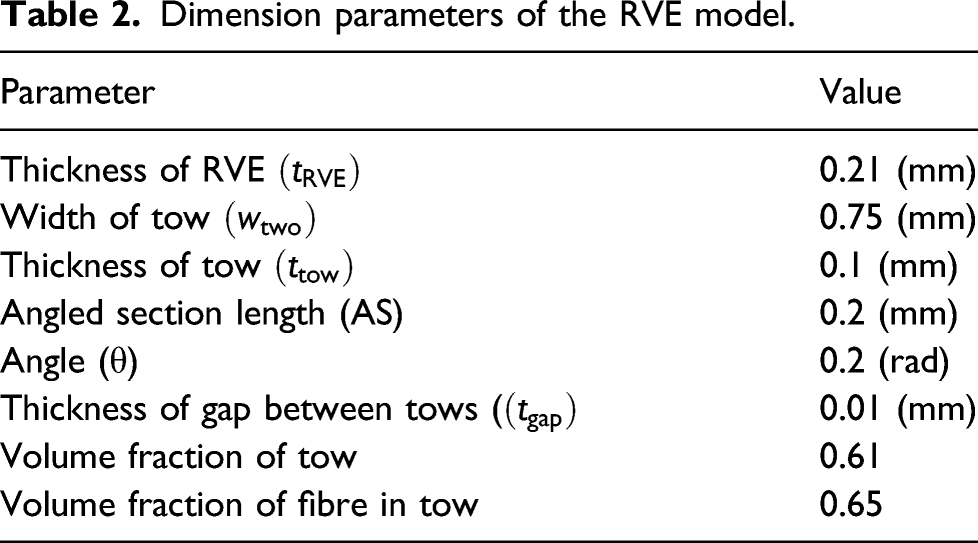
Due to the periodical nature of the woven architecture, a 0°/90° unit cell model is extracted from the plain woven fabric composite, to numerically evaluate its mechanical response. The meso-scale unit cell model contains three parts: the matrix pocket, the warp tows and the weft tows. The plain woven fabrics are assumed to be balanced, that is the warp and weft tows have the same waviness ratio and tow volume fraction. In this work, the tow model has an elliptical cross section which has a fixed shape along the undulation path, with the geometry details determined from a SEM examination of the woven fabric. The cross-section view of woven fabric structure and geometry characterisations are shown in Figure 5. There are two segments in the undulation path, that is an angled section
Woven fabric structure: (a) the micrograph reveals the cross section of microstructure with biaxial fibre orientation (transverse fibres, longitudinal fibres and bulk matrix). (b) The micrograph of the top surface of the specimen showing the orientation of tows at longitudinal and transverse directions and (c) unit cell model of RVE, (d) geometry descriptions. Dimension parameters of the RVE model.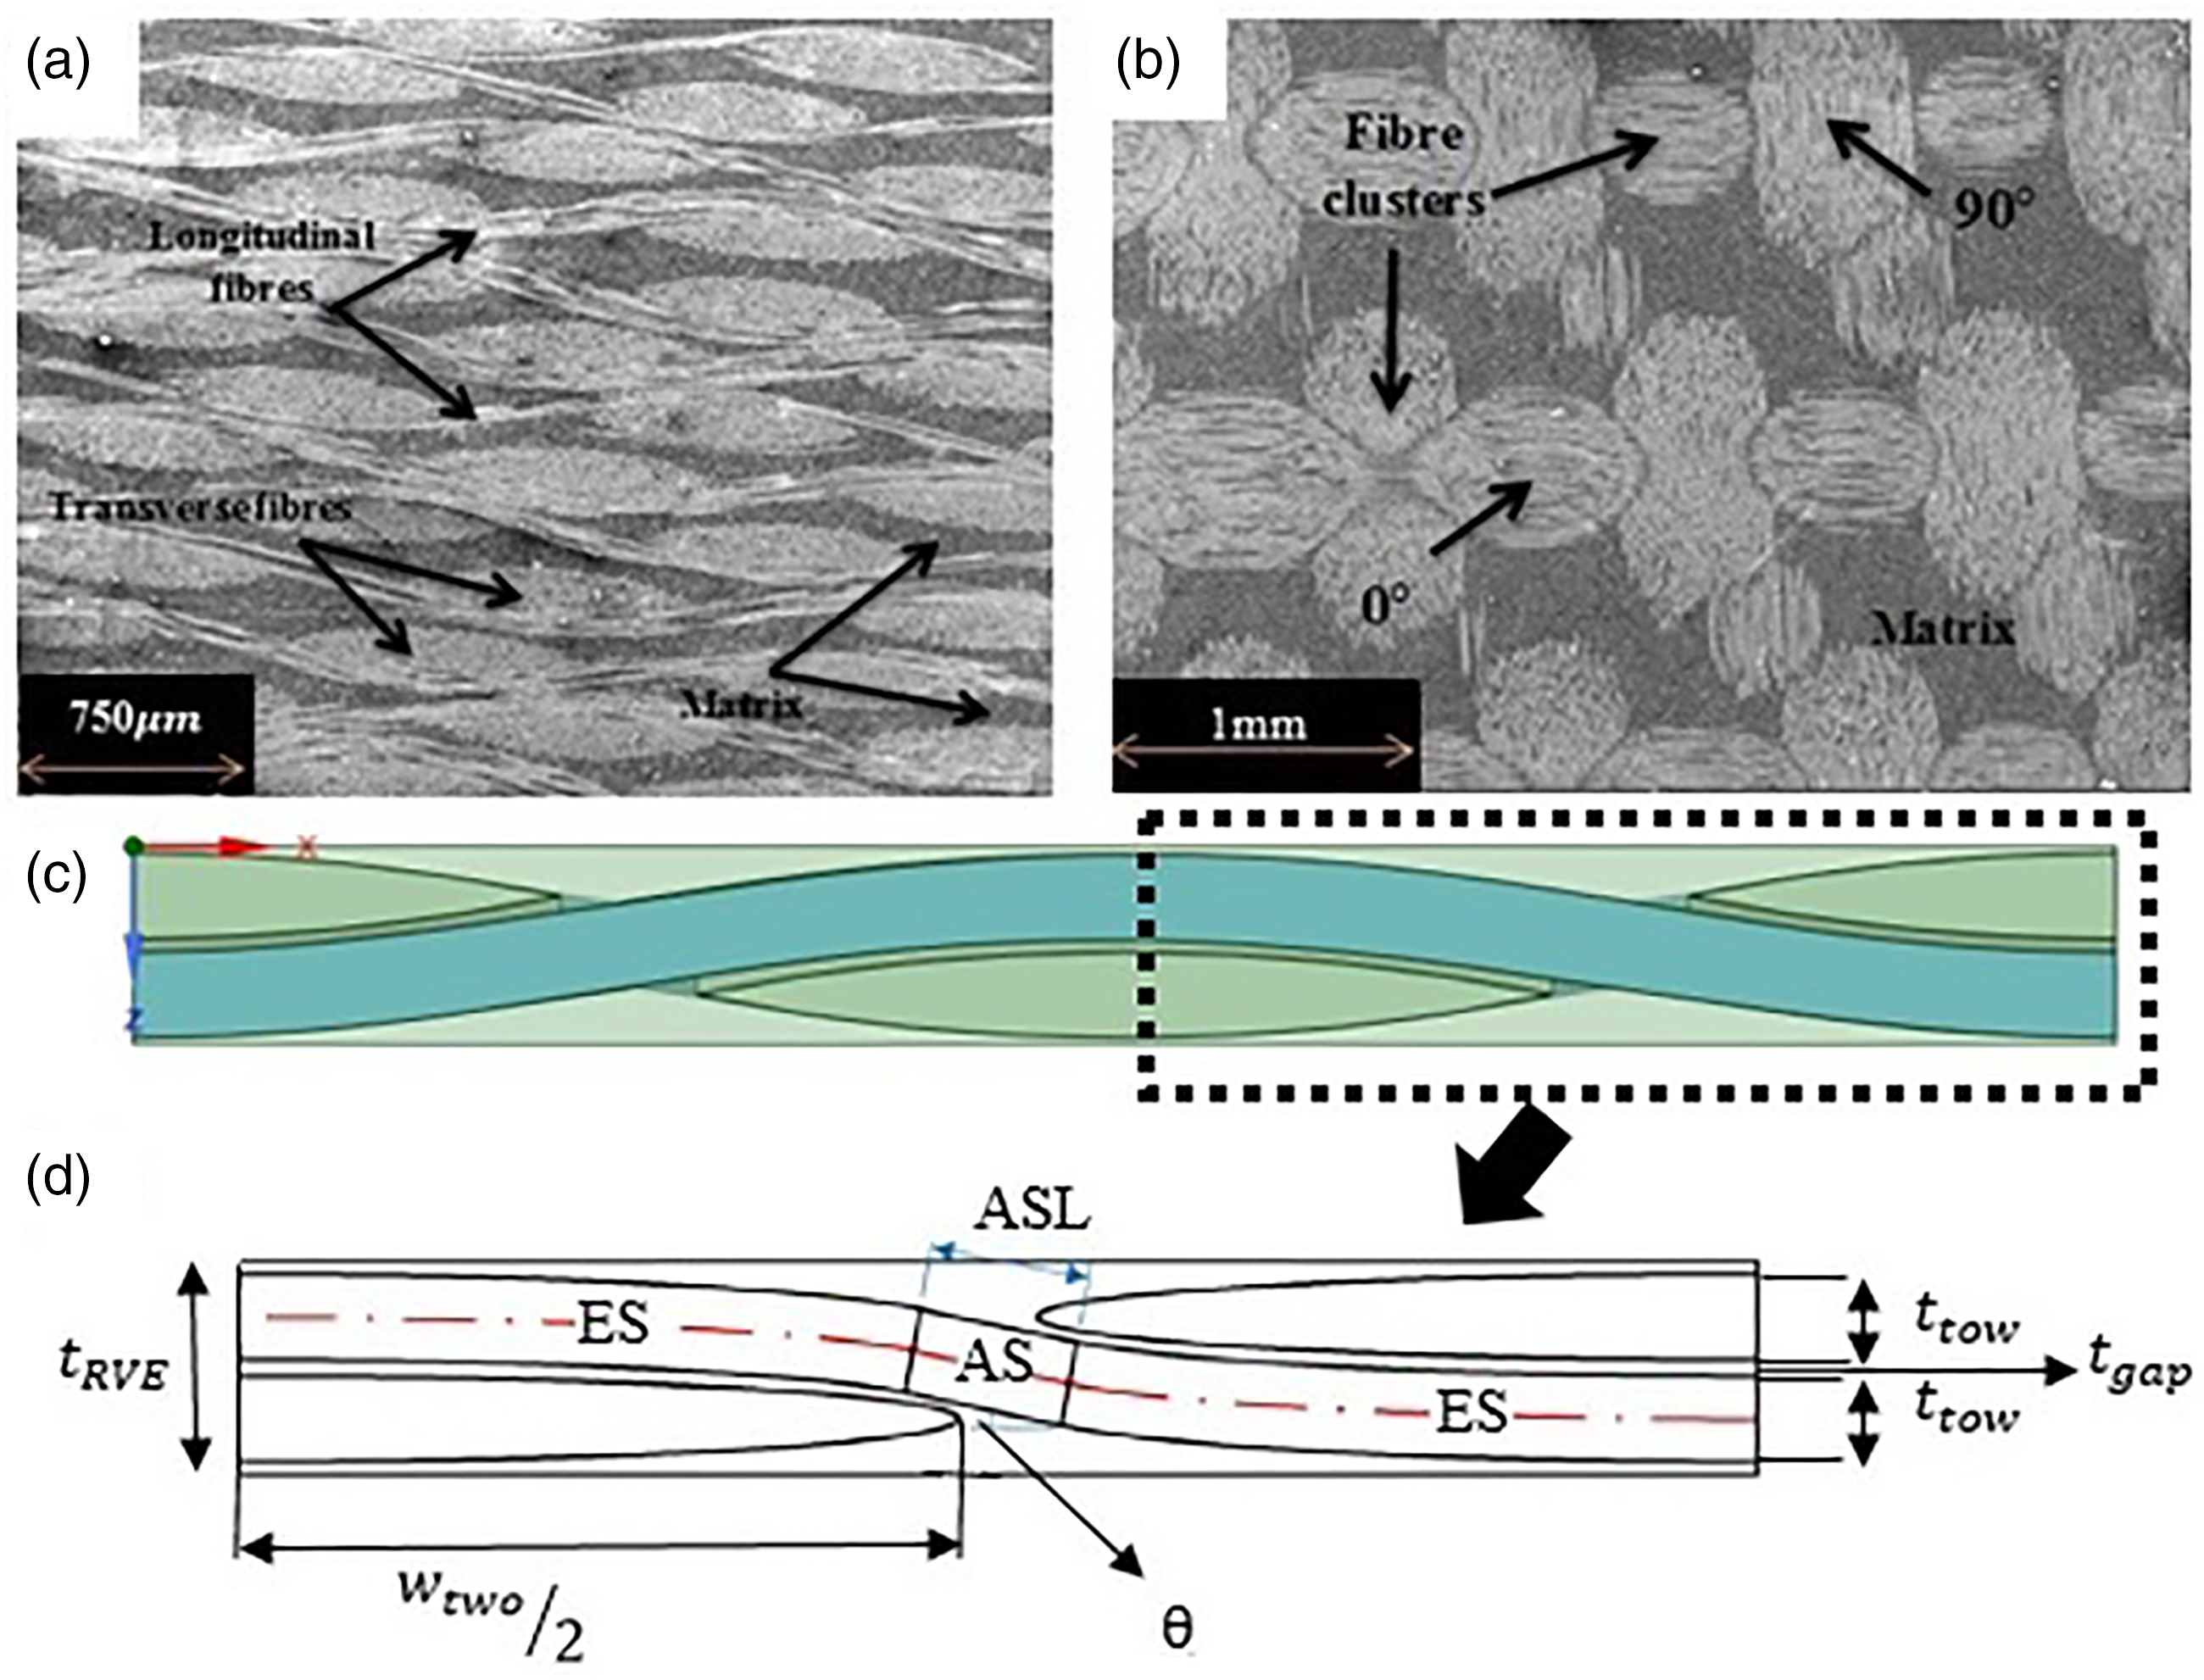
Multi-scale finite element modelling
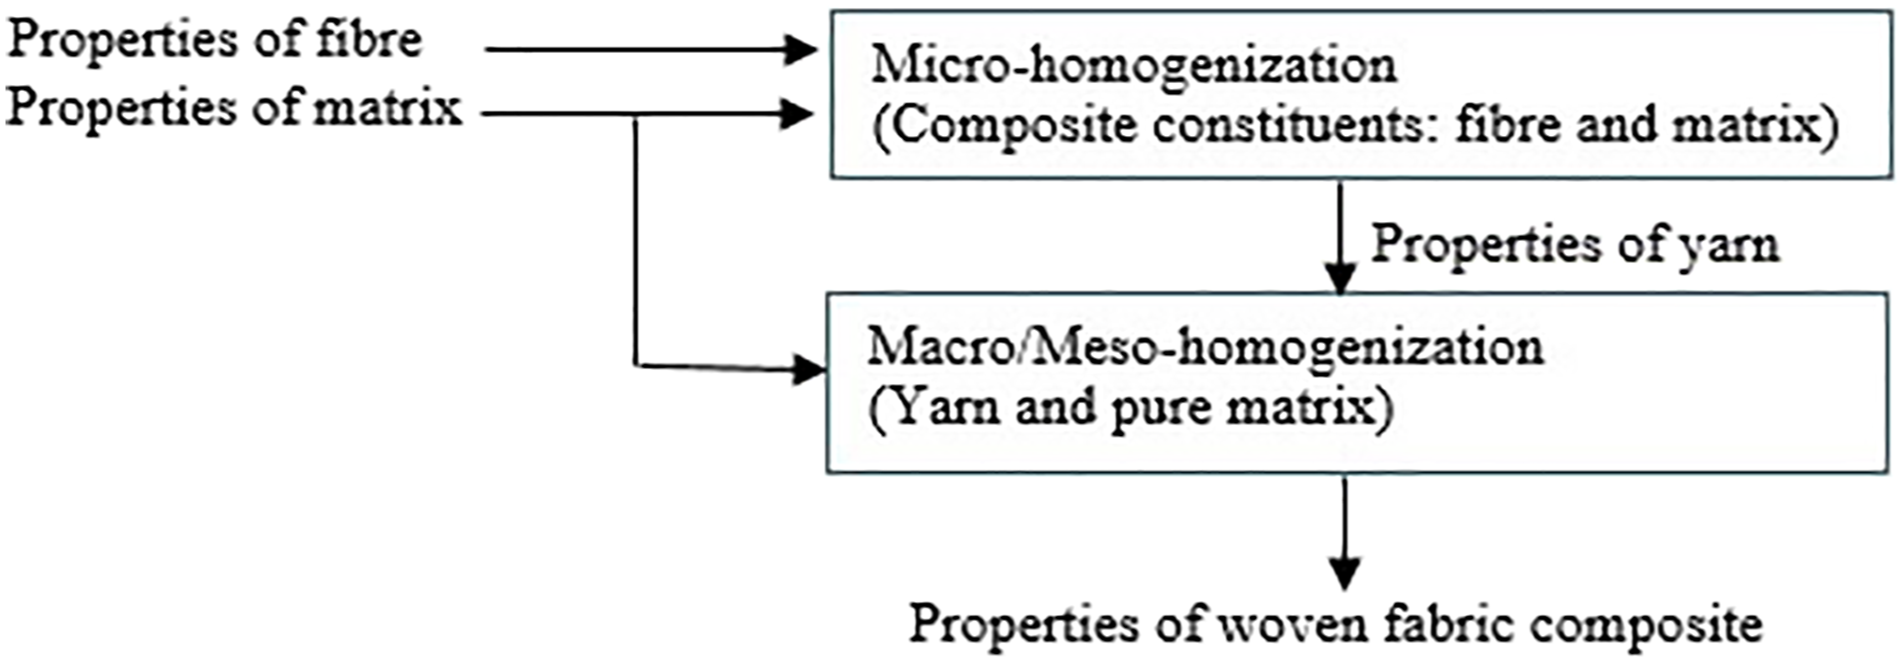
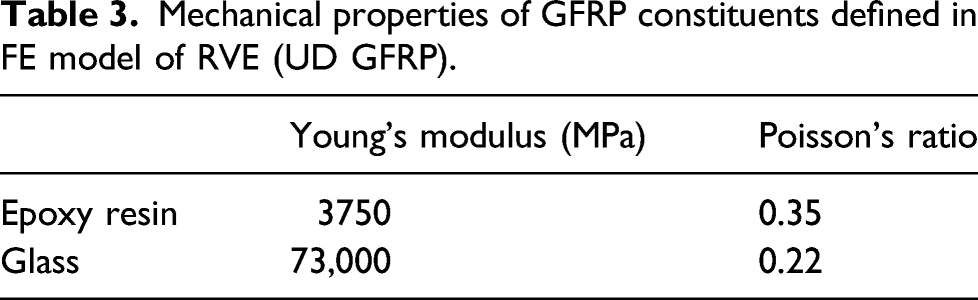
Figure 6 shows a flow chart for the multi-scale FE modelling approach which is numerically applied to calculate the mechanical behaviour of woven fabric composites via computer-generated testing. The micro length scale is connected to the macro length scale via a meso-scale level unit cell that properly characterises the woven fabric architecture. The mechanical behaviour of the constituents, that is fibre and matrix, and their arrangement in the composite determines the macro material behaviour, thus, the effective orthotropic properties of a sample made of woven fabric composite, can then be assessed by conducting a homogenisation procedure (starting from micro-scale and extending to macro-scale via meso-scale). In order to estimate the elastic properties of woven fabric composites, an FEA based two-step homogenisation, shown in Figure 7 is implemented as a micromechanics plugin in the FE software ANSYS (material designer). The woven fabric composite consists of yarn/tow regions as well as pure matrix regions with a repeated weave-pattern. The yarn/tow region is broken into fibre and matrix constituents at the micro-scale. Thus, the stiffness properties of yarn/tow can be estimated from the material properties of fibre and matrix using an appropriate unit cell model of type square, diamond or hexagonal. The homogenisation of the stiffness properties of yarn and the stiffness properties of pure matrix as well as the inclusion of woven fabric weave architecture then results in the effective properties of the woven fabric composite. Thus, initially FE analysis of the RVE using the homogenisation method was conducted. This is done by defining periodic boundary condition (PBC) on the RVE of unidirectional GFRP as shown in Figure 6(a). The mechanical properties of the E-glass fibre and epoxy resin used in the FE model of UD GFRP are listed in Table 3. The micro-model of UD GFRP defined in Figure 6(a) is then loaded in accordance with the boundary conditions representing uniaxial strain and shear states of the RVE positioned in the origin of the coordinate system detailed in .
54
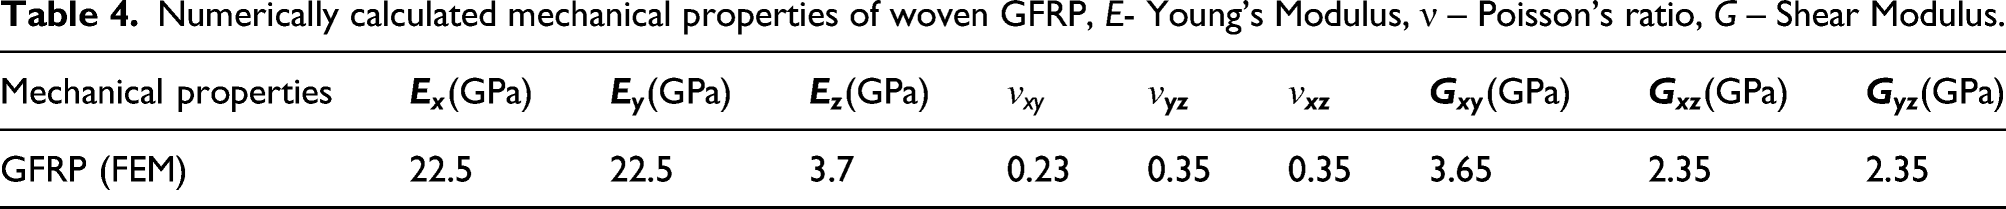
This generates the effective orthotropic engineering constants of UD GFRP which are then used as the yarn properties in the RVE of woven composites in Figure 6(b) where the input data to create the FE model of the RVE is listed in Table 1 and Table 2. The micro-model of woven GFRP defined in Figure 6(b) is again loaded in accordance with the above boundary conditions, resulting in orthotropic engineering constants in Table 4. It should be noted that in this work, a four-node tetrahedral element in ANSYS was used to mesh the micro-models of the RVE, with the total number of elements and nodes equal to 168,930 and 32,363, respectively. A mesh sensitivity study was also conducted and the convergence criterion (i.e. stabilisation of the macroscopic stress-strain response) is met at the mesh density used. Schematic of multi-scale FE analysis executed to characterise the woven fabric composites. (a) RVE of UD GFRP, (b) RVE of woven GFRP and (c) macro-scale model of tensile and shear test specimen. Two-step homogenisation applied in ANSYS CAE to characterise the woven fabric composites. Mechanical properties of GFRP constituents defined in FE model of RVE (UD GFRP). Numerically calculated mechanical properties of woven GFRP, E- Young’s Modulus, ν – Poisson’s ratio, G – Shear Modulus.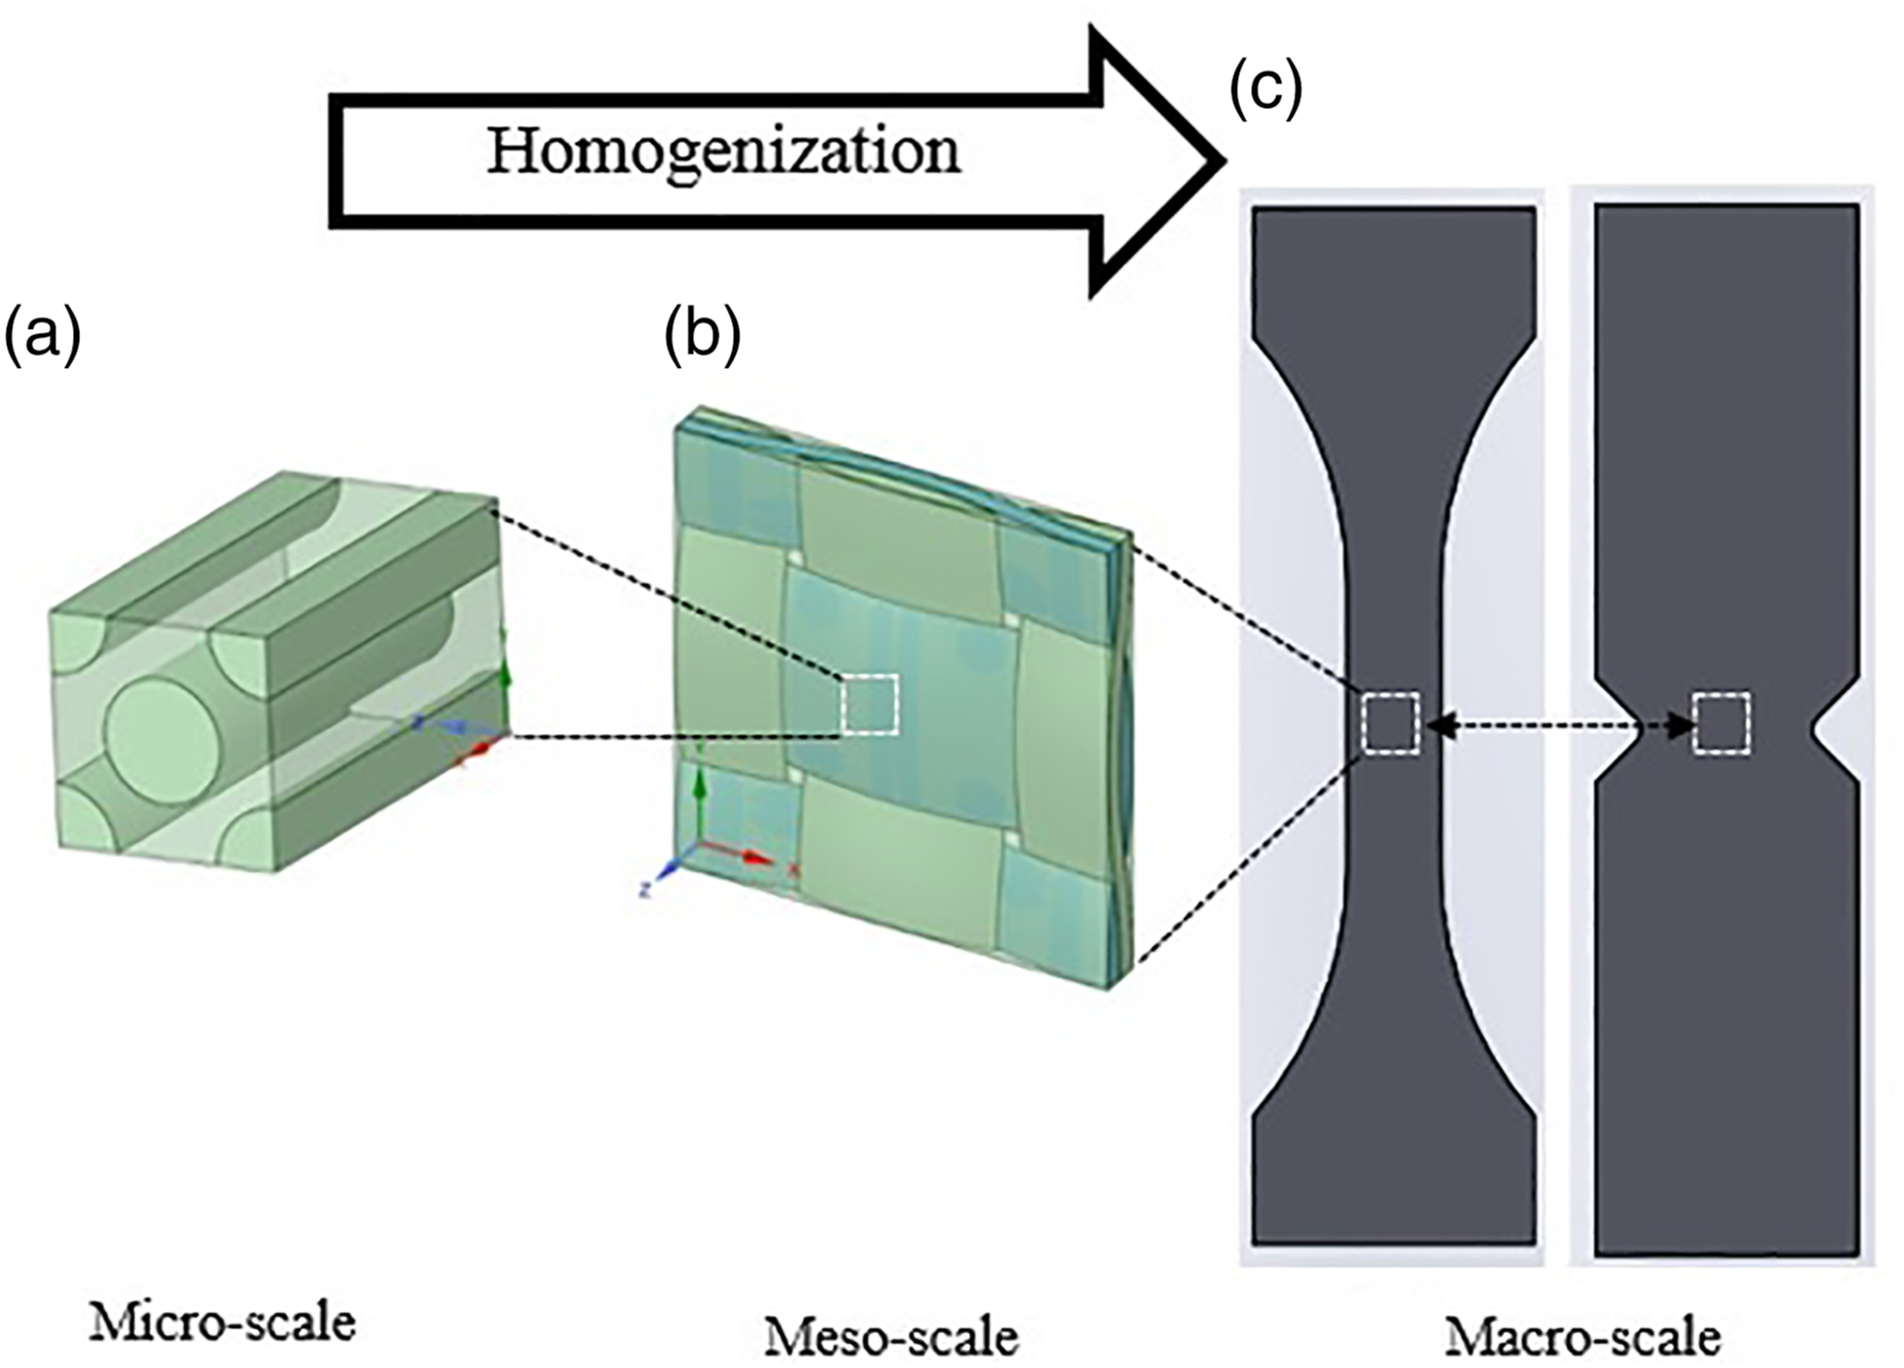
Generating periodic boundary condition
In the numerical homogenisation method, uniform strains are applied to the RVE model to compute the effective elastic properties. By applying these strains in independent sets, specific elastic properties are calculated for each set. The RVE is part of a periodic material, therefore, before and after imposing the strains, the periodicity of the RVE with the surrounding material needs to be simulated in the FE software. This is achieved by imposing node to node periodic boundary conditions on the deformed boundary surfaces of the RVE. In the FE software, this is done either by coupling the degrees of freedom (DoF) of the corresponding nodes in the corresponding directions or by using a constraint equation to define the specific relationship between the corresponding nodes in the boundary. Full details of equations and the method of calculating the elastic constants are provided in . 54
Results and discussion
Tensile test
Effect of fibre orientation on tensile properties
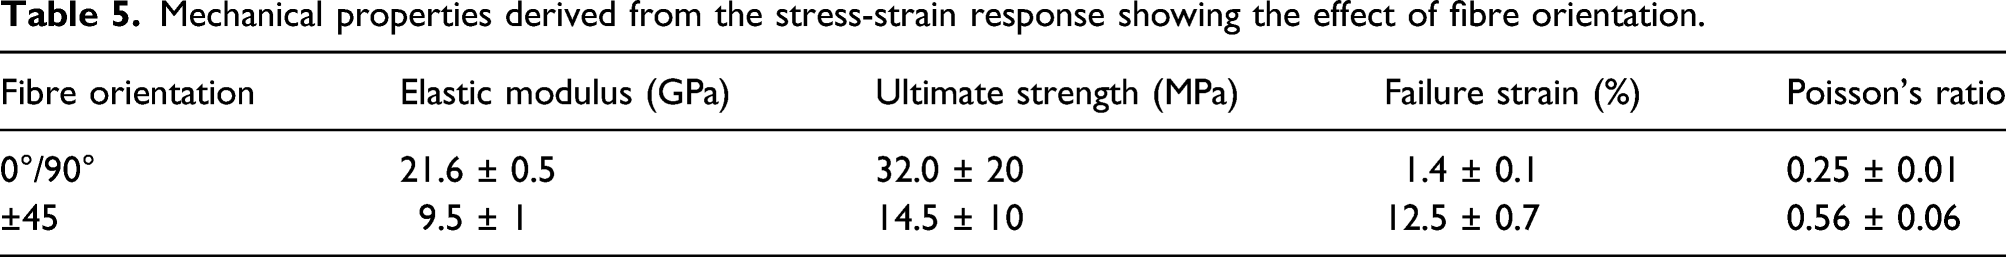
Based on the strain data extracted from the DIC measurements (i.e. by the means of the virtual strain gauge as shown in Figure 2(c) and the stress calculated from the applied load which can be read from the load cell of test machine, the effect of fibre orientation on tensile stress-strain response of GFRP is shown in Figure 8. Mechanical properties derived from the stress-strain curves are listed in Table 5. Tensile stress-strain curves showing the anisotropy; fracture strains in these plots correspond to the maximum strains. Mechanical properties derived from the stress-strain response showing the effect of fibre orientation.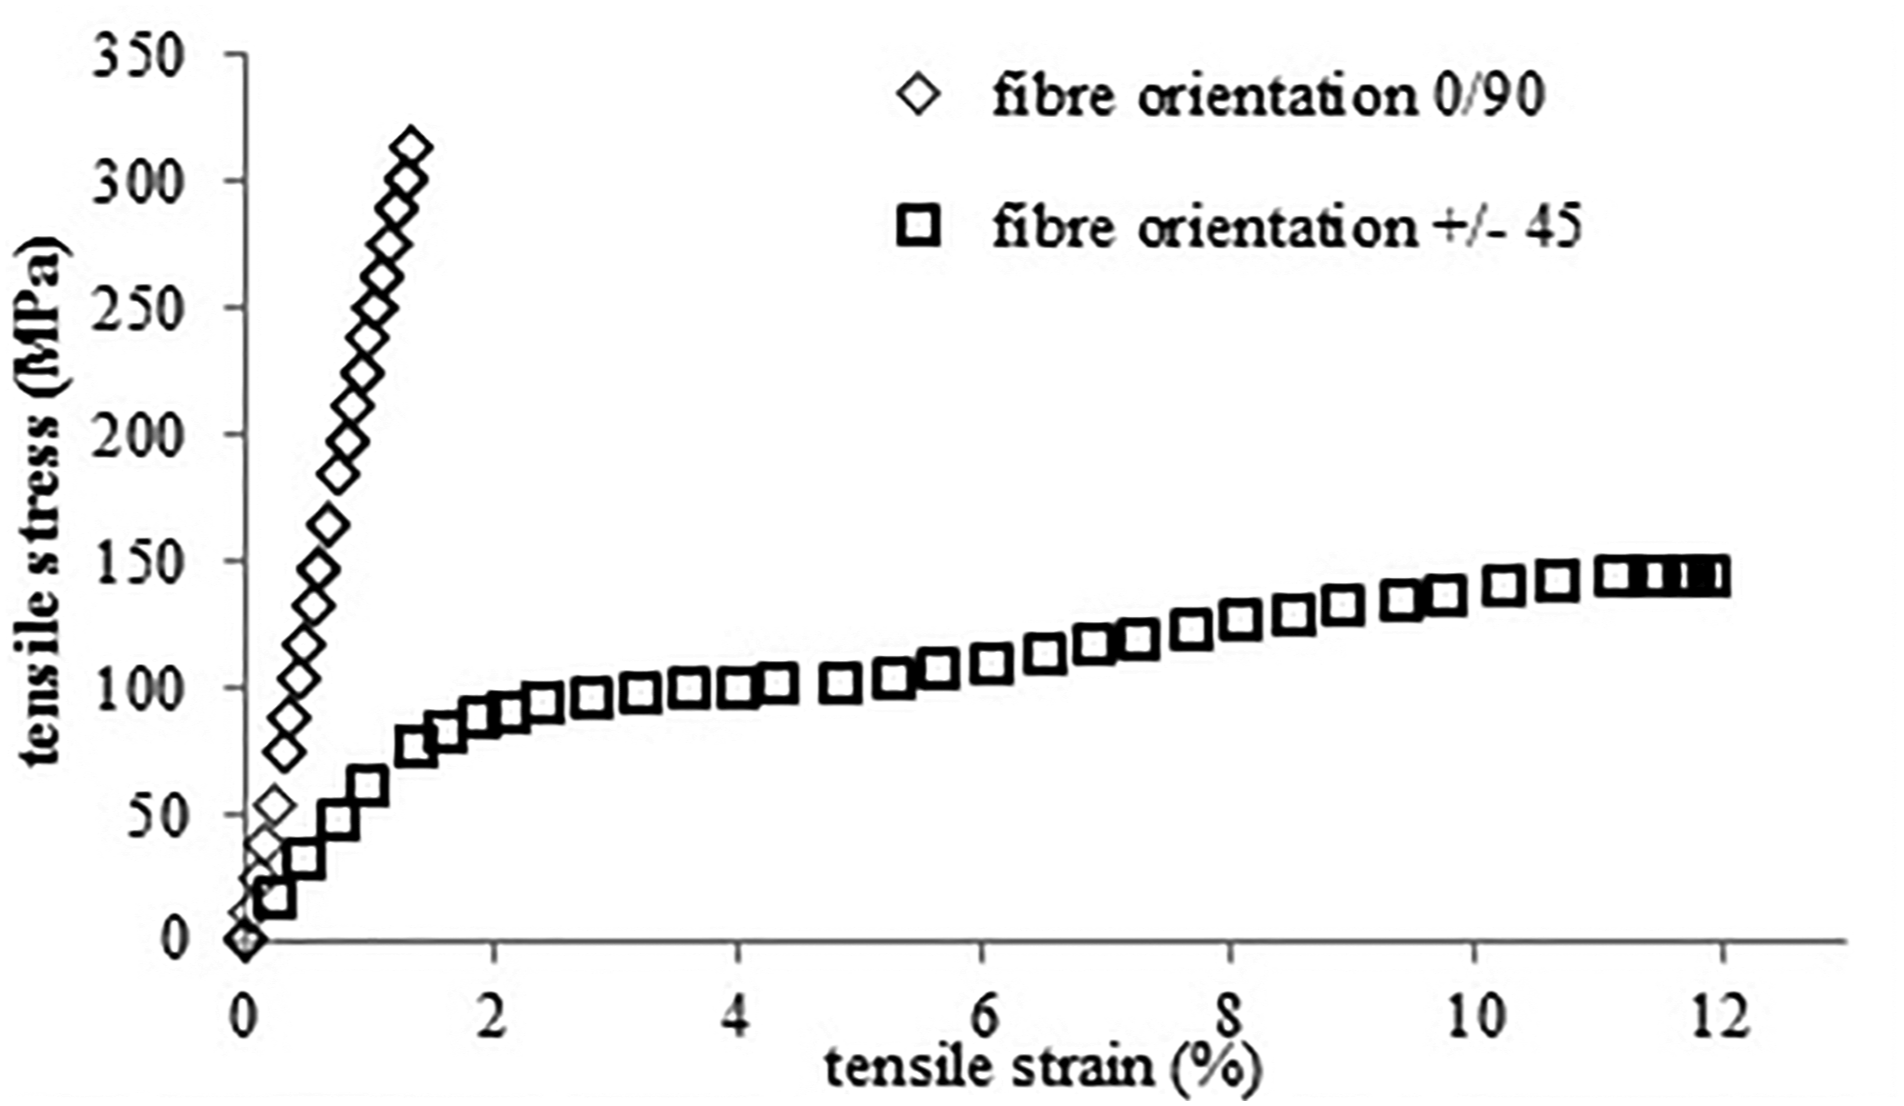
Qualitative analysis of the strain localisation
The development of strain was considered in DIC measurements and the effect of fibre orientation is shown in terms of strain fields (strain component in longitudinal direction- DIC generated normal strain in longitudinal direction 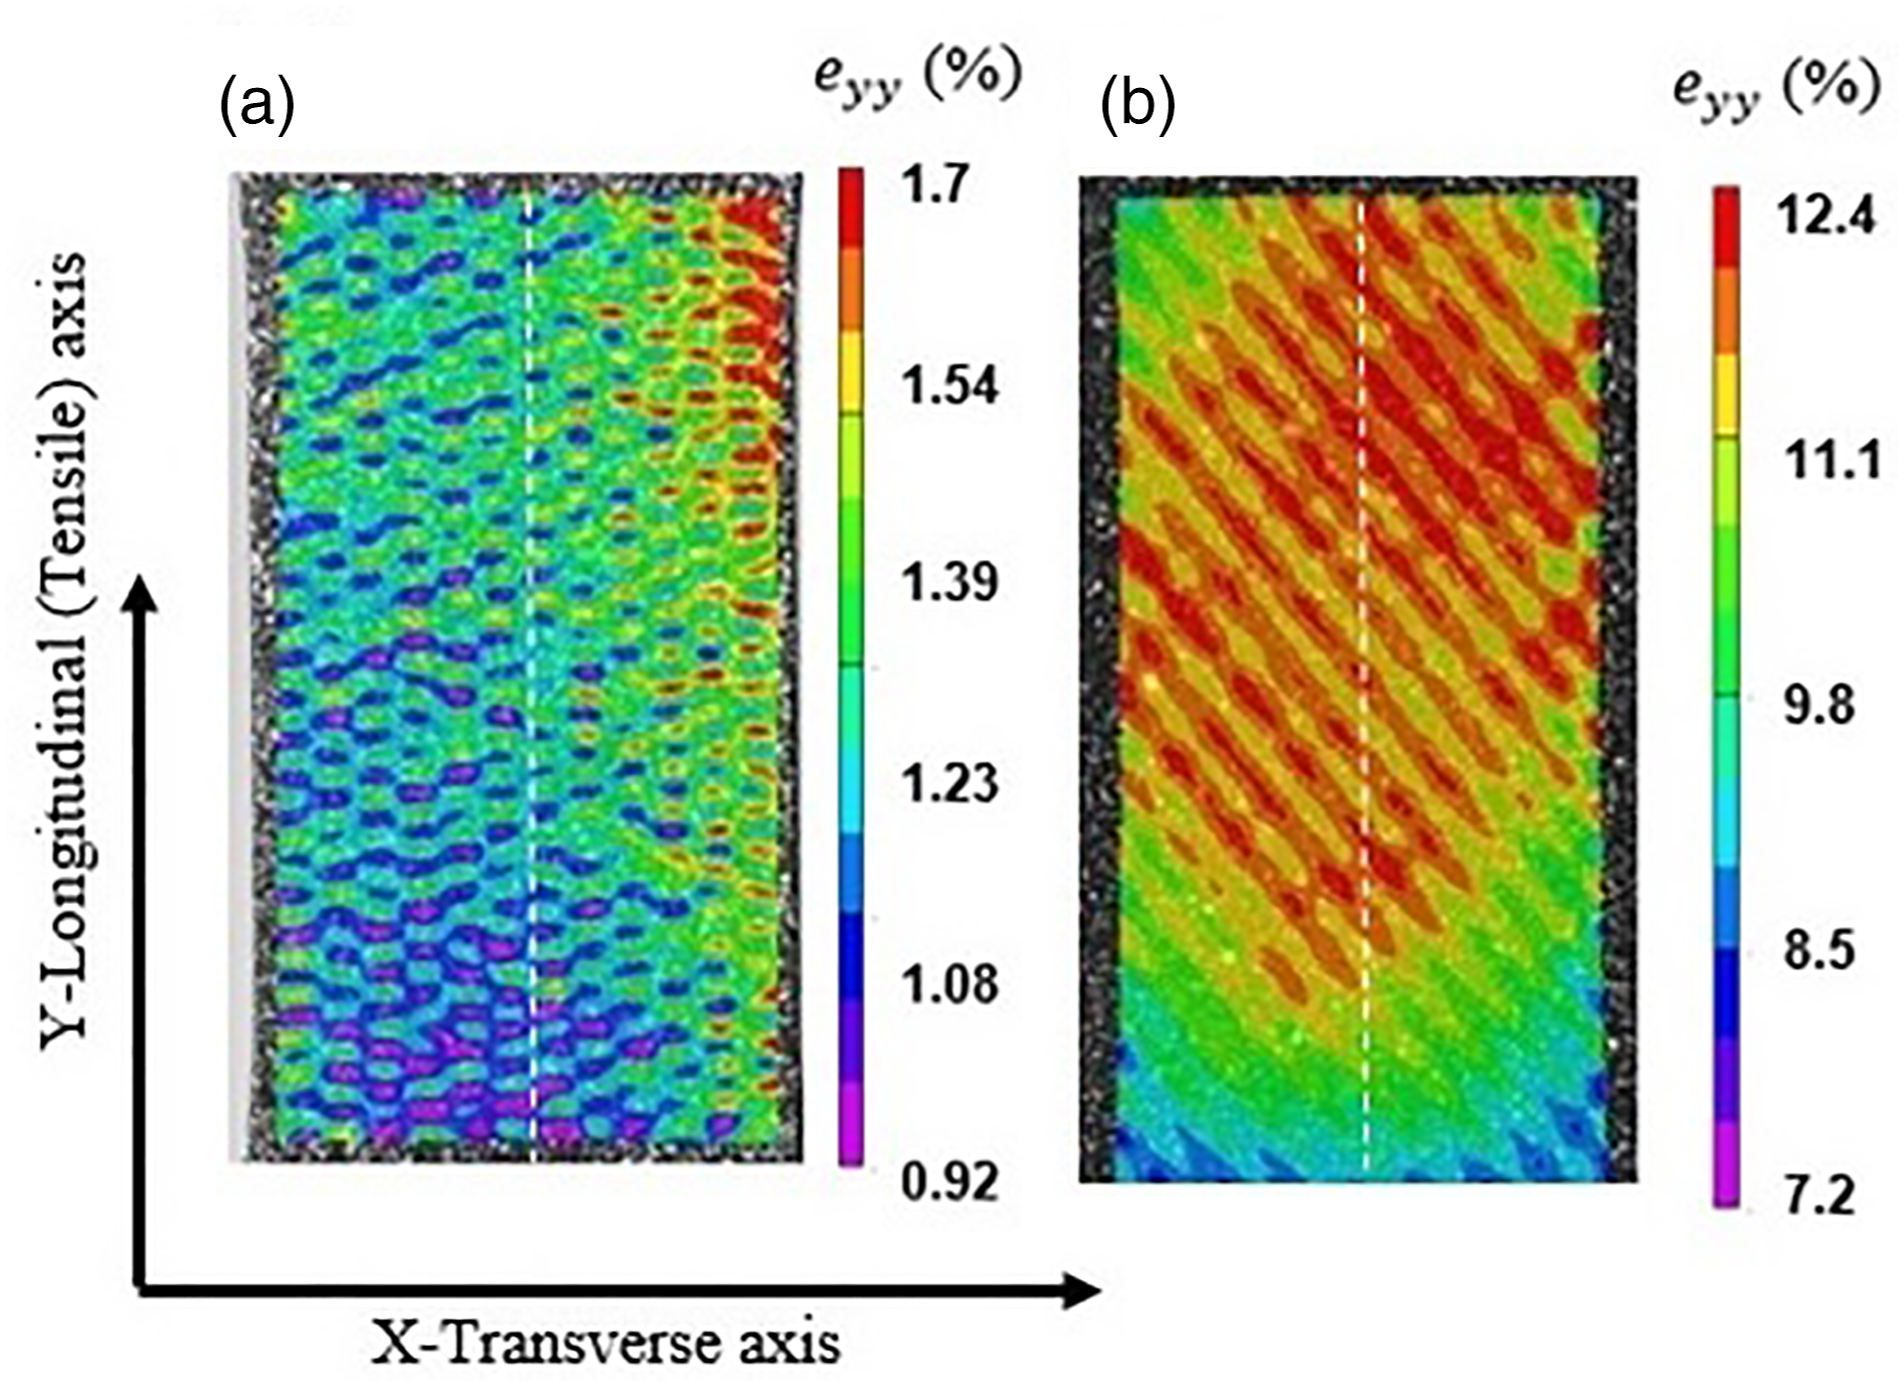
From the inhomogeneous distribution of the localised strains in the tensile specimens with 0°/90° lay-up (Figure 9(a)), it can be seen that the damage initiates near an edge and is located in a few distinct places. Creation of distributed localised strains is correlated with the microstructure of the specimen. The distribution of the polymer matrix at areas where longitudinal/transverse yarns are crossing form regions with a heterogeneous distribution of strain. The microscopic image shows the development of such different areas (Figure 1). Similar findings in the literature regarding the distribution of localised strain in DIC maps and its correlation with the microstructure of woven composites support this .3,19
In a composite with ±45° fibre orientation, DIC strain maps show an inhomogeneous distribution of the localised strains in the form of strain bands oriented at 45° to the applied load direction (Figure 9(b)). Creation of resin shear bands and shear lips at 45° angled planes in sample with ± 45° fibre orientation (Figure 13(b)) supports this observation. Strain maps for this fibre orientation reveal that delamination begins in much more limited zones located in the middle of the sample width. With reference to the numerical and analytical solutions detailed in section 3.1.5, when the fibre angle increases, coupling between extension and shear increases meaning that, the uniaxial applied load not only causes longitudinal and transverse strains but also contributes to the in-plane shear strain on the test specimen. If the induced shear stress in the matrix exceeds its shear strength, plastic deformation is developed in the matrix and the failure is dominated by matrix plasticity and interfacial properties . 3
Quantitative analysis of strain localisations
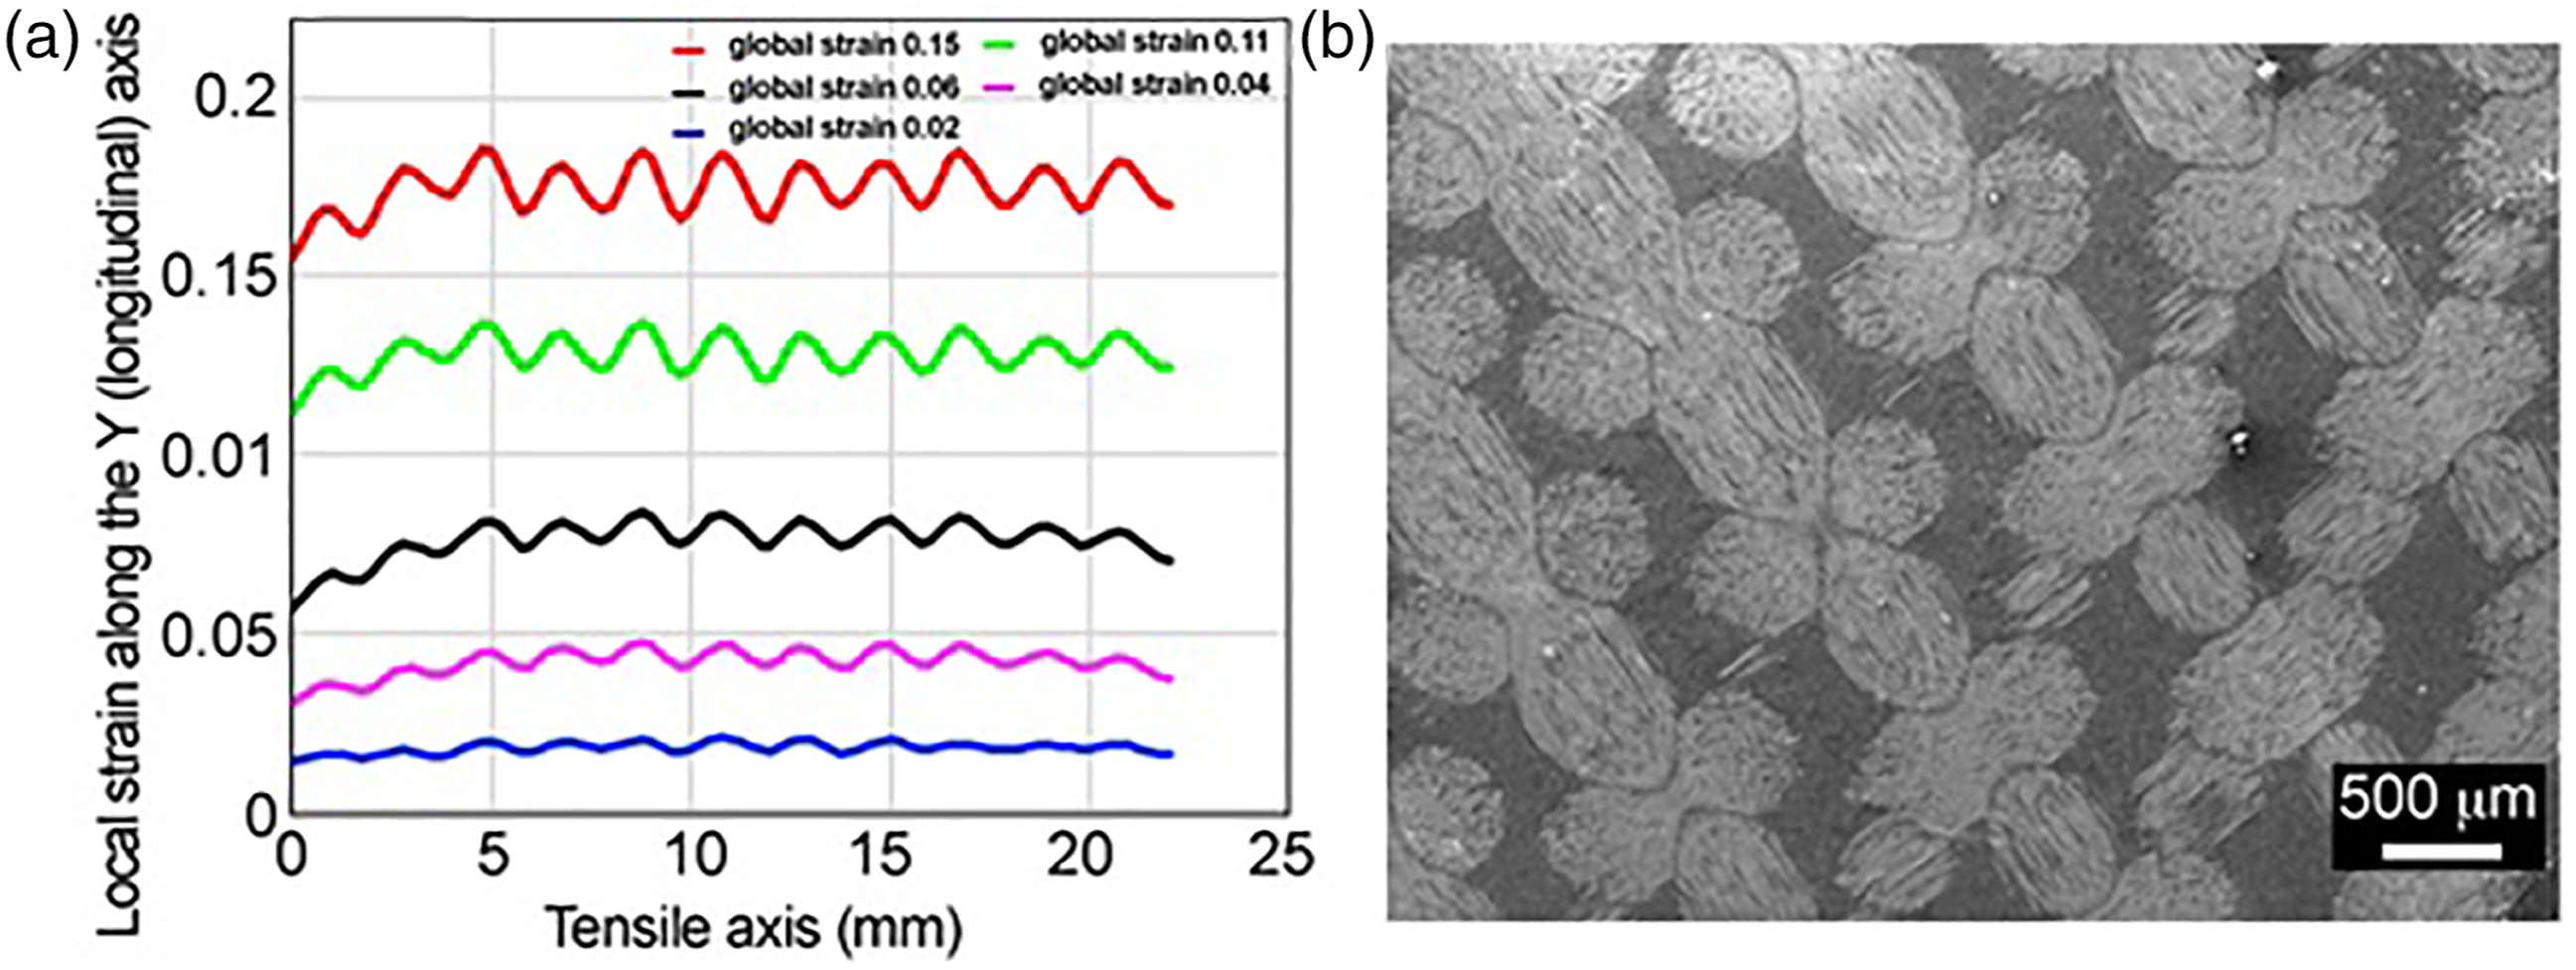
In order to quantitatively analyse the accumulated strains in the high and low strain domains, sectional analysis of the localised strain along the main axis (marked with a white dotted line in Figure 9) was carried out. The profile of longitudinal strain evolution for the specimens with 0°/90° lay-ups is shown in Figure 10(a). The strain accumulation is inhomogeneous as indicated by the formation of periodic strain maxima and minima. The maximum difference between the maxima and minima is around 10–40% and the profiles for different global strain levels look similar and are just moved to higher strain values with increasing global strain. The space between the adjacent maxima and minima is not regular which is consistent with the inhomogeneous microstructure of the composite (Figure 10(b)). At lower applied load the profile distribution of the accumulated strain curves for composite with ±45° fibre orientation in Figure 11(a) displays a relative homogenous pattern suggesting an identical distribution of the applied load between the polymer matrix and the reinforcing fibres. However, it changes into the periodic strain maxima and minima at later stages of the test. In other words, with further increase in the applied load, after the matrix yield strain is reached locally, there is change from a homogeneous to a heterogeneous distribution. This suggests a different load distribution mechanism for the ±45° compared with the 0°/90° fibre orientation. The space between the adjacent maxima and minima is not regular and is consistent with the heterogeneous microstructure as seen in Figure 11(b). Quantitative analysis of strain localisations for woven composite with 0°/90° orientation (a) Sectional analysis of the evolution of the accumulated elastic-plastic strain distribution along the parallel length of the test specimen based on the displacement field data, (b) micrograph of the top surface of the specimen showing the orientation of fibre bundles at 0°/90°. Quantitative analysis of strain localisations for woven composite with ±45° orientation (a) Sectional analysis of the evolution of the accumulated elastic-plastic strain distribution along the parallel length of the test specimen based on the displacement field data. (b), the micrograph of the top surface of the specimen showing the orientation of fibre bundles at ±45°.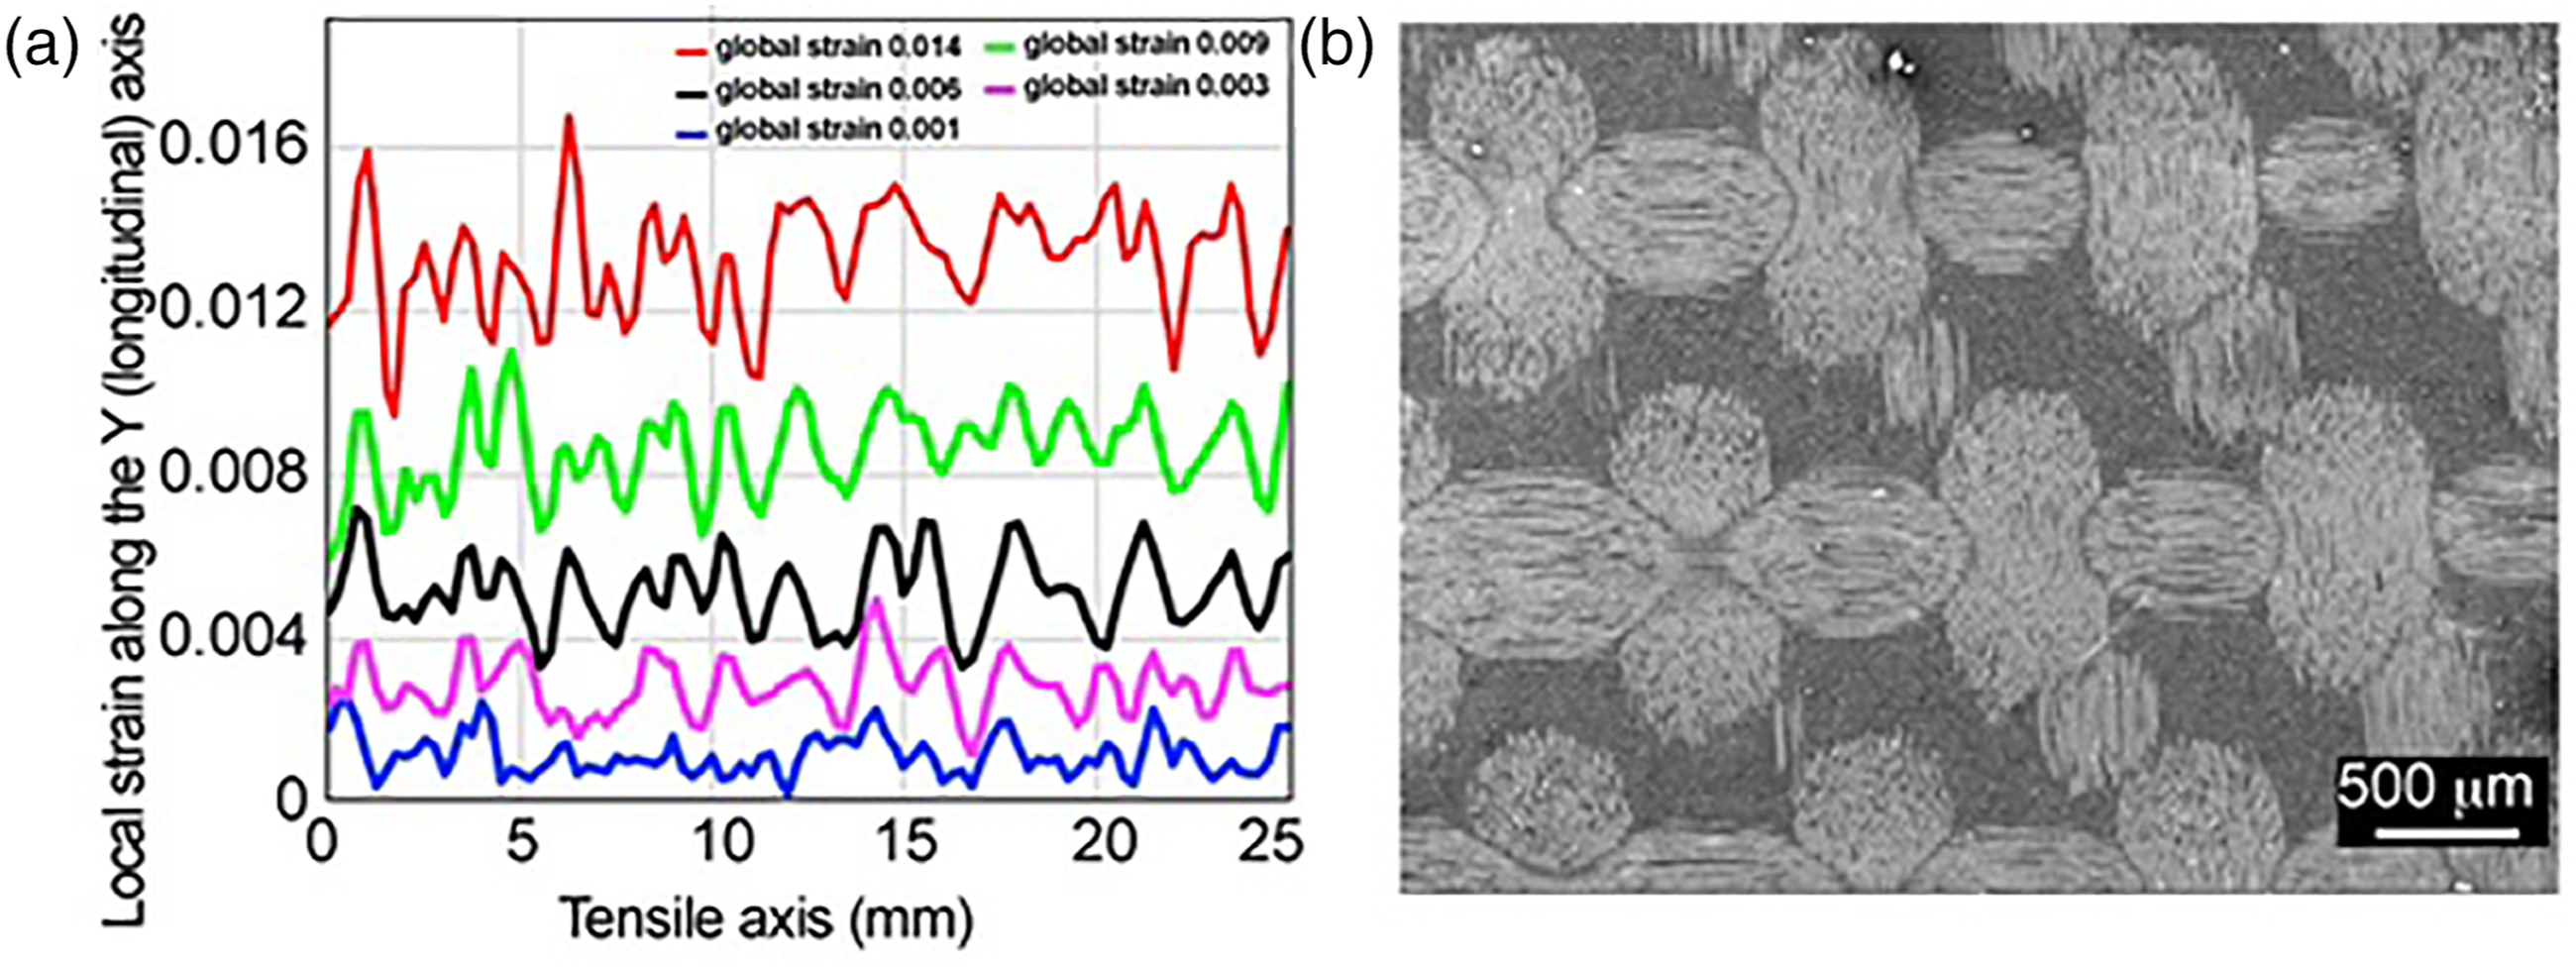
Failure analysis
When the fibre orientation changes from 0°/90° to ±45°, a substantial reduction in ultimate tensile strength and increase in strain to failure indicate that the tensile behaviour of this material strongly depends on the fibre alignment. This behaviour of the composite is due to the influence of fibre orientation on the load distribution mechanism. When the fibres are oriented at 0°/90°, applied tensile load is only taken by the reinforcing fibres parallel to the tensile loading axis, therefore the material shows an increase in failure strength which is related to high load enduring capacity of longitudinal fibres. Figure 12 shows an SEM micrograph of the fracture surface of a composite with 0°/90° oriented fibres. As can be seen in Figure 12(a), cluster of fibres are pulled out and the corresponding view from lateral side (Figure 12(b)), confirms interfacial de-bonding between fibres and matrix. The uneven surface topography of a longitudinal bundle of pulled-out fibres and the smooth surfaces of transverse fibres indicate that the maximum applied load is taken by longitudinal fibres. The surface of polymer matrix is relatively smooth representing no signs of plastic deformation in epoxy resin at failure point. The fracture edge from the top surface of the specimen with 0°/90° fibre orientations is flat. Transverse cracks in the epoxy matrix indicate that during pulling-out of longitudinal fibres, transverse bundle of fibres are also pulled-out (Figure 12(c)). Scanning electron micrographs of the fracture surface of composite samples with 0°/90° fibre configuration (a) Cluster of fibres pulled out from epoxy resin (b) Pulling out of fibre clusters, (c) The top surface of a specimen indicating a straight edge with transverse failure of the fibres.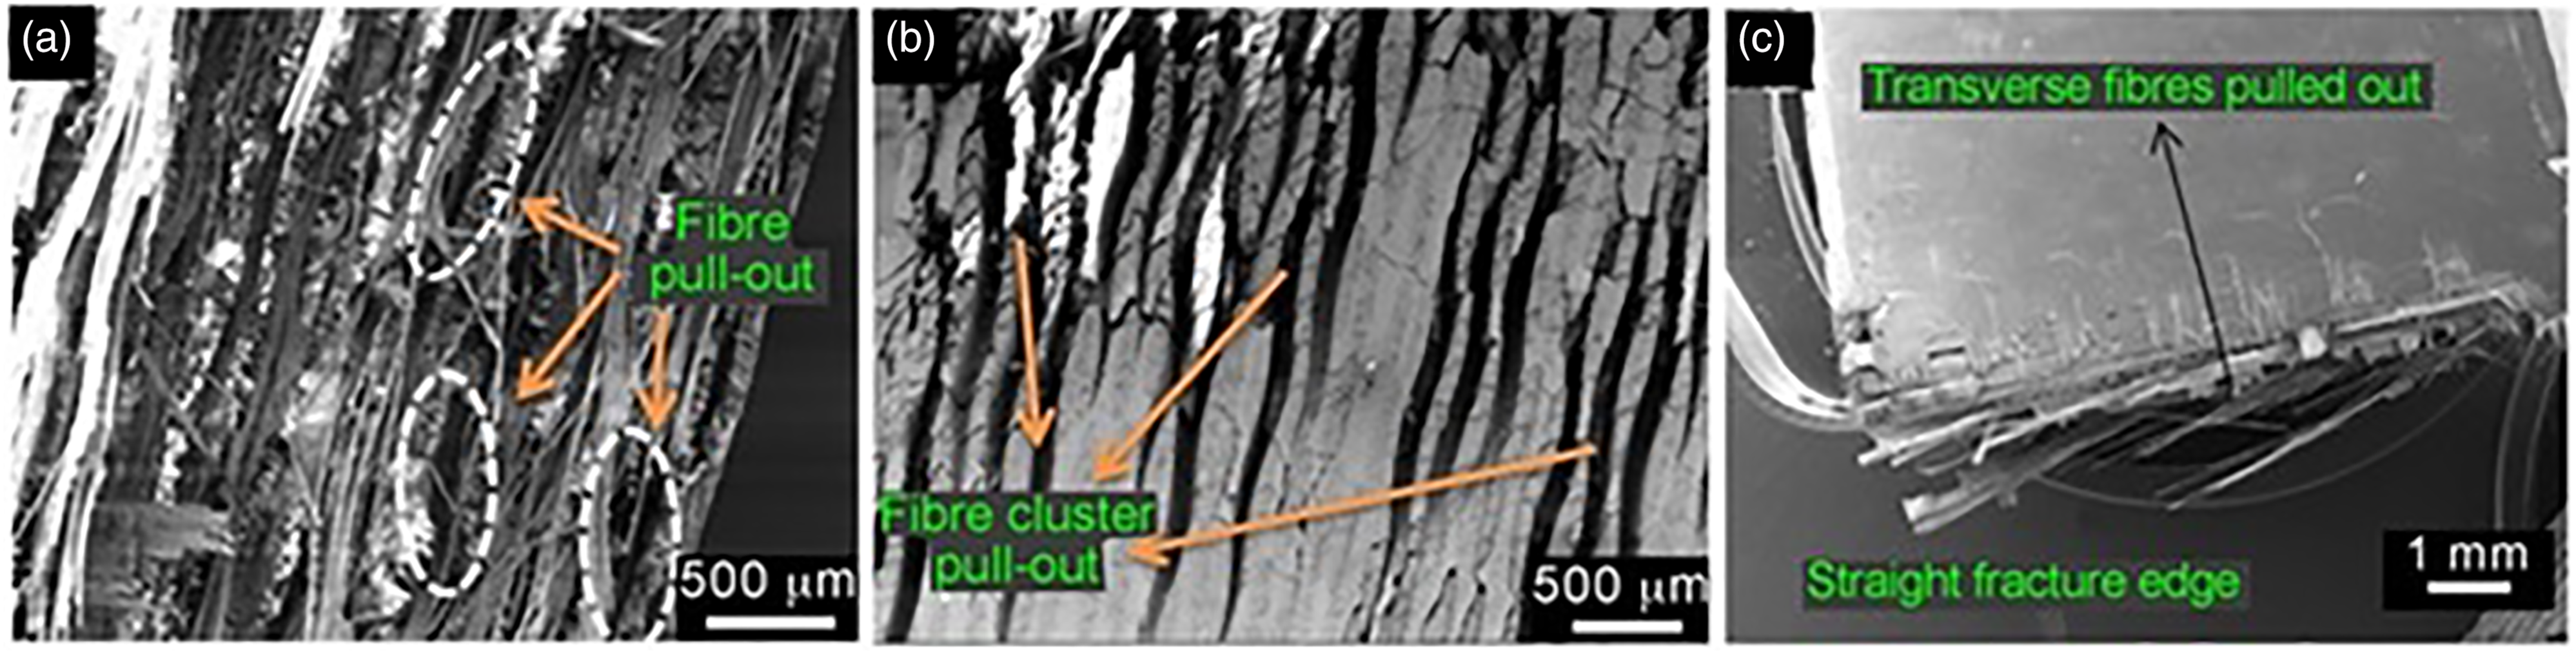
When the fibres are oriented at −45°/+45°, a higher ductility and lower failure strength relative to 0°/90° fibre orientation is seen which is related to the less constraining effect of fibres in the straining of the matrix. Therefore, epoxy resin has additional space to extend between reinforcements and along the loading axis. When the fibres are oriented at −45°/+45°, the applied tensile load is divided between the fibres and matrix. If the induced stress in the matrix exceeds its strength, plastic deformation is developed within it and the failure is dominated by matrix and interfacial properties. Unlike the topography of the fracture surface of the sample with 0°/90° fibre orientation, surfaces of both the fibres and the epoxy resin matrix of specimen with ±45° fibre orientation are uneven and rough indicating that more of the applied load was distributed in the polymer matrix. (Figure 13(a)). This explains the higher strain of sample and its lower strength. Scanning electron micrographs of the fracture edge from the top side of the specimen with ±45° fibre orientation shows that failure occurs on several angled planes (Figure 13(b)). Formation of shear lips near the edge of the specimen indicates that interfacial de-bonding occurs following the fibre orientation. The induced longitudinal, transverse and shear stresses predicted by FE analysis (see Numerical versus analytical solutions section) in the matrix also suggest matrix crack initiation and propagation parallel to the bundle of fibres and de-bonded fibres in the 45 direction. Furthermore, due to the less constraining effect of fibres in straining at ±45° specimen compared to 0°/90°, creation of resin-shear bands is more pronounced. Scanning electron micrographs of the fracture surface of composite samples,-45°/+45° fibre configuration (a) Cluster of fibres pulled out from epoxy resin. (b) The top surface view of a specimen with −45/+45 fibre configuration indicating multiple angled fracture planes.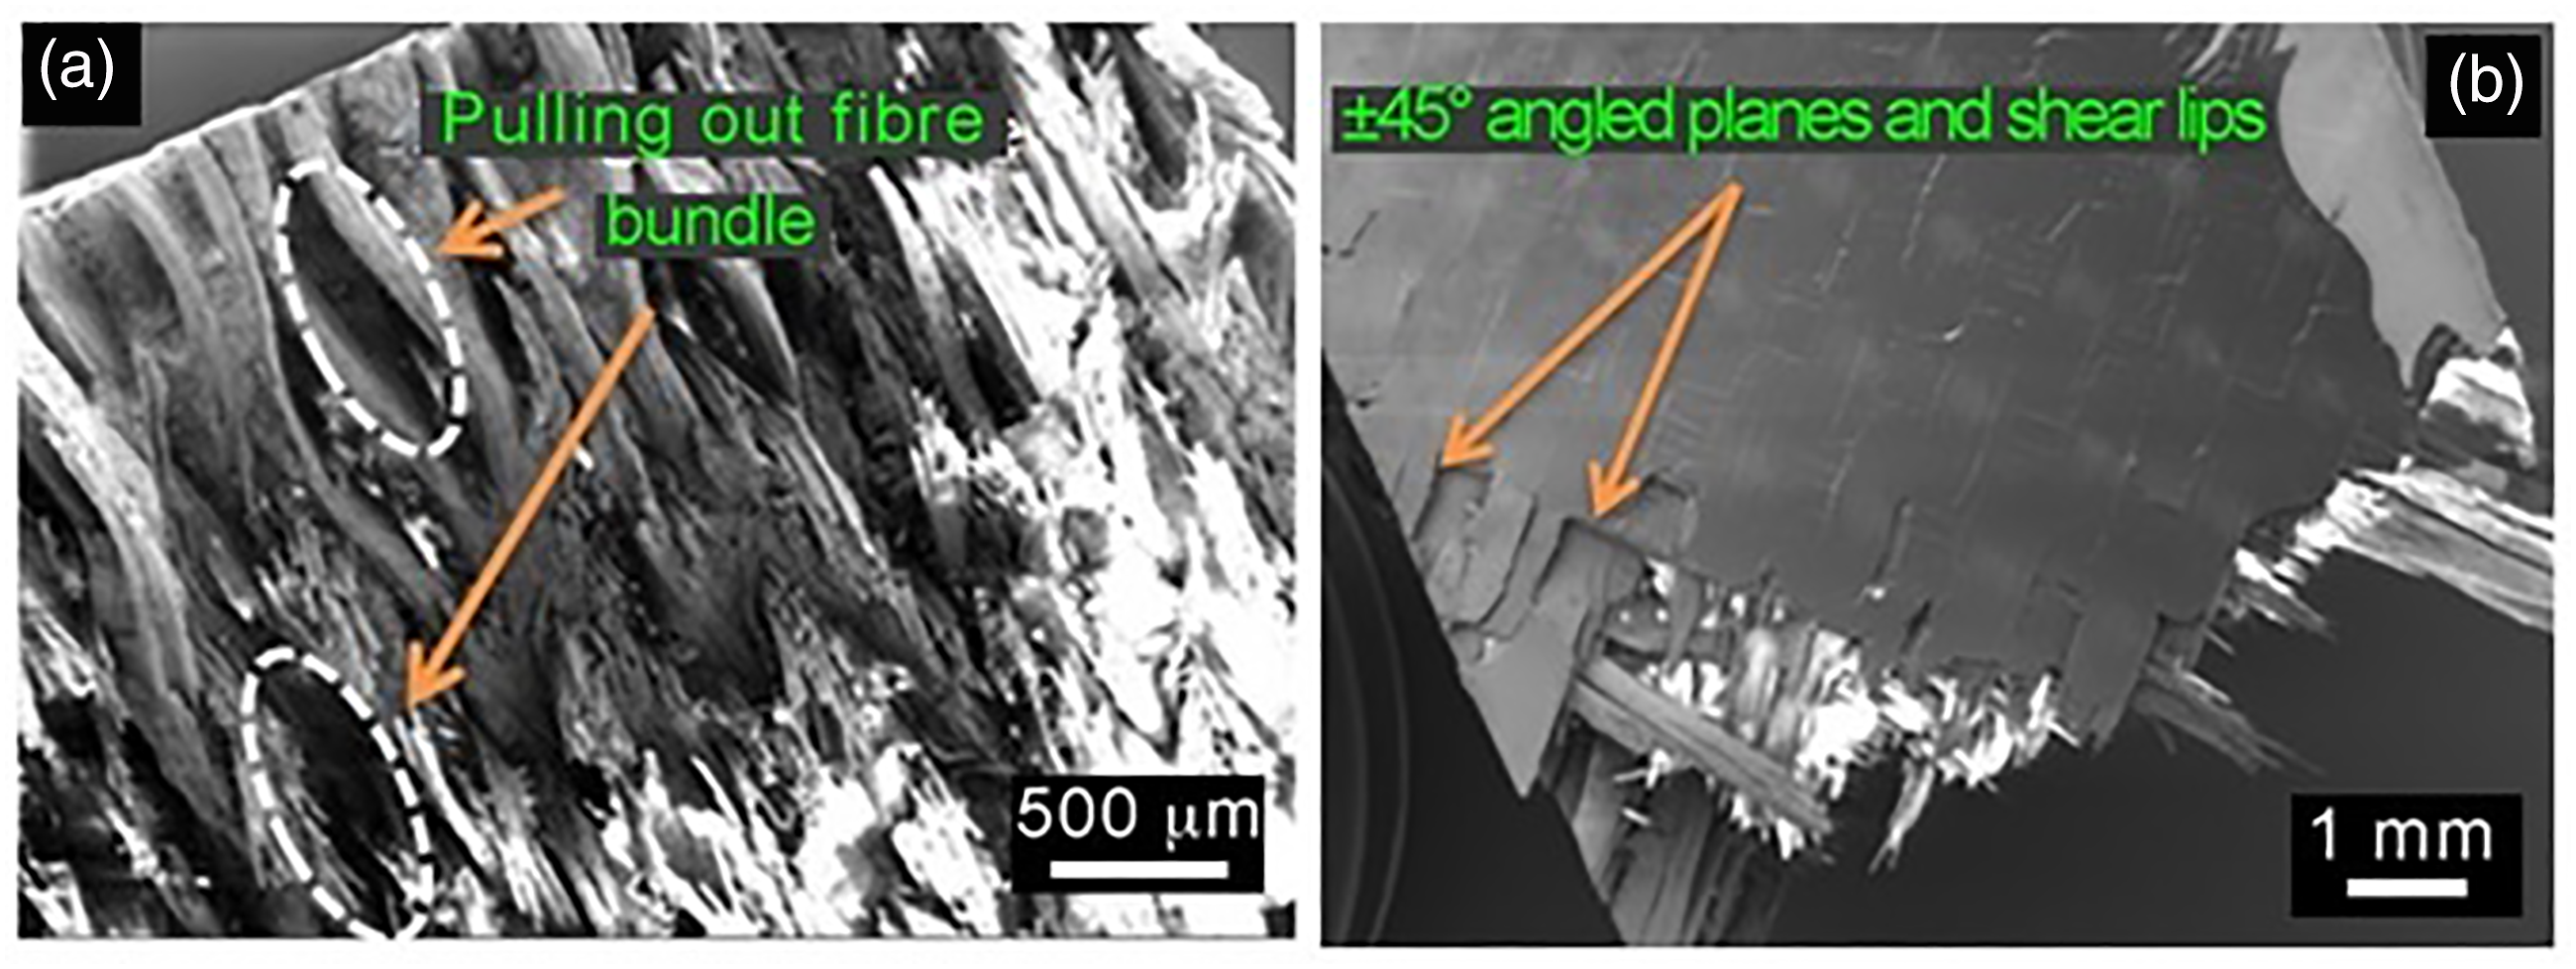
Numerical versus analytical solutions
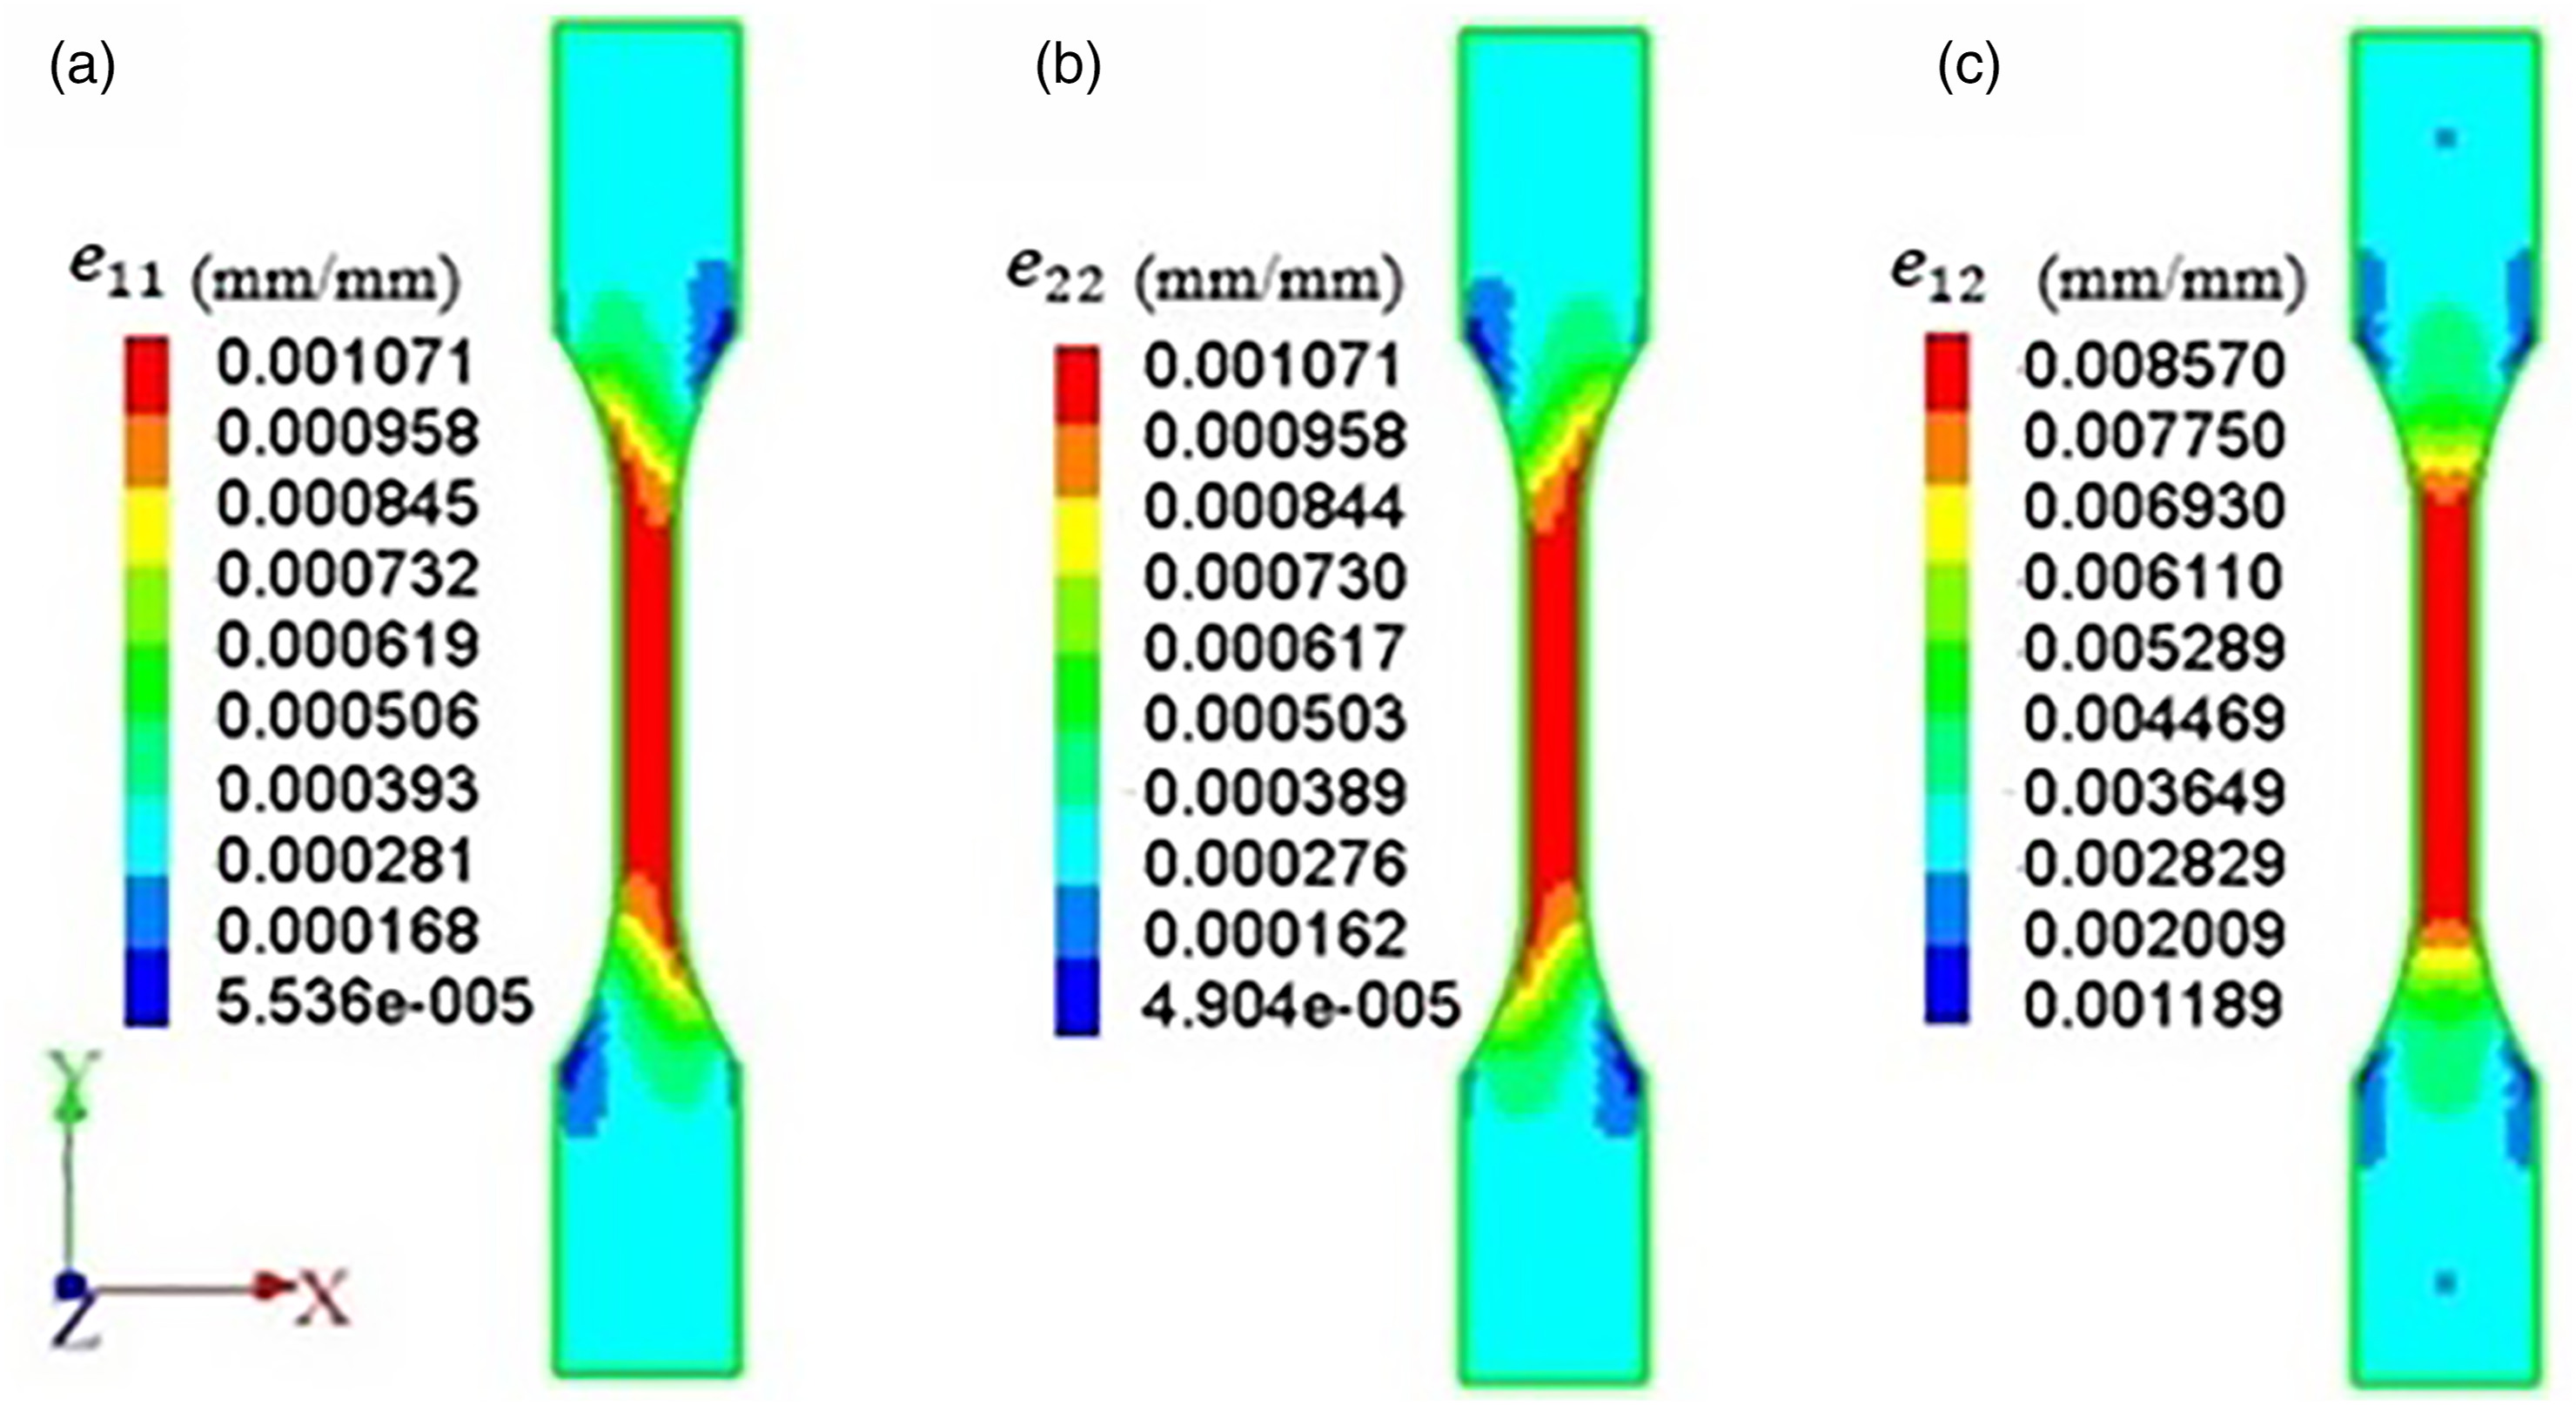
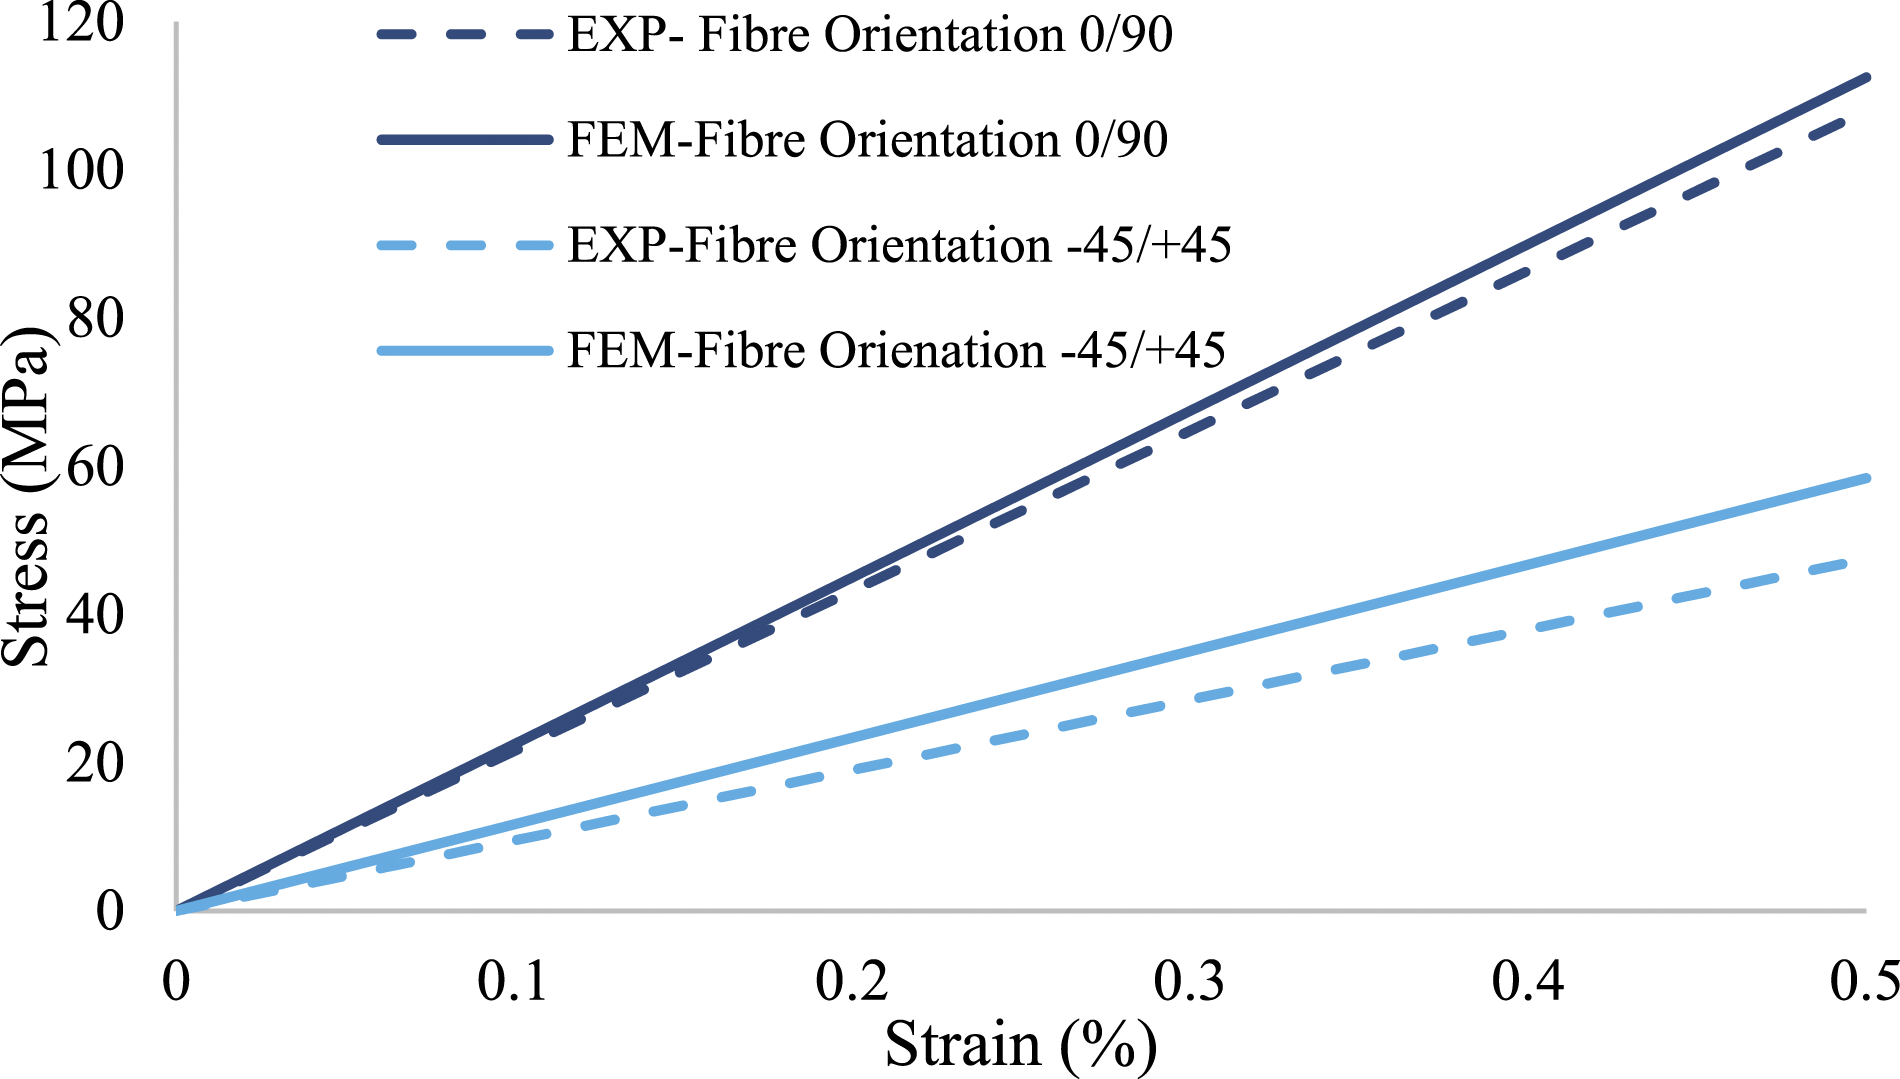
The constitutive equations (see Equation (2)), are only valid in the elastic regime, therefore comparison between the closed-form and numerical solutions has been made for composite samples up to the stress value of 60 MPa in order to make sure that samples with different fibre orientation behave elastically. Given the experimentally calculated orthotropic elastic constants of GFRP material, the stiffness matrix for a composite with 0°/90° and ±45° fibre orientations was calculated (see Supplementary information) and therefore for a laminated composite subjected to the pure uniaxial tension load of 3000 N (i.e. 60 MPa) as detailed in ,
53
components of strains, that is Longitudinal strain FE calculated components of strains (mm/mm) at the load of 3000 N for composite with 0°/90°. (a) Longitudinal strain FE calculated components of strains at the load of 3000 N for composite with ±45°. (a) Longitudinal strain Comparison between EXP and FEM determined tensile stress-strain plots in the elastic regime.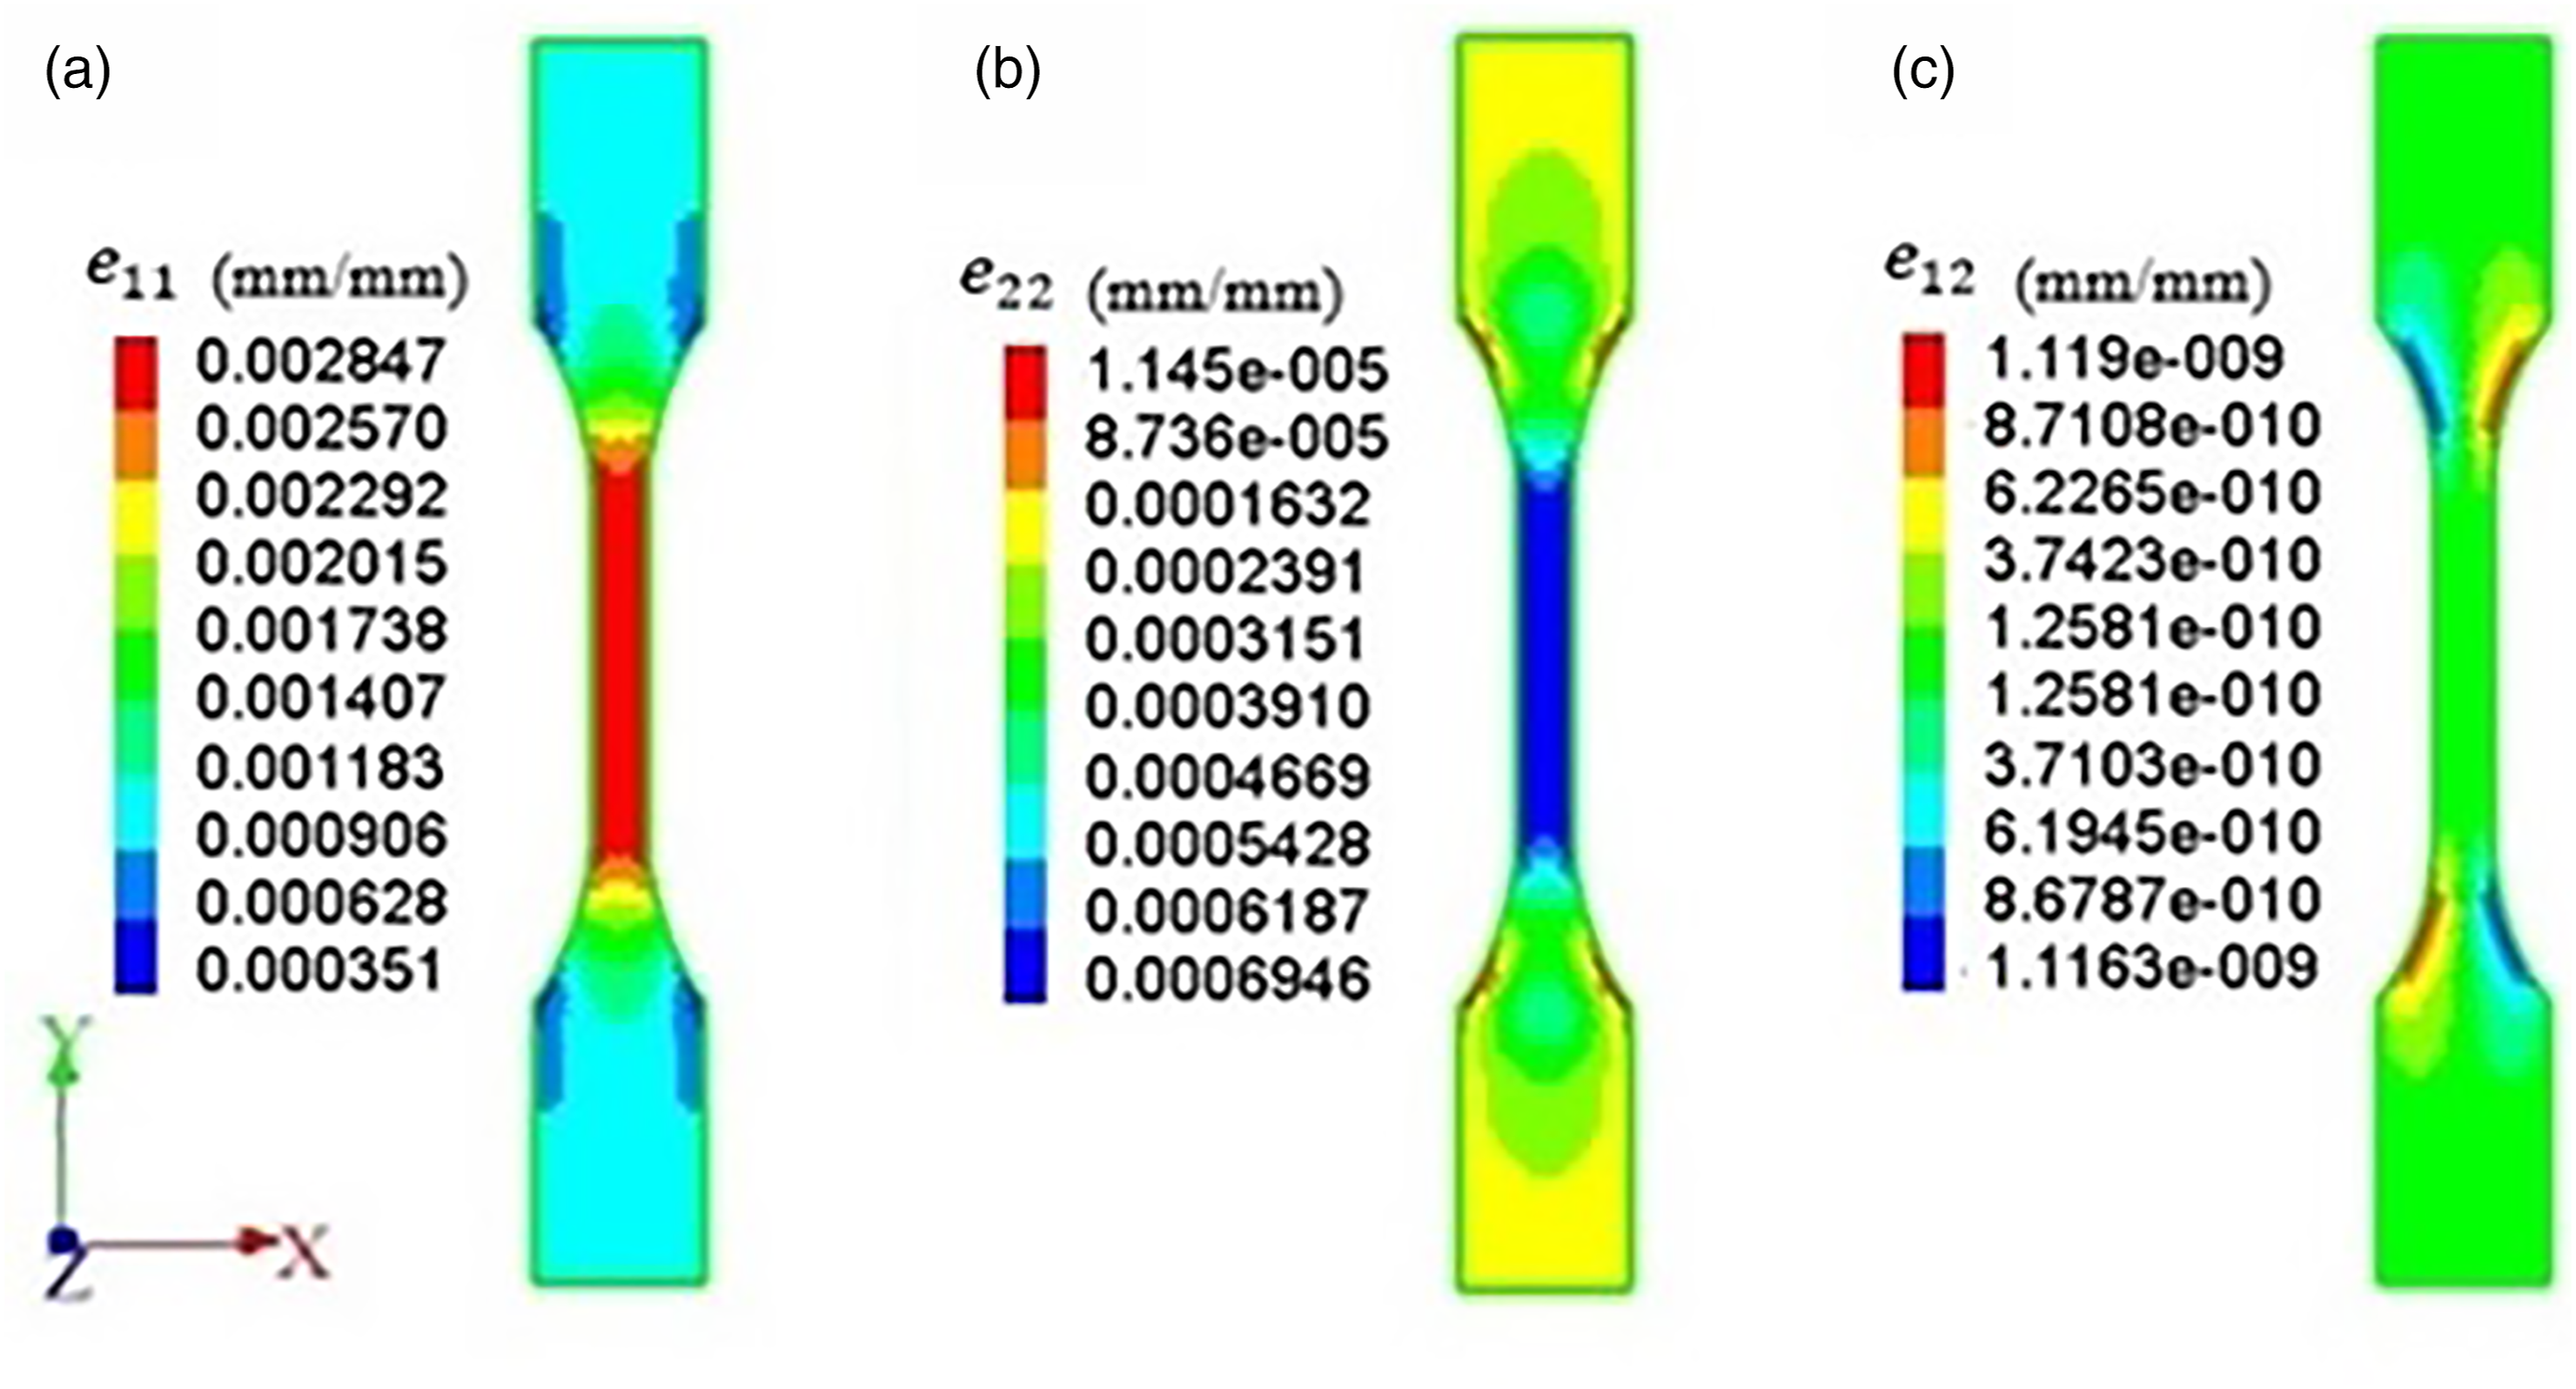
Comparison of experimentally measured strain fields with FEM
In order to compare the FEM and DIC calculated strain distribution on the tensile samples, the RVE of woven GFRP composite sample was analysed using the FE-DIGIMAT software. It must be noted that this comparison was only made within the low load regime (i.e. stress level less than 25 MPa) in the stress-strain curve where the composite behaves elastically. Figure 17 compares the DIC and the FE results for longitudinal component of strain showing a good agreement. Comparing Figures 17(b) and (c) with the microstructure of GFRP composite in Figure 1 reveals that high strain value in Figure 17 in both DIC and FE strain maps corresponds to the epoxy resin region while, an intermediate value of strain matches to the regions with transverse yarn and a low strain value represents the region with longitudinal yarn. There is a small deviation between experimental values of the localised tensile strains developed by the DIC and those predicted by FE in the elastic regime. Small deviations highlight the effects of potential manufacturing defects and flaws such as voids, poor fibre-matrix adhesion and the crimp in the cross-over areas between the weft and warp bundles. Strain 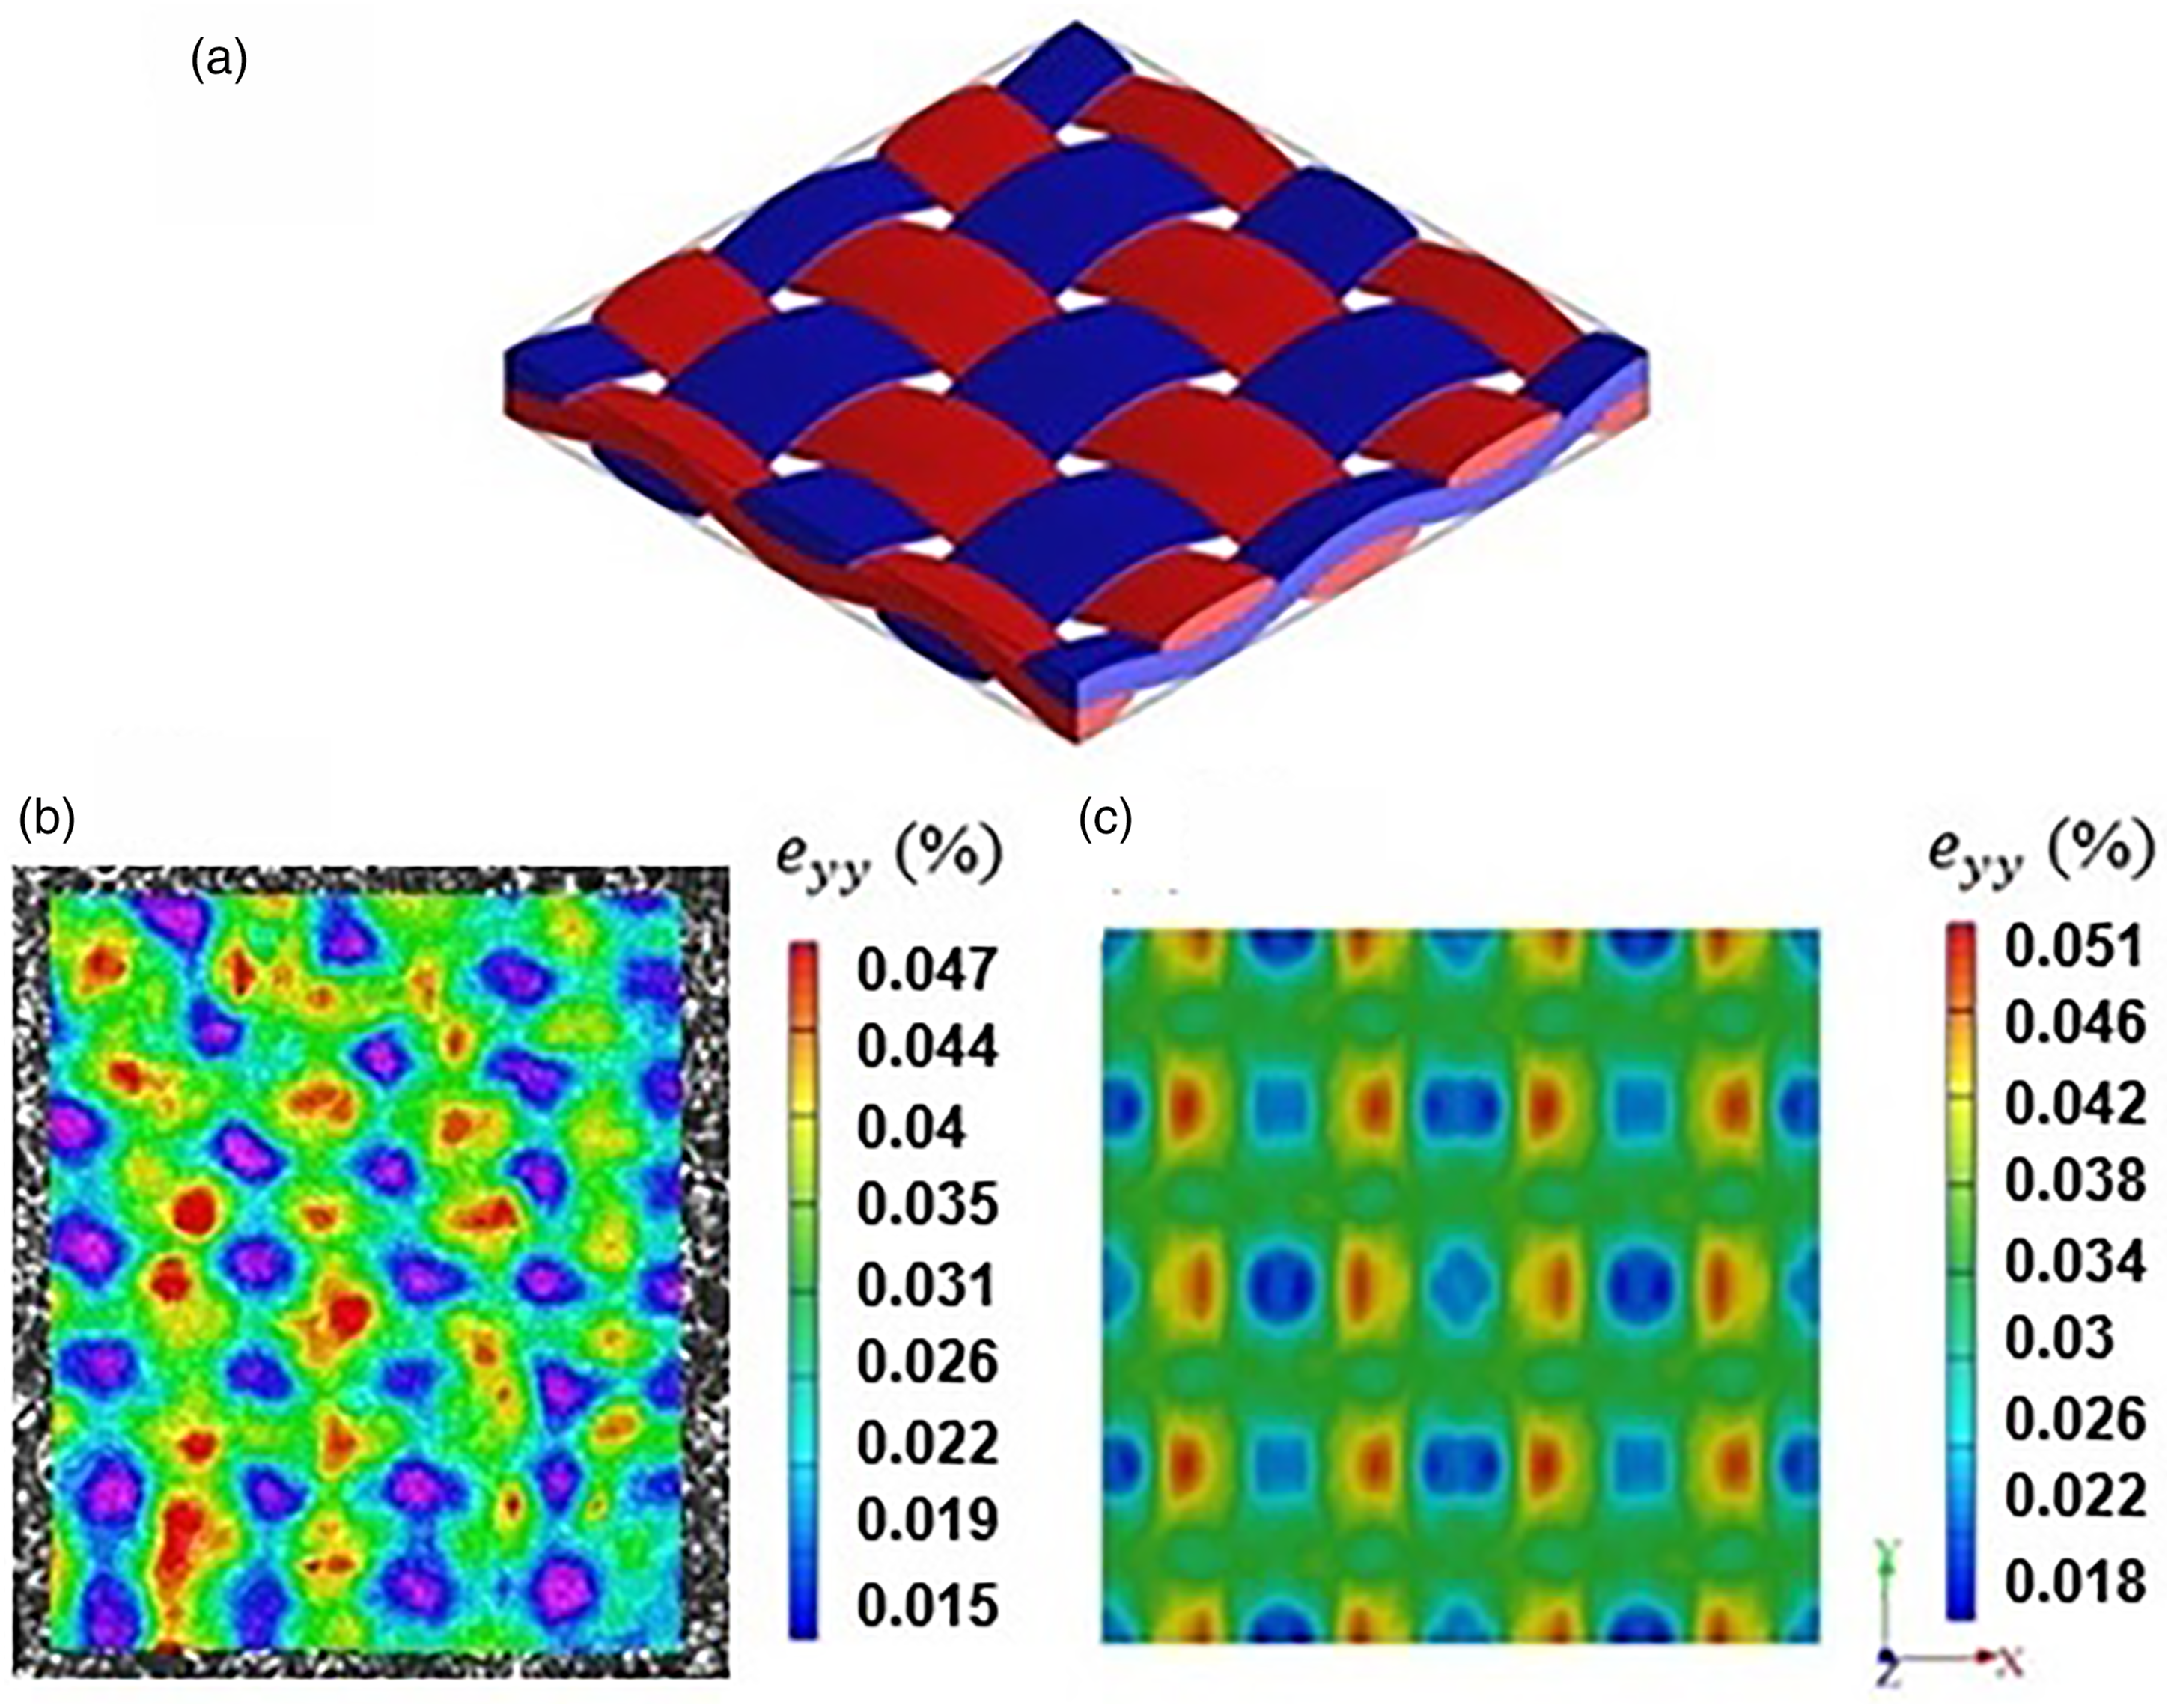
Iosipescu Shear test
Effect of fibre orientation on Inter-laminar and In-plane shear properties
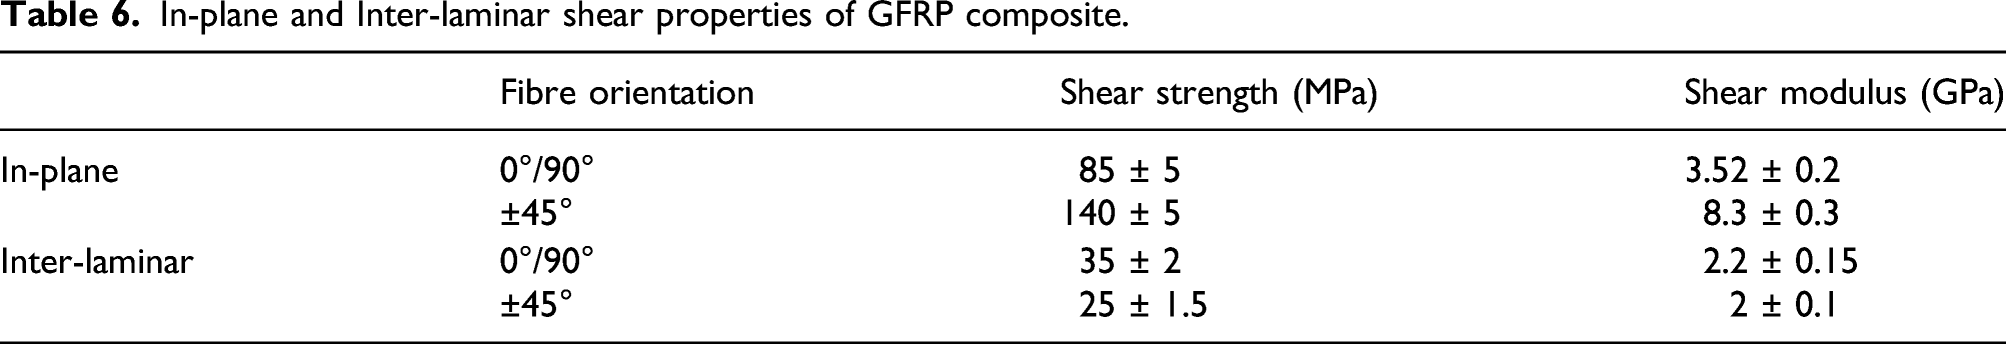
Using the shear strain data extracting from the DIC measurements (i.e. by the means of virtual strain gauge as shown in Figure 2(b) and the force recorded by the load cell of the testing machine divided by the cross-section (distance between notches multiplied by specimen thickness), the shear stress-strain response for both an in-plane and an inter-laminar shear specimen is shown in Figure 18. All curves had comparable behaviour initially. Beyond a limit, they became non-linear due to the accumulation of matrix cracks along the fibre directions and failure of some fibres in the transverse direction. Beyond this point, redistribution of stress between fibres and matrix leads to an increase in the shear stresses with the apparent shear modulus lower than that for the initial linear portion. In specimens with 0°/90° and ±45° fibre orientation, the inter-laminar shear stress-strain relationship is approximately linear up to about 0.014 and 0.011 shear strain, respectively, where the first load drop was observed. By increasing the loading, successive load drops were seen until specimen is broken, which is caused by crack initiation/propagation around the notch roots. Table 6 shows shear strength, elastic shear modulus of GFRP composite and the effect of fibre orientation. Effect of fibre orientation on (a) In-plane and (b) Inter-laminar shear stress-strain response of GFRP. In-plane and Inter-laminar shear properties of GFRP composite.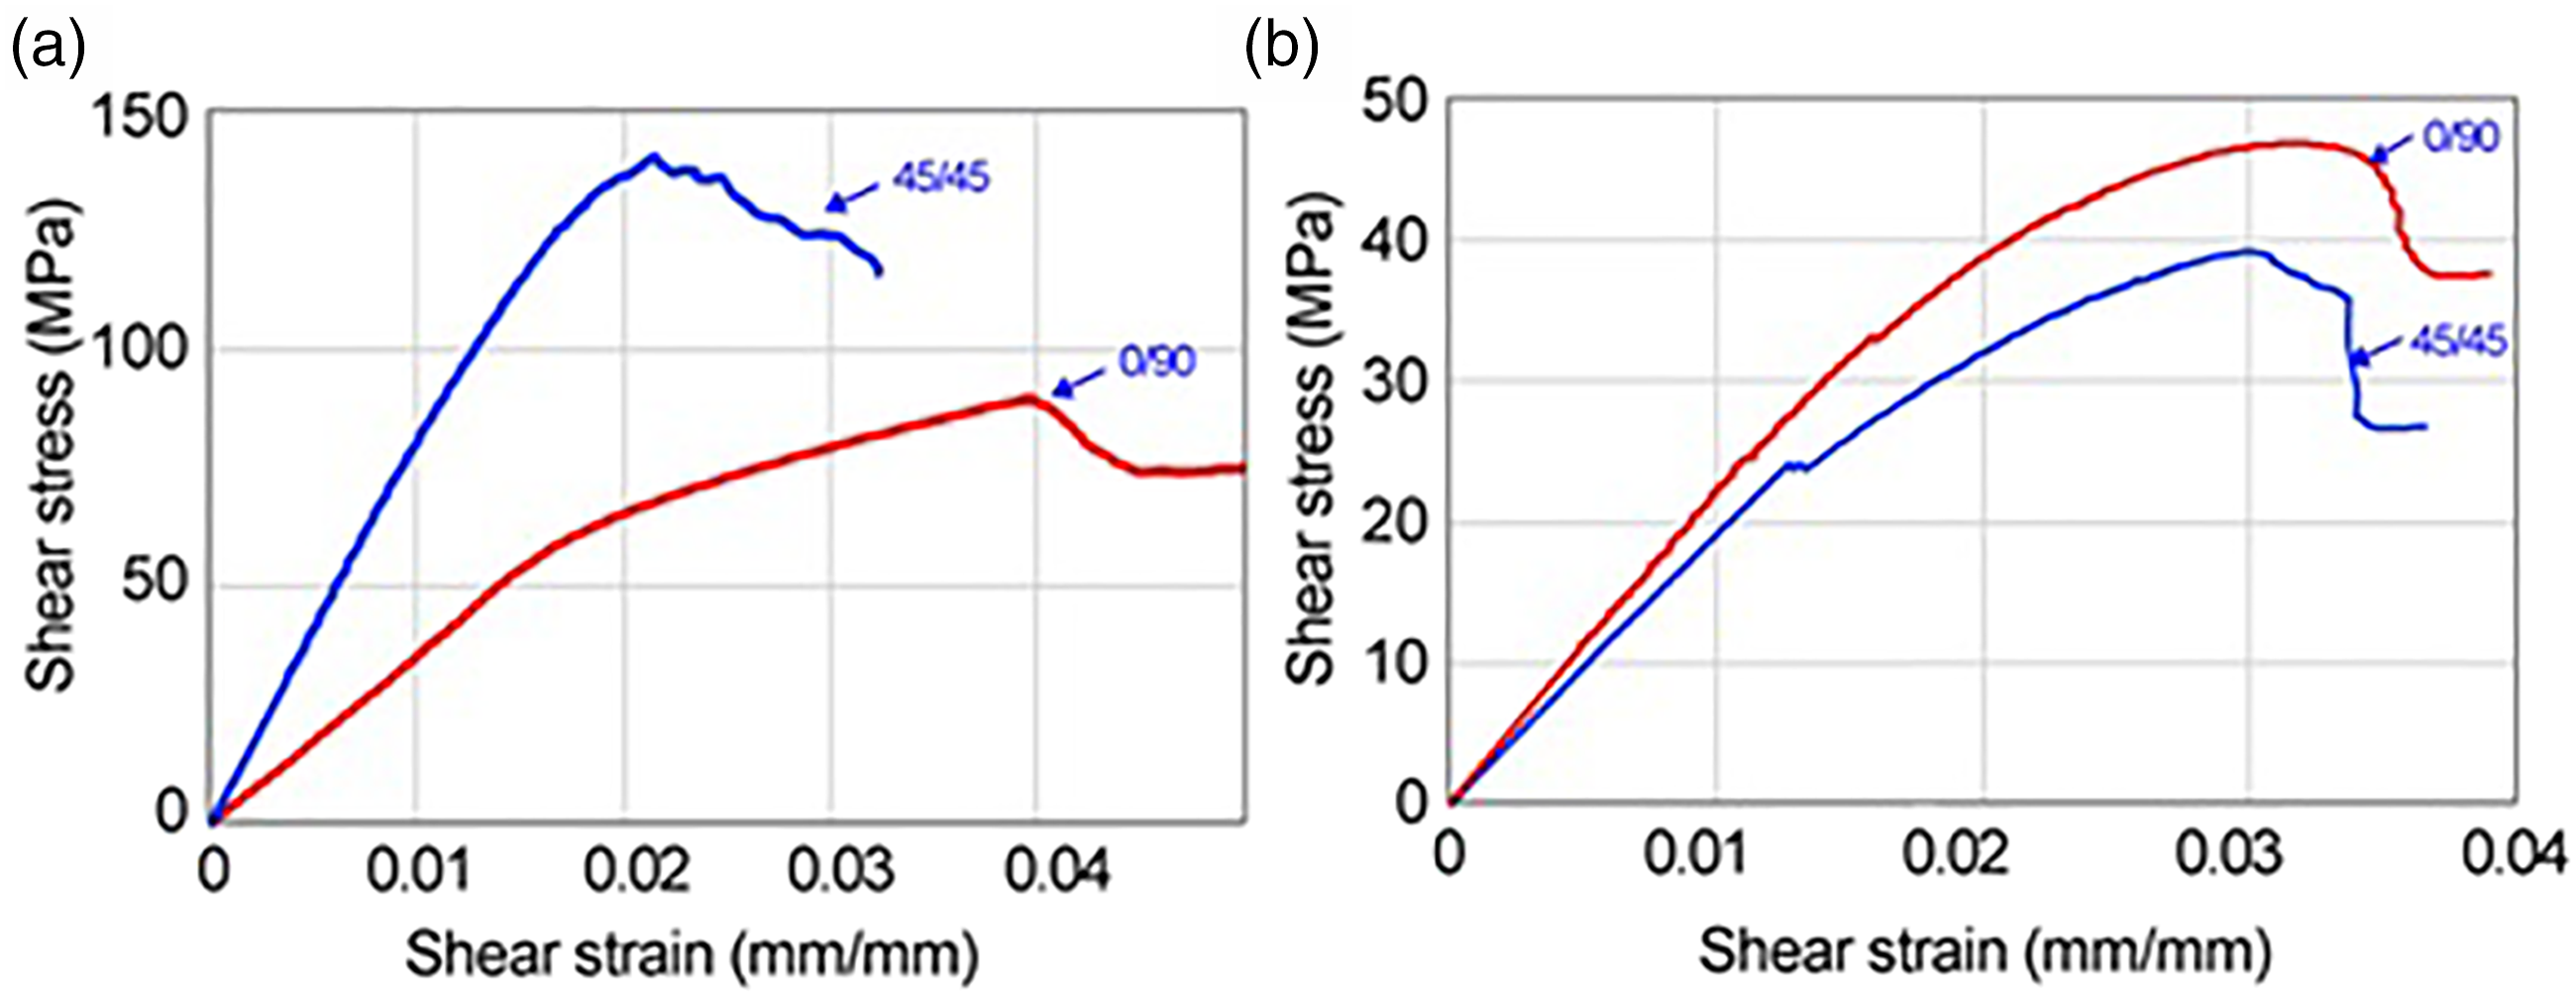
Strain fields developed by DIC and FE
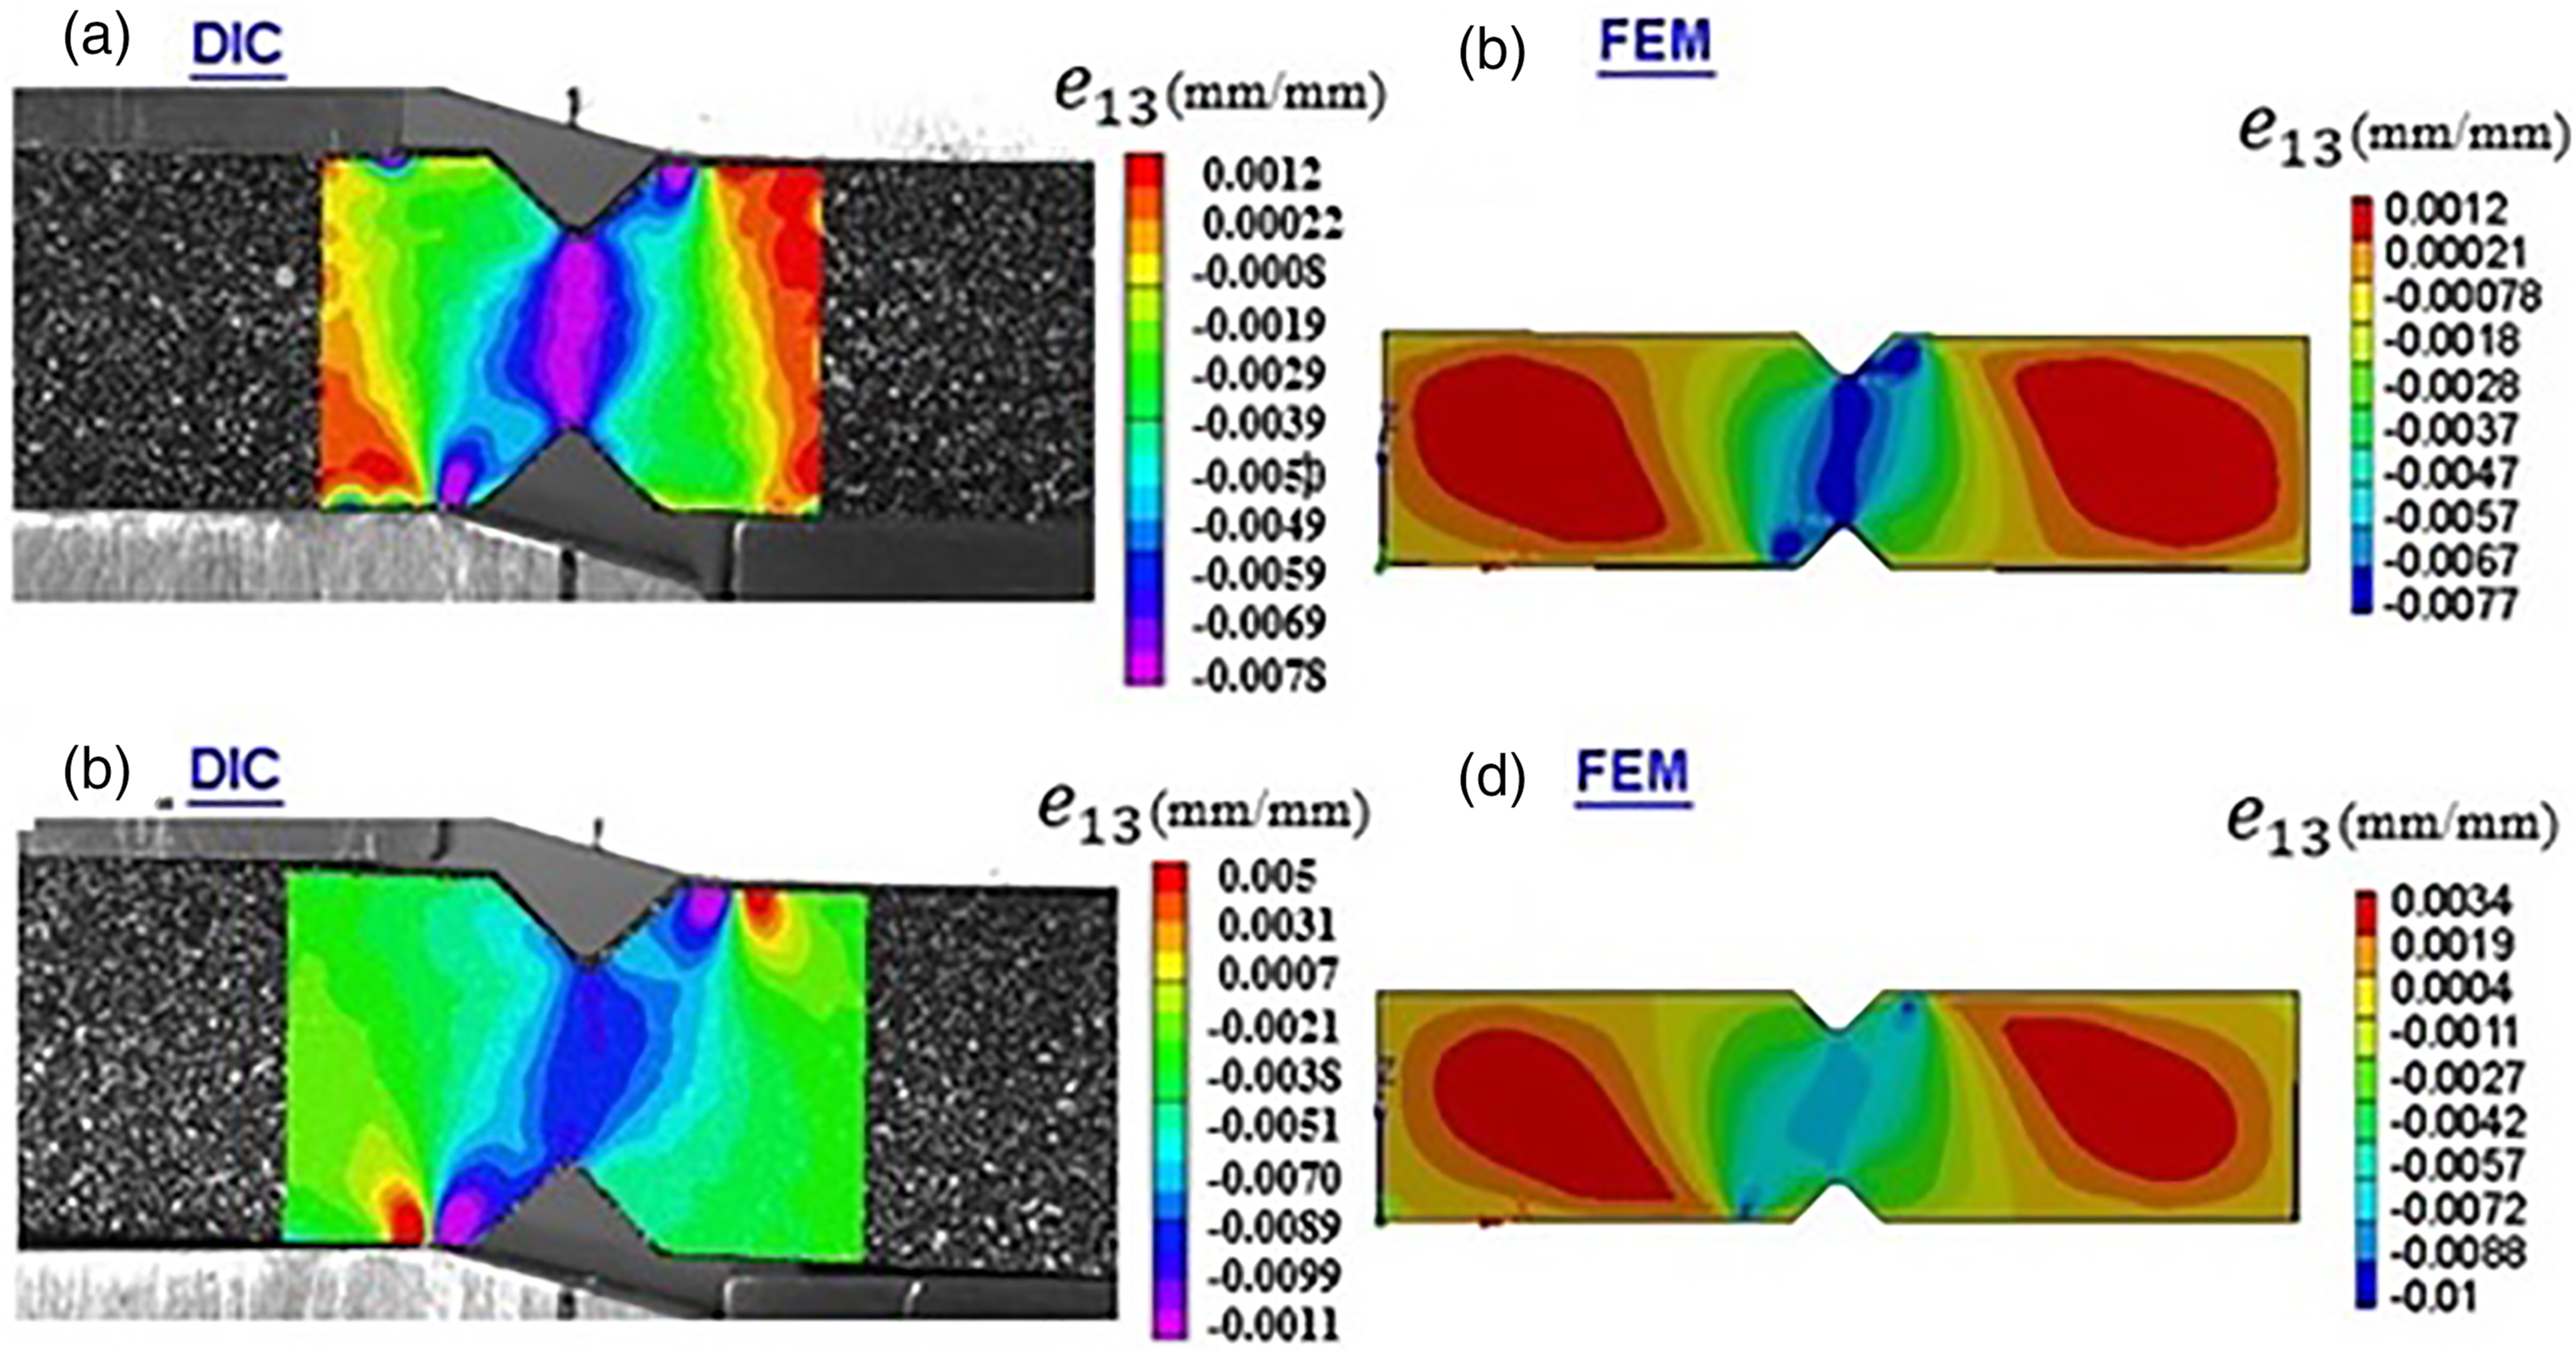
The effect of fibre orientations on DIC and FE calculated strain fields within the elastic regime are shown in Figures 19 and 20, showing that there is a good agreement between the strain fields determined by these two methods. Irrespective of shear modes and fibre orientations, strain concentrations around the connection with the clamps and at the central region between two notches are observed. The strain is less uniform along the line between the notches when fibre orientation changes from 0°/90° to ±45°. Effect of fibre orientation on the in-plane shear strain Effect of fibre orientation on inter-laminar shear strain 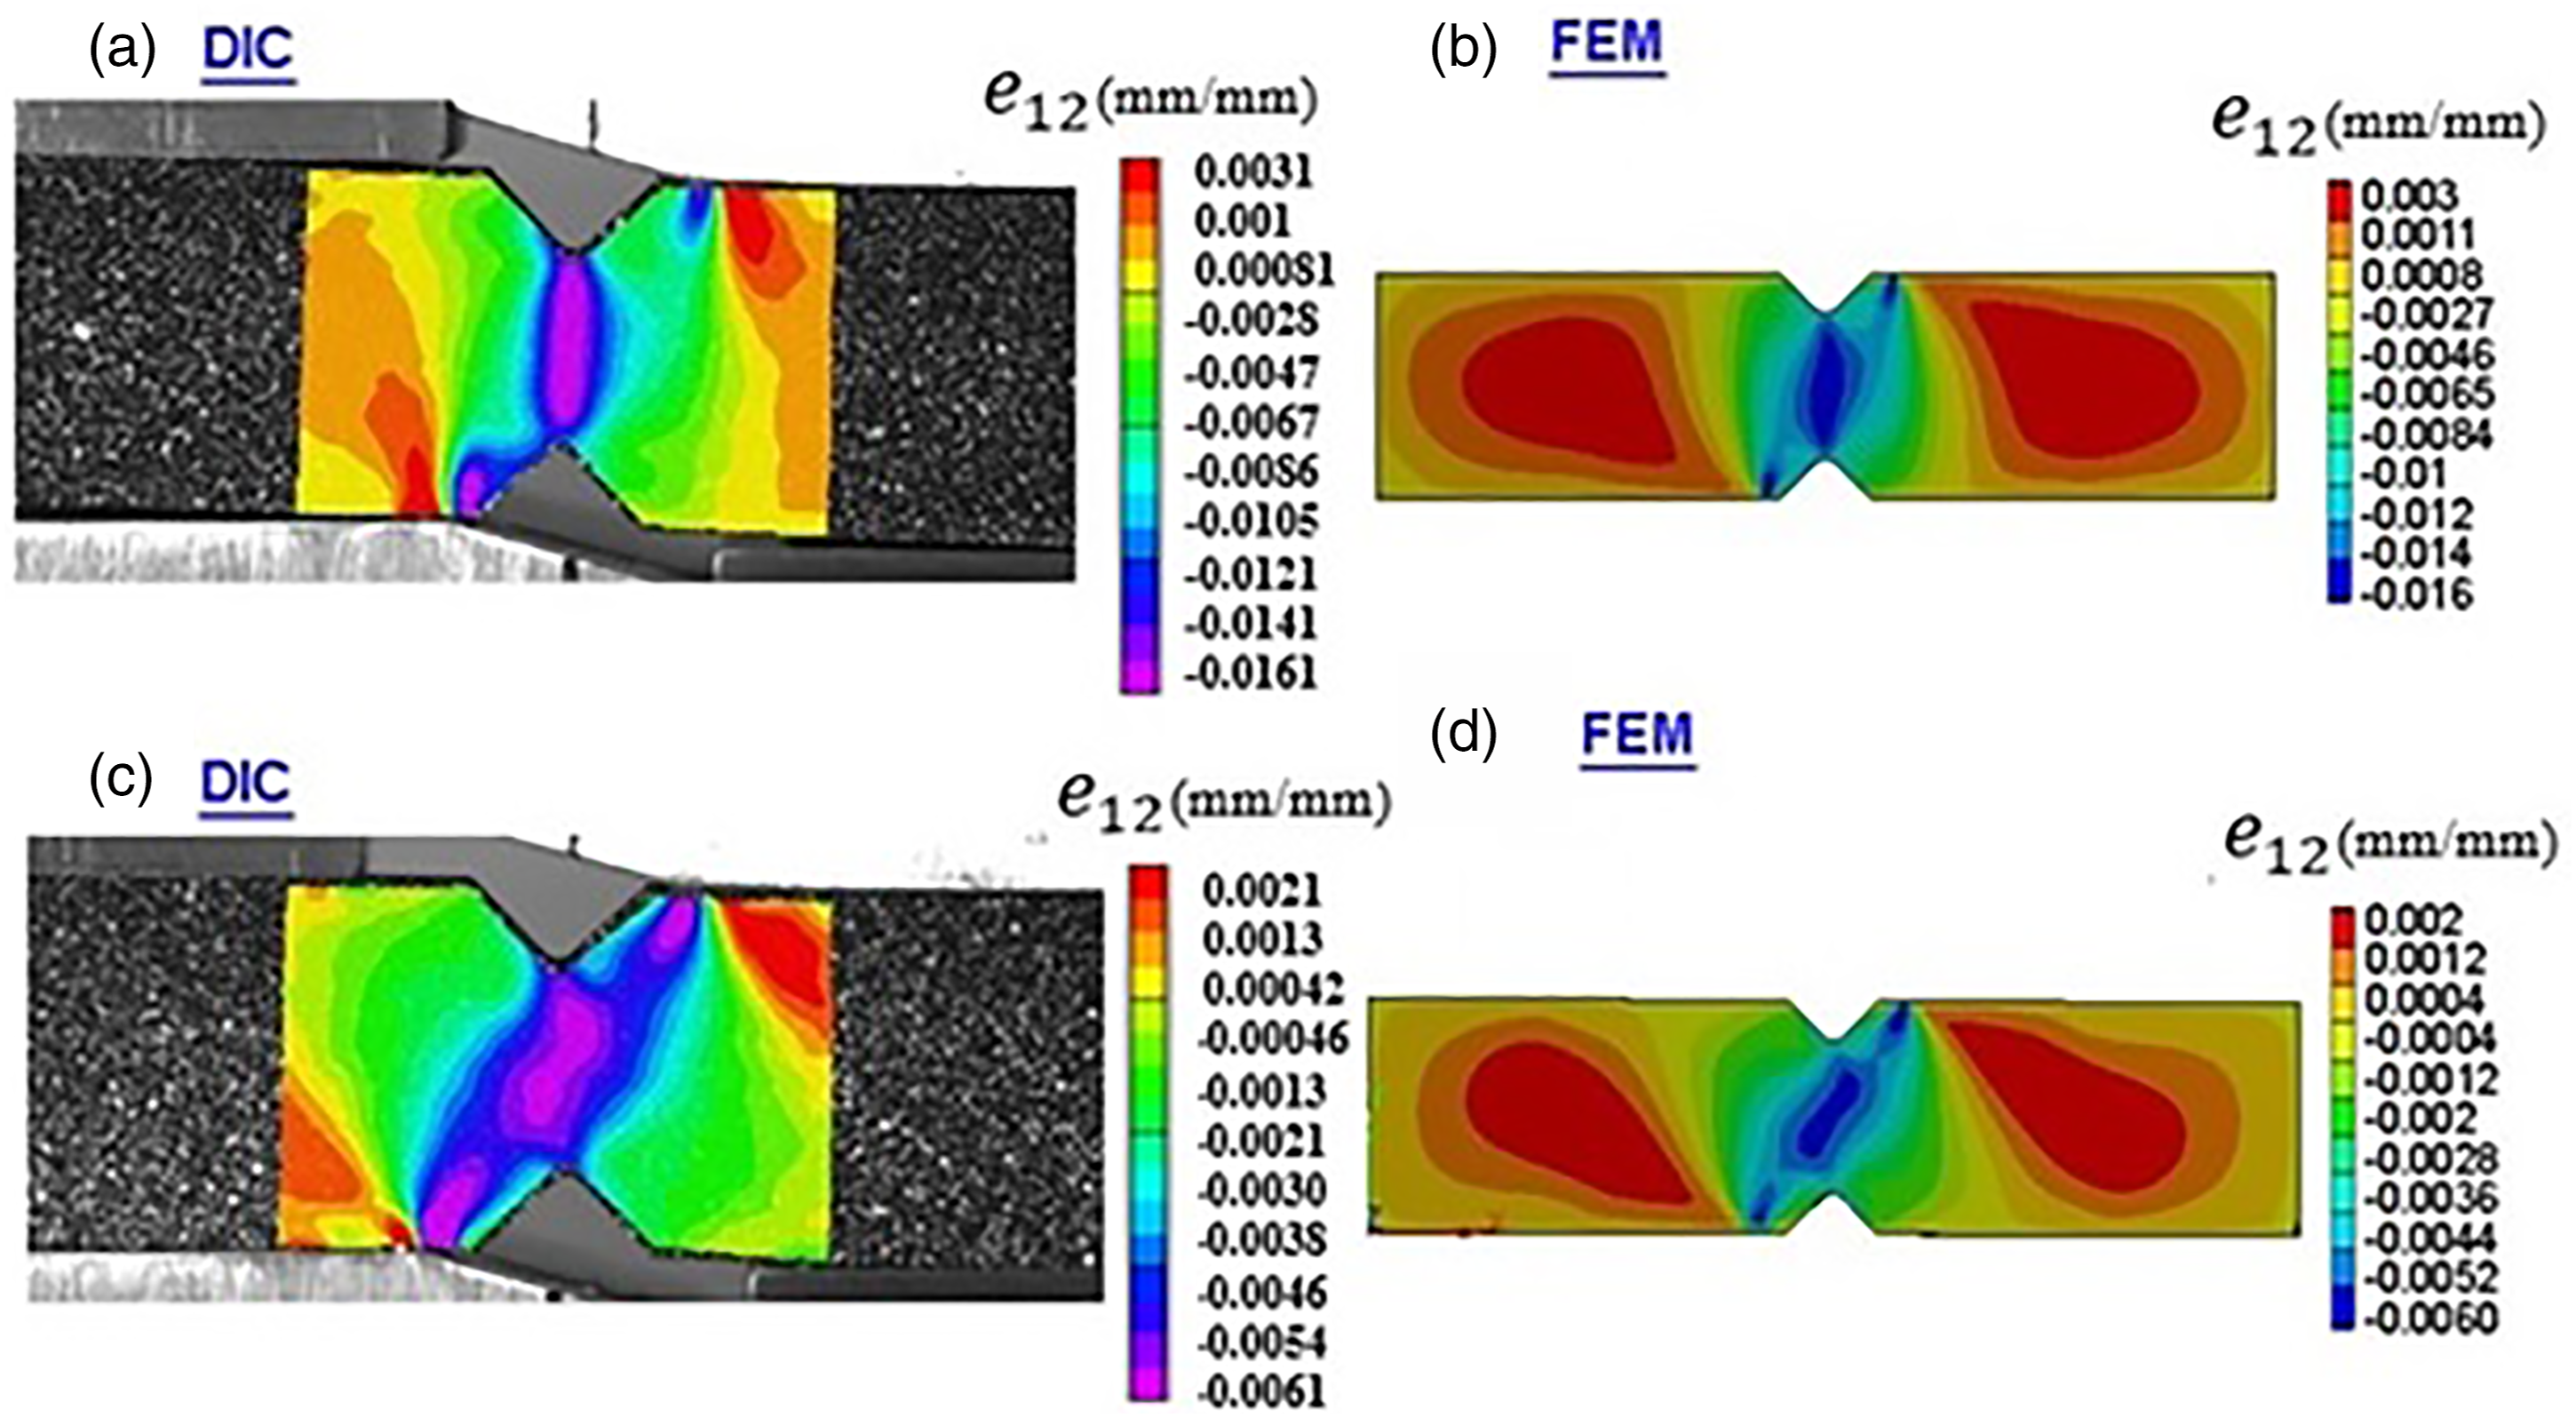
Shear strain distribution at break
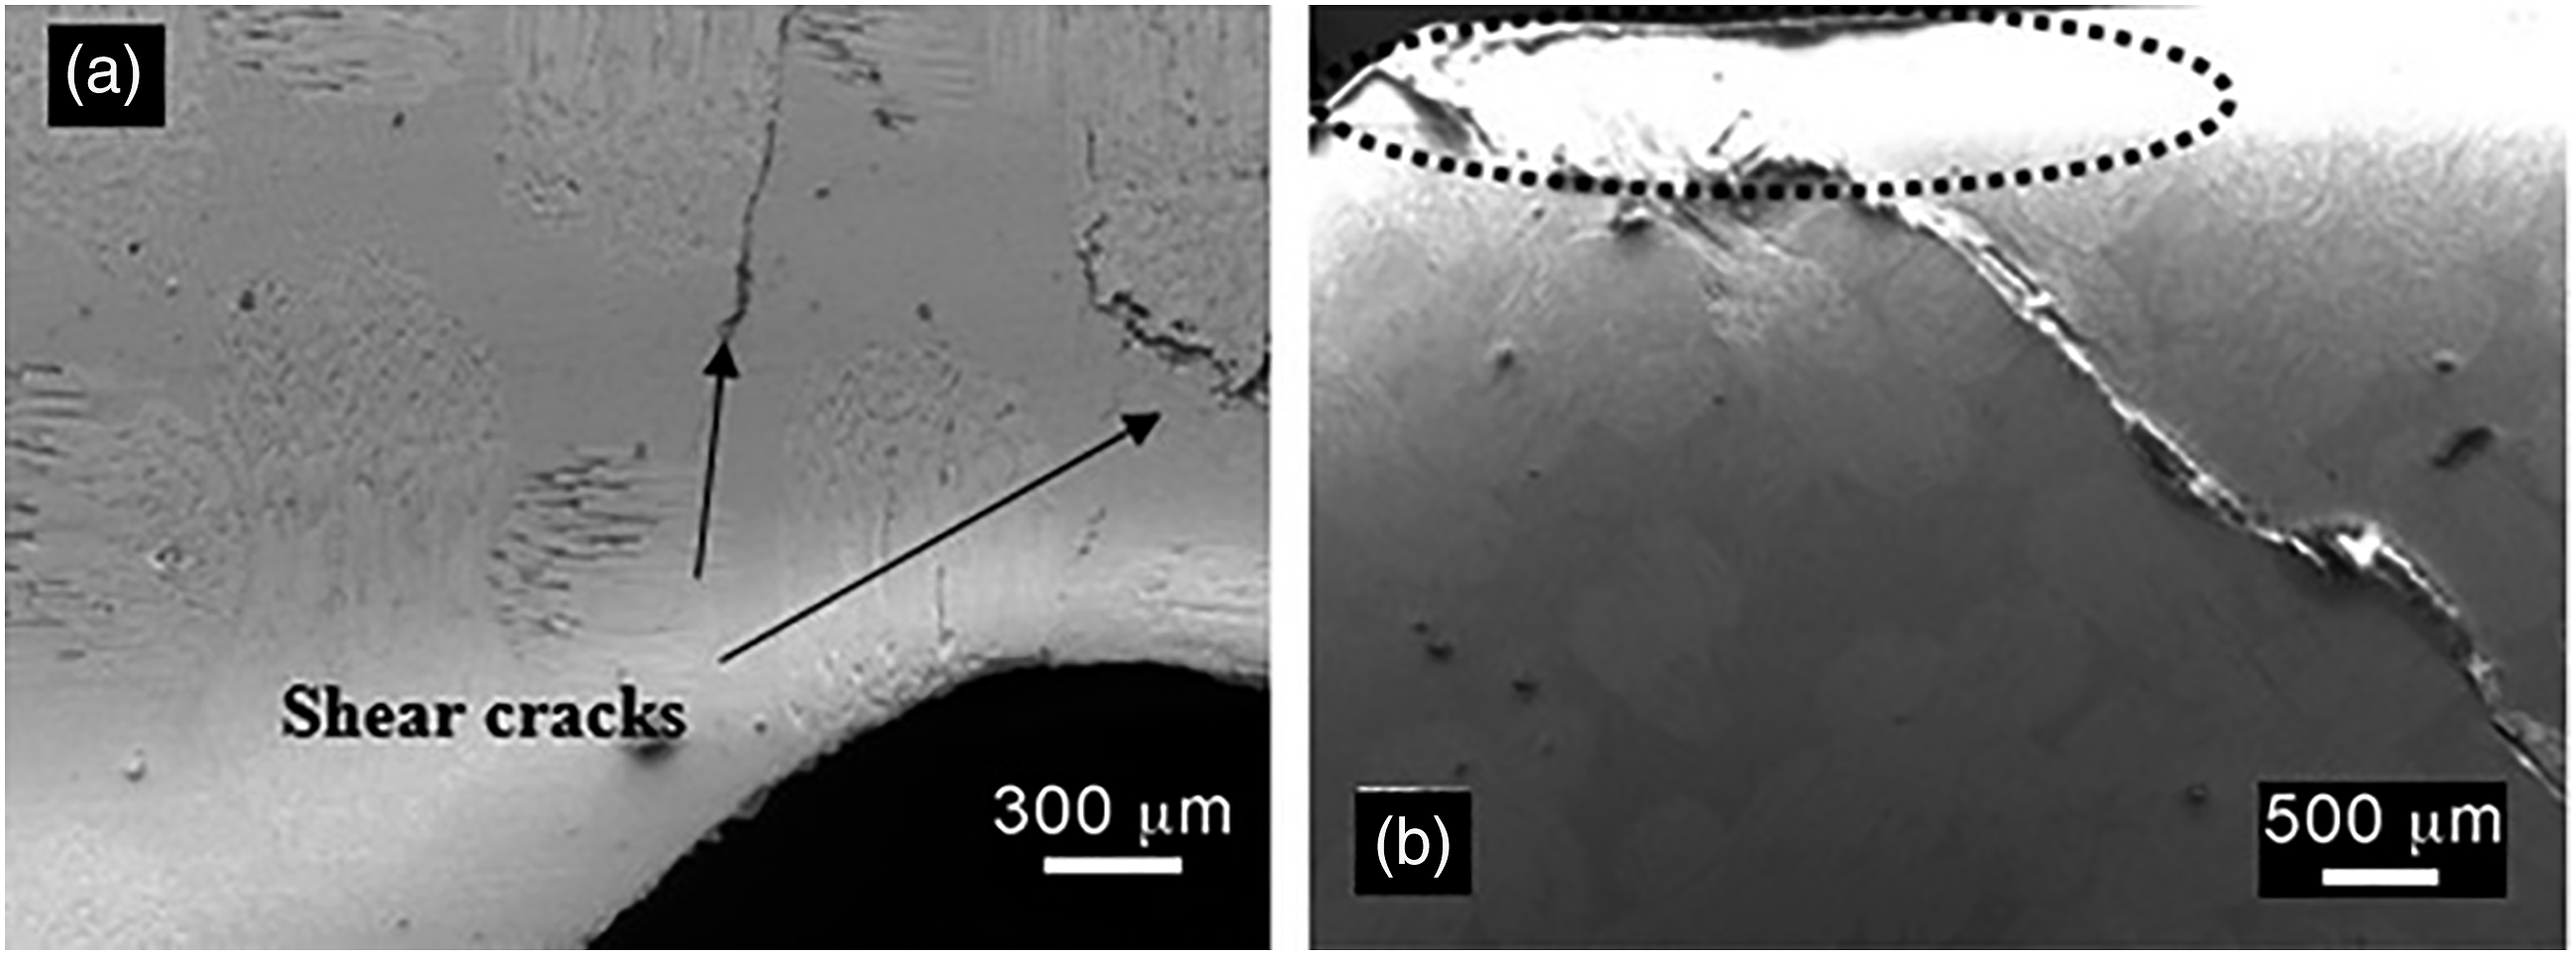
The DIC determined in-plane shear strain map at break is shown in Figure 21. For specimen with 0°/90° fibre orientation, the strain is localised along the line between the V-notches. When the fibre orientation changes to ±45°, the maximum strain associated with the deformation of the sample and strain localisation are observed near the angled section of the support. Based on the findings from other researchers ,5,22,40 a possible explanation for this behaviour is the higher shear strength and shear modulus (Table 6) of the sample with ±45° fibre orientation than that with 0°/90°. The specimen with 0°/90° fibre orientation failed due to pure shear stresses along the roots of the notches where shear cracks parallel to the fibre directions were observed. For specimen with ±45° off-axis angles, the failure was due to the crushing of the material at the inner loading points where shear cracks were propagated in −45° direction (Figures 21 and 22). Using DIC computed in-plane shear strain maps (Figure 21) and its corresponding shear stress-strain curves (Figure 18), it was found that the stress value corresponding to the ultimate load is the in-plane shear strength. In-plane shear strain distribution as measured by DIC at break. (a) 0°/90° fibre orientation, the dashed circle shows the positions of cracks, stress and strain values are 90 MPa and 0.04, respectively (b) ±45° fibre orientation, the dashed circle shows the positions of crushing and shear cracks propagated in −45°, stress and strain values are 138 MPa and 0.021, respectively. Scanning electron micrograph showing the effect of fibre orientation on the In-plane shear failure modes (a) in-plane shear cracks between notches, (b) Propagation of the in-plane shear cracks in −45° , the dashed circle shows the positions of crushing at the inner loading points.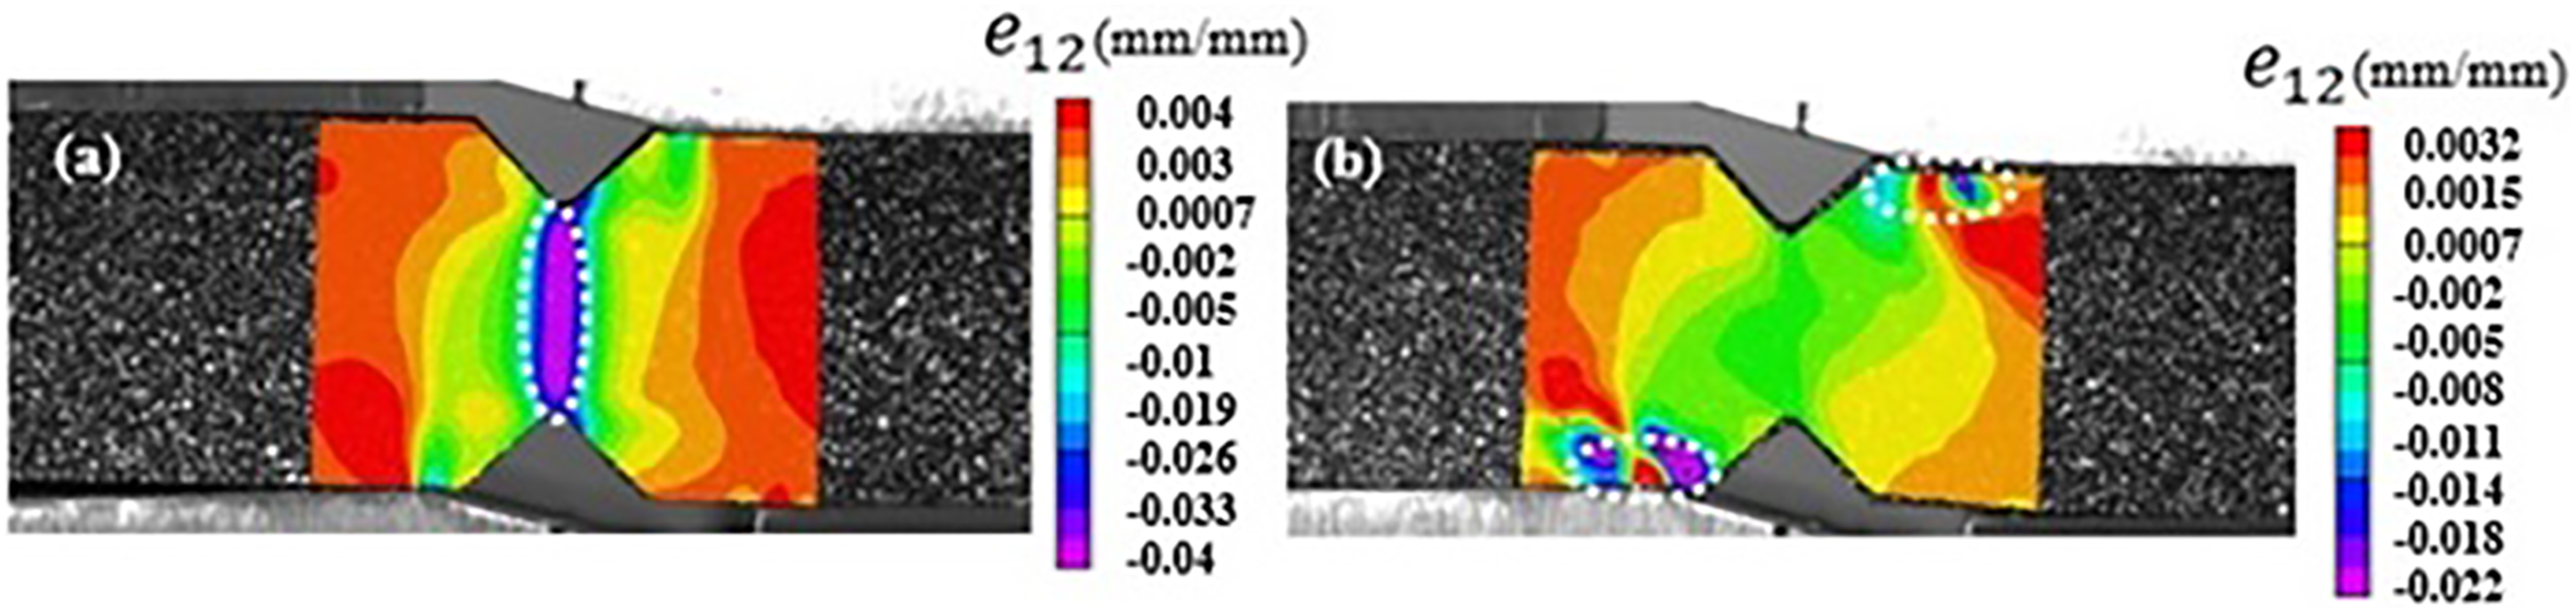
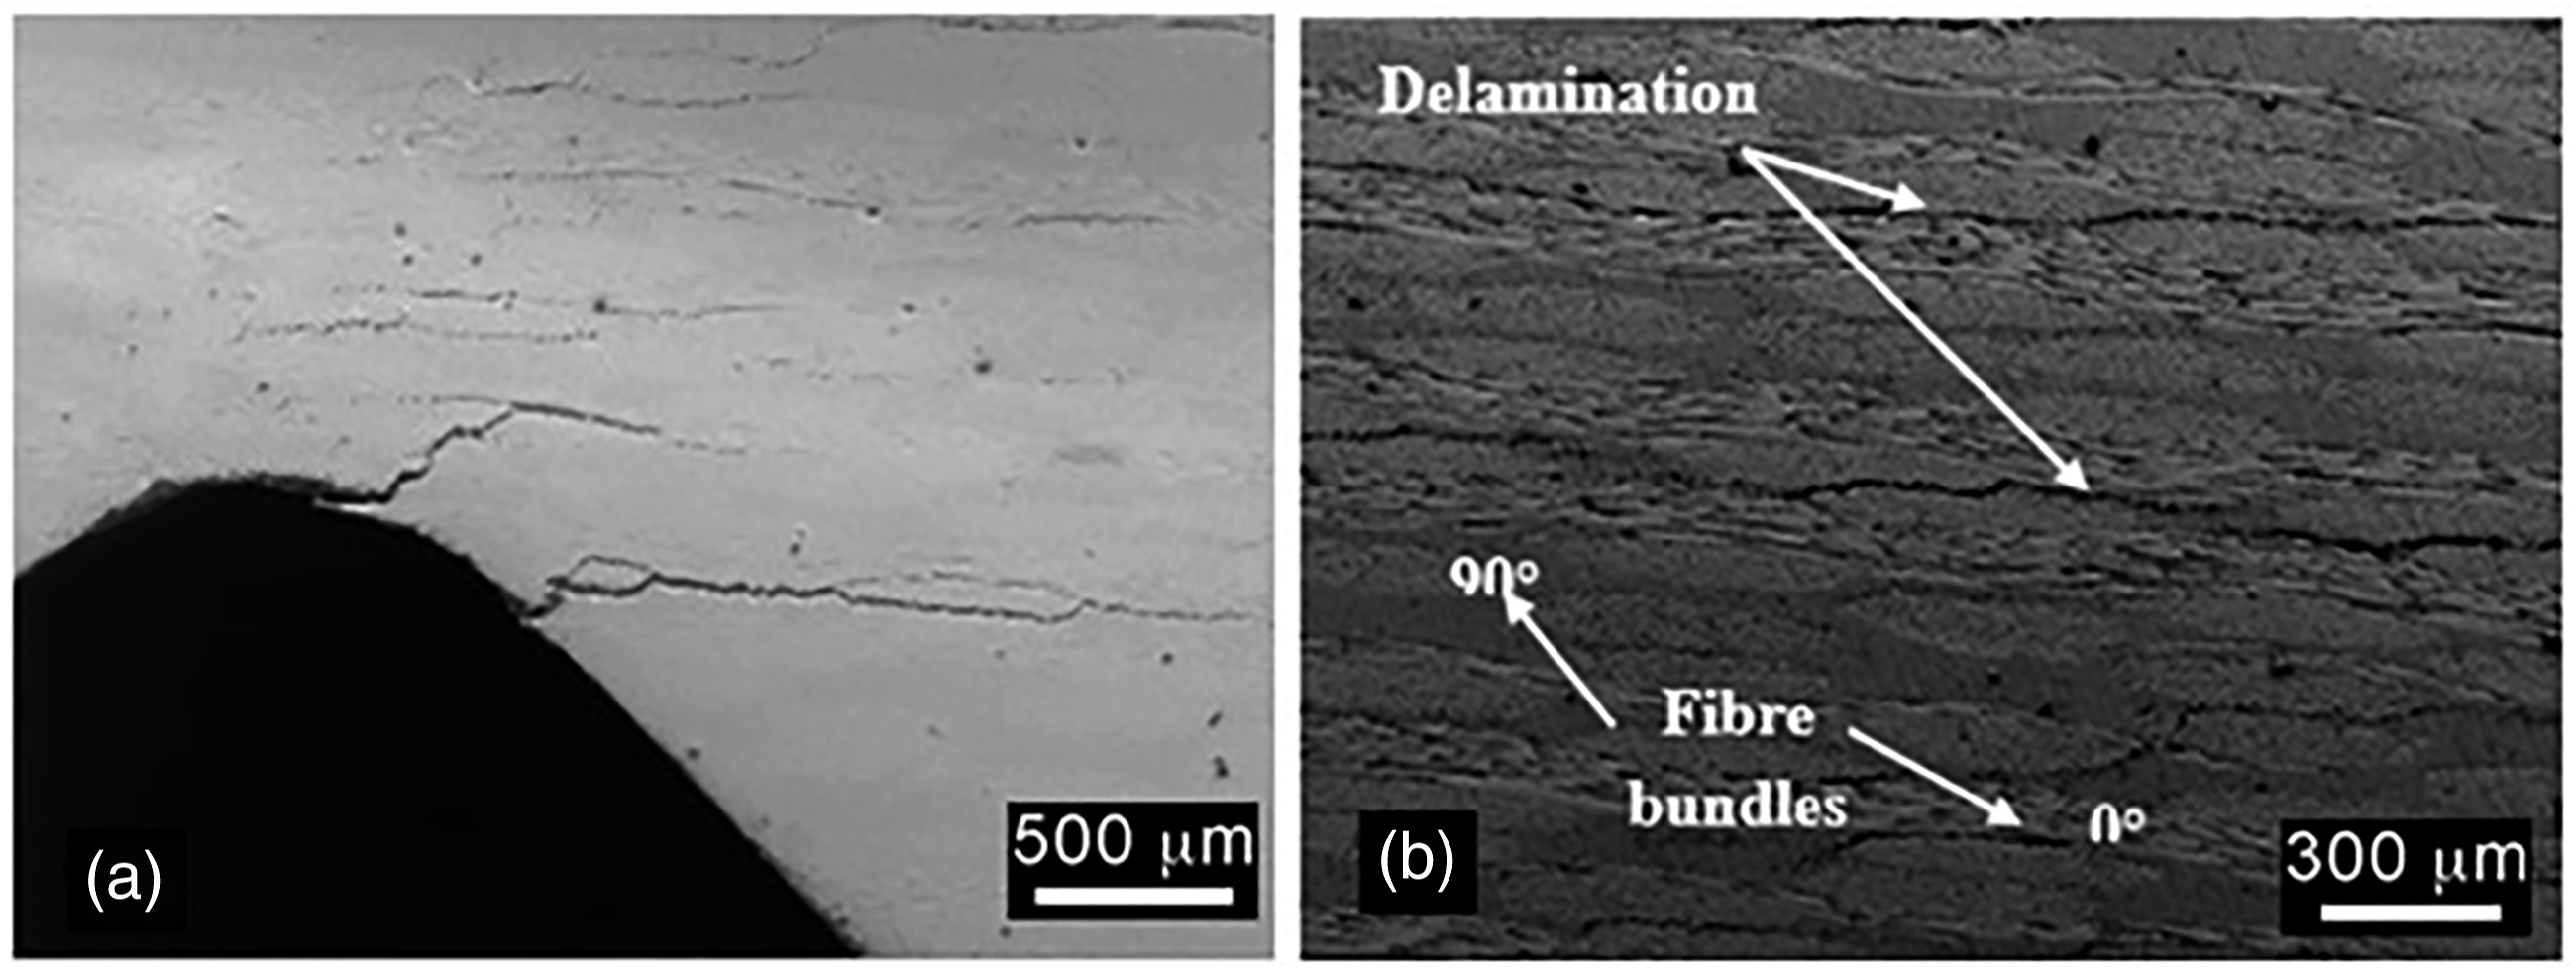
The DIC calculated inter-laminar shear strain distribution at break is shown in Figure 23. This shows that failure can occur in the notch tip area due to the stress concentrations caused by the geometry and material discontinuities at the free edges of the notches. When the fibre orientation changes from 0°/90° to ±45°, the strain is also localised between the notches. This might be due to the lower shear strength and modulus (Table 6) of the sample with ±45° fibre orientation compared to the other. Furthermore, due to the higher strain localisation near the notch root, fracture occurs (delamination is encircled in the Figures) at a lower strain compared to in-plane shear mode (Figure 24). In addition, from DIC computed inter-laminar shear strain fields (Figure 23) and the corresponding shear stress-strain curves (Figure 18), it can be seen that during the inter-laminar shear testing, delamination or inter-laminar shear cracking initiates at loads lower than the ultimate, therefore, uncertainty about which stress should be used as the measure of the material property should be addressed by considering the failure criterion. This criterion indicates that the ratio of the load (prior to the non-linear behaviour) to the cross-sectional area between the two notches is equal to inter-laminar shear strength
40
. Inter-laminar shear strain distribution as measured by DIC at break. (a) Sample with 0°/90° fibre orientation, the dashed circle shows the positions of delamination between two notches and near the root of both V-notches. Stress value is around 30 MPa (b) sample with ±45° fibre orientation, the dashed circle shows the positions of delamination near the root of both V-notches and at the middle between two notches. Stress value is 23 MPa. Scanning electron micrograph showing inter-laminar shear failure modes (a) delamination propagating from the root of notches in sample (0°/90°), (b) onset of delamination and orientation of fibre bundles at 0° and 90°.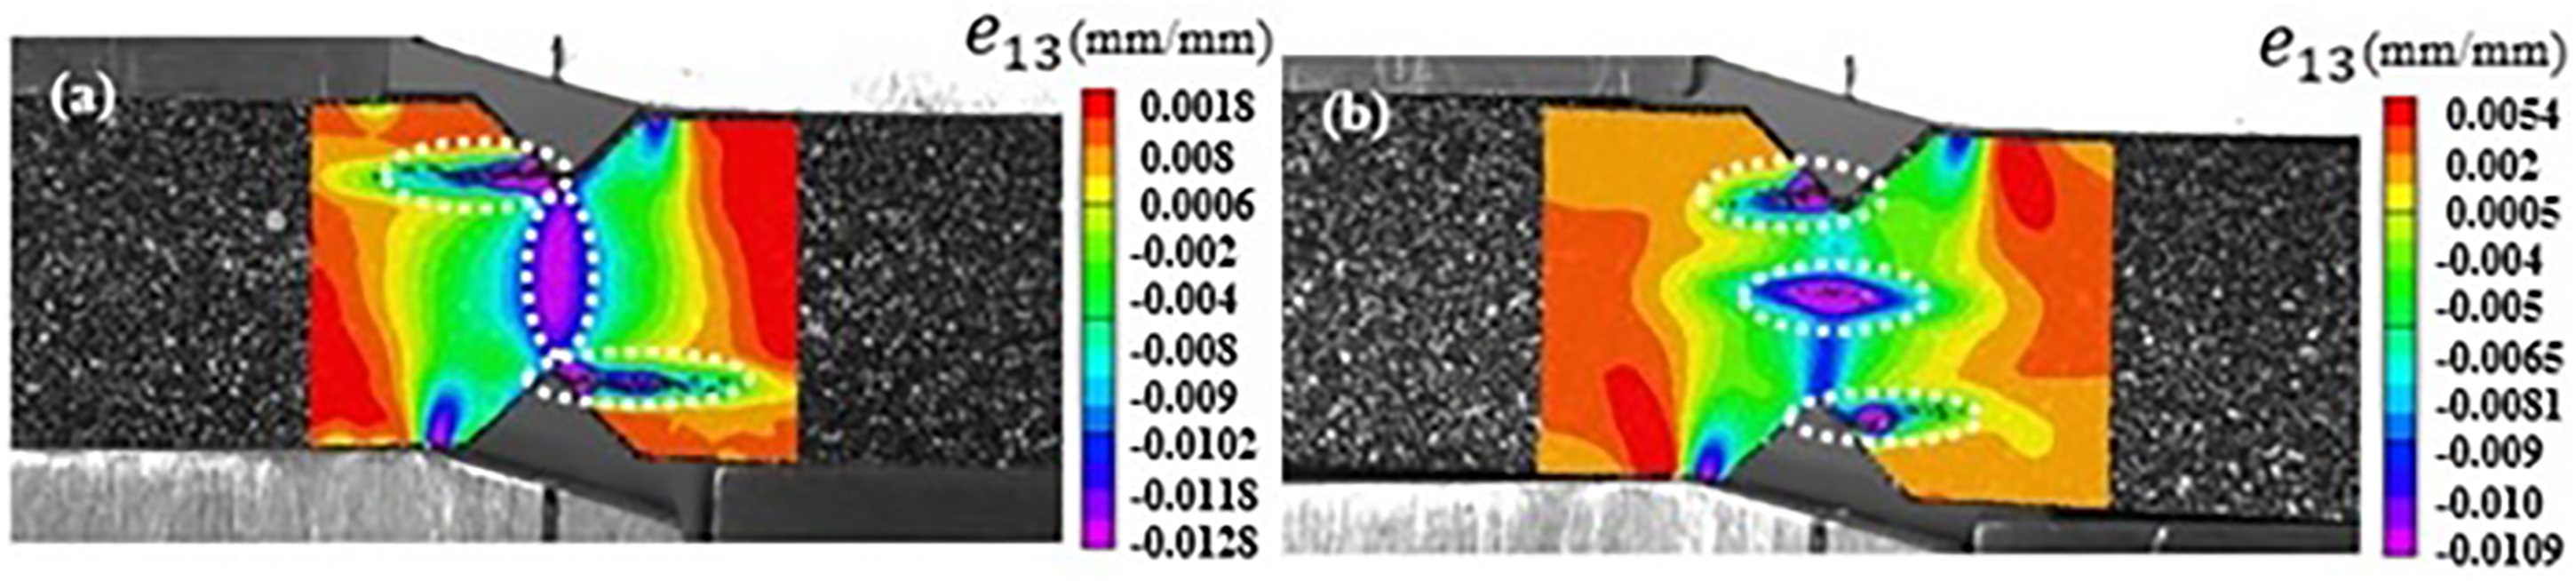
Short beam shear test
To further verify the accuracy of Iosipescu inter-laminar shear tests, a total of 5 short beam shear specimens were tested following the ASTM standard
56
and the shear stain data was compared with the inter-laminar V-notched beam test results. In a short beam shear test, a laminated composite specimen with a low span-to-thickness ratio (typically 4–5) is loaded in three-point bending configuration so that an inter-laminar shear failure occurs. As the maximum shear stress existing in the neutral plane is in the pure shear state, the shear stress-strain relations in the elastic regime can be constructed using the shear strain data extracting from the DIC measurements and the shear stress calculated from the closed-form approximation (see Supplementary information). Comparison between the short beam shear strain map and the V-notched beam shear strain map prior to the onset of delamination (at the same stress value) shows that similar and consistent results are obtained using these two methods of shear testing. The experimentally generated strain map obtained by DIC is also compared with the FE computed strain field to further verify the accuracy of the material properties (Figure 25). Typical inter-laminar shear strain distributions at the stress value around 30 MPa (a) DIC, (b) FEM. FEM.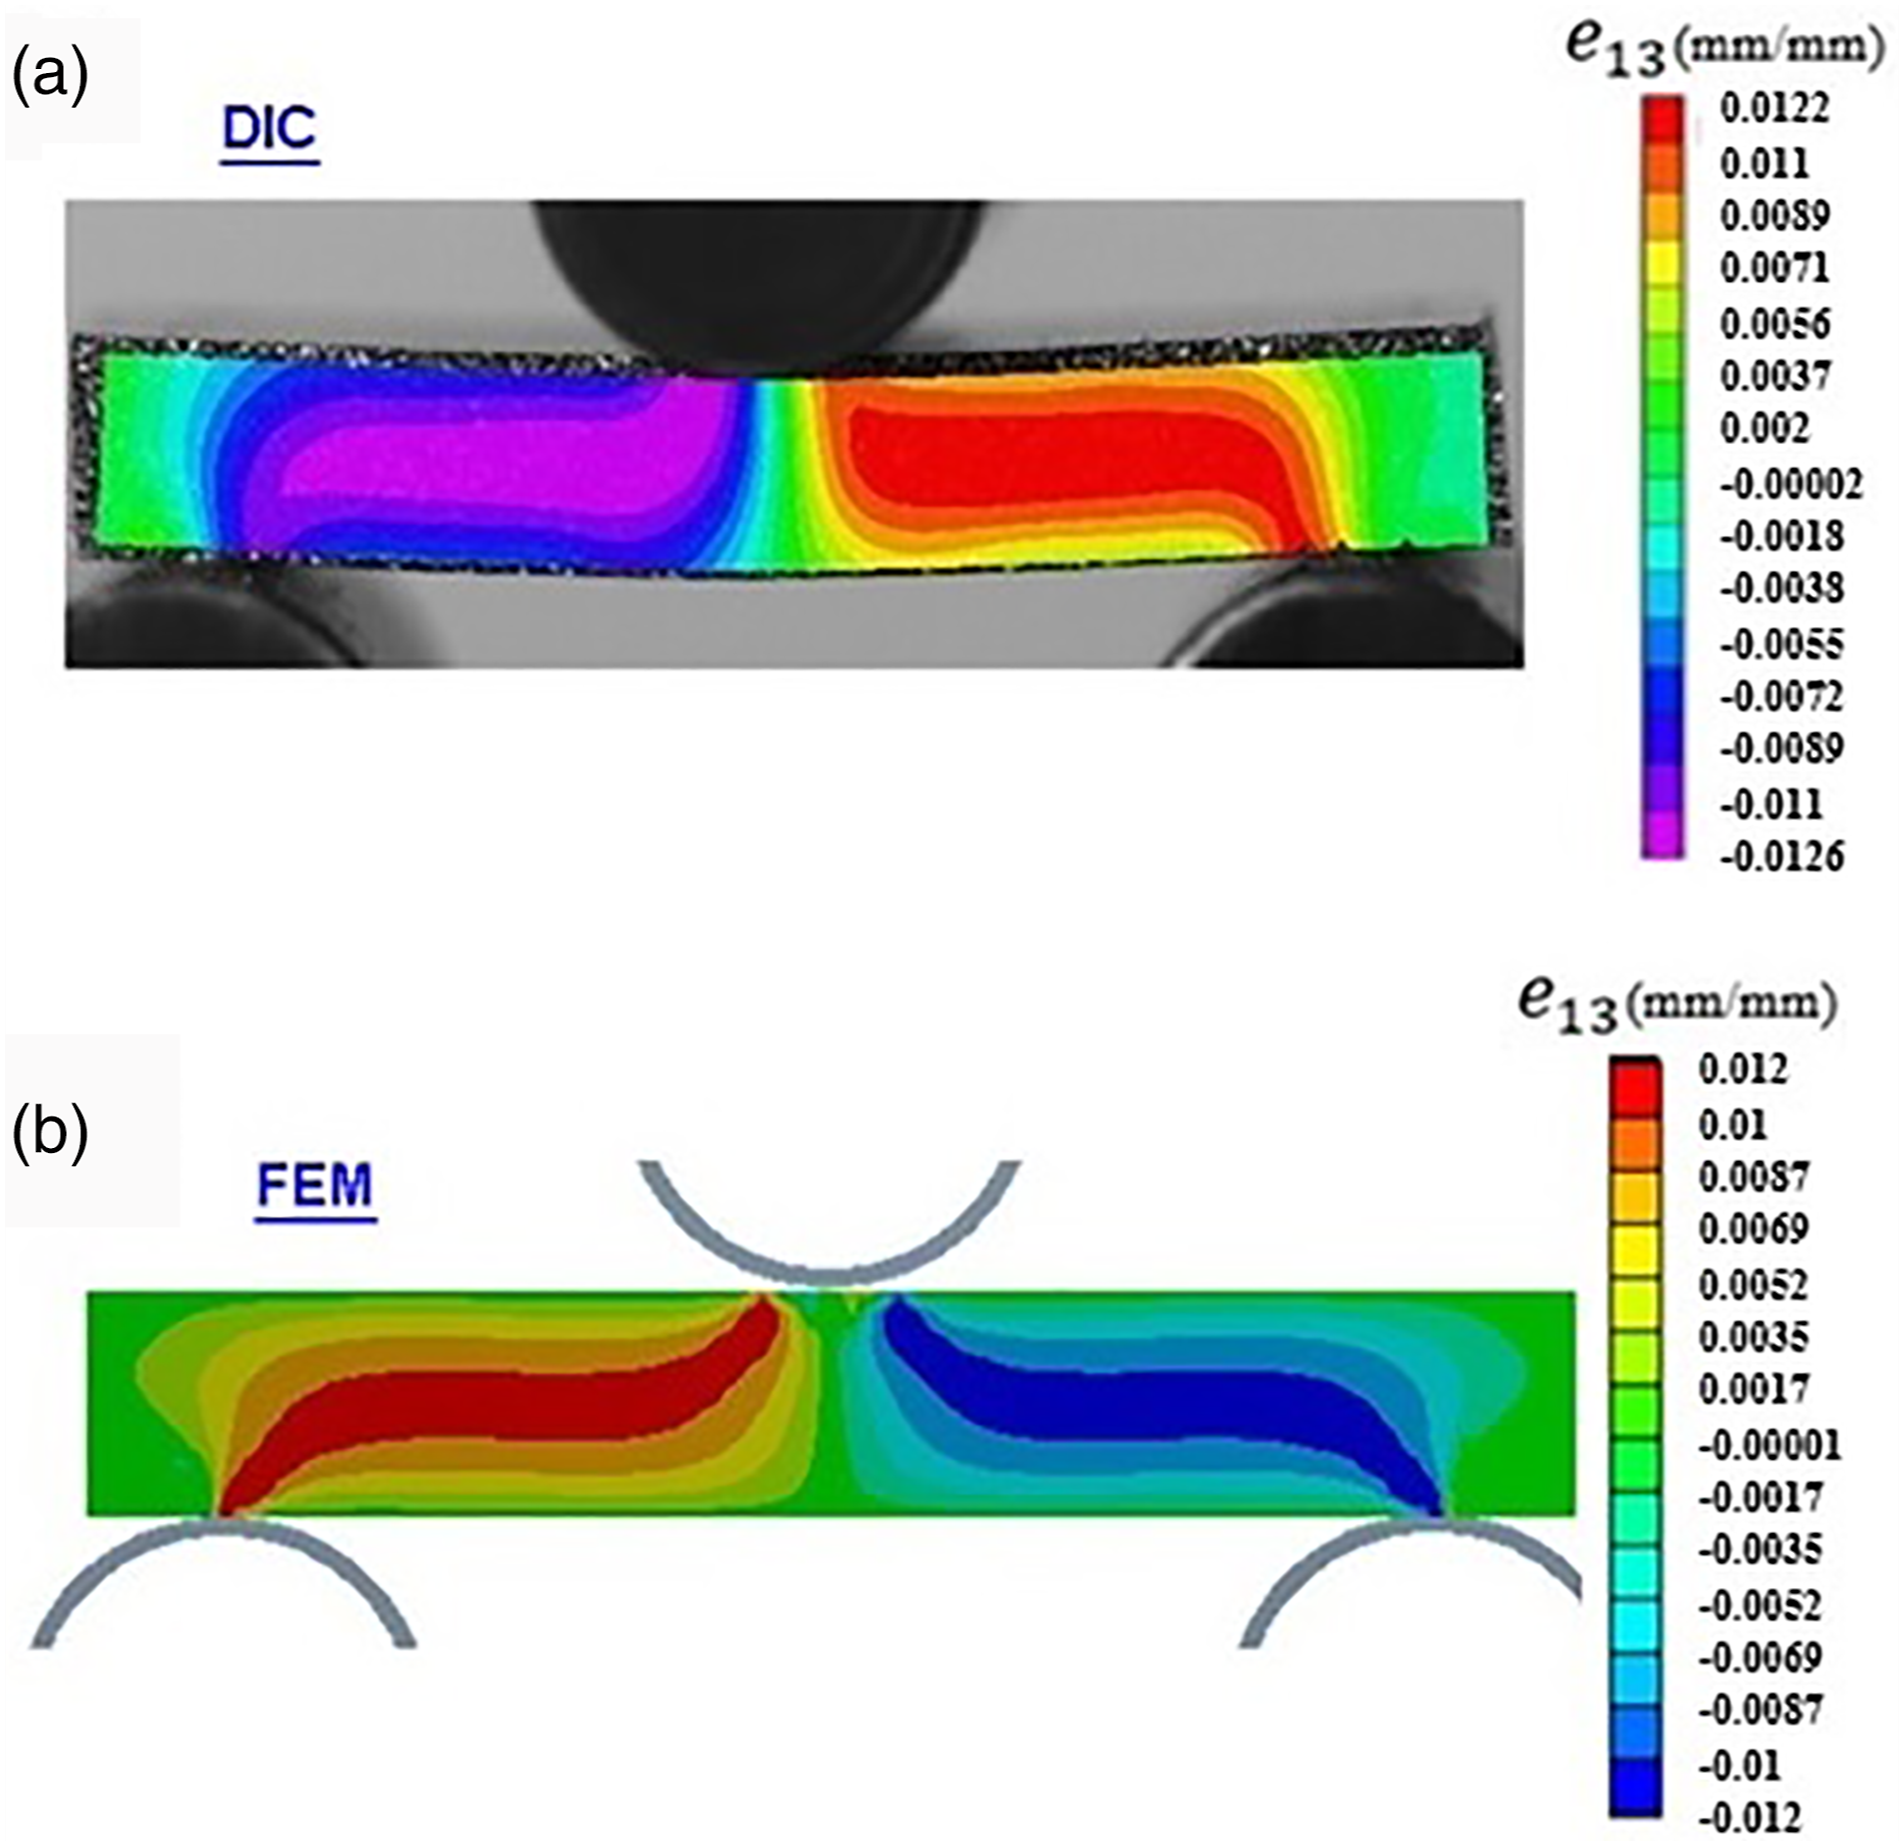
Conclusion
In order to investigate the structural integrity of woven GFRP composites and to examine the effect of ply orientation on the mechanical properties of these materials, numerical and experimental approaches are presented in this study. Graphical representations of strain fields provided by DIC or FE maps indicated that there is a strong relationship between the strain distribution and microstructure (i.e. ply orientation) which reveals the inhomogeneity of composite materials upon deformation. In particular, the higher level of localised tensile strains than the global strain is strong evidence that the heterogeneous mechanical behaviour of these materials is due to their heterogeneous microstructure. The results of this study show that, providing an accurate characterisation of the properties is fed into a macro-scale model of mechanical test specimens, the use of finite element analysis is a reliable tool to predict the effect of ply orientation on the elastic response of laminated composites.
In terms of shear testing of composites in conjunction with DIC, it was found that, although, the failure of in-plane shear test specimens with 0°/90° fibre orientation is due to shear stress in the region between the two V-notches where in-plane shear cracks initiate. However, due to the presence of the ±45° fibres preventing the development of pure shear state, the in-plane shear specimen with ±45° fibre orientation experiences crushing at the inner loading points at much higher load compared to the sample with 0°/90° fibre orientation. The higher in-plane shear strength for specimen with 45° off-axis angle compared to 0°/90°, shows the scope for the improvement in the performance of composite structures by optimising the stacking sequences of layers with respect to the external loading (e.g. the use of composite with different ply orientation in the leading/trailing edge panels, shear webs and spar box structures of wind and tidal turbine blades).
Finally, in this study, it was shown that DIC detected inter-laminar shear cracks can be used to suggest a failure criterion based on the maximum load just prior to the non-linear behaviour in the load-displacement curve in order to address the challenges in accurately measuring inter-laminar shear strength of composite materials.
Supplemental Material
sj-pdf-1-jcm-10.1177_00219983211054232 – Supplemental Material for Investigation of anisotropy effects in glass fibre reinforced polymer composites on tensile and shear properties using full field strain measurement and finite element multi-scale techniques
Supplemental Material, sj-pdf-1-jcm-10.1177_00219983211054232 for Investigation of anisotropy effects in glass fibre reinforced polymer composites on tensile and shear properties using full field strain measurement and finite element multi-scale techniques by Hassan Gonabadi, Adrian Oila, Arti Yadav and Steve Bull in Journal of Composite Materials
Footnotes
Acknowledgements
We thank colleagues in these projects who provided useful insight and expertise that greatly assisted this research.
Declaration of conflicting interests
The author(s) declared no potential conflicts of interest with respect to the research, authorship and/or publication of this article.
Funding
The author(s) disclosed receipt of the following financial support for the research, authorship and/or publication of this article: This work was funded by EPSRC through the ReC-ASM project (EP/K013319/1) as well as NECEM project (EP/R021503/1).
Data availability
The datasets generated during and/or analysed during the current study are available from the corresponding author on reasonable request.
Supplementary Material
Supplementary Material for this article is available online.
References
Supplementary Material
Please find the following supplemental material available below.
For Open Access articles published under a Creative Commons License, all supplemental material carries the same license as the article it is associated with.
For non-Open Access articles published, all supplemental material carries a non-exclusive license, and permission requests for re-use of supplemental material or any part of supplemental material shall be sent directly to the copyright owner as specified in the copyright notice associated with the article.