
Abstract
Objectives
The aim of the study was to model the feeding and elimination behaviours of healthy domestic cats using data from connected devices. It was hypothesised that these behaviours would follow a regular circadian pattern.
Methods
Smart feeders and connected litter boxes recording interactions (date, time, duration, quantity of faeces and urine produced, and kibble intake) were used. Data collected were processed using a Python script performing a Fourier transform to extract frequencies related to the studied behaviours and model them using sinusoidal functions. Behavioural variability was assessed by daily variation of mean (±SD) pairs of daily data and by evolution of measurements over the observation period, with 5-day moving averages.
Results
Reconstructed signals from the obtained frequencies showed a pattern similar to the observed behaviours. The construction of patterns based on behaviour measurements demonstrated feeding and litter box use habits among all cats. The analysis of the variability indicated low variation over the observation period.
Conclusions and relevance
Modelling eating and elimination behaviours of healthy cats based on signals from connected devices was possible. Establishing such baseline behavioural profiles might help improve the detection of health and wellbeing issues in cats.
Keywords
Introduction
Early detection of health issues can significantly improve an animal’s health and wellbeing through timely intervention. 1 However, cats innately display minimal signs of illness, 2 and various methods have been proposed to enhance early disease detection, including blood tests and annual veterinary check-ups,1,3 –5 although these methods may have some limitations and constraints.
At the same time, domestic cats are known for their routine-oriented nature, particularly in enclosed environments, such as a typical urban household. 6 Many feline diseases affect appetite and elimination behaviour, including chronic kidney disease, diabetes, hyperthyroidism and urinary tract infections. 3 Therefore, timely detection of subtle behavioural changes could be of great value to improve the early detection of health problems in cats.
The recent development of connected devices, such as accelerometers, smart feeders and connected litter boxes, enables the collection of data on feline behaviour, including space usage, 7 feeding behaviour6,8,9 and overall behaviour description.10 –13 However, these studies have primarily focused on describing or recognising observed behaviours rather than modelling them.
Nevertheless, establishing a baseline behavioural profile for healthy cats would be a prerequisite to measure deviations from a cat’s typical behaviour.
This study aimed to assess if a circadian behavioural profile could be established in clinically healthy indoor cats by using connected devices.
Materials and methods
Connected devices
In this study, a smart feeder (Catspad; Catspad) and a connected litter box (Caremitou; Novandsat SAS) were used.
Catspad (Figure 1) dispenses kibble (either ad libitum or on a scheduled basis in minimum increments of 5 g), weighs the amount of kibble consumed to within 1 g and records the times at which the animal feeds thanks to a tag attached to the cat’s collar. The tag acts as a radio frequency identification chip: when it is in a 1-m range around the device, Catspad dispenses kibble (if ad libitum distributions) and records the times and kibble consumption. The Catspad device uses Wi-Fi to send data to the server.

Expanded and isometric views of the Catspad
Caremitou (Figure 2) measures the cat’s weight and the mass of excrement (urine and faeces combined) after each visit, along with the times and duration of each visit. A change in weight triggers recording. The scale tares automatically every 5 mins and after each cat visit.
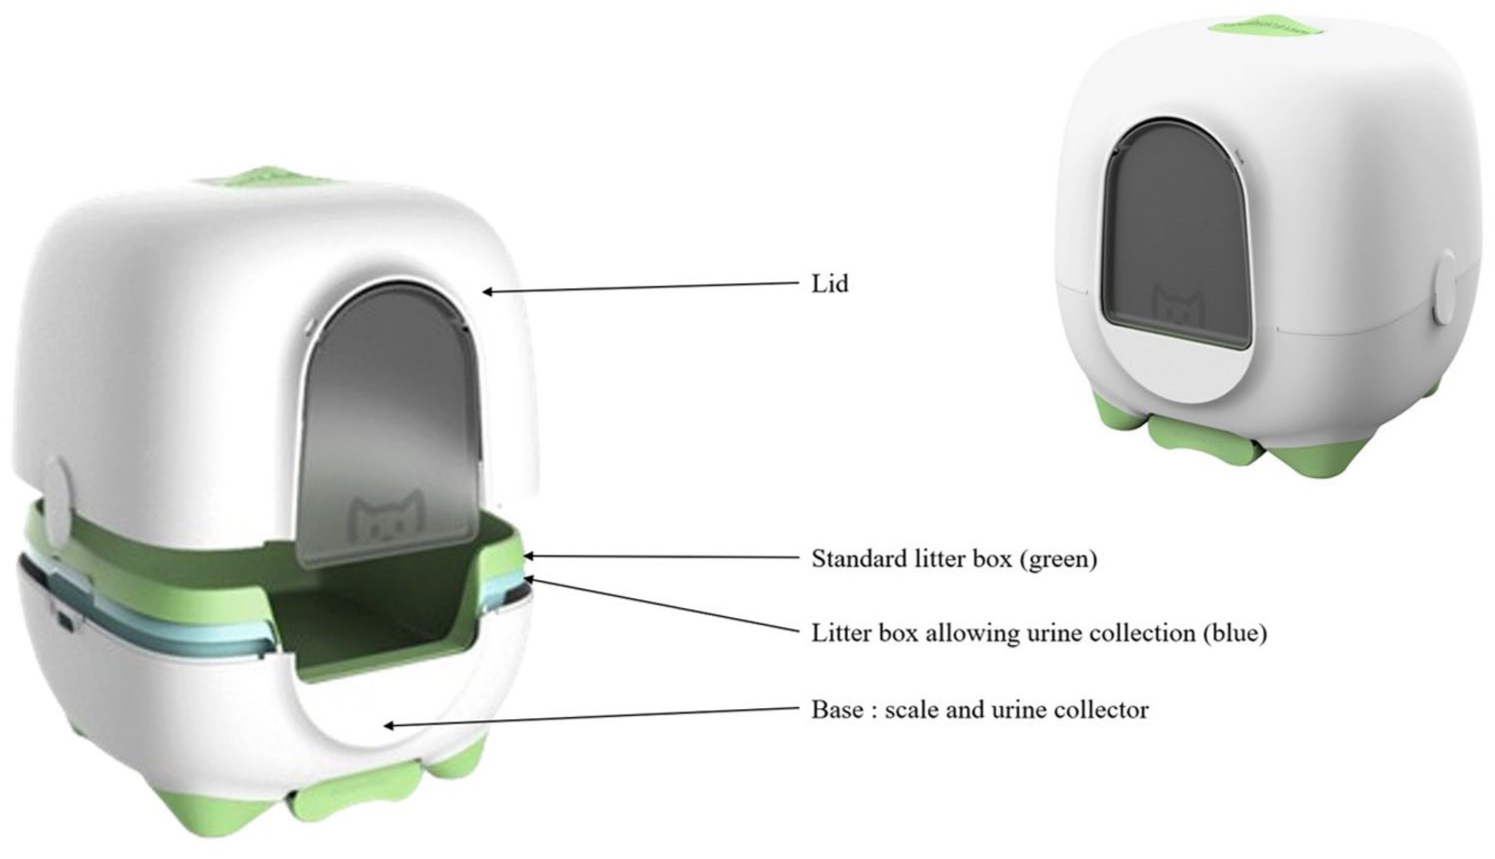
Expanded and isometric views of the Caremitou
Cats
Cats owned by veterinary students were selected for inclusion. The cats had to be aged 1–10 years, be clinically healthy, be kept strictly or mostly indoors, be fed exclusively or mostly kibble, tolerate a collar and be the only cat in the household. The owners had to have Wi-Fi access to ensure reliable communication with the connected devices and own a smartphone to set up the devices.
Study design
Recruitment began with a call on the local veterinary student community in the form of a generic email mentioning the option to volunteer.
Once students responded, the first meeting was organised to confirm that both the owner and the cat met the inclusion criteria. The cat’s health was assessed by a veterinarian at the Toulouse National Veterinary School. If the criteria were not met, the cat was not included. Otherwise, the owner received a Catspad and a Caremitou device and an inclusion note was completed. The inclusion note recapped the information relating to both the owner, the cat and its environment: place of feeder and litter box, number of rooms and access to rooms. The owners were also given a logbook to record any environmental changes or device maintenance.
Data collection began immediately after the installation of the devices in the owners’ homes, with a 14-day acclimation period. The 14-day period was considered necessary to ensure cat acclimation. If any significant acclimation problem occurred during this period, the first 14 days of data were excluded from the analysis and a new 14-day period was allowed to facilitate the acclimation. If the cat acclimated, the data collection continued. Once included, a cat could be excluded if it failed to fulfil one or more inclusion criteria (be clinically healthy, be kept strictly or mostly indoors, be fed exclusively or mostly kibble, tolerate a collar and be the only cat in the household) or if it did not acclimate after two 14-day periods of acclimatisation. A good acclimatisation leads to correct use of both connected devices and no noticeable behavioural modification (eg, waiting for food distribution).
A second meeting was planned within 3 days after the end of the acclimation period to check the proper use of both devices, use of the logbook and data already collected. If no problem was identified, data collection started for an initial period of 60 days.
Any changes in the cat’s environment or any absence of the cat was recorded in the logbook by the owners, which was collected after the data collection period.
Within 7 days after end of the data collection period, a third visit was planned to retrieve both devices and the owner logbook.
The study design is represented in Figure 3.

Study design, recruitment and inclusion/exclusion flowchart
Statistical analysis
After collection, data were first manually filtered to remove measurements identified as unreliable (eg, inappropriate owner interventions or periods of environmental disturbance). Variations in the owner’s schedule, such as vacation, internship or travel, justified data exclusion (data collected during weekends was not removed if the owner was still with the cat). Any variation in the environment (eg, friends, other animals) justified the removal of associated data.
Data analysis was performed using Python (version 25.1.1) and the following libraries: NumPy (version 1.24.1), Matplotlib (version 3.6.3), SciPy (version 1.10.1), Pandas (version 2.2.3), SymPy (version 1.12), MpMath (version 1.3.0) and Statsmodels (version 0.14.4).
Each day was divided into six 4-h periods (time intervals) and the average kibble consumption per period was calculated and denoted as µp. This time interval was chosen after testing several alternatives (1, 2, 3, 4, 6, 8 and 12 h), as it allowed visualisation of potential variations throughout the day while minimising boundary effects associated with discrete time scales. For example, two consumption events occurring at 5:58 am and 6:02 am would fall into different periods using shorter intervals, but were grouped within the same period using the 4-h interval. This approach facilitated clearer and more consistent visualisation of patterns. Average daily consumption was also calculated and denoted as µd. The difference between the average consumption per period and the average daily consumption (µp–µd) was calculated for each period and each cat and denoted as Δpd. The average of all Δpd values for each period across the entire study was calculated and denoted as Δp. These Δp values described an individual behaviour pattern, referred to as individual mean daily profile (IMDP). The existence of a non-constant IMDP suggests a regular cyclic behaviour pattern.
The same analysis was then performed on the Δpd values from five consecutive days. The resulting Δp values illustrated the evolution of feeding behaviour over the study period and are referred as individual mean over 5 days profile (IM5DP). Analysing data over 5 consecutive days minimises the impact of potential variations in the owners’ schedules. If the IM5DP were similar, it would indicate a consistent behaviour pattern during the study.
The behavioural variability was assessed by calculating the daily mean (±SD) of the Δpd values and by graphically representing the evolution of IM5DP.
A Fourier transform was applied to the Δpd values to identify the dominant frequencies related to feeding and elimination behaviours. The selected frequencies were then used to construct a sinusoidal model representing the behaviours.
Because of the significantly lower frequency of eliminative behaviours and the device’s reduced reliability in recording excrement weight, IMDP and IM5DP for the elimination behaviour were calculated based on the number of visits rather than the weight of the deposits left after each visit.
Results
Cats
Recruitment
Of 14 applications, 10 domestic shorthair cats (seven castrated males and three spayed females, aged 1–5 years), owned by veterinary students were included (Table 1). The four remaining cats did not fulfil the inclusion criteria because of the owner’s timetable (unavailable for meetings) or identified compliance issues (could not maintain the device).
Cats included in the study

Dates are given in a DD/MM/YYYY format
Acceptance
One cat proved unable to use the Catspad device despite a second acclimation period. Consequently, it was excluded from the study, resulting in a final sample size of nine cats, which completed the protocol.
These acclimated quickly, using both devices appropriately within 72 h of installation.
Deviations
The owners of 6/9 cats chose to use the scheduling function of the smart feeder. They were consequently instructed to programme meals to be evenly distributed throughout the day.
Therefore, an additional analysis evaluating the impact of scheduled distribution was incorporated into the Python script.
Moreover, when the cats used the devices correctly from the outset, data collected during the acclimation period were included, as no behavioural modification was observed. This approach was adopted to avoid unnecessary data exclusion and potential data shortage.
Data collection
The data collection period, initially planned for 60 days, was in the range of 63–289 days (mean 118 ± 66 days, median 105) owing to personal constraints of the students, such as vacations, internships, travel and unavailability for appointments (Table 2).
Number of observation days (start dates in parentheses) for feeding and elimination behaviours after data removal

Dates are given in a DD/MM/YYYY format
TOT = total observation time
Furthermore, various incidents occurred during the use of the devices, necessitating the exclusion of data from the analysis and an extension of the study duration to compensate for these periods of dysfunction. Overall, 84.9% of the feeding behaviour records for the nine cats (mean 84.6 ± 13.7%, median 93%) and 82.2% of the elimination behaviour records (mean 84.1 ± 6.3%, median 83.7%) were retained for analysis (Table 2).
Data analysis
Regarding feeding behaviour, a circadian IMDP that varied throughout the day was observed for all individuals. The superposition of IMDP did not show any similarity, but bimodality was observed in 8/9 cats (for cat 2, the consumption of kibble was high after 4 am). The IM5DP calculation demonstrated the repetition of similar patterns (Figure 4). The mean (±SD) pairs of Δpd were mainly concentrated in a restricted area (Figure 5). Finally, the reconstruction of a signal from a Fourier transform on Δpd produced a signal similar to the IMDP calculated over the entire study period (Figure 6).
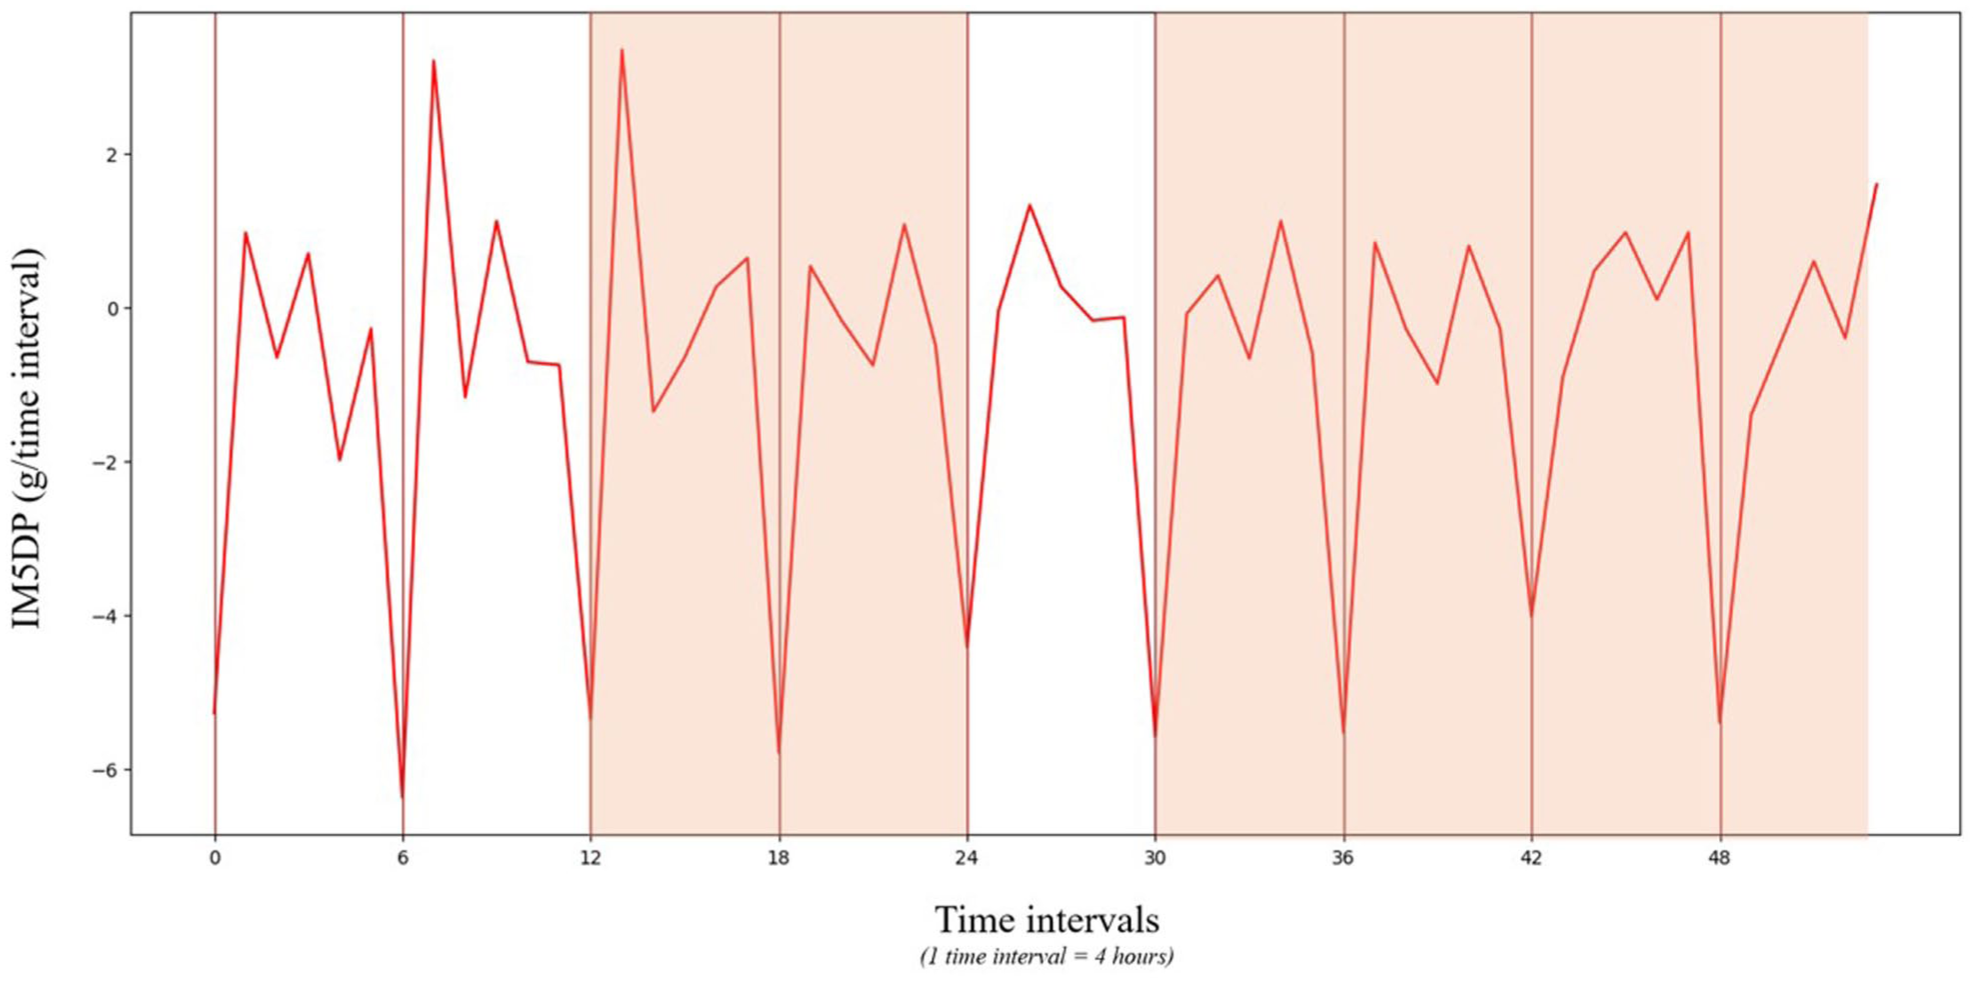
Individual mean over 5 days profile (IM5DP) (mean of the difference between the average consumption per time interval and the average daily consumption over 5 consecutive days) for cat 3, related to feeding behaviour. The orange highlights focus on the most similar patterns. The x-axis shows the successive 4-h time intervals through the observation time. Each day (ie, six periods of 4 h) is separated from the others by vertical brown lines. The y-axis represents IM5DP (g/time interval). The repetition of similar patterns across different 5-day windows demonstrates the consistency of feeding behaviour over time
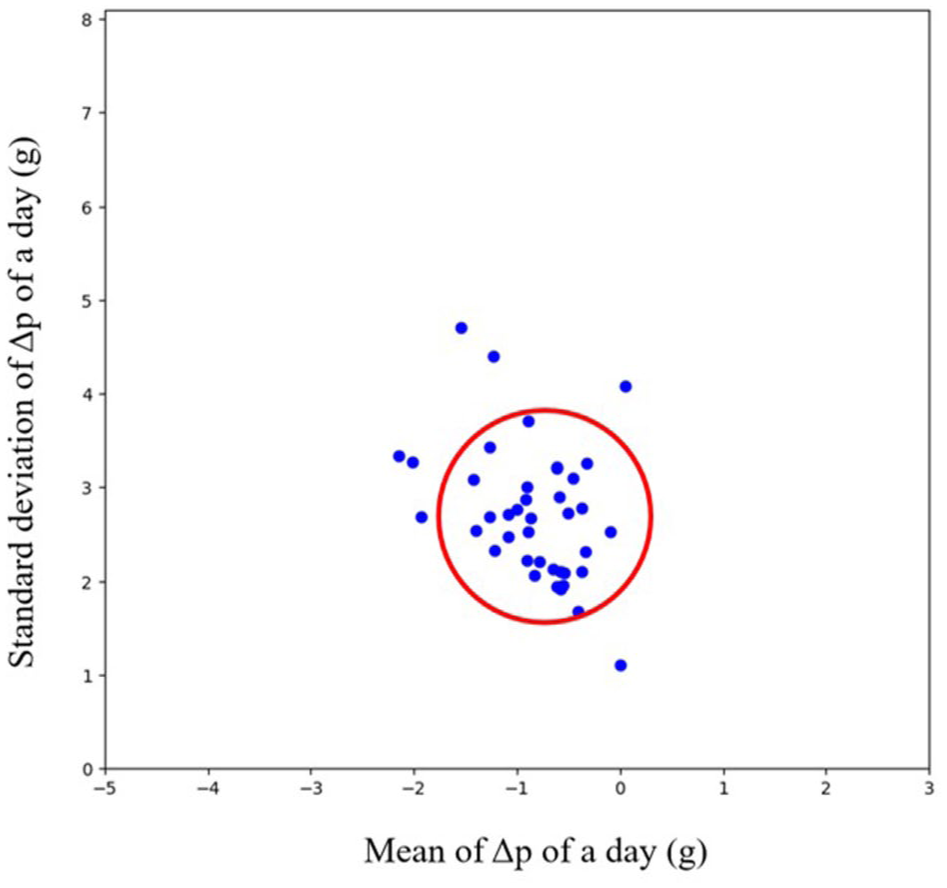
Mean (±SD) pairs of difference between the average consumption per time interval and the average daily consumption during the observation (Δpd) of cat 3, related to feeding behaviour. The red circle highlights the cluster of most data points. The x-axis shows the daily mean of Δpd (g). The y-axis represents the daily SD of Δpd (g)

Reconstructed signal (left) and individual mean daily profile (IMDP) (mean of difference between the average consumption per time interval and the average daily consumption over the study) duplicated (right) for cat 3, related to feeding behaviour. The x-axis shows the successive 4-h time intervals through 2 fictive days. The y-axis represents the reconstructed signal after a Fourier transformation (blue, in g/time interval) or the duplicated IMDP (red, in g/time interval). Two days are shown to ensure no modification of the reconstructed signal after 24 h. The 2 days are separated by vertical red lines
Regarding elimination behaviour, a circadian IMDP varying throughout the day was observed for all subjects. The superposition of IMDP showed a similarity between seven of them – those of cats 6 and 8 differed notably in the chronology of amplitude peaks – and bimodality was observed in all nine cats. Subsequently, the calculation of IM5DP demonstrated the repetition of similar patterns (Figure 7). The mean (±SD) pairs of Δpd were mainly concentrated in a restricted area (Figure 8). Finally, the reconstruction of a signal from a Fourier transform on Δpd produced a signal similar to the IMDP calculated over the entire study period (Figure 9).

Individual mean over 5 days profile (IM5DP) (mean of the difference between the average consumption per time interval and the average daily consumption over 5 consecutive days) for cat 7, related to feeding behaviour. The orange highlights focus on the most similar patterns. The x-axis shows the successive 4-h time intervals through the observation time. Each day (ie, six periods of 4 h) is separated from the others by vertical brown lines. The y-axis represents IM5DP (visits/time interval). The repetition of similar patterns across different 5-day windows demonstrates the consistency of feeding behaviour over time

Mean (±SD) pairs of difference between the average consumption per time interval and the average daily consumption during the observation (Δpd) of cat 7, related to feeding behaviour. The red circle highlights the cluster of most data points. The x-axis shows the daily mean of Δpd (number of visits). The y-axis represents the daily SD of Δpd (number of visits)
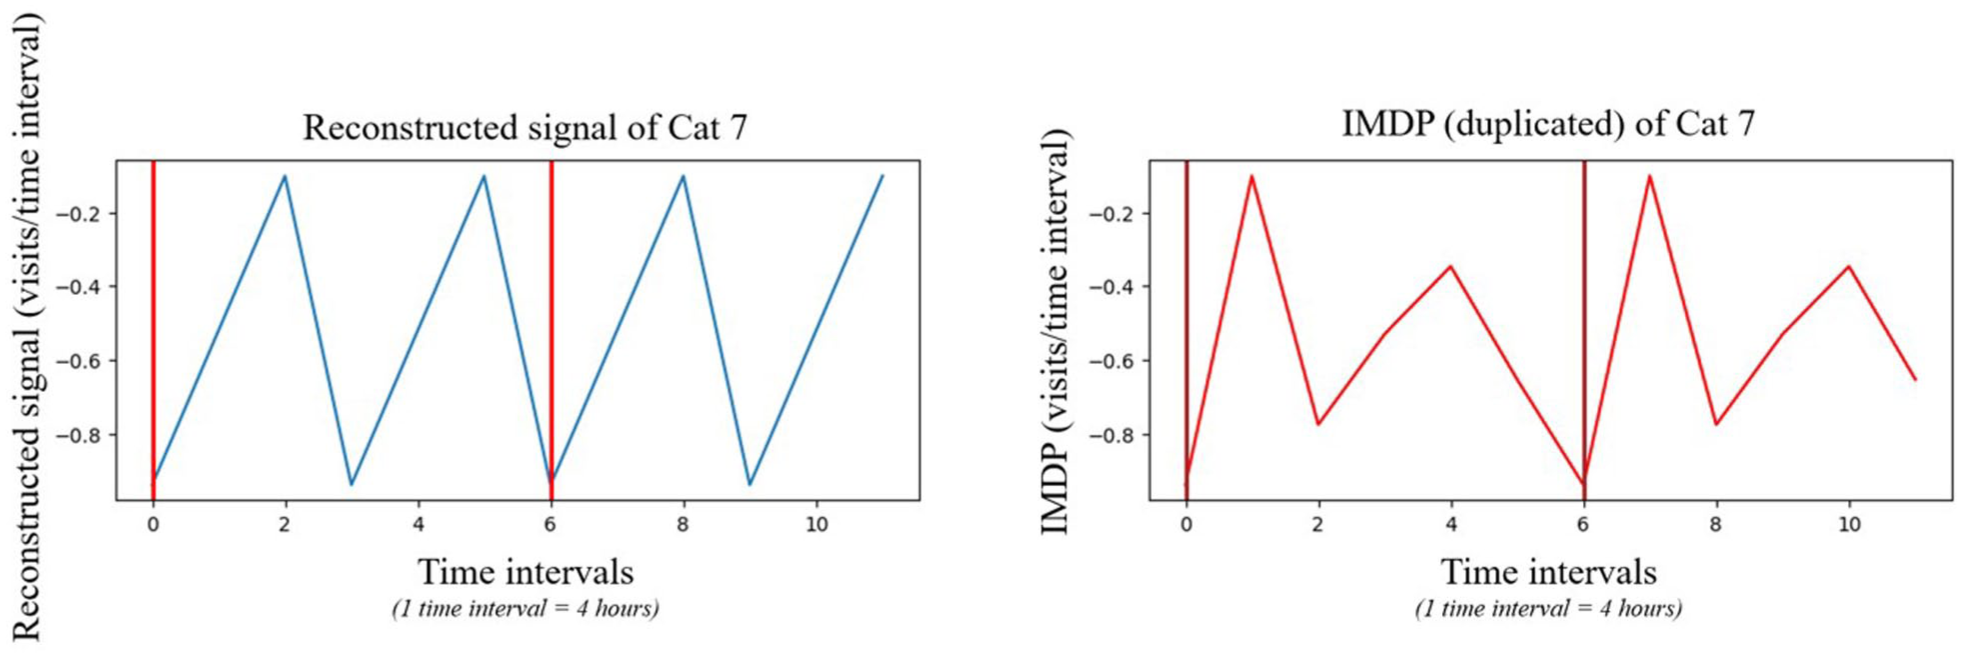
Reconstructed signal (left) and individual mean daily profile (IMDP) (mean of difference between the average consumption per time interval and the average daily consumption over the study) duplicated (right) for cat 7, related to feeding behaviour. The x-axis shows the successive 4-h time intervals through 2 fictive days. The y-axis represents the reconstructed signal after a Fourier transformation (blue, in visits/time interval) or the duplicated IMDP (red, in visits/time interval). Two days are shown to ensure no modification of the reconstructed signal after 24 h. The 2 days are separated by vertical red lines
As no time-dependent evolution of IM5DP was seen, the effect of seasonal variation was not investigated.
The influence of scheduled feeding on feeding behaviour, which was not initially anticipated as the study aimed for ad libitum feeding, was investigated using Spearman and Kendall correlation tests. For cats 2 and 7, P values below the 0.05 significance level indicated a statistically significant association between food distribution and food consumption. As both cats were described by their owners as gluttonous, it is plausible that a meaningful relationship exists between distribution timing and kibble intake in these two cats. Their feeding behaviour could therefore be described as ‘eating as soon as there is something to eat’.
Discussion
Overall acceptance of the two connected devices by the cats was good. Only one cat did not adapt, whereas 8/9 used both devices routinely within 72 h and could be monitored for at least 63 days. For these cats, data on feeding and elimination behaviours allowed for the calculation and visualisation of an IMDP specific to each cat throughout the study.
For 8/9 cats studied, bimodal daily feeding and elimination behaviours were observed, a finding previously reported by Parker. 6 The nine cats in our study primarily ate when the owner was active at home (4–8 am and 4–8 pm) and used the litter box mainly when the owner was inactive or absent (4–8 am and 8–12 pm).
The overall IM5DP showed repeatable patterns for all cats in the study. In addition, for all nine cats, the mean (±SD) pairs were clustered in a restricted area. These two observations suggest, with a high degree of confidence, that the studied behaviours were repetitive and exhibited low variability.
In other words, the variation in the measured behaviours was limited, with daily means and SDs being largely similar over the study period. The modelling using Fourier transform provided a signal close to the calculated signature, suggesting that the average behaviour of a cat over a given period can be modelled.
The reconstruction of a signal from the identified frequencies yielded a sinusoidal signal with strong similarities to the signature calculated from the overall study data. Thus, it appears possible to refine this reconstruction by searching for additional frequencies to reproduce the measured behaviour more closely.
Furthermore, the Spearman and Kendall tests indicated a correlation between the amount of kibble distributed and the amount consumed for cats 2 and 7 (P = 0.001 and P = 0.042, respectively, for the Spearman test, and P = 0.003 and P = 0.064, respectively, for the Kendall test). The absence of correlation for other cats with programmed feeding (and for those fed ad libitum) reinforces the conclusions drawn from the analysis.
However, the present study has some limitations. These include mainly a small sample size, a relatively short study duration and an uncontrolled environment, which restrict the generalisability of our findings. Conducting the same methodology in a controlled environment would enhance data quality, while a longer observation period could enable the investigation of seasonal variations. Moreover, the use of artificial intelligence and deep learning could enable a more refined modelling of the studied behaviours compared with a Fourier transform, as demonstrated in studies by Hussain et al 13 and Mozumder et al. 12
Our approach differs significantly from previous studies on the use of connected devices for cats. Although Lascelles et al 7 used accelerometers to measure overall activity, and Chen et al 11 and Mozumder et al 12 focused on recognising specific behaviours via deep learning, our study adopts a mathematical modelling approach to individual patterns.
Parker 6 demonstrated circadian rhythms at group level by use of smart feeders, but our methodology allows for an individualised approach. This distinction is crucial because individual IMDPs do not overlap despite sharing common features (such as bimodality), highlighting the need for personalised references rather than population norms. The Fourier transform and signal reconstruction approach provides a mathematical method that aims to distinguish normal variations from pathological deviations.
Current commercial smart feeders (similar to Catspad) or connected litter boxes (similar to Caremitou) record data but lack predictive analytical capabilities. Our mathematical modelling approach could be integrated into such devices to provide actionable insights for cat owners and veterinarians.
In veterinary practice, this methodology might be implemented through several approaches. Cats diagnosed with chronic conditions could benefit from continuous home monitoring. The IMDP and IM5DP could serve as objective tools to assess disease progression and/or treatment efficacy, potentially prompting earlier therapeutic adjustments before perceptible clinical deterioration.
Development of an early warning system could be considered by implementing an algorithm that would compare the current IM5DP with the cat’s established baseline IMDP. Deviations exceeding a predetermined threshold would generate an alert for the owner or veterinarian.
Postoperatively, this approach could help follow-up recovery by tracking the gradual return to baseline behavioural patterns. This could be particularly valuable for assessing recovery from procedures affecting elimination, such as gastrointestinal or urinary surgery.
Prospective studies enrolling cats at risk for spontaneous chronic diseases would be essential to establish the sensitivity and specificity of IM5DP deviations in detecting early pathological changes and to calibrate disease-specific thresholds for each pathology.
Furthermore, combining feeding and elimination data with other parameters (such as blood biomarkers or activity monitoring via accelerometers) could improve the early detection of chronic pathologies through multimodal analysis.
Long-term studies spanning multiple years would likely be necessary to investigate whether adaptive algorithms accounting for age-related changes and intra-annual variations could be incorporated into this approach while maintaining sensitivity to pathological deviations.
Conclusions
In this preliminary study, individual eating and elimination profiles of healthy indoor cats fed dry kibble were successfully modelled using data generated by a connected smart feeder and litter box, respectively. These promising results suggest that internet of things-based technologies may enable the detection of subtle deviations from routine behaviours that might otherwise go unnoticed by owners, thereby offering considerable potential to enhance health monitoring programmes in cats.
Footnotes
Acknowledgements
We would like to thank Ceva and Novandsat for providing the devices for free, as well as the 14 applicants and the nine volunteers who participated in the study and gave up their time to monitor and record all the variable elements in their cat’s environment. Without them, the study data would not have been as representative.
Conflict of interest
The authors declared no potential conflicts of interest with respect to the research, authorship, and/or publication of this article.
Funding
This work was supported by the LOOF-AGRIA funding programme.
Ethical approval
The work described in this manuscript involved the use of non-experimental (owned or unowned) animals. Established internationally recognised high standards (‘best practice’) of veterinary clinical care for the individual patient were always followed and/or this work involved the use of cadavers. Ethical approval from a committee was therefore not specifically required for publication in JFMS. Although not required, where ethical approval was still obtained, it is stated in the manuscript.
Informed consent
Informed consent (verbal or written) was obtained from the owner or legal custodian of all animal(s) described in this work (experimental or non-experimental animals, including cadavers, tissues and samples) for all procedure(s) undertaken (prospective or retrospective studies). No animals or people are identifiable within this publication, and therefore additional informed consent for publication was not required.