
Abstract
Objectives
The present study retrospectively examined effusive feline infectious peritonitis (FIP) cases to investigate whether baseline viral RNA loads and serum biomarkers are associated with treatment responses and to identify early prognostic indicators that will guide clinical decision-making.
Methods
A total of 15 cats with effusive FIP that presented to a primary care veterinary hospital in Japan between August 2024 and August 2025 were included. The diagnosis was based on the European Advisory Board on Cat Diseases guidelines, combining clinical presentation, laboratory findings and feline coronavirus (FCoV) RNA detection by RT-qPCR. Antiviral treatment included GS-441524, remdesivir, molnupiravir or adjunctive nirmatrelvir. Cats were retrospectively classified as high-responders (HRs), low-responders (LRs) or non-responders (NRs), based on the blood FCoV N gene RNA load 2 weeks after treatment initiation. LR and NR cats were combined (LR/NR, n = 10) in analyses. Viral RNA loads in ascitic fluid and blood, routine haematology, acute-phase proteins and serum protein fractions were compared between groups.
Results
At treatment initiation, the LR/NR group had significantly higher blood N gene RNA loads (P <0.01) and ascitic fluid RNA loads (P <0.05) than the HR group. In contrast, no intergroup differences were detected in M gene loads. Routine haematological markers revealed higher total protein, globulin (Glb) and lactate dehydrogenase in the LR/NR group, and no significant differences in albumin (Alb), total bilirubin or serum amyloid A. A serum protein fraction analysis showed distinct profiles: the HR group had higher albumin:globulin ratios and higher Alb, alpha (α)1-, α2- and beta-Glb fractions, while the LR/NR group had a markedly higher gamma (γ)-Glb fraction. The persistence of blood viral RNA 2 weeks after treatment initiation, together with opposing changes in the α2- and γ-Glb fractions, emerged as promising predictors of treatment outcomes.
Conclusions and relevance
Baseline blood N gene RNA loads and serum Glb fractions have potential as early prognostic indicators of therapeutic responses in effusive FIP. Some of these results support the utility of combining viral and host biomarkers to improve outcome predictions and treatment monitoring.
Plain language summary
This study investigated how changes in blood test results can help predict recovery in cats treated for feline infectious peritonitis (FIP), a serious disease caused by feline coronavirus. In total, 15 cats with the effusive (wet) form of FIP were treated with different antiviral medications commonly used in veterinary practice. We measured the amount of virus (viral RNA) in the blood and examined changes in serum protein profiles over time. Cats that responded well to treatment showed a rapid decrease in the viral RNA detected in blood within 2 weeks. These cats also had higher levels of albumin and lower levels of a type of globulin called gamma-globulin compared with cats that responded poorly. In contrast, cats that still had high viral RNA levels after 2 weeks tended to have prolonged illness or poor outcomes. These results suggest that early clearance of the virus and specific protein changes in the blood can serve as useful markers to predict treatment outcomes in cats with FIP. Identifying these early indicators may help veterinarians adjust therapy more effectively and provide owners with better information about prognosis.
Introduction
Feline infectious peritonitis (FIP) is a fatal disease caused by genetic mutations in feline coronavirus (FCoV), with a high incidence in young cats and those in multi-cat households. 1 FIP is characterised by systemic vasculitis and granulomatous inflammation, and is clinically classified into two major forms: the effusive form (effusive FIP) and the non-effusive form (non-effusive FIP). 2 However, frequent transitions between the two forms, as well as overlapping clinical features, often obscure a clear distinction.
In recent years, the clinical use of antiviral agents has led to FIP being increasingly recognised as a potentially treatable disease.3 –6 Furthermore, the standard treatment duration of 84 days is now being reconsidered, with shorter courses (eg, 6 weeks or less) being employed according to individual cases. 7 Therefore, an accurate assessment of early treatment responses is important. However, reliable indicators that objectively and promptly evaluate treatment responses or prognosis have yet to be established. The identification of practical markers capable of predicting responsiveness during the early phase of therapy remains an urgent priority in both clinical and research settings.
Although the immunohistochemical detection of the FCoV antigen in affected tissues remains the gold standard for a definitive diagnosis of FIP, 8 it is often impractical in clinical settings. RT-PCR on effusion samples is widely recognised as a valuable adjunctive test, particularly for effusive FIP. 9 However, when antiviral therapy is initiated early and effusions resolve rapidly, 7 this test becomes less applicable and is of limited value for longitudinal monitoring. These limitations highlight the need for reliable, non-invasive diagnostic tools that may be readily applied in routine practice. The detection of FCoV RNA in blood, although less sensitive than effusion testing, 10 is increasingly being used when effusion or tissue samples are unavailable. Although haematological parameters, acute-phase proteins and serum protein fractions lack specificity for FIP, 11 their combined evaluation may support a diagnosis, therapeutic monitoring and prognostication. Importantly, the integration of these laboratory markers with blood FCoV RNA detection may yield a more accurate and clinically meaningful assessment of the disease status.
Therefore, we retrospectively analysed the medical records of cats with effusive FIP to characterise longitudinal changes in the blood FCoV RNA load, routine haematological parameters, acute-phase proteins and serum protein fractions. To clarify the relationship between early treatment indicators and clinical outcomes, cases were classified as responders (high-responders [HRs]), delayed responders (low-responders [LRs]) or non-survivors (non-responders [NRs]). This approach was designed to identify novel evaluation metrics that may support individualised treatment strategies and enhance a prognostic assessment.
Materials and methods
Case selection
This retrospective study included cats that presented to Kobe Animal Clinic (Kobe, Japan) between August 2024 and June 2025 with ascites and a positive FCoV RNA test on body cavity effusions. FIP was diagnosed according to the European Advisory Board on Cat Diseases guidelines, 1 based on clinical and laboratory findings (signalment, a physical examination, serum biochemistry, radiography and ultrasonography) consistent with FIP, together with the RT-qPCR detection of FCoV RNA in effusions. Cases were classified as effusive FIP if FCoV RNA was detected in effusions, and bacterial or neoplastic diseases were excluded in all cats based on cytological or histopathological findings, together with haematological and imaging examinations (ultrasonography and radiography) when available. A flow diagram of case inclusion and classification is shown in Figure S1 in the supplementary material.
Selection of diagnostic tests and sample collection
Cats with ascites, the clinical suspicion of FIP and a positive FCoV nucleocapsid (N) gene RNA result in ascitic fluid were included. Blood and ascitic fluid were collected at treatment initiation (week 0, W0) and at weeks 2 (W2), 4 (W4) and 10–12 (W10–12). A haematological evaluation included serum biochemistry and protein electrophoresis (parameters listed in Table S1 in the supplementary material). Quantitative rapid FCoV RNA was measured in both blood and ascitic fluid. Serum total protein (TP), albumin (Alb), total bilirubin (T-Bil) and lactate dehydrogenase (LDH) were analysed in-house (DRI-CHEM NX700iV; FujiFilm Vet Systems). Acute-phase proteins and serum protein fractions were measured by an external diagnostic service (FujiFilm Vet Systems). Quantitative FCoV RNA testing was outsourced to Canine-Lab. Residual RNA was used for a spike (S) gene analysis, targeting the S2 subunit around amino acid 1058. Region-specific primers amplified the target, and PCR products were sequenced commercially (Fasmac) to investigate nucleotide identities. The quantitative RT-qPCR assay performed by Canine-Lab targets the FCoV N gene and includes an internal RNA control. Although primer sequences and reaction conditions are proprietary and not publicly available, the assay has been validated and routinely used in Japan for more than 5 years for FIP diagnostics. Readers seeking methodological details are advised to contact the diagnostic provider directly.
Treatment overview
Treatment protocols were selected by the attending veterinarian according to each cat’s condition and the owner’s preference. Antiviral agents included GS-441524 (Bova), remdesivir (Bova) and molnupiravir (Lagevrio; Merck). Since these drugs are not licensed for veterinary use in Japan, they were administered off-label with owner consent. Routes and dosages were individualised. Nirmatrelvir (Paxlovid; Pfizer) was used as adjunctive therapy in some cases, and as the sole treatment in one cat because of owner circumstances. This study did not compare regimens; therapeutic responses were retrospectively assessed using standardised criteria. Because treatment regimens varied among cases, this study did not aim to compare the efficacy of individual antivirals. Instead, the analysis focused on identifying biological response markers that are common across different treatment categories, irrespective of the specific drug used. Cats were classified as HRs, LRs or NRs, based on the blood FCoV N gene load at W2 together with clinical and laboratory findings. Classifications were retrospective and did not affect treatment. Details are provided in Figure S2 and Table S2 in the supplementary material.
Statistical analysis
Statistical analyses were performed with JMP Pro 18 (SAS Institute). Continuous variables were compared using the Wilcoxon rank-sum or signed-rank tests. At W0, Fisher’s linear discriminant analysis (LDA) combined the blood FCoV N gene RNA load (log-transformed) with each blood parameter. Scatter plots with LDA decision boundaries were used to visualise the separation of HRs (HR group) from LRs/NRs (LR/NR group).
Results
Temporal dynamics of FCoV N gene detection and classification of treatment responses
At treatment initiation (W0), all 15 cats strongly suspected of effusive FIP had abdominal effusion, and FCoV N gene RNA was detected in every case, closely approximating a definitive diagnosis. In blood, N gene RNA was detectable in 13 cats (Table 1). By W2, three cats had died, and effusion had resolved in 10/12 survivors; the remaining two still had effusion and tested positive for the N gene. Blood viral RNA persisted in seven cats. By W4, effusion had resolved in all cats, although two still tested positive in blood. In W10–12, all surviving cats were negative in blood. An S gene mutation analysis of ascitic fluid samples at W0 identified amino acid substitutions at M1058 and its neighbouring residues in 10 cats (Table 2), including M1058L (n = 6), S1060A (n = 1) and M1058L combined with either V1065I or A1070S (n = 3). No sequence was obtained in five cats as a result of undetectable or unavailable samples. Treatment responses were classified retrospectively based on the blood N gene status at W2: HR (n = 5, PCR-negative), LR (n = 7, persistent positive) and NR (n = 3, died before W2) (Table 1).
Detection status of the feline coronavirus N gene and the classification of treatment responses in individual cases

+ = positive; – = negative; ‡ = not available because of death; HR = high-responder; LR = low-responder; NA = not available because of effusion resolution; NA# = not available because of a missed visit; NR = non-responder; W = week
Detection of feline coronavirus S gene mutations in individual cases

NA = not available because of sample loss; ND = not determined
Baseline viral load and immunological markers for the stratification of treatment responses
In the analysis, cats in which the N gene was persistently detected in W2 (LR, n = 7) and those that died before W2 (NR, n = 3) were combined (LR/NR group) because both showed poor early treatment responses (Figure 1).

Comparison of feline coronavirus (FCoV) N and M gene RNA loads at treatment initiation (W0) among response groups. The log-transformed RNA loads (copies/ml) of the FCoV N and M genes in ascitic fluid and blood were compared across treatment response groups. Blue circles represent high-responders (HRs) (n = 5), red circles represent low-responders (LRs) (n = 7) and black circles represent non-responders (NRs) (n = 3). In statistical analyses, LR and NR cats were combined into the LR/NR group because of their similarly poor early treatment responses. *P <0.05; **P <0.01. ns = not significant
At baseline (W0), N gene loads were significantly higher in the LR/NR group than in the HR group (n = 5) in both ascitic fluid (P <0.05) and blood (P <0.01), with the difference being more pronounced in blood, suggesting that early viraemia correlated with outcomes. In contrast, M gene loads did not significantly differ between groups. Among laboratory parameters (Figure 2), TP, globulin (Glb) and LDH were significantly higher in the LR/NR group (P <0.05, P <0.05 and P <0.01, respectively), with LDH frequently exceeding the reference interval (RI). Alb, T-Bil and serum amyloid A (SAA) did not significantly differ, although SAA was elevated in all cats (>5.5 µg/ml). Alpha-1 acid glycoprotein (α1-AGP) was excluded because values exceeded the detection limit (>2000 µg/ml) in all but one NR cat (1017 µg/ml). Serum protein fractions (Figure 3) also significantly differed between groups. The HR group had a higher Alb fraction and Alb:Glb (A:G) ratio, as well as elevated α1-, α2- and beta (β)-globulin fractions (α1-, α2- and β-Glb), whereas the gamma (γ)-Glb fraction was higher in the LR/NR group (all P <0.005). Increases in α2- and γ-Glb reflected acute and chronic inflammatory patterns, respectively. All HR cats had γ-Glb within the RI, whereas 9/10 cats in the LR/NR group exceeded it. Representative electrophoretic patterns for the HR, LR and NR groups are shown in Figure S3 in the supplementary material.
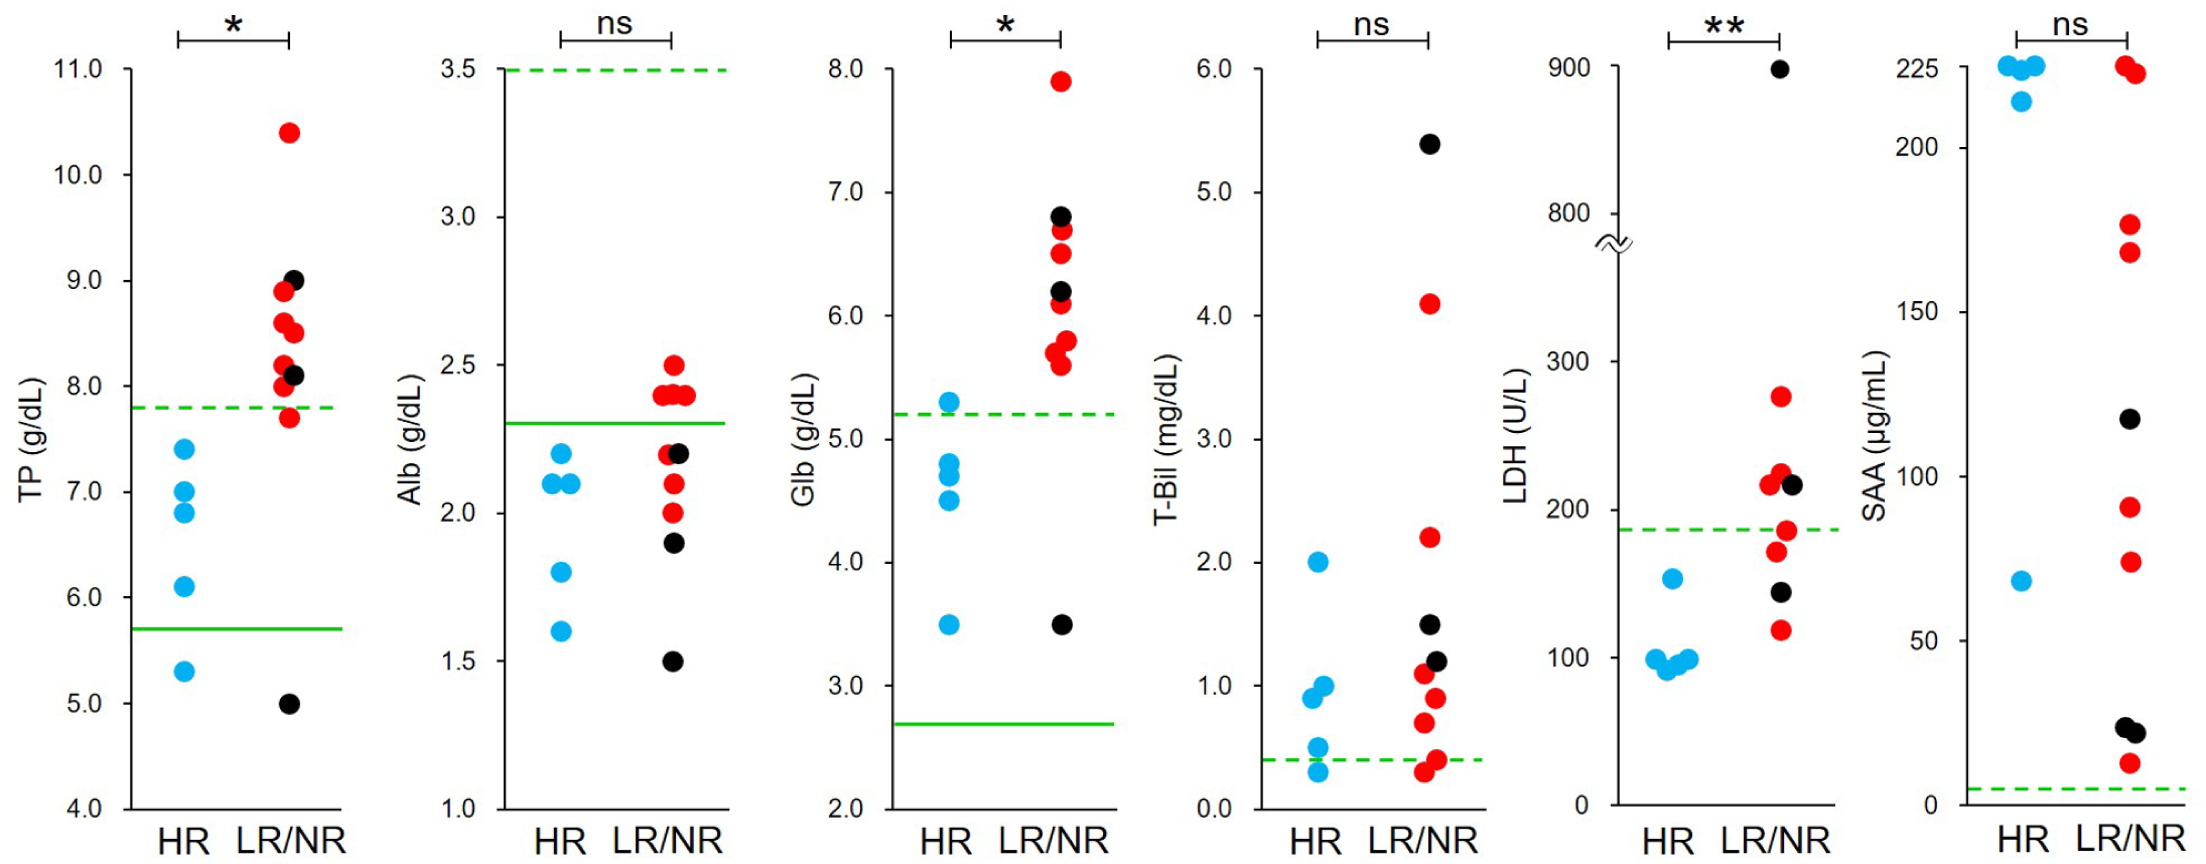
Comparison of routine blood markers between the high-responder (HR) and low-responder (LR)/non-responder (NR) groups at treatment initiation (W0). Six blood parameters (total protein [TP], albumin [Alb], globulin [Glb], total bilirubin [T-Bil], lactate dehydrogenase [LDH] and serum amyloid A [SAA]) were compared between groups. Blue, red and black circles represent HR, LR and NR cats, respectively. In statistical analyses, LR and NR cats were combined as the LR/NR group (n = 10). Green solid and dashed lines indicate the lower and upper reference limits, respectively. *P <0.05; **P <0.01. ns = not significant

Comparison of serum protein fractions between high-responder (HR) and low-responder (LR)/non-responder (NR) groups at treatment initiation (W0). Albumin (Alb), the globulin (Glb) fractions (alpha [α]1-Glb, α2-Glb, beta [β]-Glb, gamma [γ]-Glb) and the Alb:Glb (A:G) ratio were compared between groups. Blue, red and black circles represent HR, LR and NR cats, respectively. In statistical analyses, LR and NR cats were combined into the LR/NR group (n = 10). Green solid and dashed lines indicate the lower and upper reference intervals, respectively. *P <0.05; **P <0.01; ***P <0.005.
Visual analysis of relationships between the baseline blood N gene load and serum parameters
To assess the relationships between the baseline (W0) blood FCoV N gene RNA load and serum parameters, scatter plots were generated with the N gene load on the x-axis and each parameter on the y-axis, with regression lines superimposed (Figure 4). γ-Glb was slightly higher in cats with lower viral loads and separated the HR group well, whereas α2-Glb positively correlated with the viral load and characteristics of the LR/NR group. Despite the limited sample size, these two fractions appeared to be the most promising for group discrimination. Among the other parameters tested, TP, Glb and LDH were negatively associated with the viral load, while the A:G ratio, α1-Glb and β-Glb were positively associated. Differences were more pronounced for the α1-, α2-, β- and γ-Glb fractions, which provided clearer visual discrimination between the groups on scatter plots.

Linear discriminant analysis using the blood feline coronavirus (FCoV) N gene RNA load and serum parameters at treatment initiation (W0). Fisher’s linear discriminant analysis was performed using the log-transformed blood FCoV N gene RNA load (copies/ml) together with each serum parameter measured at W0. Scatter plots illustrate individual data points with the discriminant boundary shown as a black line. Blue, red and black circles represent high-responder (HR), low-responder (LR) and non-responder (NR) cats, respectively
Longitudinal changes in blood biomarkers and protein fractions during treatment
Changes in each parameter from W0 to W10–12 were compared between the HR and LR groups (Figure 5). TP and total Glb were consistently higher in the LR group than in the HR group throughout the study period, with significant differences at all time points. Alb increased in both groups in W2, after which the trajectories remained largely parallel. α1-AGP followed a similar course in both groups, while SAA sharply declined after W2. The A:G ratio remained higher in the HR group across all time points, with significant differences throughout. In the protein fraction analysis by immunoelectrophoresis, the Alb fraction was consistently higher in the HR group, with significant intergroup differences at each sampling point. The α1-, α2- and β-Glb fractions were significantly higher in the LR group at W0; however, no significant differences were observed thereafter. In contrast, the γ-Glb fraction remained elevated in the LR group across all time points, with pronounced differences being observed at W0 and W4.

Longitudinal changes in serum parameters from W0 to W10–12 in high-responder (HR) and low-responder (LR) groups. Serial measurements of total protein (TP), albumin (Alb), globulin (Glb), alpha-1 acid glycoprotein (α1-AGP), serum amyloid A (SAA), the Alb:Glb (A:G) ratio and serum protein fractions (Alb, alpha [α]1-Glb, α2-Glb, beta [β]-Glb and gamma [γ]-Glb) were compared between the HR (blue lines) and LR (red lines) groups. Data are expressed as the means ± SEM. Green solid and dashed lines indicate the lower and upper reference limits, respectively. *P <0.05; **P <0.01; ***P <0.005
Discussion
In this retrospective study, we examined the relationship between early changes in the viral RNA load and treatment responses in 15 cats strongly suspected of having effusive FIP, with all being positive for the FCoV N gene in ascitic fluid. At treatment initiation (W0), ascites was present in every case, and the N gene RNA was detected in all ascitic samples. Viral RNA was also identified in the peripheral blood in 13/15 (86.7%) cats, confirming high detection rates in both compartments. These results indicate that the cohort reflected the typical pathophysiological state of FIP, supporting diagnostic accuracy and case selection. Previous studies consistently demonstrated the high sensitivity and specificity of FCoV RNA detection in effusions.10,12,13 These findings are consistent with the present results, reinforcing ascitic fluid RT-qPCR as a robust diagnostic tool for effusive FIP.
In the present study, FCoV RNA was detected in all ascitic fluid samples, reaffirming current diagnostic recommendations. 1 Although blood RNA detection is less sensitive diagnostically, it was useful for monitoring viral dynamics. By W2, ascites had resolved in most survivors (10/12), limiting further effusion analyses, whereas blood RNA persisted in seven (58.3%) cats, indicating a slower decline. By W4, viraemia had resolved in 10 cats, and all survivors were negative by W10–12. The blood RNA status at W2 emerged as an early indicator of treatment responses: cats with persistent viraemia also showed delayed biomarker improvement, while early clearance predicted a more favourable course. Similar relationships have been reported for severe acute respiratory syndrome-CoV-2, where RNAemia correlates with severity.14 –16 Based on the blood RNA status in W2, cats were classified as HR (five cleared), LR (seven positive) or NR (three died), aligning with clinical outcomes and changes in biomarkers. Treatment was also shorter for HRs (52.4 ± 6.7 days, data not shown) than for LRs (63.0 ± 6.1 days, data not shown), supporting the value of grouping by RNA dynamics. These results suggest that early blood FCoV RNA measurements aid in prognostication and therapeutic decision-making, warranting prospective validation.
The relationship between the FCoV RNA load and treatment responses varied by genomic targets. The N gene RNA load correlated with outcomes, whereas the M gene RNA load did not. As the most abundantly transcribed single guide RNA,17,18 the N gene provides high detection sensitivity and reflects active replication, which is consistent with the present results. The absence of a relationship for the M gene may reflect the primer design or its lower transcription levels. Among S-protein mutations, the M1058L substitution was the most frequent. Located in the S2 subunit near the fusion peptide, it may enhance monocyte/macrophage tropism and systemic spread. 19 All three cats that died within 2 weeks carried this mutation, and two also harboured A1070S. Although the numbers are small, these results warrant further study into the role of specific S-protein mutations in treatment responses and disease progression.
Biomarker trajectories showed early improvement in the HR group, with SAA markedly decreasing by W2, whereas the LR/NR group exhibited limited changes, with α1-AGP, α2-Glb and γ-Glb remaining elevated in some cats in W4. These results suggest ongoing immune activation despite the resolution of clinical signs. Although appetite loss, lethargy and fever resolved rapidly in all cats and no relapses occurred, TP and γ-Glb often remained elevated, indicating a lag between clinical and immunological remission. A recent study similarly highlighted changes in acute-phase proteins and cytokines after therapy, reinforcing the value of biomarker-based monitoring. 20 Therefore, serial biomarker monitoring may aid in decisions on treatment cessation. Persistent abnormalities did not predict relapse but may reflect chronic inflammation or immune reconstitution. Further long-term and multicentre studies are required to assess their prognostic significance.
Recent findings demonstrated that viral RNA loads in blood, faeces and conjunctival swabs did not significantly differ between FCoV-infected cats that developed FIP and those that remained subclinical, 21 underscoring the role of host immune factors in disease onset. In contrast, the present study demonstrated that once FIP developed, the blood RNA load correlated with treatment responsiveness and inflammatory marker trajectories, indicating its value for monitoring disease activity rather than predicting onset. FIP may also be complicated by immune-mediated conditions, such as immune-mediated haemolytic anaemia, which may recur even after remission. 22 Consistently, persistent biomarker elevations, including γ-Glb, were observed despite clinical remission, supporting the view of FIP as a chronic immune-inflammatory disorder. Therefore, evaluations of treatment efficacy and cessation decisions need to integrate both viral dynamics and biomarker profiles, with future studies refining monitoring strategies that consider individual immune variability.
This study has some limitations that need to be addressed. Its retrospective design and small sample size limit the generalisability of the results obtained. Furthermore, treatment protocols were not standardised and were selected by the attending veterinarians, potentially introducing variability in clinical outcomes. The heterogeneity in treatment regimens represents an inherent limitation of this retrospective study. Although different antiviral agents and dosing schedules were used, the patterns of early RNA clearance and protein fraction changes were consistent across treatment categories. This suggests that these biological responses reflect fundamental processes associated with recovery from effusive FIP rather than drug-specific effects. Future studies employing standardised treatment protocols will be required to validate these observations. In addition, an S gene analysis was only feasible for a subset of cases, restricting the interpretation of the mutation–response relationship. Another limitation is that the use of a commercial proprietary PCR assay limited the full disclosure of methodological details and replication by other laboratories. Future studies using publicly available or standardised assays are warranted to validate our findings. In addition, the follow-up was confined to the treatment period, precluding an assessment of long-term outcomes, such as late relapse.
Conclusions
This retrospective study on 15 cats with effusive FIP showed that the blood FCoV N gene RNA load at treatment initiation correlated with clinical progression and biomarker dynamics. The clearance of RNA by W2 indicated a favourable response. Among biomarkers, γ-Glb and α2-Glb were useful when interpreted with the RNA load. A longitudinal analysis revealed a gap between clinical and immunological remission, with persistent marker elevations not necessarily predicting relapse. Collectively, these results support the combined monitoring of blood RNA and selected biomarkers to refine treatment assessments and inform future prospective studies.
Supplemental Material
Table S1
Blood test parameters and evaluation time points in cats.
Supplemental Material
Table S2
Summary of individual antiviral treatment regimens and outcomes in cats with feline infectious peritonitis.
Supplemental Material
Figure S1
A flow diagram of case inclusion and classification.
Supplemental Material
Figure S2
Individual treatment timelines of cats diagnosed with feline infectious peritonitis using antiviral agents.
Supplemental Material
Figure S3
Representative electrophoretic patterns of serum protein fractions in high-responder (HR), low-responder (LR) and non-responder (NR) groups at W0, W2, W4 and W10–12.
Footnotes
Supplementary material
The following files are available as supplementary material:
Conflict of interest
The authors declared no potential conflicts of interest with respect to the research, authorship, and/or publication of this article.
Funding
The authors received no financial support for the research, authorship, and/or publication of this article.
Ethical approval
The work described in this manuscript involved the use of non-experimental (owned or unowned) animals. Established internationally recognised high standards (‘best practice’) of veterinary clinical care for the individual patient were always followed and/or this work involved the use of cadavers. Ethical approval from a committee was therefore not specifically required for publication in JFMS. Although not required, where ethical approval was still obtained, it is stated in the manuscript.
Informed consent
Informed consent (verbal or written) was obtained from the owner or legal custodian of all animal(s) described in this work (experimental or non-experimental animals, including cadavers, tissues or samples) for all procedure(s) undertaken (prospective or retrospective studies). For any animals or people individually identifiable within this publication, informed consent (verbal or written) for their use in the publication was obtained from the people involved.
References
Supplementary Material
Please find the following supplemental material available below.
For Open Access articles published under a Creative Commons License, all supplemental material carries the same license as the article it is associated with.
For non-Open Access articles published, all supplemental material carries a non-exclusive license, and permission requests for re-use of supplemental material or any part of supplemental material shall be sent directly to the copyright owner as specified in the copyright notice associated with the article.