
Abstract
Objectives
This study aims to assess hepatic clinicopathological changes in cats with different hepatobiliary diseases and to assess whether specific serum biochemistry changes can help differentiate these diseases.
Methods
A retrospective analysis was conducted on serum biochemistry data from 93 cats with hepatobiliary diseases and 80 control cats. Of the 93 cats with definitive diagnoses of hepatobiliary diseases, 22 had cholangitis, 14 had hepatic lipidosis, 18 had primary hepatic neoplasia confirmed via Tru-cut or laparotomic wedge biopsy and 39 had congenital portosystemic shunting (CPSS) confirmed by abdominal ultrasound. The biomarkers analysed were alanine aminotransferase (ALT), alkaline phosphatase (ALP), gamma glutamyl-transferase (GGT), total bilirubin and albumin.
Results
Cats with hepatobiliary disease had significantly higher enzyme activities, total bilirubin concentrations and lower albumin concentrations compared with controls (P <0.01). Comparison between diseases showed that there were no differences in hepatobiliary biomarkers between cholangitis and neoplasia, despite cholangitis being an abnormality of bile ductules and neoplasia affecting hepatic parenchymal cells. GGT activities in cats with hepatic lipidosis showed no difference compared with controls. A significant increase in ALP activity was observed in CPSS cases (P <0.01); however, this difference disappeared when the analysis was restricted to age-matched controls.
Conclusions and relevance
This study provides the most recent corroboration of previous findings on clinical pathology changes in feline hepatobiliary disease, supporting research conducted over a decade ago with new data from a different geographical location. For example, the observation that a significant increase in ALP without an increase in GGT is highly suggestive of hepatic lipidosis, aligning with findings from a 1993 study conducted in North America. In addition, this study reinforced the importance of serum biochemistry as a useful tool in differentiating cats with hepatobiliary disease from those without; however, it also reaffirmed previous conclusions that serum biochemistry alone is insufficient for a definitive diagnosis, which instead must be based on a combination of patient history, clinical signs and ancillary diagnostic tests, such as ultrasound and tissue biopsy.
Plain language summary
This study looked at cats with liver diseases to understand whether routine blood tests can help with identifying specific diseases. We reviewed the blood test results from 93 cats with four different liver diseases and compared them with 80 cats without liver disease. We looked at specific liver markers in the blood, such as liver enzymes, bilirubin and proteins, to see if they differed between diseases. We found that cats with liver disease had higher liver enzymes and bilirubin than healthy cats. Cats with liver cancer and cholangitis had similar blood results. Cats with fatty liver disease (hepatic lipidosis) had a more unique pattern with one liver enzyme known as GGT being lower than other diseases. For some liver diseases, such as congenital portosystemic shunting, there was a lack of abnormalities detected on blood test. Overall, this study confirms that routine blood tests are useful for identifying liver problems in cats; however, these tests alone will not provide us with a final diagnosis. Other tests, such as ultrasound and tissue biopsy, are needed to fully understand the disease.
Keywords
Introduction
Serum biochemistry is a widely used diagnostic test in veterinary medicine. The measurement of specific enzyme activities and liver synthetic products can reveal abnormalities indicative of liver or biliary tract dysfunction. However, the serum activities of these biomarkers can be influenced by various non-hepatobiliary factors, which can complicate the interpretation of these results and lead to potential diagnostic ambiguity. Previous veterinary studies have suggested that certain hepatobiliary diseases have distinctive biochemical features that can assist clinicians in prioritising differential diagnoses. 1 This study focuses on four common feline hepatobiliary diseases: cholangitis (previously referred to as cholangiohepatitis), hepatobiliary neoplasia without evidence of distant metastasis, feline hepatic lipidosis (FHL) and congenital portosystemic shunt (CPSS). These diseases were selected because of their prevalence in clinical practice.2–4
There are three key enzymes associated with hepatobiliary abnormalities in cats: alanine aminotransferase (ALT), alkaline phosphatase (ALP) and gamma-glutamyl transferase (GGT). ALT is a cytosolic enzyme found in high concentration within hepatocytes, particularly in zone-1 periportal hepatocytes, where its concentration is 4–10 times higher than other tissue sites (such as the myocardium and kidneys). In cats, ALT has an estimated half-life of approximately 3–4 h, making its elevation an indicator of recent hepatic insult.5,6 ALT activity is typically highest in acute disease and can increase up to 10-fold in conditions such as suppurative cholangitis. 1 ALP and GGT are both membrane-bound glycoproteins originating from the biliary canalicular membrane and are released into the circulation in response to hepatic cholestasis. ALP has multiple isoenzymes and may be elevated because of bone, intestinal or hepatobiliary causes. The organ with the highest concentration of ALP in cats remains a subject of debate. 1 GGT is stored in various tissues, including the kidney, intestine and pancreas. Although the highest storage concentrations are found in the kidney and pancreas, serum GGT activity predominantly originates from hepatobiliary sources.1,5 The activity of ALP and GGT generally correlates with the degree of canalicular dysfunction, with FHL being an exception. In cats with FHL, serum ALP activity is often elevated, whereas GGT activity typically remains within the reference interval (RI). 1
Bilirubin is an end-product of haem breakdown, whereas total bilirubin (TBIL) measures the combined concentration of conjugated and unconjugated bilirubin in the serum. Conjugation and the rate-limiting step of bilirubin excretion occur in the liver. When hepatocytes are compromised, bilirubin cannot undergo conjugation. In cases of cholestasis, conjugated bilirubin fails to be excreted, resulting in bilirubin regurgitation into the circulation and elevated serum concentrations. 7 However, factors unrelated to hepatobiliary disease can also increase serum TBIL; for example, erythrocyte haemolysis can increase TBIL due to excessive haem breakdown. In addition, metabolic conditions such as systemic inflammation (eg, sepsis or feline infectious peritonitis) can cause hyperbilirubinaemia in the absence of erythrocyte haemolysis or liver disease. 8
Hepatic biochemistry analytes are valuable for identifying hepatobiliary injuries, but they do not provide a comprehensive assessment of hepatic function. In patients with advanced hepatic dysfunctions with severe loss of hepatic mass, such as those with end-stage disease, quantitative measurements of liver-synthesised substances, such as albumin, cholesterol, glucose and urea, can offer insights into hepatic functional capacity. 9 A decrease in these markers below the RIs may indicate hepatic dysfunction; however, it is essential to note that abnormal results can also arise from non-hepatic causes, reducing the specificity of these markers. 10
The WSAVA Liver Standardisation Group recommends a standardised classification of cholangitis into three main forms: lymphocytic, neutrophilic and chronic. Neutrophilic cholangitis is characterised by neutrophilic infiltration within the intrahepatic bile ducts, believed to be caused by gastrointestinal commensals ascending through the biliary tract.3,11 Lymphocytic cholangitis presents as mixed inflammation characterised by small lymphocytes and plasma infiltration. It is associated with signs of chronicity, including bridging fibrosis and ductular proliferation. 12 Chronic cholangitis is commonly associated with fluke infestations in endemic areas, with eosinophilic inflammatory reaction frequently observed on histopathological examination. 13 Primary hepatocellular tumours are rare in cats, accounting for only 1.0–2.9% of all feline neoplasia. 14 The most common hepatic neoplasms diagnosed in cats are haematopoietic in origin, with lymphoma being the most documented diagnosis. 15 FHL is characterised by excessive hepatocellular lipid accumulation. It results from an imbalance between influx of fatty acid from peripheral stores, liposynthesis and hepatic excretion of triacylglycerol via lipoproteins. This disease is often secondary to systemic diseases that cause anorexia or disruption of normal hepatic metabolic processes. 16 CPSS is the most common congenital hepatobiliary anomaly in cats. It involves an abnormal communicating vessel between the portal and systemic vasculature, typically involving the caudal vena cava. This results in diversion of blood bypassing the liver, preventing hepatic detoxification and proper metabolic processing. 17
Previous studies evaluating the diagnostic utility of hepatobiliary biochemical markers were published several decades ago and were conducted in North America; 18 therefore, the aim of the present study was to investigate the biochemical profiles associated with various feline hepatobiliary diseases diagnosed at a UK referral veterinary hospital. The primary objective was to evaluate the diagnostic performance of specific serum biochemistry analytes in distinguishing between hepatobiliary conditions. By comparing data from cats with confirmed hepatobiliary disease with a control group without such disease, this study sought to determine the diagnostic value of hepatobiliary biomarkers. The findings may enhance clinical decision-making by providing insights into the practical utility of serum biochemistry in the diagnosis of feline hepatobiliary disorders.
Materials and methods
Study design and inclusion criteria
This retrospective study was conducted at a UK veterinary hospital over a 7-year period, between 2015 and 2022. All patients included were client-owned cats and all investigations performed were clinically indicated procedures.
Ideally, a healthy control population would have been recruited; however, because of the retrospective nature of this study and UK regulations requiring all investigations to be clinically indicated, blood sampling from healthy animals was not feasible. An alternative approach, involving comparison of each patient’s biochemistry profile with their own historical results obtained when they were clinically healthy, has been proposed. 19 This method may enhance study comparability and address the limitation of RI changes. The major limitation from performing this approach was that the study was conducted in a veterinary referral facility where some cases did not return for follow-up at the same institution after treatment. As a result, the control population included 80 cats diagnosed with diseases considered unlikely to directly or indirectly affect the hepatic parenchyma, such as lower respiratory tract diseases (eg, feline chronic inflammatory bronchitis). However, the possibility of these control patients having concurrent subclinical hepatobiliary abnormalities cannot be definitively ruled out, as ancillary tests such as Tru-cut biopsy were not indicated and therefore not performed. To reduce the risk of concurrent hepatobiliary abnormalities, their clinical histories were carefully reviewed to exclude any suspicion of hepatobiliary disease. In addition, to account for age-related variations and conduct age-matched comparisons across hepatobiliary disease subgroups, cats of all ages were included, divided into four categories: <1 year, 1–5 years, 5–10 years and >10 years, with 20 cats in each group.
A total of 93 cats with definitively diagnosed hepatobiliary diseases were identified from the hospital clinical database. The definitive diagnosis was achieved through a combination of liver Tru-Cut/surgical wedge biopsies or abdominal colour Doppler ultrasound (for CPSS only). These cats were categorised based on their specific diagnosis, including cholangitis, neoplasia, FHL and CPSS. Only 22 cats with cholangitis were recruited to this study, with the majority exhibiting histological evidence of mixed inflammatory cell infiltration consistent with chronic neutrophilic cholangitis. Because of the inadequate sample size for statistical evaluation, the three subtypes of cholangitis defined by the WSAVA Liver Standardisation Group were assessed together. Notably, cholangitis was previously referred to as ‘cholangiohepatitis’; therefore, cats previously diagnosed with cholangiohepatitis were reclassified under the cholangitis category. Although there are several types of haematopoietic and non-haematopoietic hepatic neoplasms, including adenocarcinoma, lymphoma, adenoma and carcinoma, the small sample size for each tumour type was insufficient and all neoplasms were grouped and assessed together as a single category.
Inclusion criteria were implemented to enhance diagnostic accuracy and minimise confounding factors. Cats were recruited for this study only if their hepatobiliary disease was definitively diagnosed. The biopsy sample must have been obtained either via an ultrasound-guided Tru-Cut biopsy or a laparoscopic/laparotomy wedge biopsy. The biopsy slides must have been reviewed by either a board-certified pathologist or a clinical training scholar (resident) under supervision. The histopathology report must have been written or reviewed by the board-certified pathologist and clearly describe the hepatobiliary architectural changes, providing a definitive diagnosis consistent with the WSAVA standards for clinical and histological diagnosis.13,20,21 Hepatic portosystemic shunts were definitively diagnosed by abdominal ultrasound conducted by a board-certified imaging specialist or a clinical training scholar (resident) under supervision. A corresponding report outlining the findings and the diagnosis was required. Cats with only a presumptive diagnosis, lacking definitive histopathological or ultrasonographic results, were excluded from the study. The inclusion criteria requiring tissue biopsy presented challenges for patient recruitment, as the diagnosis of cholangitis was often based on clinical signs, ultrasonographic findings and bile aspirate rather than biopsy. This likely led to a higher prevalence of CPSS cases compared with other hepatobiliary diseases, as CPSS can be definitively diagnosed without a tissue biopsy. In addition, our hospital serves as a centre of excellence for the surgical management of canine and feline CPSS. Data from cats with recurrent hepatobiliary diseases were restricted to their initial presentation, during which biopsy or abdominal ultrasound was performed. This approach aimed to mitigate the potential influence of prior treatment on subsequent biochemistry results. Patients with comorbidities known to influence the hepatic biochemistry profile, such as hyperthyroidism (commonly diagnosed in geriatric cats and associated with increased ALT and ALP activity), were excluded from the study. 22
Medical record review
Cases underwent a comprehensive review. Information, including patient demographics (age, sex, breed), serum biochemistry tests results (ALT, ALP, GGT, TBIL, albumin, urea) and abdominal diagnostic imaging or histopathology findings were extracted from electronic medical records. Specifically, data relevant to this study were obtained from the initial diagnostic blood tests performed at the time of hospital admission, before the administration of any treatment. This approach was intended to minimise the potential influence of treatments on biochemistry results.
Hepatobiliary biomarkers
Because of a change in analyser, from the 650 Clinical Chemistry system (I-Lab) to the AU680 Clinical Chemistry Analyser (Beckman-Coulter) used by the hospital diagnostic laboratory in 2016, the RIs for hepatobiliary enzymes varied over the study period. To ensure that the absolute values held equivalent significance across all cases, the control and diseased patients were divided into two subsets: before and after the analyser change. The two subsets were then compared and statistically analysed using the non-parametric Mann–Whitney test to assess the consistency of statistically significant differences. Previous literature suggested that decreased hepatic enzymes are typically not considered clinically significant; therefore, results with hepatobiliary enzyme values below the RI were excluded. 5
For TBIL and synthetic markers such as urea and albumin, their exact concentrations were assessed together as the RIs showed minimal variation. Glucose was excluded because of incomplete records across many cases. Serum or plasma cholesterol were also excluded, as they can be influenced by dietary intake rather than hepatic synthesis alone. 9 Since most patients were not fasted before blood sampling, this posed a challenge with the interpretation of serum cholesterol results. In addition, although the liver synthesises cholesterol, it also excretes cholesterol into bile, complicating the interpretation of serum cholesterol concentrations; 9 therefore, cholesterol was not assessed in this study.
Cats were further categorised based on whether their biomarker values fell within or outside the RIs to assess the proportion of diseased cats presenting with abnormal results. For the other biomarkers, the RIs used by the diagnostic laboratory using the AU680 analyser were as follows: TBIL <5.1 µmol/l, albumin 25–45 g/l and urea 2.5–9.9 mmol/l (see Table S7 in the supplementary material).
Statistical analysis
A comparative analysis between the control and study populations was conducted to assess differences in hepatobiliary biomarkers between diseased and control cats. Data were presented as medians with interquartile ranges (IQRs). Because of the small sample size (n <30 for multiple hepatobiliary diseases) and the presence of strong outliers, normality could not be reliably assessed; therefore, non-parametric methods were used. Within each subgroup, results were ranked to obtain a mean rank. The non-parametric Kruskal–Wallis test, an ANOVA that does not assume a normal distribution of the underlying data, was used to evaluate differences in mean ranks across groups. 23 When a significant difference was found, Dunn’s post-hoc test was used for pairwise comparisons between the control group and each disease subgroup. Analyses were repeated without the control group to assess variations between different diseases. Categorical variables, such as cases with hepatobiliary analytes within or outside RIs, were reported as numbers and percentages. Group comparisons were performed using Pearson’s χ2 test. P <0.05 was considered statistically significant.
Results
Patient inclusion and signalment
A total of 173 cats were retrospectively included in this study, comprising 80 controls and 93 cats with hepatobiliary diseases. Among the study group, 22 cats had cholangitis, 18 had neoplasia, 14 were diagnosed with FHL and 39 had CPSS. A statistically significant difference in age distribution was observed between disease groups (P <0.01), whereas no significant difference in sex distribution was found (P = 0.19) (Table 1).
Demographic characteristics of 173 cats retrospectively recruited into the study

Age is expressed as median (interquartile range). Sex is expressed as the number of cats and percentage (%). ‘P value’ refers to statistical comparison of age and sex between the different study subgroups
P <0.05 is statistically significant
CPSS = congenital portosystemic shunt; FHL = feline hepatic lipidosis
The demographic characteristics of the patient population are summarised in Table 1. Overall, the most represented breeds were domestic shorthairs across all populations (n = 108, 62.42%), followed by British Shorthairs (n = 12, 5.18%), Ragdolls (n = 10, 5.20%) and domestic longhairs (n = 8, 4.15%). A comprehensive list of breeds can be found in Table S2 of the supplementary material.
Comparison of hepatobiliary markers between control and hepatobiliary cats
The median values of all hepatobiliary biomarkers are shown in Table 2. Because of the change in biochemistry analyser used by the laboratory, the RIs varied; therefore, the results for hepatobiliary enzymes in both control cats and those with hepatic diseases were analysed in two separate subsets. Significant differences were observed in all hepatobiliary biomarkers when comparing the various hepatic diseases with the control group (Table 2). Specific comparisons between the control group and each individual disease group are shown in Table 3. A comparison of control cats and those with hepatobiliary disease revealed that cats diagnosed with cholangitis and neoplasia had significantly different hepatobiliary biomarker profiles compared with cats without hepatobiliary diseases. Cats with FHL showed significant differences in all hepatobiliary biomarkers compared with control cats, with the exception of GGT activities. In contrast, cats with CPSS demonstrated significant differences only in ALP activity and albumin concentration when compared with the control cats. Statistical analysis confirmed no significant differences between the two subsets before and after the change in diagnostic laboratory analyser (Table 4). However, despite consistent statistical outcomes across both subsets, the mean rank differences were much greater after the analyser change. This is likely due to generally lower enzyme results before the switch. Specifically, in FHL cases, median ALT and ALP activities were significantly higher after the change to the new analyser.
Hepatobiliary biomarker results for each group

Data are median (interquartile range). Serum hepatobiliary enzyme levels are divided into two subsets before and after the change in analyser from I-Lab 650 to AU680 for all disease groups. ‘P value (incl)’ refers to statistical comparison of all groups including the control group, whereas ‘P value (excl)’ refers to statistical comparison of all disease groups excluding the control group
P <0.05 is statistically significant
ALP = alkaline phosphatase; ALT = alanine aminotransferase; CPSS = congenital portosystemic shunt; FHL = feline hepatic lipidosis; GGT = gamma-glutamyl transferase; TBIL = total bilirubin
Comparison of hepatobiliary biomarker results between controls and all hepatobiliary diseases

Serum hepatobiliary enzyme levels are divided into two subsets because of the change in analyser from I-lab 650 to AU680 for all disease groups. ‘Difference’ is the mean rank difference between control and hepatobiliary disease (control – disease subgroup). ‘P value’ refers to pairwise comparison between the mean rank of disease group and control group
P <0.05 is statistically significant
ALP = alkaline phosphatase; ALT = alanine aminotransferase; CPSS = congenital portosystemic shunt; FHL = feline hepatic lipidosis; GGT = gamma-glutamyl transferase; TBIL = total bilirubin
Comparison of hepatobiliary enzyme results before (I-Lab 650) and after (AU-680) the change of analyser to assess for whether results were consistent
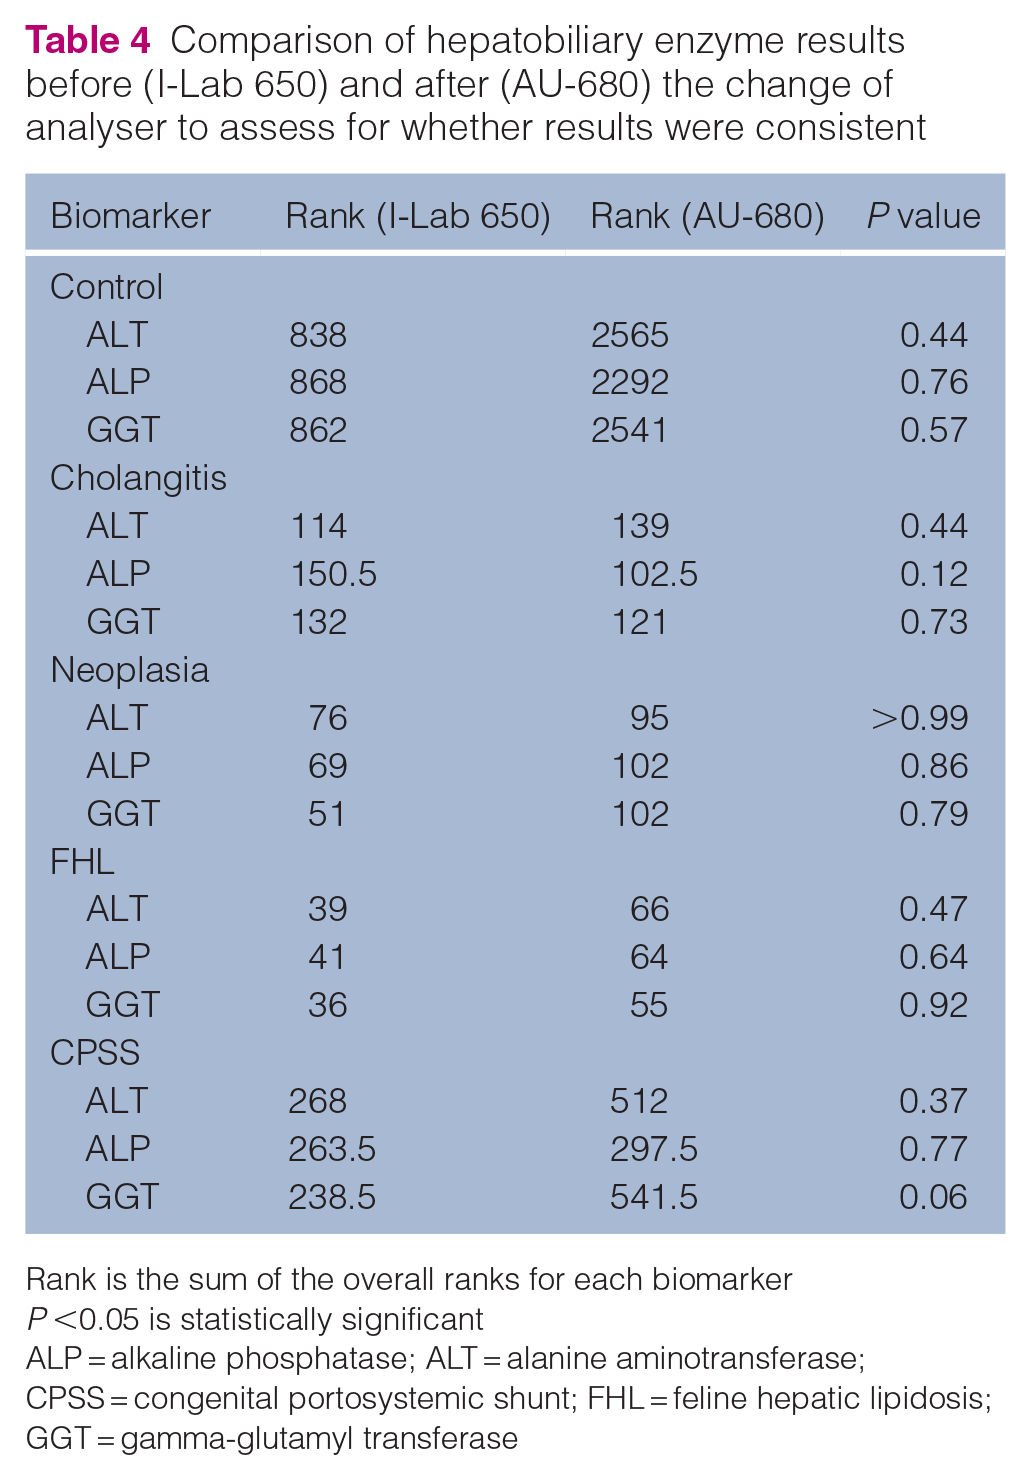
Rank is the sum of the overall ranks for each biomarker
P <0.05 is statistically significant
ALP = alkaline phosphatase; ALT = alanine aminotransferase; CPSS = congenital portosystemic shunt; FHL = feline hepatic lipidosis; GGT = gamma-glutamyl transferase
Among the three hepatobiliary-related enzymes, cats with CPSS had significantly elevated ALP activities compared with control cats, but no differences were observed in other hepatobiliary analytes. Prior veterinary literature has suggested that increased serum ALP activity can be a result of age-related factors. To validate this finding, an additional analysis was conducted comparing ALP activities between cats with CPSS and a control group matched for similar age. The CPSS and age-matched control subgroups were divided into pre- and post-analyser change cohorts for statistical comparison. No significant difference in ALP activity was observed between cats with CPSS and their age-matched controls (before: P = 0.23; after: P = 0.07). This finding suggests that the elevated ALP activity seen in cats with CPSS may be due to age-related factors; however, the subset of cats with CPSS recruited after the analyser change demonstrated a greater difference in median serum ALP activity compared with the control cats. This could be explained by the age of the cats: those recruited after the analyser change were younger (median age 0.66 years; range 0.50–1.04), whereas the cats recruited before the change were older (median age 0.79 years; range 0.50–0.91) (see Table S3 in the supplementary material). Younger cats were more likely to have higher levels of the bone isoform of ALP.
Comparison of hepatobiliary markers between hepatobiliary disease cats
Additional inter-disease comparisons were conducted for ALT and GGT activity, as well as TBIL concentration, revealing significant differences between the hepatobiliary disease groups when the control group was excluded (Table 2). Overall, no significant differences in biomarkers were observed between cats with cholangitis, neoplasia and FHL (Table 5). However, cats with cholangitis exhibited significant differences in ALT activity (before: P = 0.02; after: P < 0.01), GGT (before P < 0.01; after: P < 0.01) and serum TBIL concentration (P <0.01) compared with cats with CPSS. Cats in the neoplasia (P = 0.04) and FHL subgroups (P = 0.04) had significantly higher serum TBIL concentrations than cats with CPSS. No significant differences were found between the other disease groups.
Comparison of hepatobiliary biomarker results between different hepatobiliary diseases

Serum hepatobiliary enzyme levels are divided into two subsets because of the change in analyser from I-lab 650 to AU680 for all disease groups. ‘Difference’ is the mean rank difference between disease A and disease B (A – B). ‘P value’ refers to the pairwise comparison between the two disease subgroups’ mean rank
P <0.05 is statistically significant
ALP = alkaline phosphatase; ALT = alanine aminotransferase; CPSS = congenital portosystemic shunt; FHL = feline hepatic lipidosis; GGT = gamma-glutamyl transferase; TBIL = total bilirubin
Although statistical comparisons between different histological subtypes of cholangitis were not performed, the authors attempted to assess the potential differences in biochemistry profiles (see Table S1 in the supplementary material). The 22 cases were histopathologically classified according to WSAVA standards; cats with predominantly neutrophilic infiltration were classified as acute neutrophilic cholangitis (ANC; n = 3/22); those with mixed cell cholangitis and evidence of bile duct hyperplasia were classified as chronic neutrophilic cholangitis (CNC; n = 11/22); and those with lymphocytic infiltration and minimal or absent neutrophils were classified as lymphocytic cholangitis (LC; n = 8/22).13,24 Overall, a higher proportion of cats with CNC demonstrated more marked abnormalities on serum biochemistry compared with cats with LC or ANC. All cats with CNC had moderate to markedly elevated hepatobiliary enzymes and all had hyperbilirubinaemia. In contrast, cats with ANC demonstrated only mild or no abnormalities in their serum biochemistry profile, even those with severe ANC. Unlike ANC, which was consistently associated with unremarkable biochemistry results, the biochemical profile for LC was more varied. The serum biochemistry results ranged from all analytes falling within the RIs to markedly abnormal biochemical results.
In the neoplastic disease group, cats included in this study were diagnosed with B cell lymphoma (n = 5/22), T cell lymphoma (n = 7/22), hepatic carcinoid (n = 1/22), carcinoma (n = 2/22), adenoma (n = 2/22) and adenocarcinoma (n = 1/22). Cats with hepatic T cell lymphoma generally exhibited more abnormalities in hepatobiliary biochemistry analytes than those with B cell lymphoma. In addition, tumour grade did not correlate with the degree of biochemical analyte abnormalities seen. For example, a cat with hepatic small-cell low-grade T cell lymphoma had markedly elevated ALT activity (2143.5 U/l; RI 5.0–60.0) and hyperbilirubinaemia (86.1 µmol/l; RI <5.1), whereas a cat with high-grade T cell lymphoma had normal biochemistry results within the RIs. Cats with adenoma and carcinoma typically had abnormal ALT and ALP activity, but GGT activity and serum bilirubin remained within the RIs. In contrast, a cat with adenocarcinoma had significantly elevated bilirubin concentration (104.7 µmol/l; RI <5.1), a finding that differed from those observed in other hepatic epithelial neoplasms. However, because of the low sample size, the validity of this finding for all patients cannot be confirmed.
Comparison of hepatobiliary biomarker sensitivity
Evaluation of the proportion of cases with abnormal hepatobiliary biomarkers revealed that cats with cholangitis had the highest percentage of cases outside the RIs. Notably, almost all cats with cholangitis had elevated serum TBIL concentrations (n = 20/22, 90.90%). In contrast, cats with CPSS had the lowest percentage of cases outside the RIs, with the exception of ALP activity (Table 6).
Cases that are outside the reference interval for each disease
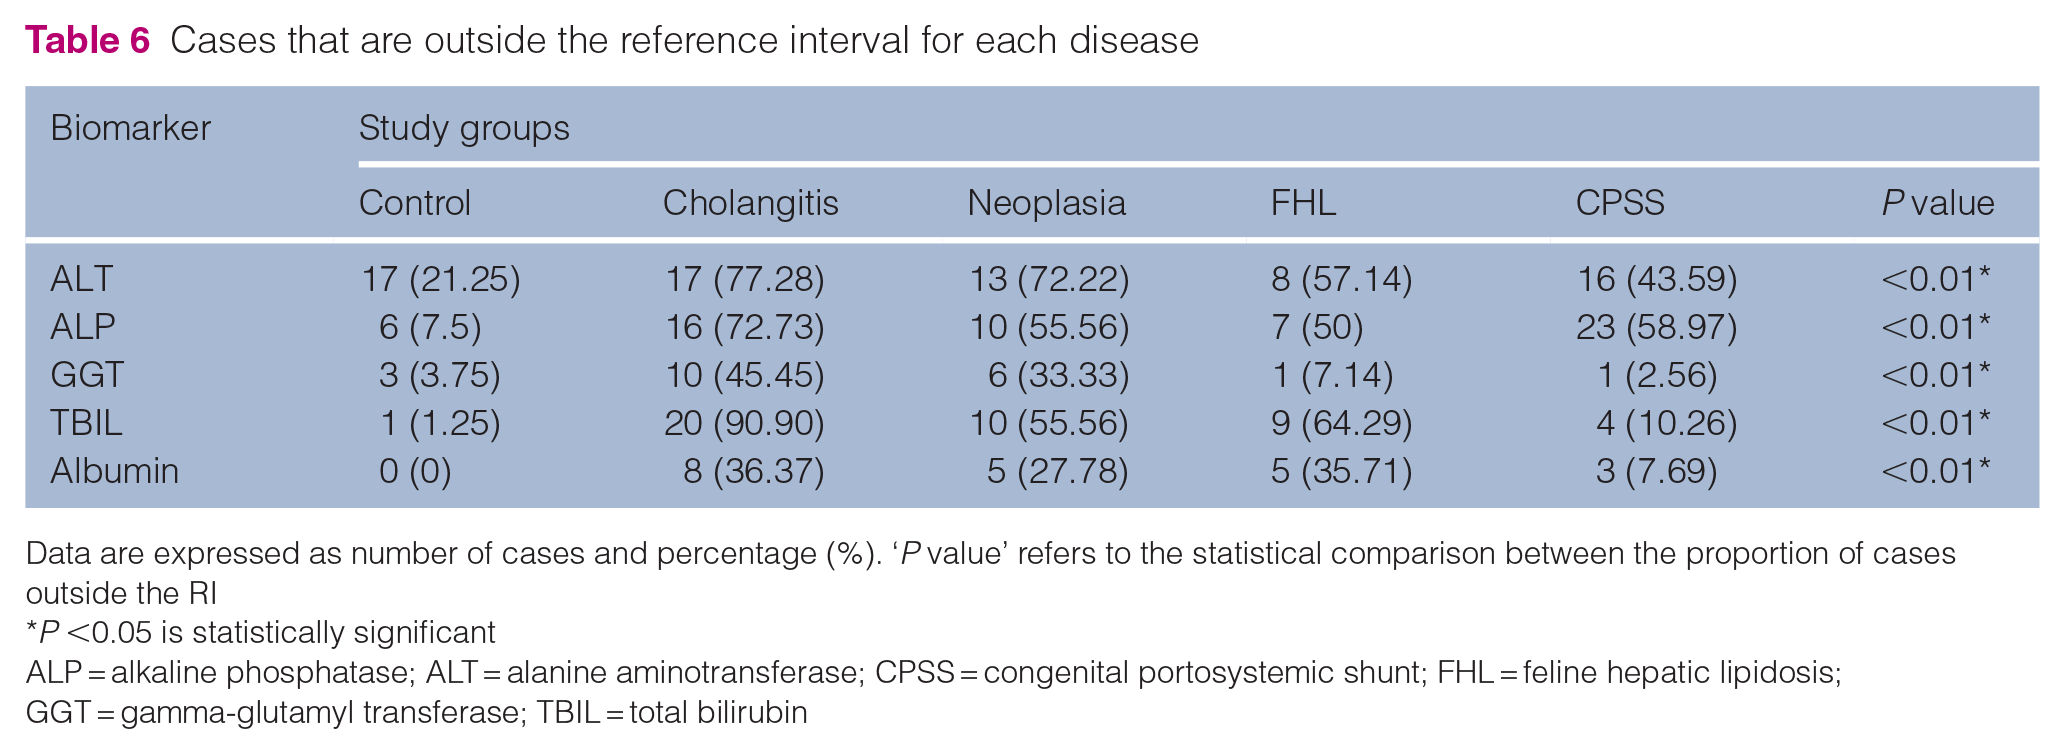
Data are expressed as number of cases and percentage (%). ‘P value’ refers to the statistical comparison between the proportion of cases outside the RI
P <0.05 is statistically significant
ALP = alkaline phosphatase; ALT = alanine aminotransferase; CPSS = congenital portosystemic shunt; FHL = feline hepatic lipidosis; GGT = gamma-glutamyl transferase; TBIL = total bilirubin
When comparing the sensitivity of hepatobiliary enzymes in detecting hepatobiliary diseases, ALT was the most sensitive enzyme (Table 6). ALT was the most sensitive enzyme for diagnosing all diseases except CPSS. Cats with cholangitis and FHL had slightly fewer cases with elevated ALP activities, while cats with neoplasia showed significantly fewer cases with elevated serum ALP. GGT had the lowest percentage of cases above the RI, particularly in cats with FHL and CPSS, where almost no cats in these groups had abnormal GGT activity. Table S4 in the supplementary material shows a visual comparison of hepatobiliary enzyme sensitivity.
Among the two markers more indicative of liver function, TBIL concentration demonstrated significantly greater sensitivity than albumin concentration (Table 6). TBIL levels were elevated in over half of the cases with hepatobiliary disease, except for CPSS. In contrast, none of the disease groups had more than 50% of cases with abnormal serum albumin concentrations, indicating that most affected cats maintained albumin levels within the RI.
Urea
All cats had urea concentrations within the RI. As a result of the lack of significant results, urea was excluded from further statistical analysis (see Table S6 in the supplementary material).
Discussion
This study demonstrated significant differences in hepatobiliary biochemical variables between cats with hepatobiliary diseases and control cats, as well as variations in biomarker profiles among different hepatobiliary disease groups.
Cats with hepatobiliary diseases had significantly different hepatobiliary enzyme activities, TBIL and albumin concentrations compared with control cats, suggesting high sensitivity in detecting hepatobiliary diseases. This finding supports a previous discussion about methods for diagnosing liver diseases in companion animals, which suggests that serum biochemistry is highly effective at detecting hepatobiliary diseases, with only a few patients being missed. 7 In addition, a review of the laboratory evaluation of the liver stated that serum hepatobiliary enzymes, such as ALP, cannot be induced by corticosteroids in cats, and other isoforms, such as kidney, intestinal and placental ALP, have a short half-life of less than 2 mins. This makes ALP relatively more liver-specific, with enzyme activity elevation often roughly proportional to disease severity. 25 A study on biochemical abnormalities in canine blood further supports this, demonstrating that ALP appears less specific in dogs than cats because of lack of steroid-induced isoform in the latter. 26 Moreover, the short half-life of hepatobiliary enzymes in cats meant that serum elevation of these analytes is often clinically relevant, with a reported sensitivity of 85%. 25
Hepatobiliary biomarkers are not 100% specific for hepatobiliary diseases. Notably, 17/80 (21.25%) control cats in this study had abnormal ALT activity results. This finding highlights the poor specificity of hepatobiliary enzymes, as previously noted in the literature. 1 In that study, the specificity of ALT activity was 80% in 66 cats confirmed not to have liver disease via liver biopsy, that is, 20% of cats without liver disease had increased ALT activities. 1 In addition, clinical biochemical analytes can vary because of intrinsic heterogeneity among patients, which may contribute to analytical imprecision. A previous study of biological variations of ALT activities in cats found high variability between individuals. 5 A study investigating the biological variation of biochemistry analytes in cats found that ALT activity exceeded the upper RI on two occasions during 6-weekly blood testing in a clinically healthy cat. 27 Furthermore, clinical interpretation of biochemistry assays is guided by RIs derived from the central 95th percentile of a healthy reference population, meaning that 5% of healthy individuals will fall outside this range. 25 Because of the retrospective nature of this study, subject-based RIs could not be determined from a healthy control population. Instead, population- based RIs were used, which do not account for biological intra-individual variations in analyte levels.
There was no significant difference in biochemical analytes between cats with cholangitis and those with hepatic neoplasia; however, both groups differed significantly from controls. This suggests that these two diseases may share a similar biochemical profile. This finding underscores the need for further diagnostic testing, such as histopathologic examination for accurate differentiation between these diseases. A possible explanation for this biochemical overlap is selection bias for hepatic lymphoma. In this study, 11/18 (61%) cats with non-metastatic hepatic neoplasia were diagnosed with hepatic lymphoma, representing the majority of the sample population. Previous studies on the histopathological patterns of lymphoma and lymphocytic cholangitis/portal hepatitis have shown that both conditions predominate with periportal and centrilobular infiltration by small T cell lymphocytes, which may be difficult to differentiate.28,29 Although not documented in the veterinary literature, a similar histomorphology between the two diseases could potentially explain the overlapping biochemical profiles observed. 29 In addition, although it is unknown whether lymphocytic cholangitis can progress to hepatic lymphoma in animals, chronic inflammatory conditions can potentially increase the risk of lymphoma, as seen in chronic enteritis and intestinal lymphoma.28,30 Therefore, the high prevalence of hepatic lymphoma in this study may not fully represent all hepatic neoplasms and may contribute to the biochemical similarities observed with cholangitis.
Patients with neoplastic diseases had a lower proportion of cases with abnormal ALP activity and TBIL concentration compared with those with cholangitis, however. Over 90% of cholangitis patients had abnormal TBIL concentrations, whereas only 56% (n = 10/18) of cats with hepatic neoplasia were affected. This difference in serum TBIL concentrations may be attributed to differences in disease pathophysiology between hepatic and post-hepatic conditions. A retrospective study investigating hyperbilirubinaemia severity in cats with pre-hepatic, hepatic and post-hepatic conditions demonstrated that 10.7% (n = 23/216) of cats with hepatic parenchymal diseases, including hepatic neoplasia (n = 13/23), were hyperbilirubinaemic. In contrast, 25.4% of cats with post-hepatic biliary diseases (n = 41/55), such as cholangitis (n = 41/55), showed elevated serum bilirubin. In addition, the median bilirubin concentration in cats with hepatic causes was lower (2.4 mg/dl) than in cats with post-hepatic causes (3.92 mg/dl). 8 A study on cats with suppurative cholangitis also found that more than 80% of cats were hyperbilirubinaemic. 31 Regarding ALP activity, 73% (n = 16/22) of cholangitis cats had activity above the RI compared with 56% (n = 10/18) of cats with hepatic neoplasia. Although a higher proportion of cholangitis cats had increased ALP activity, this difference was not statistically significant. A retrospective study on feline primary malignant liver tumours found that 42.1% (n = 16/38) of cats had elevated ALP. However, that study only looked at non-haemopoietic liver neoplasms, and thus may not reflect the findings of the present study, which also included haemopoietic neoplasms such as hepatic lymphoma. 32 In contrast, another study found that 63% of cats with suppurative cholangitis had increased ALP activity, and noted ALP as a discriminating survival metric. 31
There are several findings regarding FHL that maybe aid in its diagnosis and distinguish it from other hepatobiliary disorders. 18 In FHL cases, only GGT activity did not significantly differ from control values. A retrospective study of severe FHL found that despite at least a two-fold increase in ALP and ALT activity, GGT activity was normal or mildly elevated. This contrasts with other hepatobiliary disorders, which typically cause marked increases in GGT activity.18,33 The present study supports this enzymatic profile, suggesting that a combination of elevated ALP and ALT activity, elevated TBIL concentration and normal to mildly increased GGT activity may heighten clinical suspicion of FHL. 18 However, only approximately 50% of FHL cases showed abnormal ALT and ALP activity. Previous studies have indicated that ALT activity in FHL is usually mildly to moderately elevated, whereas marked elevations in ALT are typically observed in primary hepatobiliary diseases such as cholangitis and neoplasia, which is in agreement with the findings of this study. 34 For ALP, a bimodal distribution was observed, with 5/14 cats showing substantially increased ALP activity, resulting in a wide IQR (see Table S2 in the supplementary material). One possible explanation for this bimodal distribution may be the clinicopathological differences between idiopathic and secondary FHL. A previous study noted that cats with spontaneous idiopathic FHL had significantly higher ALP activity than those with secondary FHL. 33 However, further studies looking at subgrouping FHL into idiopathic or secondary are required to validate this explanation.
Certain hepatic diseases such as CPSS had minimal changes in hepatic analytes. This result is consistent with a study looking at ameroid ring constrictor management for extrahepatic portosystemic shunts in cats. Preoperative evaluation of cats with extrahepatic portosystemic shunts demonstrated that hepatic biochemical analytes were typically mild or largely unremarkable. 35 A proposed explanation for the lack of enzymopathy seen in CPSS is that hepatocellular atrophy affecting liver function occurs very gradually after the onset of overt clinical signs. 17 The increase in ALP observed in this study is likely unrelated to the hepatobiliary disease. In growing animals, increased osteoblastic activity is associated with elevated serum concentrations of the bone isoform of ALP. Although this increase is typically under five-fold compared with adult levels, elevations of up to 12-fold have been reported.1,5 When comparing ALP between cats with CPSS and control cats of a similar age, no significant difference was found, further suggesting that the elevated ALP activity is likely age-related (see Table S3 in the supplemetary material). However, ALP activity in cats with CPSS particularly after the RI changed had wider variations, hypothesising that some elevations may not be solely age-related. Currently, there is no clear explanation, but a previous study found that 48% of cats with extrahepatic portosystemic shunting exhibited mildly increased ALP activities. 35 The proposed explanation for this was reduced hepatic perfusion leading to hypoxic cellular damage and enzyme leakage; however, no other plasma membrane enzyme was altered at the subcellular level.17,35,36 Regarding albumin, only 8% of cats were hypoalbuminaemic. This is very different from canine CPSS, where hypoalbuminaemia is a key clinicopathological feature. Hypoalbuminaemia and hypoproteinaemia were reported in 50% of dogs with CPSS, whereas only 15% of cats had low albumin concentrations. 36 Overall, these findings suggest that because of minimal biomarker changes seen in patients with CPSS, serum biochemistry has limited diagnostic value, at least in ruling out the diagnosis.
Of all the enzymes, ALT had the highest sensitivity for detecting hepatobiliary diseases in this study (Table 6). Cytosolic enzymes like ALT, located in the soluble cytosolic fraction of hepatocytes, allow easier access to vascular compartments even with minor changes, compared with membrane-bound enzymes or enzymes within organelle. This results in a more rapid release with minimal insults.1,7 The greatest elevation in ALT activity occurs with hepatocellular inflammation, with a sensitivity of 81% for cholangitis syndrome in cats. 1 In this study, ALP was identified as the second most sensitive enzyme for detecting hepatobiliary disease, while GGT had the lowest sensitivity (Table 6). This contrasts with a previous study in cats, where GGT was reported to have a superior sensitivity of 86% compared with ALP at 50% for hepatobiliary disorders. 1 However, one study cited that the majority of cats with severe cholangitis had GGT activities within the RI. 24 This is in comparison with dogs, where a study suggested that ALP had a higher sensitivity of 80% for hepatobiliary diseases, while the GGT sensitivity was lower at 50%. 36
TBIL was found to be highly sensitive for detecting cholangitis, moderately sensitive for neoplasia and FHL, but less sensitive for CPSS. As mentioned, hyperbilirubinaemia was a predominant finding in cats with cholangitis, whereas its presence was more variable in cats with neoplasia. In cats with FHL, serum TBIL concentration were similar to those with neoplasia, with more than 50% of FHL cats exhibiting hyperbilirubinaemia. However, FHL cats that were hyperbilirubinaemic had markedly elevated TBIL concentrations. The variability in TBIL concentrations among FHL cats can potentially be attributed to different types of lipidosis. 33 Therefore, the magnitude of increase may potentially help differentiate the type of FHL; however, this differentiation was not within the scope of the present study.
The higher proportion of diseased cats with albumin concentrations within the RI compared with those with results outside the RI suggests that albumin has a low sensitivity for detecting feline hepatobiliary disease. It is worth noting that no cats had urea concentrations outside the RIs. This finding is supported by a previous study indicating that, unlike dogs, cats rarely have decreased synthetic markers like albumin unless liver failure is severe and hepatocyte function is markedly impaired. 37 As a result, reductions in synthetic markers due to impaired hepatocyte function are unlikely to be a predominant clinicopathological feature in cats unless end-stage liver failure is present. Therefore, albumin concentration lacks sensitivity for detecting early to mid-stage hepatobiliary disease in cats.
This study has some limitations. First, the categorisation of the study population was highly generalised, which may have overlooked variations. Within each disease group, patients exhibited varying histopathological features, severity and chronicity, all factors that can significantly influence biochemical profiles. Previous studies in dogs suggest that different types of hepatocellular neoplasms can exhibit distinct biochemical patterns; for example, sarcoma may present with lower ALT activity compared to carcinomas. 38 Similar variations may exist in feline hepatobiliary diseases but remains underexplored. The impact of chronicity was also evidenced by a study on feline cholangitis, where median GGT activity was found to be significantly higher in cats with chronic neutrophilic cholangitis compared with cats with acute neutrophilic cholangitis. 24 In FHL, a previous study revealed clinicopathological differences between idiopathic spontaneous and secondary FHL, especially with ALP. 36 These findings, which indicate that different histological subtypes of various diseases can exhibit varied biochemical profiles, suggest that the highly generalised categorisation in this study may be inappropriate. In addition, diagnostic investigations such as abdominal ultrasound and histopathology were not performed in control cats unless clinically indicated; therefore, we cannot definitively confirm whether they are free from hepatobiliary disease. Previous literature on cholangiohepatitis suggests that because of the large reserve capacity of the liver, patients may not show apparent clinical abnormalities until significant liver function is affected. 23 If these control cats have subclinical undetected hepatobiliary abnormalities, this may have an impact on the reliability of the results of this study. Therefore, future studies should include control cats with at least normal abdominal ultrasonography findings, suggesting it is unlikely have hepatobiliary changes; however, this in itself is problematic as hepatic ultrasound cannot rule out the presence of inflammatory parenchymal changes. Finally, the small sample size and the referral-based nature of the study population may limit the generalisability of the findings. Case recruitment required definitive diagnoses confirmed via biopsy (or ultrasound for CPSS), excluding patients that were presumptively diagnosed and treated accordingly. For conditions like FHL and neoplasia, each group included fewer than 20 cases per disease category, reducing statistical power. As a result of the small sample size, diseases such as neoplasia and cholangitis could not be subgrouped based on their histopathological classification, which may have influenced the study results. 13 Specifically, when comparing cats with neoplasia and cholangitis, it is suggested that feline hepatic lymphomas share histomorphologically similarities with lymphocytic cholangitis. Although the impact of this similarity on serum biochemistry has not been documented, a poorly distinguishing pattern of lymphocytic infiltration may contribute to the overlapping biochemistry profile between the two diseases.28,29 Future studies, with a more refined categorisation of study population (considering disease chronicity, histopathologic features and classification), rigorous exclusion of subclinical hepatobiliary morbidities in control and efforts to increase sample size, will be needed to enhance study applicability.
Conclusions
The findings of this study underscore the value of serum biochemistry as a diagnostic tool for cats with hepatobiliary diseases. However, because of the wide variations in analyte sensitivity, a definitive diagnosis cannot be made based on the biochemistry profile in isolation. Instead, a comprehensive approach, including patient history, clinical findings and additional diagnostic tests, such as haematology, acute phase proteins, abdominal ultrasound or hepatic tissue biopsies, is necessary for a conclusive diagnosis. Future studies should aim to subclassify these disorders based on chronicity and histopathological classifications to improve the utility of this study in clinical practice.
Supplemental Material
Table S1a (raw data): A table showing patient signalment (age, sex, breed), diagnosis and all biochemistry results for control cats (n = 80).
Table S1b (raw data): A table showing patient signalment (age, sex, breed), histopathological findings and all biochemistry results for cats with cholangitis (n = 22).
Table S1c (raw data): A table showing patient signalment (age, sex, breed), histopathological findings and all biochemistry results for cats with neoplasia (n = 18).
Table S1d (raw data): A table showing patient signalment (age, sex, breed), histopathological findings and all biochemistry results for cats with hepatic lipidosis (n = 14).
Table S1e (raw data): A table showing patient signalment (age, sex, breed), abdominal ultrasound findings and all biochemistry results for cats with CPSS (n = 39).
Table S2: A table showing the breed distribution of 173 cats that were retrospectively recruited to this study.
Table S3a: A table to show non-parametric unpaired Mann–Whitney test results for comparing ALP before reference interval change between control cats and those with CPSS of similar age.
Table S3b: A table to show non-parametric unpaired Mann–Whitney test results for comparing ALP after reference interval change between control cats and those with CPSS of similar age.
Figure S3c: Scatter dot plot illustrating ALP results before (left) and after (right) change in reference interval for control cats (n = 20) and those with CPSS (n = 39) of similar age.
Figure S4: Graph illustrating the percentage of cases (%) with results above the reference interval between the disease groups for each hepatobiliary enzyme.
Table S5a: A table to show mean, median concentration and standard deviation of urea for each group (in mmol/l).
Figure S5b: Scatter dot plot illustrating urea results (expressed as mmol/l) in control cats (n = 80) and those with cholangitis (n = 22), neoplasia (n = 18), FHL (n = 14) and CPSS (n = 39).
Table S5c: A table to show the number and percentage (n, %) of cases that are within the reference interval (within RR) and below the lower limit of the reference interval.
Table S6: Table summarising the assay used for hepatobiliary enzymes by the diagnostic laboratory with I-Lab 650 (before 2016) and AU-680 (after 2016) analyser.
Table S7: Table summarising the imprecision data for I-Lab 650 (before 2016) and Beckman Au680 (after 2016).
Figure S8a: Graph showing the statistical comparison for ALT using the Bland–Altman test to compare the I-Lab 650 (before 2016) and AU680 (after 2016) using percentages.
Figure S8b: Graph showing the statistical comparison for ALT using the Bland–Altman test to compare the I-Lab 650 (before 2016) and AU680 (after 2016) using absolute values.
Figure S8c: Graph showing the statistical comparison for ALT using Passing Bablok fit to compare the I-Lab 650 (before 2016) and AU680 (after 2016) using absolute value.
Figure S8d: Graph showing the statistical comparison for ALP using the Bland–Altman test to compare the I-Lab 650 (before 2016) and AU680 (after 2016) using percentages.
Figure S8e: Graph showing the statistical comparison for ALP using the Bland–Altman test to compare the I-Lab 650 (before 2016) and AU680 (after 2016) using absolute values.
Figure S8f: Graph showing the statistical comparison for ALP using Passing Bablok fit to compare the I-Lab 650 (before 2016) and AU680 (after 2016) using absolute values.
Figure S8g: Graph showing the statistical comparison for GGT using the Bland–Altman test to compare the I-Lab 650 (before 2016) and AU680 (after 2016) using percentages.
Figure S8h: Graph showing the statistical comparison for GGT using the Bland–Altman test to compare the I-Lab 650 (before 2016) and AU680 (after 2016) using absolute values.
Figure S8i: Graph showing the statistical comparison for GGT using Passing Bablok fit to compare the I-Lab 650 (before 2016) and AU680 (after 2016) using absolute values.
Figure S8j: Graph showing the statistical comparison for TBIL using the Bland–Altman test to compare the I-Lab 650 (before 2016) and AU680 (after 2016) using percentages.
Figure S8k: Graph showing the statistical comparison for TBIL using the Bland–Altman test to compare the I-Lab 650 (before 2016) and AU680 (after 2016) using absolute values.
Figure S8l: Graph showing the statistical comparison for TBIL using Passing Bablok fit to compare the I-Lab 650 (before 2016) and AU680 (after 2016) using absolute values.
Figure S8m: Graph showing the statistical comparison for albumin using the Bland–Altman test to compare the I-Lab 650 (before 2016) and AU680 (after 2016) using percentages.
Figure S8n: Graph showing the statistical comparison for albumin using the Bland–Altman test to compare the I-Lab 650 (before 2016) and AU680 (after 2016) using absolute values.
Figure S8o: Graph showing the statistical comparison for albumin using Passing Bablok fit to compare the I-Lab 650 (before 2016) and AU680 (after 2016) using absolute values.
Footnotes
Author note
This paper was presented in part at the 2024 WSAVA Congress.
Supplementary material
The following files are available as supplementary material:
Table S1a (raw data): A table showing patient signalment (age, sex, breed), diagnosis and all biochemistry results for control cats (n = 80).
Table S1b (raw data): A table showing patient signalment (age, sex, breed), histopathological findings and all biochemistry results for cats with cholangitis (n = 22).
Table S1c (raw data): A table showing patient signalment (age, sex, breed), histopathological findings and all biochemistry results for cats with neoplasia (n = 18).
Table S1d (raw data): A table showing patient signalment (age, sex, breed), histopathological findings and all biochemistry results for cats with hepatic lipidosis (n = 14).
Table S1e (raw data): A table showing patient signalment (age, sex, breed), abdominal ultrasound findings and all biochemistry results for cats with CPSS (n = 39).
Table S2: A table showing the breed distribution of 173 cats that were retrospectively recruited to this study.
Table S3a: A table to show non-parametric unpaired Mann–Whitney test results for comparing ALP before reference interval change between control cats and those with CPSS of similar age.
Table S3b: A table to show non-parametric unpaired Mann–Whitney test results for comparing ALP after reference interval change between control cats and those with CPSS of similar age.
Figure S3c: Scatter dot plot illustrating ALP results before (left) and after (right) change in reference interval for control cats (n = 20) and those with CPSS (n = 39) of similar age.
Figure S4: Graph illustrating the percentage of cases (%) with results above the reference interval between the disease groups for each hepatobiliary enzyme.
Table S5a: A table to show mean, median concentration and standard deviation of urea for each group (in mmol/l).
Figure S5b: Scatter dot plot illustrating urea results (expressed as mmol/l) in control cats (n = 80) and those with cholangitis (n = 22), neoplasia (n = 18), FHL (n = 14) and CPSS (n = 39).
Table S5c: A table to show the number and percentage (n, %) of cases that are within the reference interval (within RR) and below the lower limit of the reference interval.
Table S6: Table summarising the assay used for hepatobiliary enzymes by the diagnostic laboratory with I-Lab 650 (before 2016) and AU-680 (after 2016) analyser.
Table S7: Table summarising the imprecision data for I-Lab 650 (before 2016) and Beckman Au680 (after 2016).
Figure S8a: Graph showing the statistical comparison for ALT using the Bland–Altman test to compare the I-Lab 650 (before 2016) and AU680 (after 2016) using percentages.
Figure S8b: Graph showing the statistical comparison for ALT using the Bland–Altman test to compare the I-Lab 650 (before 2016) and AU680 (after 2016) using absolute values.
Figure S8c: Graph showing the statistical comparison for ALT using Passing Bablok fit to compare the I-Lab 650 (before 2016) and AU680 (after 2016) using absolute value.
Figure S8d: Graph showing the statistical comparison for ALP using the Bland–Altman test to compare the I-Lab 650 (before 2016) and AU680 (after 2016) using percentages.
Figure S8e: Graph showing the statistical comparison for ALP using the Bland–Altman test to compare the I-Lab 650 (before 2016) and AU680 (after 2016) using absolute values.
Figure S8f: Graph showing the statistical comparison for ALP using Passing Bablok fit to compare the I-Lab 650 (before 2016) and AU680 (after 2016) using absolute values.
Figure S8g: Graph showing the statistical comparison for GGT using the Bland–Altman test to compare the I-Lab 650 (before 2016) and AU680 (after 2016) using percentages.
Figure S8h: Graph showing the statistical comparison for GGT using the Bland–Altman test to compare the I-Lab 650 (before 2016) and AU680 (after 2016) using absolute values.
Figure S8i: Graph showing the statistical comparison for GGT using Passing Bablok fit to compare the I-Lab 650 (before 2016) and AU680 (after 2016) using absolute values.
Figure S8j: Graph showing the statistical comparison for TBIL using the Bland–Altman test to compare the I-Lab 650 (before 2016) and AU680 (after 2016) using percentages.
Figure S8k: Graph showing the statistical comparison for TBIL using the Bland–Altman test to compare the I-Lab 650 (before 2016) and AU680 (after 2016) using absolute values.
Figure S8l: Graph showing the statistical comparison for TBIL using Passing Bablok fit to compare the I-Lab 650 (before 2016) and AU680 (after 2016) using absolute values.
Figure S8m: Graph showing the statistical comparison for albumin using the Bland–Altman test to compare the I-Lab 650 (before 2016) and AU680 (after 2016) using percentages.
Figure S8n: Graph showing the statistical comparison for albumin using the Bland–Altman test to compare the I-Lab 650 (before 2016) and AU680 (after 2016) using absolute values.
Figure S8o: Graph showing the statistical comparison for albumin using Passing Bablok fit to compare the I-Lab 650 (before 2016) and AU680 (after 2016) using absolute values.
Conflict of interest
The authors declared no potential conflicts of interest with respect to the research, authorship, and/or publication of this article.
Funding
The authors received no specific grant from any funding agency in the public, commercial, or not-for-profit sectors.
Ethical approval
This work did not involve the use of animals and therefore ethical approval was not necessarily required for publication in JFMS.
Informed consent
Informed consent (verbal or written) was obtained from the owner or legal custodian of all animal(s) described in this work (experimental or non-experimental animals, including cadavers, tissues and samples) for all procedure(s) undertaken (prospective or retrospective studies). No animals or people are identifiable within this publication, and therefore additional informed consent for publication was not required.
References
Supplementary Material
Please find the following supplemental material available below.
For Open Access articles published under a Creative Commons License, all supplemental material carries the same license as the article it is associated with.
For non-Open Access articles published, all supplemental material carries a non-exclusive license, and permission requests for re-use of supplemental material or any part of supplemental material shall be sent directly to the copyright owner as specified in the copyright notice associated with the article.