
Abstract
Objectives
Stress-induced transient hyperglycaemia may complicate the diagnosis of disease-related hyperglycaemia in cats during hospital visits. This study aimed to define the optimal acclimatisation period for reliable blood glucose measurements and determine the effect of hospital stress on physiological (heart rate [HR] and respiratory rate [RR]), behavioural (Cat Stress Score [CSS]) and metabolic (glucose, cortisol, total thyroxine [TT4] and bile acids [BA]) variables in cats.
Methods
A total of 10 healthy cats were evaluated at home and during hospitalisation. Blood glucose was measured hourly for 10 h after withholding food. HR, RR and CSS were determined at T01, T04 and T10. Serum cortisol, TT4 and BA were evaluated at T01 and T10.
Results
Stress-induced hyperglycaemia was observed in the hospital. The acclimatisation cut-off time for the cats’ return to euglycaemia was 6 h. Cats with hyperglycaemia had a higher CSS than cats with euglycaemia (P <0.001). Elevated HR, RR, CSS, glucose and cortisol concentrations were observed in cats at the hospital compared with those at home (P <0.001), while BA concentrations were significantly lower at the hospital (P <0.001). Significant interactions between time and place were identified for CSS, cortisol, BA concentrations (P <0.001) and glucose (P = 0.009). Notably, CSS and concentrations of cortisol remained stable when the cats were at home but decreased over time in the hospital. Conversely, BA concentrations were stable during the period in the hospital but decreased over time at home. There was a moderate positive correlation for serum cortisol and CSS (ρ = 0.6621; P <0.001) and for blood glucose (ρ = 0.4999, P <0.001).
Conclusions and relevance
Stress from hospital visits impacts clinical and laboratory results in cats. Our study would suggest that healthy cats that experience stress-induced hyperglycaemia should be acclimatised for at least 6 h before re-evaluation. Similar studies in sick cats should be conducted.
Introduction
Previous evidence suggests that stress associated with hospital visits affects physiological and behavioural parameters and also impacts certain laboratory results in cats.1 –5 Identifying the actual illness in a stressed patient poses a challenge for clinicians worldwide. Alterations in heart rate (HR), respiratory rate (RR), systolic blood pressure, body temperature, concentrations of blood glucose and cortisol, leukogram and behaviour have been described in cats during hospital visits.2 –6 Exposure to stressors triggers a complex endocrine and sympathetic response, involving the sympathetic–adrenal–medullary (SAM) and the hypothalamic–pituitary–adrenal (HPA) axes. During stress, catecholamines (norepinephrine [noradrenaline] and epinephrine [adrenaline]) are released from the adrenal medulla via the SAM axis. Catecholamines elevate HR, RR, blood pressure and other sympathetic parameters. Glucocorticoid hormones, which are released from the adrenal cortex through the HPA axis, impact a wide range of metabolic processes, including gluconeogenesis, lipolysis and protein degradation.5 –8 Stress also affects the regulation of thyroid hormones, the digestive tract and the biliary system.7,9,10 Reports have noted decreased serum bile acids (BA) concentrations and changes in gastrointestinal and gallbladder motility across various species under stress conditions.7,11 –13 However, no studies have evaluated BA concentrations in cats experiencing acute stress due to a hospital visit.
Measuring blood glucose in medical facilities is challenging because of stress-induced transient hyperglycaemia in cats.14 –16 Several reports have noted overlapping blood glucose concentrations in diabetic and stress conditions,8,14,16 making differentiation during hospital visits formidable. Misinterpreting hyperglycaemia may result in unnecessary treatment or poor diabetes mellitus management. To the authors’ knowledge, an established acclimatisation period for reliable blood glucose measurement in cats during hospital visits has not yet been determined. In addition, there is no specific non-invasive method to monitor stress-induced hyperglycaemia, aside from invasive blood sampling. Behavioural changes, such as visible aggression or agitation, can indicate the presence of stress-induced hyperglycaemia. 15 The Cat Stress Score (CSS), along with blood glucose measurement, may help identify stress-induced hyperglycaemia. In addition, stress due to a hospital visit on a cat’s physiological (HR and RR), behavioural (CSS) and metabolic parameters (concentrations of blood glucose, serum cortisol, total thyroxine [TT4] and BA) have not been studied together.
Therefore, the aims of this study were as follows: (1) to define the optimal acclimatisation period for obtaining reliable blood glucose measurements during hospital visits in healthy cats; (2) to evaluate and compare the physiological, behavioural and metabolic variables in cats at home and compare them with those during hospitalisation; and (3) to identify the relationships between these parameters. We hypothesised that stress develops during hospital visits, which in turn has physiological consequences, such as increased HR and RR, as well as behavioural consequences, such as an increased CSS. Furthermore, we hypothesised that hospital-induced stress will lead to increased blood glucose and serum cortisol concentrations and decreased serum TT4 and BA concentrations.
Materials and methods
Animals
This study included 10 veterinarian-owned cats. Approval was obtained from Kasetsart University Institutional Animal Care and Use Committee (reference number ACKU67-VET-037) and owner consent was provided. All cats were clinically healthy based on their medical histories, physical examinations and analyses of their haematological and serum biochemical parameters (ie, blood urea nitrogen, creatinine, glutamate pyruvate transaminase activity, total protein and albumin). All cats tested negative for feline leukaemia virus antigen and feline immunodeficiency virus antibody using a commercially available immunoassay kit (SNAP Feline Triple; IDEXX Laboratories). There were five intact male and five intact female cats with a median body weight of 4.3 kg (range 2.9–4.5) and a median age of 2.1 years (range 1.2–3.1). The breeds included seven British Shorthairs, two Scottish Folds and one Munchkin. All cats were familiar with their home environment and the owner.
Experimental protocol
The experiments lasted 10 h after feeding (designated as T1–T10) and were conducted at the cats’ homes and at an International Cat Care-accredited Cat Friendly Clinic in a veterinary teaching hospital (Kasetsart University Veterinary Teaching Hospital, Bangkhen Campus, Bangkok, Thailand). Each cat was initially evaluated in its home environment, followed by a second evaluation in the hospital environment with a 3–5-day washout period in between. Approximately 0.6–0.7 fold of the resting energy requirement (70 × body weight0.75), in the form of commercial maintenance diets, were offered to each of the cats. After 30 mins of feeding, the leftover food was removed, but water was freely accessible throughout the study. Examinations at home were conducted by the cats’ owner, who was a licensed veterinarian, while hospital examinations were performed by a well-trained veterinarian. None of the cats were handled or comforted by the owner during the 10-h hospitalisation. To minimise stress, all the procedures adhered to established cat handling guidelines. 2 For the hospital session, each cat was transported by car after feeding for up to 30 mins. All the experiments were conducted using identical procedures in both environments (Figure 1). These comprised determination of the CSS (at T01, T04 and T10), thoracic auscultation (HR and RR at T01, T04 and T10), blood glucose measurement (from T01 to T10) and blood collection for the measurement of serum concentrations of cortisol, TT4 and BA (at T01 and T10).
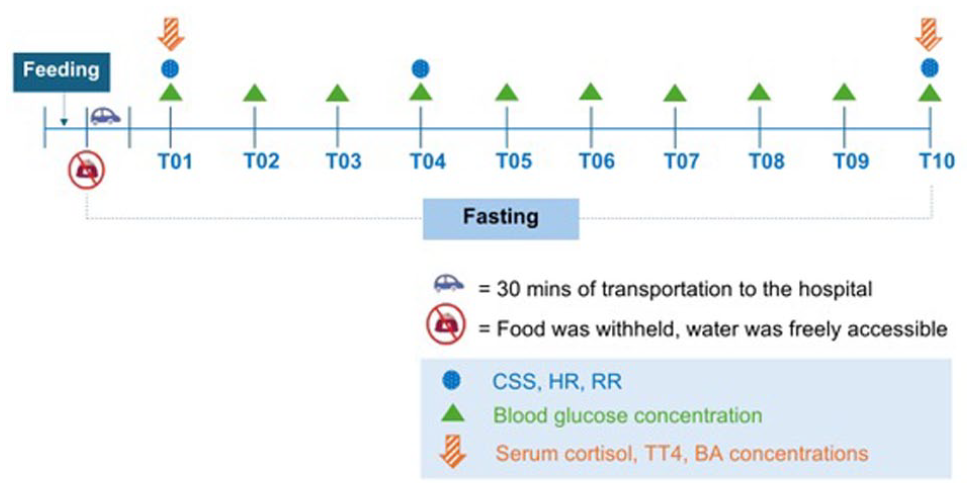
Timeline of the study. The Cat Stress Score, heart rate and respiratory rate were evaluated at T01, T04 and T10. Serum concentrations of cortisol, total thyroxine and bile acids were measured at T01 and T10. Blood glucose concentrations were measured hourly for 10 h after feeding the cats with a maintenance diet
Behavioural changes were determined using the CSS. Each cat’s CSS was evaluated by its owner both at home and in the hospital, using inspection from a distance, while making the best effort to avoid being detected by the examined cat. The CSS involved observing each cat’s vocalisation, activity and body posture, including the body, head, belly, tail, legs, eyes, pupils, whiskers and ears, as previously described. 17 Each category was assessed with a score of 1–7, with 1 being fully relaxed and 7 being terrified. Each cat was observed for approximately 5 mins and assigned the most appropriate score.
Blood glucose monitoring was measured every hour over 10 h, starting at 1 h after food was withheld using a glucometer and lancet (AlphaTrak2 Blood Glucose Monitoring System and AlphaTRAK lancing device; Zoetis) from the pisiform pads. Blood glucose concentrations >125 mg/dl were classified as hyperglycaemia,15,16 while hypoglycaemia was defined as a blood glucose concentration <60 mg/dl.15,18 The experiment was terminated in the presence of hypoglycaemia, and a rescue protocol was promptly initiated by feeding the cat their regular diet and monitoring their blood glucose concentration until they reached a euglycaemic state. In addition, abnormal behaviours during hypoglycaemia, such as depression, weakness, vomiting, tremor and seizure, were recorded.
Approximately 2 ml of whole blood was collected via the jugular or femoral vein at T1 and T10. The serum was collected and analysed for cortisol (FUJI DRI-CHEM IMMUNO AU Cartridge v-COR; Fujifilm), TT4 (Catalyst Total T4 Test; IDEXX Laboratories) and BA concentrations (Catalyst Bile Acids; IDEXX Laboratories).
Statistical analysis
The sample size was calculated using a statistical software package (G-power version 3.1.9.7; Heinrich-Heine-Universität Düsseldorf) based on a previously published study of blood glucose concentrations in cats after clinic visit stress, 4 with alpha and beta set at 0.05 and 0.2, respectively. A sample size of 10 cats was sufficient to detect a 14.5 mg/dl difference in blood glucose between at home and in-clinic measurements. Consequently, the total sample size for the study was 10 cats. All statistical analyses were performed using commercial software packages (Prism 10; GraphPad Software and STATA 12.1; StataCorp LLC). Continuous variables were presented as mean ± SD or median (range) after determining the normality distribution using the Shapiro–Wilk test. The acclimatisation time was determined by the time required for cats to return to euglycaemia (60–125 mg/dl), with the cut-off set at the mean + 2 SD. The Mann–Whitney U-test was used to compare the CSS between euglycaemic and hyperglycaemic cats. Seven general linear mixed models were employed to evaluate the effects of time, place and their interaction on physical parameters (HR, RR and CSS) and blood parameters (blood glucose, cortisol, TT4 and serum BA concentrations). Fixed effects induced time, place and their interaction, while the dependent variables were HR, RR, CSS, blood glucose, cortisol, TT4 and serum BA concentrations. Cat ID was incorporated as a random effect. In addition, post-hoc paired t-tests were conducted to compare clinical parameters at specific time points (T01 at home vs T01 in the hospital, T01 at home vs T10 at home, T01 in the hospital vs T10 in the hospital and T10 at home vs T10 in the hospital). Non-parametric Spearman’s correlation was used to evaluate the relationships among these parameters. Negligible, weak, moderate, strong and very strong relationships corresponded to Spearman’s correlation coefficients of 0.0–0.1, 0.1–0.3, 0.4–0.6, 0.7–0.8 and 0.9–1.0, respectively. 19 Statistical significance was set at P <0.05.
Results
All 10 cats completed the study. At home, a single cat experienced hypoglycaemia (59 mg/dl) at T10 without any noticeable abnormal clinical signs (Table 1). The cat was immediately fed and returned to a state of euglycaemia. None of the cats experienced hyperglycaemia (blood glucose >125 mg/dl) at home throughout the study. In contrast, 6/10 cats had hyperglycaemia after arrival at the hospital at T01. Blood glucose in all cats returned to the euglycaemic range at T05 onwards (Figure 2). The acclimatisation cut-off time (mean + 2 SD) for cats to return to euglycaemia was 5.8 h, approximated to 6 h. In addition, cats with hyperglycaemia exhibited higher CSS values (median 4.0, range 3.0–5.0) compared with those with normoglycemia (2.0, range 1.0–4.5; P <0.001) (Figure 3).
Values of physiological and behavioural parameters (ie, HR, RR and CSS) and blood parameters (ie, blood glucose and serum concentrations of cortisol, TT4 and BAs) at home and during hospitalisation at T01, T04 and T10
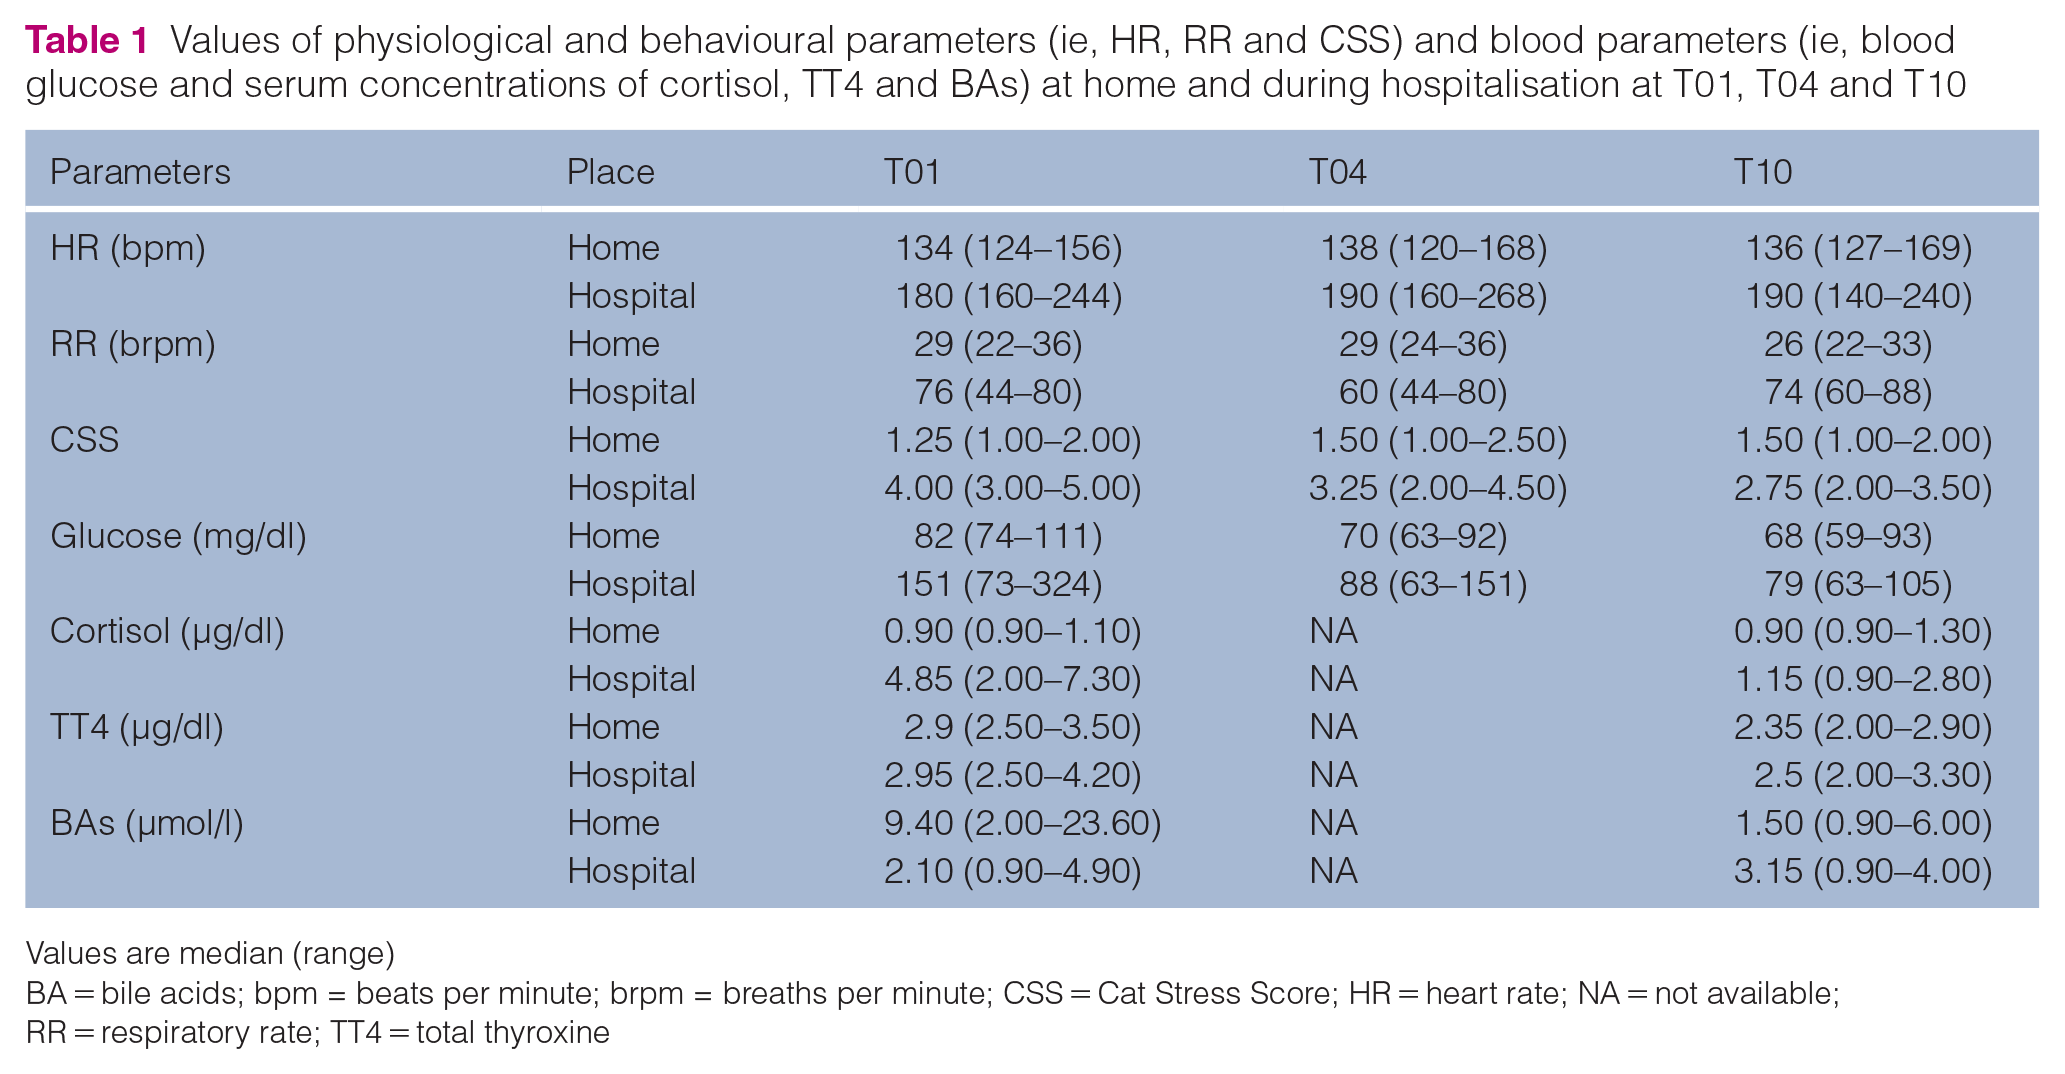
Values are median (range)
BA = bile acids; bpm = beats per minute; brpm = breaths per minute; CSS = Cat Stress Score; HR = heart rate; NA = not available; RR = respiratory rate; TT4 = total thyroxine

Each individual cat’s blood glucose concentration at each time point: (a) at home and (b) at the hospital. The grey zone represents the euglycaemic range

Scatter plots show a comparison of the Cat Stress Score in euglycaemic or hyperglycaemic cats, regardless of their environment. The horizontal bars represent the medians
A linear mixed model analysis revealed that place significantly affected HR (P <0.001), RR (P <0.001), CSS (P <0.001), glucose (P <0.001) and cortisol concentrations (P <0.001), with higher values observed in cats when presented at the hospital compared with at home (Table 2). Furthermore, BA concentrations were significantly lower in the cats in the hospital than at home (P <0.001). Interestingly, time had a significant effect on TT4 (P = 0.002) and BA concentrations (P <0.001). Significant interactions between time and place were observed for CSS (P <0.001), glucose (P = 0.009), cortisol (P <0.001) and BA concentrations (P <0.001). At home, CSS and concentrations of glucose and cortisol remained stable over time, whereas these parameters decreased over time in the hospital. Conversely, BA concentrations remained stable in the hospital but decreased over time at home (Figure 4).
Linear mixed models predicting physiological and behavioural parameter (ie, HR, RR and CSS) and blood parameters (ie, blood glucose and serum concentrations of cortisol, TT4 and BAs) based on the effects of time, place and their interaction

BA = bile acid; CI = confidence interval; CSS = Cat Stress Score; HR = heart rate; RR = respiratory rate; TT4 = total thyroxine
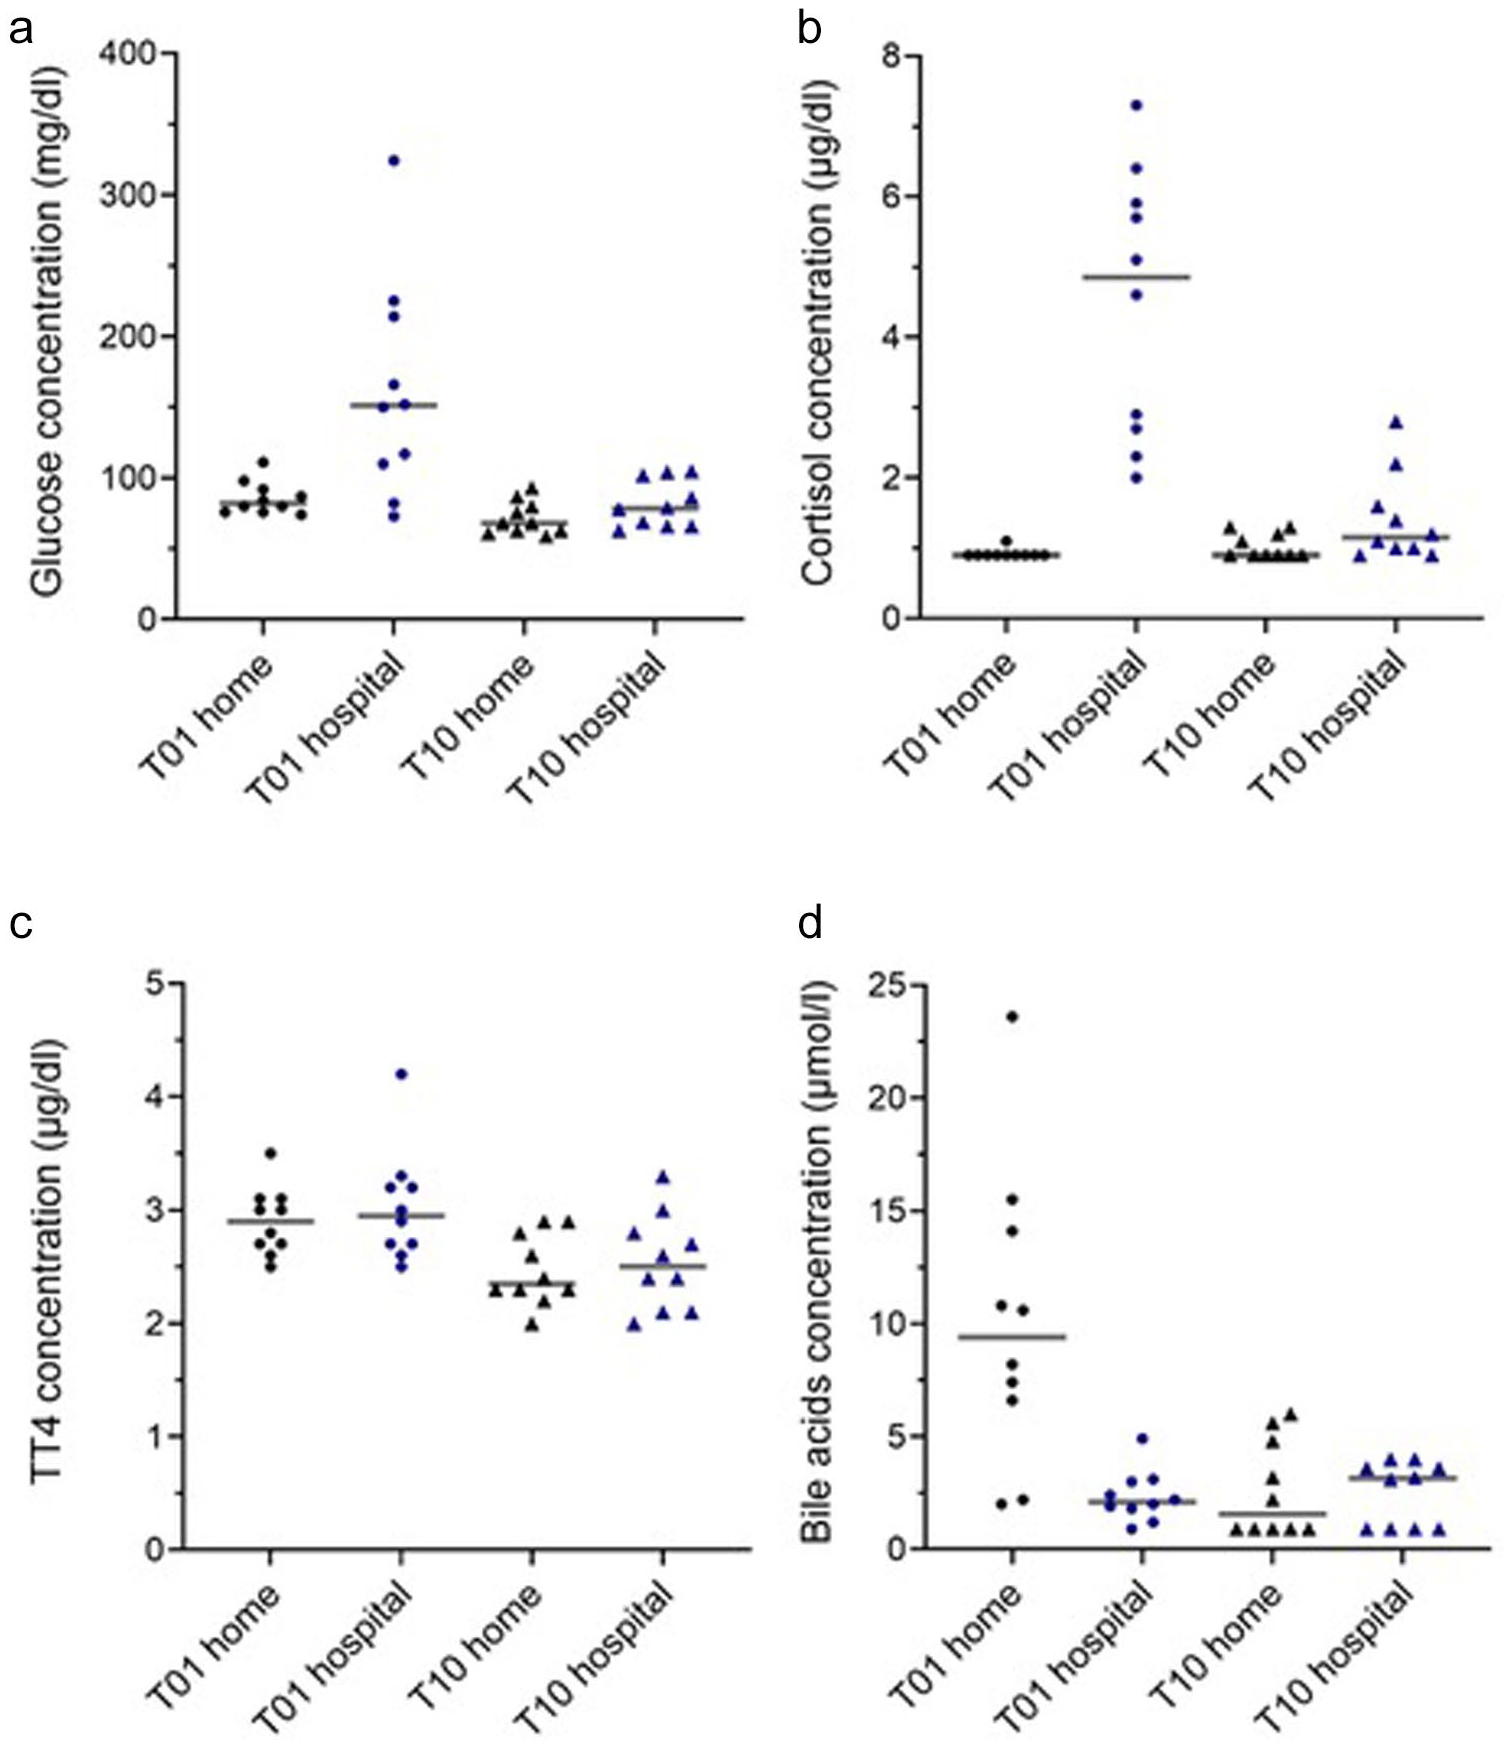
Scatter plots show blood parameters at T01 and T10 at home and in the hospital: (a) blood glucose concentrations and serum concentrations of (b) cortisol, (c) total thyroxine and (d) bile acids. The horizontal bars represent the medians
Post-hoc analyses further showed that CSS, glucose and cortisol concentrations at T01 in the hospital were significantly higher than those at home (P <0.001 for CSS and cortisol; P = 0.011 for glucose). Similarly, these concentrations at T01 in the hospital were significantly higher than those at T10 in the hospital (P = 0.003 for CSS, P <0.001 for cortisol and P = 0.013 for glucose). At T10, CSS in the hospital remained significantly higher than at T10 at home (P <0.001). However, at home, glucose concentrations at T01 were significantly higher than those at T10 (P = 0.037). In addition, BA concentrations at T01 at home were significantly higher than both T01 in the hospital (P = 0.006) and T10 at home (P = 0.006).
The correlation between physiological and behavioural parameters and serum cortisol concentrations are shown in Table 3. Both HR (ρ = 0.4326, P = 0.001) and RR (ρ = 0.5997, P <0.001) showed a moderate positive correlation with serum cortisol concentrations (Table 3). Furthermore, the CSS showed a moderate positive correlation with HR (ρ = 0.5898) and serum cortisol concentrations (ρ = 0.6621, P <0.001). A weak positive correlation was also found between CSS and blood glucose concentrations (ρ = 0.3398, P <0.01).
Non-parametric Spearman correlation coefficients evaluating the relationships between the physiological (ie, HR and RR) and behavioural parameters (ie, summarised as the CSS) and serum cortisol concentrations

The data shown are based on combined data from both T01 and T10
P <0.0001
P <0.001
bpm = beats per minute; brpm = breaths per minute; CSS = Cat Stress Score; HR = heart rate; RR = respiratory rate
The relationships between the metabolic blood variables are presented in Table 4. Serum cortisol concentrations showed a moderate positive correlation with serum BA concentrations after withholding food for 10 h (ρ = 0.6044, P <0.001) and a moderate negative correlation with the 1-h post-feeding BA concentrations (ρ = –0.5988, P = 0.005). Meanwhile, blood glucose concentrations showed a moderate positive correlation with serum cortisol concentrations (ρ = 0.4999, P <0.001) and a moderate negative correlation with the 1-h post-feeding BA concentrations (ρ = –0.4898, P = 0.028). No significant correlations were found between serum TT4 concentrations and the other metabolic parameters (P ⩾0.05).
Non-parametric Spearman correlation coefficients evaluating the relationships between blood parameters, including blood glucose and serum concentrations of cortisol, TT4 and BAs after withholding food for 10 h and 1 h after feeding

Data shown are based on combined data from both T01 and T10
P <0.0001
P <0.05
P <0.01
BA = bile acid; TT4 = total thyroxine
Discussion
In this study, we aimed to define the optimal acclimatisation period for reliable blood glucose measurements during hospital visits in healthy cats and to identify changes in the clinical parameters between the home and hospital environments. The present study revealed that stress from hospitalisation, and likely also transportation to the hospital, caused significant changes in the cats’ physiological (ie, increased HR and RR), behavioural (ie, increased CSS) and some metabolic blood parameters (ie, increased blood glucose, serum cortisol and BA concentrations), but not serum thyroid hormone concentrations. Therefore, healthy cats experiencing hyperglycaemia during hospitalisation should be acclimatised for at least 6 h before retesting blood glucose concentration.
Several studies indicate that hypoglycaemia after food withholding is rare in healthy dogs and cats.20 –23 In clinical practice, there is no definitive cut-off for when hypoglycaemia becomes symptomatic. Cats with blood glucose concentrations below 50–60 mg/dl should be closely monitored, as clinical signs typically begin to develop within this range.15,16 Hypoglycaemic cats may start by withdrawing or hiding, which can progress to more noticeable clinical signs, such as restlessness, aggression, hunger, lethargy, weakness, salivation, vomiting, muscle twitching, ataxia, seizures and even coma.15,16,18 In the present study, only one cat had a blood glucose measurement that was slightly lower than 60 mg/dl. However, blood glucose measurements in this study were not conducted by a reference method. In addition, this cat did not exhibit notable clinical signs of hypoglycaemia. Thus, the clinical relevance of this single measurement is not clear.
This is the first study to report the optimal acclimation time to avoid stress-induced hyperglycaemia during a hospital visit in healthy cats. Further studies are needed to determine whether the physiological response to hospital visit stress is similar in sick cats. Generally, stress can induce hyperglycaemia (125–270 mg/dl)15,16 and there is an overlap in blood glucose concentrations between diabetic and stress conditions. Some studies have reported glucose concentrations that exceed 270 mg/dl in stressed cats.8,14,16 This corresponds with our results, which showed blood glucose concentrations as high as 324 mg/dl during hospital visits. In our study, 6/10 (60%) cats were hyperglycaemic at both T01 and T02 in the hospital environment. By T03, four (40%) cats still had high glucose concentrations, but only one cat remained hyperglycaemic at T04. However, after T05, none of the cats were hyperglycaemic.
In the present study, physiological parameters (HR and RR) were significantly higher in the hospital compared with those at home. However, no significant interaction between time and place for HR and RR was found (P >0.05), indicating that the differences in HR and RR between the two environments remained consistent over time. This finding suggests that HR and RR may remain elevated under a persistent stressor (such as a change in location) compared with the resting state. Therefore, increases in HR and RR should be carefully interpreted during the hospital visit.
Cats are territorial animals and typically unwelcoming to strangers. Intrusions into their boundaries or changes in their environment can induce significant stress and potentially confound the clinical evaluation.2 –4,6 Therefore, in this study, the owner, who is a licensed veterinarian, conducted the examinations at home to reduce unfamiliarity. The surges in CSS, blood glucose and serum cortisol concentrations observed in the hospital, but not at home, likely reflect the impact of environmental change or interactions with unfamiliar staff at T01. These parameters gradually decreased over time in the hospital, suggesting an acclimatisation process. This finding highlights the importance of allowing an acclimatisation period before conducting physiological tests in a hospital setting. Without such a period, results should be interpreted cautiously to account for the potential impact of stress-induced alterations.
There were several reports on the episodic secretion of cortisol in cats, which may influence serum cortisol concentrations.24,25 However, our findings suggest that stress from hospitalisation can surpass episodic cortisol secretion, as a noticeable surge in cortisol concentration was observed within 1 h after transportation to the hospital. This finding is consistent with previous reports indicating that peak cortisol concentrations can occur 30 mins after stress and that they remain high for at least 2 h. 8 In addition, cortisol concentrations can return to normal after acclimatisation to stressors.
This study is the first to report serum BA concentrations under stress conditions in healthy cats. At home, BA concentrations increased 1 h postprandially before gradually decreasing over time. In contrast, BA concentrations in the hospital remained unchanged. A moderate negative correlation between cortisol and 1 h post-feeding BA concentrations was found. These findings are consistent with previous studies that reported disrupted BA homeostasis in animals after the induction of stress, such as a decreased intestinal absorption of BA in mice and decreased gallbladder contraction in dogs and rabbits.11 –13 The present study suggests that stress impacts serum BA in cats and therefore BA levels in stressed cats should be interpreted with caution. Dynamic testing of BA was performed using an identical protocol both at home and in the hospital. However, it is important to note that we collected the postprandial blood sample 1 h after feeding rather than the standard 2 h after feeding. Thus, further studies are needed to confirm our findings using a protocol where postprandial samples are collected 2 h after feeding.
In addition, a moderate negative correlation was observed between blood glucose and 1 h post-feeding BA concentrations. This finding may be explained by the role of BA as a regulatory substance for glucose metabolism. Stress could lead to lower serum BA concentrations, as previously mentioned, resulting in reduced inhibition of gluconeogenesis. Combined with a surge in cortisol and catecholamine levels, this might contribute to elevated blood glucose concentrations.26,27
Elevated serum cortisol concentrations have been reported to lower TT4 concentrations.7,10 In contrast to prior findings, TT4 concentrations at T01 in the present study appeared unchanged despite the surge in cortisol concentrations observed in the hospital. This discrepancy may be explained by earlier reports indicating that TSH concentrations started to decrease 30–90 mins after intravenous administration of dexamethasone. 10 Therefore, the immediate surge in cortisol levels triggered by stress at T01 may not have resulted in a rapid change in TT4 concentrations during the observed time frame.
Interestingly, a previous study reported no correlation between the CSS and the urine cortisol:creatinine ratio in cats. 17 However, the present study found a moderate positive correlation between CSS and serum cortisol concentrations. Furthermore, in this study, a stronger correlation was observed between CSS and serum cortisol concentrations compared to that with physiological parameters, with a significantly different CSS value between euglycaemic and hyperglycaemic cats. These discordant findings may be explained by the familiarity of the examining person in the present study compared to the previous study.4,17 Less likely, these discordant results may be due to different cortisol assays being used. Thus, routine clinical use of the CSS may be challenging owing to overlapping values between euglycaemic and hyperglycaemic cats, as well as veterinarians’ unfamiliarity with the individual feline patient. Larger studies are needed to further validate the CSS for routine clinical use and assess its inter-rater reliability in these situations.
Acute stress can complicate medical diagnoses, as evidenced by this study. Physical examination findings, such as tachycardia and tachypnoea, and behavioural changes, such as aggression or hiding, make the diagnostic process more challenging. Stress also causes variations in laboratory test results, including transient hyperglycaemia and increased serum cortisol and BA concentrations. Therefore, abnormalities during hospital visits could arise from stress rather than illness alone. Understanding the mechanisms of stress in cats during hospitalisation is essential.
It should be noted that the cats were first evaluated at home followed by a washout period of 3–5 days before hospitalisation. This was done to prevent any carry-over effect of hospital-induced stress on evaluations in the home environment, though it may have masked changes over time. Thus, failure to randomise the cats might be viewed as a limitation of this study. The small sample size and the predominance of British Shorthair cats in the present study may limit the applicability of these findings to a broader feline population. Future studies should include a larger sample size and more diverse representation of cat breeds. The lack of measurement of catecholamines (norepinephrine and epinephrine) to identify the stress response through the SAM axis is another limitation. The measurement was constrained by stability and assay availability. The response of the SAM axis was therefore monitored through physiological (HR and RR) and behavioural changes (CSS). Another limitation was the inability to measure blood variables other than blood glucose concentrations multiple times during the experiment, as this was avoided to minimise additional stress from blood collection. As such, more frequent cortisol assessments and the use of alternative methods, such as measurement of cortisol in saliva, should be further investigated.
Conclusions
Hospital visits, including transportation, can cause significant stress in cats and lead to notable increases in physiological parameters (HR and RR), behavioural changes (CSS) and alterations in certain metabolic parameters, including elevated blood glucose and serum cortisol concentrations as well as decreased serum BA concentrations. The lack of significant changes in serum TT4 concentrations suggests that the immediate cortisol surge during stress might not affect thyroid function. In addition, in healthy cats experiencing stress-induced hyperglycaemia, an acclimatisation period of at least 6 h should be allowed before re-evaluating the blood glucose concentrations.
Footnotes
Acknowledgements
The authors are grateful for the support of Tassika Koomgun and the staff at the Faculty of Veterinary Medicine, Kasetsart University, Bangkok, Thailand. We would also like to thank Dr Vachira Hunprasit for his statistical advice.
Conflict of interest
The authors declared no potential conflicts of interest with respect to the research, authorship, and/or publication of this article.
Funding
This research was funded by Kasetsart University, Bangkok, Thailand, through the Graduate School Fellowship Program.
Ethical approval
This work involved the use of non-experimental animals only (including owned or unowned animals and data from prospective or retrospective studies). Established internationally recognised high standards (‘best practice’) of individual veterinary clinical patient care were followed. Ethical approval from a committee, while not necessarily required, was nonetheless obtained, as stated in the manuscript.
Informed consent
Informed consent (either verbal or written) was obtained from the owner or legal custodian of all animal(s) described in this work (either experimental or non-experimental animals) for the procedure(s) undertaken (either prospective or retrospective studies). No animals or humans are identifiable within this publication, and therefore additional informed consent for publication was not required.