
Abstract
Objectives
The objective of this study was to compare plasma glucagon-like peptide-2 (GLP-2) concentrations in cats with chronic enteropathies (CE) with those of healthy cats.
Methods
Nineteen client-owned cats with a histopathologic diagnosis of either idiopathic chronic enteropathy (CIE) or low-grade lymphoma and six healthy client-owned cats were enrolled in a prospective study between 2 December 2021 and 9 June 2023. Fasted and postprandial plasma GLP-2 concentrations were measured via ELISA in CE cats at the time gastrointestinal biopsies were obtained and before CE treatment. In cats with a histopathologic diagnosis of CIE, plasma GLP-2 concentrations were re-evaluated after 1 month of CE treatment.
Results
There was no significant difference in plasma GLP-2 concentrations between healthy cats (0.53 ng/ml) and cats with CE (0.52 ng/ml). GLP-2 concentrations in cats with CIE were not significantly different following 1 month of treatment (0.43 ng/ml) from those at initial presentation (0.44 ng/ml).
Conclusions and relevance
GLP-2 can be successfully detected in the plasma of cats with CE. Based on the lack of differences observed between this population of CE cats and healthy cats, GLP-2 cannot be recommended as a biomarker of feline CE using this ELISA method. Further investigation of larger CE cat populations and analytic methods would be needed to determine the overall utility of GLP-2 evaluation in feline CE.
Plain language summary
The gastrointestinal (GI) hormone glucagon-like peptide-2 (GLP-2) helps to maintain normal intestinal structure and function. While existing research demonstrates decreased blood levels in humans with chronic GI disease, no information is known about GLP-2 levels in cats with similar diseases. A prospective study measured blood GLP-2 levels in 19 cats with either chronic inflammatory disease or low-grade GI lymphoma and compared levels with those in healthy cats. This study found no difference in plasma concentrations between cats with GI disease and healthy cats. In nine cats with inflammatory disease that were rechecked after 1 month of treatment for GI disease, there was no difference in GLP-2 levels compared with the initial evaluation. The results suggest that measurement of GLP-2 by this study’s methods cannot be used for diagnosis or differentiation of GI disease in cats. Further investigation into methods to evaluate GI hormone responses in cats is needed.
Introduction
Chronic enteropathies (CE) result in high morbidity in cats, with many cases unrecognized early in the disease due to a long duration of subtle clinical signs, causing owners to either overlook signs or consider subtle signs ‘normal’ for their cat. 1 Among causes of feline CE, chronic idiopathic inflammatory enteropathies (CIE) and low-grade alimentary lymphoma (LGAL) are the most common. 1 Traditional non-invasive diagnostic tests (eg, serum biochemistry) and recently studied serum or fecal biomarkers are non-specific for the underlying cause of the CE and do not predict treatment response at the time of diagnosis.2 –4 While the severity of gastrointestinal (GI) histopathologic lesions (required for diagnosis) correlates with the presenting clinical signs, this is typically only a weak to moderate correlation and histopathologic lesion severity also does not predict treatment response in CIE cats. 5 Disease progression and relapse of CIE are frequently reported with standard treatment.6 –8 In one prospective study evaluating immunosuppression for CIE, 30% of cats responded to diet therapy, with the remainder requiring additional treatments. 5 Additional studies demonstrated an approximate 30% euthanasia rate due to non-responsive GI disease.2,9 Similar disease progression is reported in cats with LGAL.10 –12 These factors necessitate novel biomarkers and treatments for CE cats.
Glucagon-like peptide-2 (GLP-2) is a hormone secreted by enteroendocrine L-cells in response to food intake, GI bacterial metabolites and enteric nervous stimuli. GLP-2 improves intestinal healing,13,14 augments the mucosal barrier,15,16 decreases GI inflammation 13 and promotes epithelial cell proliferation and decreased apoptosis.14,16,17 Altered GLP-2 concentrations have been demonstrated in human inflammatory bowel disease (IBD), as well as in rodent models of GI inflammation. Increased active (1–33) GLP-2, with no change in total plasma GLP-2 (combined [1–33] GLP-2 and degradation product [3–33] GLP-2), 18 paired with increased GLP-2-positive L-cell expression in some disease models, 19 was suggested as a compensatory response to disease. 18 Other studies showed either no difference in 20 or decreased 21 postprandial GLP-2 concentrations in people with IBD, with normalized postprandial secretion with disease remission. 21
GLP-2-positive L-cells have been documented in the feline GI tract 22 and GLP-2 plasma concentrations have been measured in healthy cats. 23 While enteroendocrine responses are unexplored in feline CE patients, understanding differences in CE cats could influence disease diagnosis and monitoring. Our primary objective was to compare plasma total GLP-2 concentrations in cats with uncontrolled CE with those of healthy cats. A secondary objective was to evaluate short-term changes in GLP-2 in CIE cats after 1 month of non-standardized treatment. Associations between GLP-2 concentrations and disease severity scores (DSS) and indirect markers of GI absorption (serum cobalamin, methylmalonic acid [MMA]) were evaluated.
Materials and methods
All procedures were approved by the Kansas State University Institutional Animal Care and Use Committee (protocols 4385 and 4509).
CE cats
Adult cats with uncontrolled chronic GI disease were enrolled prospectively upon presentation to the Small Animal Internal Medicine Service at the Kansas State University Veterinary Health Center between 2 December 2021 and 9 June 2023. CE diagnosis was based on a ⩾4-week duration of GI signs and exclusion of extra-GI disease. Cats had a complete blood count (CBC), serum chemistry profile, total thyroxine, cobalamin, folate and trypsin-like immunoreactivity performed within 1 month of enrollment, and cats with comorbidities were excluded. Urine specific gravity (USG) was performed in cats with serum creatinine >1.5 mg/dl; cats with USG <1.035 were excluded. Serum MMA and abdominal ultrasonography were performed at enrollment. Additional tests (eg, fecal flotation, Giardia species antigen, feline pancreatic specific lipase [fPL]) were performed at the clinician’s discretion; elevated fPL was not an exclusion. Cobalamin supplementation, probiotics or steroid administration within the previous 4 weeks were exclusions. While not a specific exclusion criterion, only three cats had received antimicrobials within 90 days of enrollment and no cats received antimicrobials during the study. Diagnosis of fungal or neoplastic disease other than LGAL was an exclusion criterion.
Upper and lower endoscopic GI biopsies were obtained at enrollment. Histopathologic evaluation was performed by board-certified veterinary anatomic pathologists (AKF and BLP). Diagnosis was based on World Small Animal Veterinary Association (WSAVA) criteria 24 and PCR for antigen receptor rearrangement. In brief, WSAVA criteria assign morphologic (stomach: surface epithelial injury, gastric pit epithelial injury, fibrosis/glandular nesting/mucosal atrophy; small intestine: villus stunting, epithelial injury, crypt distention, lacteal dilation, mucosal fibrosis; colon: surface epithelial injury, crypt hyperplasia, crypt dilation and distortion, mucosal fibrosis and atrophy) and inflammatory (intraepithelial lymphocytes, lamina propria [LP] lymphocytes/plasma cells, LP eosinophils, LP neutrophils, LP macrophages [colon only], gastric lymphofollicular hyperplasia [stomach only]) scores to each segment of the GI tract ranging from 0 (normal) to 3 (marked), or in reference to colonic goblet cells, from a marked decrease (2) to a marked increase (2) in either direction from a normal score of 0. These scores can be evaluated independently or summed to provide an overall morphologic or inflammatory score, with higher scores indicating increased severity. To distinguish LGAL, immunohistochemistry for CD3+ lymphocytes was performed to evaluate the number and pattern of intraepithelial lymphocytes and confirm lymphocyte lineage.
Healthy cats
Healthy adult cats were enrolled as controls. Cats were determined healthy based on a lack of systemic disease signs, lack of GI signs including weight loss within the previous 6 months, normal physical examination and normal screening CBC and chemistry profile. Medications other than routine preventives within the previous 6 months or prescription diets to control historic GI signs were exclusions.
Study population size
Target population was based on an estimated 60% increase in postprandial GLP-2 in humans with IBD in remission versus active disease. 21 Before undertaking this study, mean ± SD plasma GLP-2 concentrations of healthy cats were determined using a commercial ELISA kit (Cat Glucagon-like Peptide-2; MyBioSource) (see supplementary material). Power analysis based on an expected difference in means (0.91 ng/ml active disease vs 1.46 ng/ml remission), SD (sigma = 0.47), desired alpha = 0.05 and power = 0.8 indicated that eight cats would be needed (http://biomath.info/power/prt.htm). Expected remission GLP-2 concentration was based on the mean preprandial GLP-2 concentration from the same healthy cats, as above. Additional cats were enrolled expecting that approximately 50% of enrolled cats would be diagnosed with CIE and 50% with LGAL.
Sample collection and storage
A preprandial blood sample was drawn after an at-minimum 10 h fast. Cats were then fed a standardized commercial diet (CN Critical Nutrition; Nestle Purina ProPlan; fat, 7.36 g/100 kcal; protein, 7.95 g/100 kcal; carbohydrates, 2.46 g/100 kcal) at 25% of resting energy requirement, and an additional blood sample was obtained 30 mins after meal ingestion. Pre- and postprandial blood collection were repeated 30 days later in CIE cats to provide preliminary information to support future investigation into the benefit GLP-2 supplementation in these cats if GLP-2 concentrations remained abnormal with standard therapy. As GLP-2 supplementation is relatively contraindicated in individuals with neoplastic disease, follow-up GLP-2 concentrations were not evaluated in LGAL cats. Diet type and postprandial sample time were based on preliminary data, indicating a trend toward higher postprandial GLP-2 concentrations occurring 30 mins after high-fat meal ingestion. Sample collection was as previously described to prevent in vitro GLP-2 degradation 18 (see supplementary material). Samples were centrifuged (1794 g, 4°C, 20 mins) and plasma separated immediately. The resulting plasma aliquots were stored at −80°C. Samples were batched for analysis.
GLP-2 concentrations
Plasma (1–33) GLP-2 concentrations were measured using the same commercial ELISA kit as above. Assay detection limits are reported as 0.25–8 ng/ml, with a sensitivity of 0.1 ng/ml. In brief, samples were thawed at room temperature for 1 h before being analyzed in duplicate. Blank wells were used to account for background absorbance. Optical density at 450 nm was read 5 mins after the addition of stop solution. Assays were carried out with strict adherence to the manufacturer’s instructions. Inter- and intra-assay variations were calculated. Six sample duplicates were repeated on a different plate for calculation of interassay variability. Intra-assay variability was calculated based on duplicate samples on the same plate and averaged among plates. Cross-reaction with GLP-1 was assessed with concentrations ranging from 0.01 ng/ml to 0.1 mg/ml (Glucagon-like Peptide 1 Human; Sigma-Aldrich) and none was noted.
Disease severity and fecal scoring
Clinical DSS were calculated based on owner questionnaires 5 (see supplementary material). Repeat histopathology was not performed, and so histopathology lesion scores from enrollment were used at recheck appointments. Fecal scoring (FS) was performed by a single investigator (MCJ) using an established 1–5 scoring system. 25
Statistical analysis
Statistical analyses were performed using commercial software (Prism, version 10.1.2; GraphPad Software). Data were assessed for normality using the Shapiro–Wilk test. Baseline cat characteristics were compared between groups using an unpaired t-test or Mann–Whitney U-test for parametric and non-parametric data, respectively. CIE cat demographics were compared between baseline and recheck using either a paired t-test or a Wilcoxon test. Pre- and postprandial GLP-2 concentrations within each group (healthy, CIE and LGAL cats) were compared using a paired t-test. As there were no differences between pre- and postprandial concentrations in any group, fasted concentrations were used for remaining GLP-2 comparisons. Fasted GLP-2 concentrations in CIE cats at day 0 and recheck were compared using a paired t-test. One-way ANOVA with Brown–Forsythe correction for uneven SDs was used to compare fasted GLP-2 concentrations between healthy, CIE and LGAL cats. The Kruskal–Wallis test with post-hoc pairwise analysis and Dunn’s correction for multiple comparisons on statistically significant models was used to compare WSAVA scores between different GI anatomic regions. WSAVA scores were compared between CIE and LGAL cats using the Mann–Whitney U-test. Associations between GLP-2, FS, DSS, cobalamin, MMA and WSAVA scores were evaluated using Spearman’s correlation (rs). Significance was set at P <0.05, with Bonferroni correction for multiple comparisons on correlation analyses as required, and the threshold for significance has been included in the results.
Results
Cats
Twenty-one CE and six healthy cats were enrolled. Two CE cats were excluded after enrollment following the diagnosis of exocrine pancreatic insufficiency (EPI) and an inability to detect GLP-2 at any time point, leaving 19 CE cats for analysis (Table 1).
Demographic and clinical signs information of 19 cats at presentation for uncontrolled CE and six healthy control cats enrolled in a prospective study evaluating plasma GLP-2 concentrations
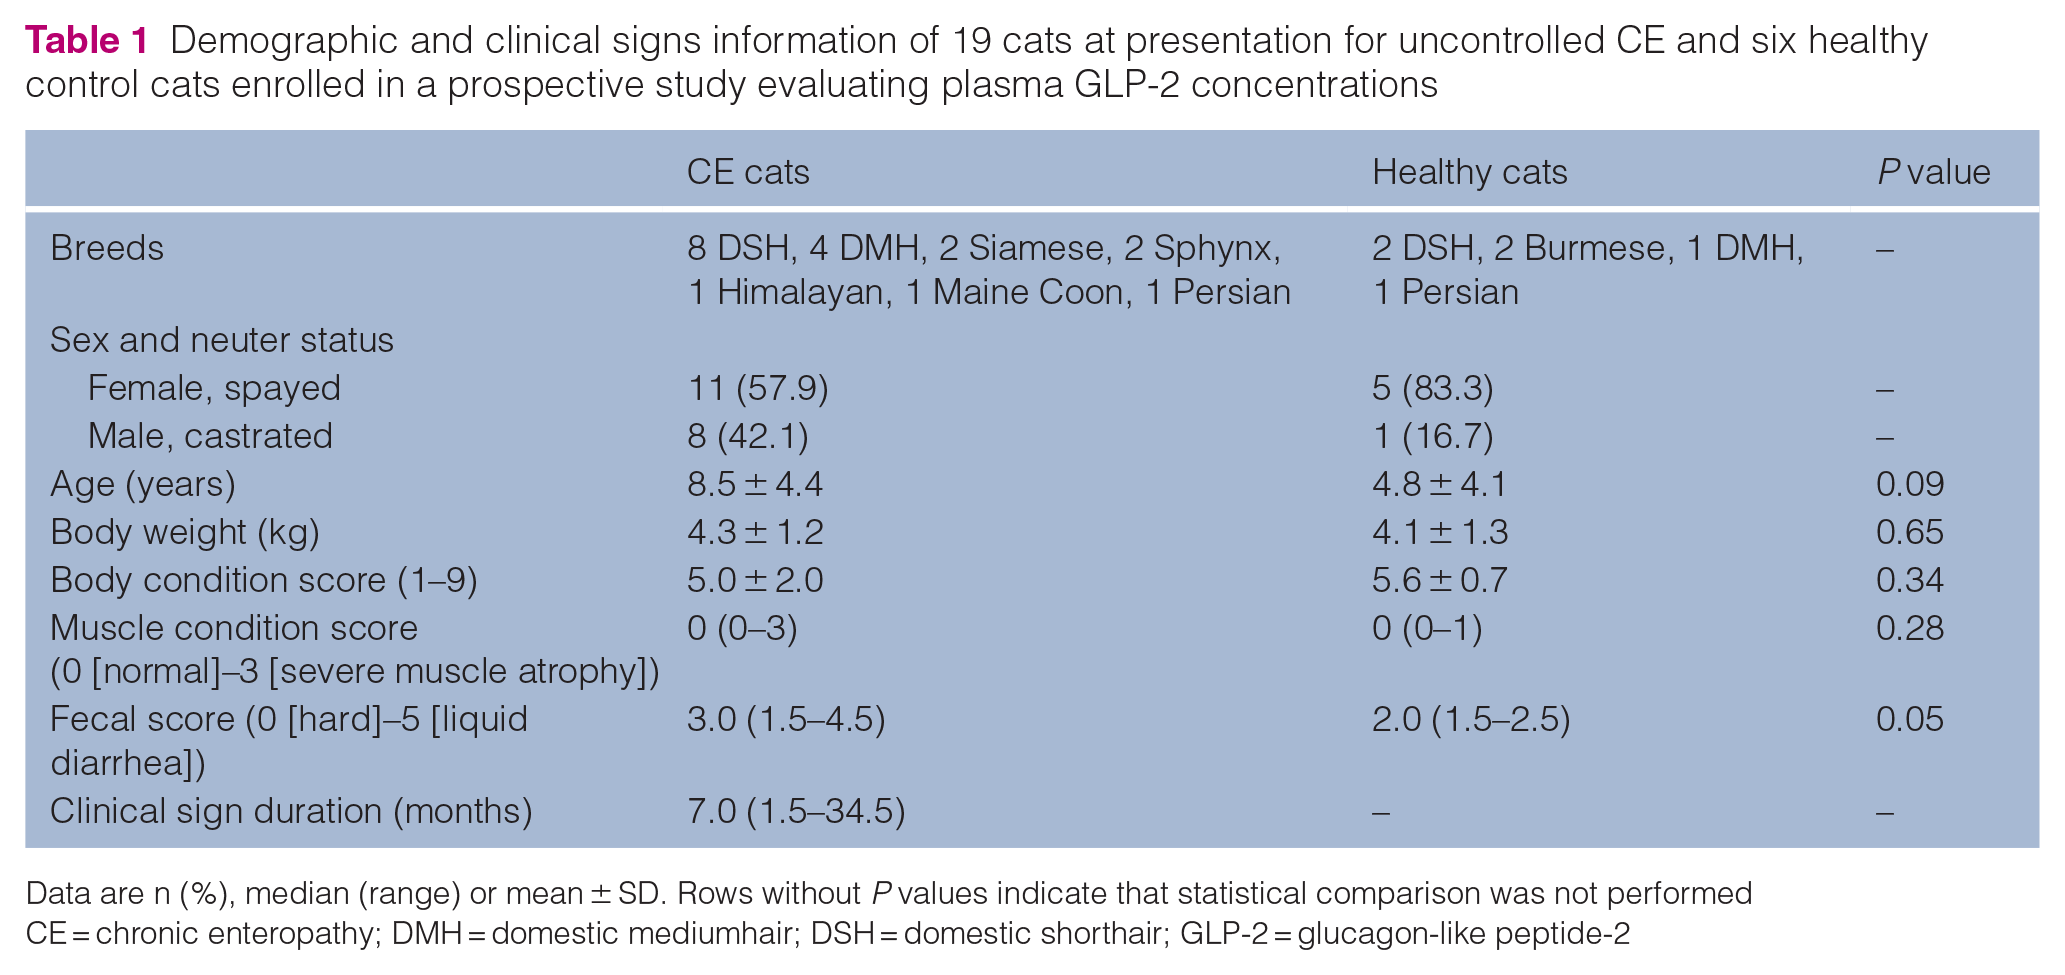
Data are n (%), median (range) or mean ± SD. Rows without P values indicate that statistical comparison was not performed
CE = chronic enteropathy; DMH = domestic mediumhair; DSH = domestic shorthair; GLP-2 = glucagon-like peptide-2
Ten of 19 (53%) CE cats were diagnosed with LGAL, and 9/19 (47%) were diagnosed with CIE. The highest individual component inflammatory score based on WSAVA scoring ranged from 1–3 of 3 (median, 2) in the duodenum, 0.5–2 (median, 2) in the ileum and 1–3 (median, 1.5) in the colon. Only one cat had histologically severe inflammatory component scores in any GI segment. Combined (ie, summed) morphologic (P <0.001), inflammatory (P = 0.03) and total (morphology + inflammatory) (P <0.01) WSAVA scores were significantly different among anatomic regions (Table 2). There were no differences between combined morphologic, inflammatory or total WSAVA scores between CIE and LGAL cats in any GI anatomic region (Table 3). As part of their initial screening, 5/19 cats (two CIE cats and three LGAL cats) had fPL testing performed. Only one cat (CIE group) had an elevated fPL of 3.6 µg/l compared with the reference interval at the time of sample analysis (⩽3.5 µg/l).
Summed WSAVA scores from 19 cats with CE derived from endoscopic biopsies

Data are median (range). Paired superscripts denote significance at an adjusted P value of < 0.05 for post-hoc model comparisons
CE = chronic enteropathy; WSAVA = World Small Animal Veterinary Association
Comparison of summed WSAVA scores from nine cats with CIE and 10 cats with LGAL diagnosed via endoscopic biopsies

Data are median (range). No values were significant at P <0.05
CIE = chronic inflammatory enteropathy; LGAL = low-grade gastrointestinal lymphoma; WSAVA = World Small Animal Veterinary Association
Eight of nine CIE cats had follow-up after initiating therapy, while one died from GI disease before recheck. Treatments initiated or continued between enrollment and recheck included a hydrolyzed protein diet (n = 5), prednisolone (median dose, 2 mg/kg/day; n = 3), subcutaneous cyanocobalamin (250 µg/q7 days; n = 3), mirtazapine (1.88 mg q24h; n = 1), omeprazole (1.7 mg/kg q12h; n = 1), sucralfate (500 mg q8h; n = 1) and cisapride (0.9 mg/kg q8–12h; n = 1). Time to follow-up was 30 days (range 27–41 days). There was no difference in weight (recheck mean 4.4 ± 0.8 kg vs 4.1 ± 0.9 kg baseline; P = 0.06), body condition score (recheck mean 6.1 ± 1.0 vs 5.3 ± 1.3 baseline; P = 0.11) or FS (recheck median 3.0, range 2.0–4.0 vs 4.0, range 2–4.5 baseline; P = 0.19) between appointments. Clinical DSS was significantly reduced at recheck (mean 3.0 ± 2.0) compared with enrollment (8.0 ± 4.0; P <0.01).
GLP-2
GLP-2 was detected at least once in 20/21 screened CE cats and all healthy cats. Of the included CE cats, preprandial GLP-2 was detectable in 18/19 cats at enrollment and all eight CIE cats at recheck. In one CIE cat, preprandial GLP-2 was below the limits of quantification at day 0; postprandial concentrations were quantifiable. Intraassay and interassay coefficients of variation were both 12%.
There was no significant difference in mean fasted plasma GLP-2 concentrations among healthy (0.53 ± 0.05 ng/ml), CIE (0.47 ± 0.25 ng/ml) or LGAL (0.57 ± 0.12 ng/ml) cats at enrollment (P = 0.41, ANOVA F* statistic 0.95) (Figure 1). There was also no difference in mean plasma GLP-2 concentrations between CIE cats at enrollment and study recheck (0.43 ± 0.19 ng/ml; P = 0.94) (Figure 2).

Dot plot showing fasted plasma GLP-2 concentrations (line denotes median) in healthy cats, CIE cats and LGAL cats. CIE = chronic inflammatory enteropathy; GLP-2 = glucagon-like peptide-2; LGAL = low-grade alimentary lymphoma

Individual fasted plasma GLP-2 concentrations in cats with CIE at the time of diagnosis (day 0) and after 30 days of treatment for gastrointestinal disease. CIE = chronic inflammatory enteropathy; GLP-2 = glucagon-like peptide-2
When including all cats (ie, healthy and CE), there was no significant correlation between fasted GLP-2 concentrations and FS (rs = −0.27, 95% confidence interval [CI] = –0.62 to 0.16; P = 0.20) or MMA (rs = −0.37, 95% CI = −0.72 to 0.14; P = 0.13). In CE cats, median cobalamin concentrations were 890 ng/ml (range 150–1000 ng/ml), with 5/19 (26%) cats having decreased serum cobalamin. Median MMA concentrations were 300 nmol/l (range 90.99–1295 nmol/l), with 2/14 (14%) CE cats having an elevated MMA concentration. Evaluating CE cats only, there was no correlation between GLP-2 concentrations and DSS (rs = −0.10, 95% CI = –0.38 to 0.54; P = 0.68), clinical sign duration (rs = −0.26, 95% CI = –0.65 to 0.24; P = 0.29), cobalamin (rs = 0.36, 95% CI = –0.13 to 0.71; P = 0.13), MMA (rs = –0.39, 95% CI = –0.78 to 0.20; P = 0.17) or WSAVA scores (see supplementary material). When evaluating correlations in CIE and LGAL cats independently, GLP-2 was correlated with MMA in CIE cats (rs = −0.89, 95% CI not calculated due to small sample size; P = 0.03), although this was not significant at a Bonferroni corrected P value threshold of <0.002. No other hematologic values, clinical parameters or WSAVA score correlated with GLP-2 concentrations when evaluating CIE and LGAL separately (see supplementary material).
Discussion
This study compared plasma GLP-2 concentrations in CE cats, including cats with a definite diagnosis of CIE or LGAL, with those of healthy cats. Differences between GLP-2 before and after initiating CE-directed therapy were evaluated in the subset of CIE cats. Relationships between GLP-2 concentrations and other disease severity markers, including clinical DSS and indirect GI absorptive markers, were evaluated for the first time in CE cats.
Unexpectedly, no significant difference was detected between fasting GLP-2 concentrations in CE cats compared with healthy cats. This is distinct from dogs 26 and some humans with IBD, 21 where GLP-2 concentrations were lower in uncontrolled GI disease states. However, the impact of GI disease on GLP-2 concentrations is inconsistently observed in humans, and not all studies demonstrate a difference in postprandial GLP-2 between individuals with CE and healthy individuals. 20 Similar to our population, human studies include individuals with variable disease severity, including some with minimal inflammation. 20 The cats in our study had enrollment DSS ranging from 3 to 14, including two cats with mild disease and only one cat with severe inflammation based on WSAVA scoring.5,27 As GLP-2 concentrations normalize with resolution of severe inflammation in pediatric humans, 21 inclusion of more cats with high histopathologic scores might allow detection of differences in GLP-2 concentrations. While there were no associations between WSAVA score criteria and GLP-2 when the CIE and LGAL cats in this population were independently evaluated, it should be noted that WSAVA scoring is not specifically designed for LGAL and histopathologic findings used to distinguish these diseases (eg, nests or plaques of lymphocyte infiltration or depth of inflammatory mucosal infiltrate) are not components of the WSAVA score.
Disease localization may contribute to interspecies variation and impact observed circulating GLP-2 in cats. In humans with IBD, preservation of small intestinal and colonic length was associated with normal GLP-2 responses compared with individuals with small intestinal or colonic resection.28,29 These key differences across the human literature are also important to consider in veterinary patients. It is likely that different disease manifestations and underlying pathophysiology affect enteroendocrine responses, with human studies describing patients with more mild or controlled diseases showing GLP-2 concentrations similar to control populations, 20 and studies in pediatric patients with severe ileal disease without short bowel syndrome 21 or populations where disease has resulted in short bowel syndrome28,29 demonstrating changes in GLP-2. Even within the human literature, clear separation of disease is not consistently performed, including individuals with both Crohn’s disease and ulcerative colitis in the same study population. 20 Therefore, extrapolation of results from our study population with mixed types of inflammatory disease (eg, lymphoplasmacytic vs eosinophilic), patients with and without evidence of malabsorptive disease, and variable severity between GI anatomic regions, as discussed further below, to a specific disease manifestation may not be appropriate. While there was a difference noted between CE and healthy dogs, 26 dogs have a higher number of L-cells within the more proximal small intestine (jejunum) than cats and humans. 30 In our study, only one and seven cats, respectively, had severe or moderate colonic WSAVA scores when evaluating individual inflammatory score components. Selecting cats with more severe colonic disease could yield different results. Interestingly, when evaluating summed WSAVA scores, higher morphologic, inflammatory and total scores were observed in the distal GI tract (ie, ileum and colon) compared with the stomach. However, none of the summed scores correlated with plasma GLP-2 concentrations. Determining whether this is due to few cats with disease localized to each anatomic region or whether anatomic localization does not impact GLP-2 in cats would require a larger study population.
The relationships between fasted GLP-2 and MMA and cobalamin concentrations, indirect markers of GI absorptive function, were evaluated. Neither parameter was associated with GLP-2 concentrations, which could indicate that GLP-2 is not a marker of GI function in cats. However, the prevalence of hypocobalaminemia in our population was low compared with previous reports in CE cats.31 –33 This, combined with a lack of GLP-2 association with other disease severity markers and a lack of difference in GLP-2 between healthy and CE cats, could indicate insufficient disease severity to impact GLP-2. Evaluating the relationship between circulating GLP-2 and other more direct GI functional markers (eg, serum amino acids) would be a future consideration. 34 In addition to the clinical severity scores and the biochemical/histopathologic parameters above, other measures of GI health and impact on enteroendocrine function should be considered. In dogs with CE, broad fecal 16S V4 rRNA sequencing identified bacterial taxa that contributed to differences in GLP-2 concentrations between CE dogs and healthy dogs. 35 GI microbiota dysbiosis was not assessed in this population of cats. If dysbiosis also impacts GLP-2 concentrations in feline CE, the presence or relative lack of dysbiosis, as well as specific dysbiosis patterns, could have an impact, with a difference in GLP-2 concentrations being observed.
While plasma GLP-2 concentrations have not previously been evaluated in CE cats, concentrations in CE and healthy cats were within the ranges of previously documented values in healthy cats (mean, 2.9 pg/ml to 1.6 ng/ml) 23 (see supplementary material). Therefore, it is possible that GLP-2 secretion is not altered in feline CE. However, given the wide variation of values for circulating GLP-2 in healthy cats using different ELISA methods, variability in other species when using different methodologies (ie, ELISA vs radioimmunoassay),18,22, 36 –40 and lack of a gold standard feline GLP-2 assay, absolute values should not be compared between studies. Indeed, within a population, the most clinically relevant and appropriate comparisons are determined using the same assay. Some ELISA kits do not differentiate between active (1–33) and inactive (3–33) GLP-2, which would suggest that measuring total GLP-2 should not be a preferred method when making clinically important distinctions. Some studies report differences in only circulating active GLP-2 in people with IBD, 18 and so measuring total GLP-2 could make it impossible to distinguish between healthy and CE cats and contribute to the lack of correlation between WSAVA scores and GLP-2 concentrations. Similarly, if only active GLP-2 is impacted by disease severity, total GLP-2 may be inappropriate or insensitive for detecting treatment effects over time in CE cats. Methods such as combined radioimmunoassay and high-performance liquid chromatography, with the ability to distinguish between active and inactive GLP-2, 18 may be of higher diagnostic utility. Although the time frame for GLP-2 normalization in humans is unknown, most studies in human CE patients span several months,21,41,42 and concentrations did not completely normalize in dogs following 1 month of CE treatment. 26 While clinical DSS improved in CIE cats, repeat histopathology was not performed. Therefore, the extent of persistent histopathologic abnormalities is unknown. A longer duration study is needed to evaluate GLP-2 changes with disease response. However, the lack of short-term complete GLP-2 normalization in dogs with CE could also indicate a potential mechanism in which abnormal enteroendocrine responses contribute to ongoing disease in some individuals. This highlights the need for further understanding of the interrelation between the enteroendocrine system and clinical presentation of GI disease.
Based on GLP-2 secretion in other species,28,36,42 –44 we anticipated increased GLP-2 concentrations following meal ingestion. Caloric provision and sample timing were based on previous work evaluating other enteroendocrine hormones (glucose-dependent insulinotropic polypeptide, GLP-1) in cats, which demonstrated increased postprandial GLP-1.45–47 While preliminary data suggested a postprandial GLP-2 increase within a similar timeframe as GLP-1, cat-specific differences in GLP-1 and GLP-2 secretion may exist. It is generally accepted that GLP-1 and GLP-2 are co-secreted by the same cells in equimolar concentrations and should theoretically exhibit similar secretion patterns. However, recent work in several veterinary species questions this assumption. In sheep, plasma GLP-1 and GLP-2 were not correlated over 3 days, and concentrations peaked at different times. 48 In cats, intracellular GLP-2 did not co-localize with GLP-1, with immunohistochemistry documenting nearly 70 times more GLP-1-positive cells in the duodenum compared with GLP-2-positive cells. 22 It is possible that, in cats, there are two distinct populations of L-cells, implying different stimuli and secretion patterns. The discrepancy between GLP-1- and GLP-2- positive cells in the feline duodenum could account for the previously reported increase in GLP-1 compared with the diminished to absent postprandial GLP-2 response in our study.22,45 –47,49 Furthermore, the study which evaluated postprandial responses of other enteroendocrine hormones utilized individual nutrient solutions (ie, lipids, amino acids) rather than a commercial diet, which might have elicited a greater response due to the lack of need for nutrient digestion. 46 We had previously determined that a sample obtained 30 mins after a high-fat meal was suitable to assess postprandial GLP-2 responses (see supplementary material). Similar sample timing was used in this study, but cats were fed a different diet from the high-fat diet used in preliminary investigations. It is possible that the nutrient profile of the meal fed in the present study did not stimulate an enteroendocrine response to the same extent. Interestingly, a lack of postprandial GLP-2 response was also noted in CE dogs. 26 Previous canine GLP-1 data demonstrated a blunted postprandial response in dogs fed twice daily vs once daily. 50 If this pattern exists in cats, a 10 h fast may still mimic meal feeding, resulting in higher basal concentrations and the lack of an identifiable postprandial peak.
It is also important to consider pancreatitis as a possible common comorbidity in feline patients with CE that could impact GLP-2. In a small study of humans with chronic pancreatitis and EPI, increased postprandial GLP-2 concentrations were observed compared with healthy individuals. 51 While pancreatic inflammation is a common comorbidity in cats with GI disease, it is also documented in cats with no overt clinical signs of pancreatitis.52,53 Furthermore, a single normal fPL value would not have excluded chronic pancreatitis, 54 and all cats had histopathologic confirmation of primary GI disease; therefore, an elevated fPL was not an exclusion criterion. One limitation, though, is that only a few cats had an fPL performed, and so the extent of possible pancreatitis in this population is unknown. If the same pattern is observed in cats, this could contribute to the lack of difference in GLP-2 between CE and healthy cats. However, it was theorized that the combination of chronic pancreatitis and EPI in humans leads to increased intraluminal nutrient content within L-cells and subsequent GLP-2 secretion. 51 This mechanism would also be supported by human studies demonstrating increased GLP-2 following biliopancreatic diversion surgery. 36 All cats in the present study had EPI excluded, eliminating that possible factor. Additionally, to our knowledge, the combined effects of EPI and IBD on GLP-2 secretion has not been studied in humans, and so whether this increase would still be observed with decreased intestinal function or mass is unknown. Future feline studies that include both cats with and without evidence of active pancreatic inflammation or EPI should be considered.
Conclusions
This is the first investigation of fasted and postprandial plasma GLP-2 concentrations in CE cats. Overall, no significant differences were detected between fasted GLP-2 in healthy cats and those with CE. Based on our study population, plasma GLP-2 cannot currently be recommended as a clinically relevant biomarker of GI disease in cats. Furthermore, our data indicate that GLP-2 concentrations were not different between feline CIE and LGAL, indicating that GLP-2 was not a suitable diagnostic marker to distinguish between these conditions in our population. Future studies evaluating larger feline populations with subsets of CE and investigation of different analytic methods to measure GLP-2 are needed to fully determine the relevance of GLP-2 in the context of feline CE.
Supplemental Material
Supplemental Material
Owner questionnaire.
Supplemental Material
Supplemental Material
Complete diet compositions.
Supplemental Material
Supplemental Material
Preliminary study methods and data.
Supplemental Material
Supplemental Material
Correlation analyses for GLP-2 and WSAVA scores.
Footnotes
Author note
Portions of this study were presented as an oral abstract at the 2022 American College of Veterinary Internal Medicine (ACVIM) Forum, Austin, TX, 23 June 2022.
Conflict of interest
The authors declared no potential conflicts of interest with respect to the research, authorship, and/or publication of this article.
Funding
Funding for this study was provided by the EveryCat Health Foundation (W21-032), the ACVIM-Purina Resident Research Grant and Kansas State University, College of Veterinary Medicine, Department of Clinical Sciences. Veterinary student support (ZB) was provided by the Chet Peterson Family Scholarship and the Kansas State University College of Veterinary Medicine Office of Research.
Ethical approval
The work described in this manuscript involved the use of non-experimental (owned or unowned) animals. Established internationally recognized high standards (‘best practice’) of veterinary clinical care for the individual patient were always followed and/or this work involved the use of cadavers. Ethical approval from a committee was therefore not specifically required for publication in JFMS. Although not required, where ethical approval was still obtained, it is stated in the manuscript.
Informed consent
Informed consent (verbal or written) was obtained from the owner or legal custodian of all animal(s) described in this work (experimental or non-experimental animals, including cadavers, tissues and samples) for all procedure(s) undertaken (prospective or retrospective studies). No animals or people are identifiable within this publication, and therefore additional informed consent for publication was not required.
Supplementary material
The following files are available as supplementary material:
Owner questionnaire.
Complete diet compositions.
Preliminary study methods and data.
Correlation analyses for GLP-2 and WSAVA scores.
References
Supplementary Material
Please find the following supplemental material available below.
For Open Access articles published under a Creative Commons License, all supplemental material carries the same license as the article it is associated with.
For non-Open Access articles published, all supplemental material carries a non-exclusive license, and permission requests for re-use of supplemental material or any part of supplemental material shall be sent directly to the copyright owner as specified in the copyright notice associated with the article.