
Abstract
Objectives
Breed-specific reference intervals (RIs) may be necessary to avoid misinterpretation of laboratory results. The main aim of this study was to establish haematobiochemical RIs for Ragdoll cats.
Methods
Forty-two clinically healthy adult (0.8–10 years old) Ragdoll cats (Ragdoll population [RP]) and 60 non-Ragdoll cats as the control population (CP) were prospectively enrolled. Results of haematology, biochemistry and total thyroxine (TT4) were used to determine both Ragdoll-specific and general feline population RIs for each variable using Reference Value Advisor software according to the Clinical and Laboratory Standards Institute guidelines and the American Society of Veterinary Clinical Pathology guidelines.
Results
For each analyte, RIs of the RP were calculated and compared with those obtained from the CP. Haematocrit, haemoglobin, mean cell volume, mean cell haemoglobin concentration, reticulocyte absolute count, platelet count and lymphocyte absolute number were statistically different from the CP. Biochemistry RIs revealed a statistical difference in creatinine kinase (CK), total protein, urea, creatinine, glucose, total calcium and iron.
Conclusions and relevance
Haematobiochemical RIs of the general feline population must be used with caution in Ragdoll cats when it comes to iron and glucose concentrations, CK activity and absolute lymphocyte number. For these parameters, the use of breed-specific RIs is suggested. The docile and more relaxed nature of this breed may explain these differences and further investigations are necessary to better understand the results. Furthermore, investigations are needed to evaluate the possible benefits of breed-specific urea RIs.
Introduction
Laboratory tests results may have diagnostic or prognostic value, and may be useful in monitoring treatment. Traditionally, clinicians compare patient results against established reference intervals (RIs) provided by the laboratory. Thus, any inaccuracy in RIs may lead to an incorrect clinical decision being made that may affect the patient’s health.
Establishing accurate RIs is therefore paramount but extremely complicated for several reasons: the difficulty in defining the condition of ‘clinically healthy’; the standardisation of preanalytic and analytic procedures; the biological variability; and the use of different statistical tools or different instruments and reagents (in different laboratories).1–3
In recent years, the use of subject-based RIs has been proposed, particularly for analytes with a high index of individuality, which are characterised by having an intra-individual variation (CVI) greater than the variation that exists between individuals (CVG).4–6
Despite the publication of CVI and CVG for many species and measurands,7–10 or the ability to retrieve them from an online database (vetbiologicalvariation.org), 11 subject-based RIs have not yet been used in clinical practice, and population-based RIs are still preferred by clinicians. It is now well established that genetics could affect laboratory results. 12 Indeed, several studies have reported the need for breed-specific RIs in feline breeds such as the Holy Birman, 13 Maine Coon,14,15 Norwegian Forest Cat and Siberian, 13 as well as in other species such as dogs.16,17
Thus, whereas it is not possible to obtain subject-based RIs, it is advisable to investigate breed-specific RIs to avoid misdiagnosis.
In this study we aimed to establish haematological, biochemical and thyroid RIs for a clinically healthy Ragdoll cat population and compare the results with RIs derived from a control population of healthy non-Ragdoll cats.
Materials and methods
Animals
Healthy Ragdoll cats (Ragdoll population [RP]) that had a blood sample taken as part of annual check-up or for determination of feline immunodeficiency virus (FIV)/feline leukaemia virus (FeLV) status between February 2016 and December 2018 at the San Francesco Veterinary Hospital were enrolled. Inclusion criteria were fixed a priori as recommended: 3 pure-breed Ragdoll cats registered with the Associazione Nazionale Felina Italiana; aged between ⩾8 months and ⩽10 years old; indoor in both single or multi-cat households, receiving a commercial diet and regularly submitted to veterinary visits; up-to-date history for core vaccinations; regular preventive ecto- and endoparasite treatment; no treatments in the 2 months before screening (except for antiparasitic treatments); and no recent history of diseases or pathophysiological conditions potentially affecting laboratory results.
Furthermore, cats were considered healthy based on their medical history, unremarkable physical examination and negative microscopic faecal flotation run on the day of the visit. Additionally, a 2-month follow-up was carried out to assess long-term health status. Signalment was recorded for each enrolled cat. Cats that did not fulfil the inclusion criteria were excluded, together with all those animals that required traumatic venepuncture (more than two attempts) or exaggerated physical restraint (more than one person).
Moreover, a control population (CP) of adult healthy non-Ragdoll cats of any breed was enrolled following the American Society of Veterinary Clinical Pathology (ASVCP) RI guidelines, 3 to determine the de novo general feline RIs. The same period and inclusion criteria were used for CP enrolment. No more than two individuals for the same pure breed were included.
Sample collection
According to the regulations of our institution, a formal approval of the Institutional Ethical Committee was not required (decision 29 October 2012, renewed with protocol number 02-2016), as the samples were collected for diagnostic purposes with the informed consent of the owner.
Each cat was fasted for 12 h prior to blood collection, which was performed by jugular venepuncture. All patients were kept under gentle restraint, and none required sedation or anaesthesia. Blood samples (approximately 5 ml) were collected by a single operator (RF) using 23 G needles connected to 5 ml syringes and placed immediately into 0.5 ml K3EDTA tubes (Microvette; Starsted) to perform routine haematology. The remnant was transferred into plain tubes (Aptaca; Canelli) that were centrifuged (2500 g for 5 mins) within 30 mins of collection to harvest serum for biochemical, endocrinological and serological analysis. Samples with gross serum alterations (icterus, lipaemia, haemolysis) or the presence of clots in K3EDTA tubes were discarded.
Serum samples were placed into two 1.5 ml conical tubes (Eppendorf). One aliquot was stored at −20°C within 30 mins of serum harvesting and it was submitted within 1 month to an external laboratory (CDvet, Rome, Italy) where biochemical and endocrinological analysis were performed within 24 h from delivery. The other aliquot was used to perform routine analysis and FIV/FeLV rapid immunoassay (SNAP FIV/FeLV Combo; IDEXX) within 2 h of serum collection.
Although the data were not prospectively collected, owners were advised to broaden the screening by adding urinalysis as a further investigation. This suggestion was strengthened, especially in cats whose serum creatinine was >140 mmol/l.
Haematological analysis
A complete cell blood count was performed on K3EDTA samples within an hour of sampling, using an automated haematology analyser (ProCyte Dx; IDEXX) validated for feline use. 18 Quality control was periodically performed using a specific whole-blood matrix for the ProCyte Dx analyser. The imprecision of the analyser was determined retrospectively and reported in the supplementary material. The haematological parameters listed in Table 1 were analysed for both sample populations.
Haematological and biochemical parameters measured for both sample populations

RBCs = red blood cells; MCV = mean cell volume; RDW = red cell distribution width; HCT = haematocrit; MCH = mean cell haemoglobin; MCHC = mean cell haemoglobin concentration; HGB = haemoglobin; PLT = platelet count; WBCs = white blood cells; RET = absolute reticulocyte count; ALT = alanine aminotransaminase; IFCC = International Federation of Clinical Chemistry; AST = aspartate aminotransferase; ALP = alkaline phosphatase; CK = creatinine kinase; GPO-PAP = glycerol phosphate oxidase; GOD-POD = glucose oxidase peroxidase; TPTZ = 2,4,6-Tri-(2-pyridyl)-5-triazine; DGGR = 1,2-O-dilauryl-rac-glycero-3-glutaric acid-(6′-methylresorufin) ester
Air-dried blood smears were performed immediately after sampling and stained with May–Grünwald–Giemsa staining (Merck). The smears were microscopically evaluated to confirm the automatic differential white blood cell count, to estimate platelet count and to evaluate cell morphology. The presence or absence and semi-quantitative grading of platelet clumping were recorded.
Biochemical and endocrinological analysis
Biochemical analyses were performed using an automated spectrophotometer (AU640; Beckman) with reagents provided by the manufacturer (Beckman and Sentinel; Table 1). All analytes were measured in duplicate and in three different samples runs; the average of the duplicate values was calculated in order to reduce possible random analytical errors. Total thyroxine (TT4) measurement was performed with an automated immunoassay analyser (Immulite 2000 Xpi; Siemens) using reagents provided by the manufacturer and an enzyme-amplified chemiluminescent method. Calibration and two control level samples were performed for each sample run. Imprecision data of all the biochemical and endocrinological parameters are reported in the supplementary material.
Statistical analysis
RIs in the RP were determined using a Microsoft Excel spreadsheet with Reference Value Advisor (version 2.0), 19 which performed computations according to the International Federation of Clinical Chemistry–Clinical Laboratory Standard Institute (IFCC–CLSI) recommendations, as suggested by the ASVCP guidelines. 3 Descriptive statistics, tests of normality according to the Anderson–Darling method with histograms and Q-Q plots, and Box Cox transformation were calculated. Both Dixon–Reed and Tukey tests were used to identify outliers. Following the ASVCP guidelines, outliers that were considered ‘suspicious’ by the software were retained. Conversely, far outliers were removed from the analyses. RIs were calculated using a bootstrap method that also calculated the 90% confidence intervals (CIs) of the RIs. The methods for calculation of RIs had been chosen after the evaluation of Anderson–Darling results concerning data normality. Knowing that the small sample size may interfere with the assessment of normality, a P value of 0.3 was chosen as the cut-off. Thus, when P values were >0.3 the data were considered to be normally distributed, otherwise a Box Cox transformation was applied to obtain normally distributed data. In all those cases in which this was not enough, the data were considered to be non-normally distributed and a non-parametric method was used. The comparisons between the RP and CP were performed using Analyse-it Software for Microsoft Excel. Each analyte was compared using a Mann–Whitney U-test to highlight possible significant differences. Statistical significance was set at P <0.05.
Results
A total of 112 clinically healthy cats were enrolled in the study and divided in two groups (RP and CP). Four Ragdoll and six control cats were excluded for alteration of clinicopathological data (eg, hyperthyroidism and chronic kidney disease), for preanalytical reasons (eg, haemolysed samples) or as a result of stressful consultation and sample collection. Thus, a total of 60 control cats and 42 Ragdoll cats were finally included in the study. The CP group was composed of 23 females (three intact) and 37 males (nine intact) aged 0.9–10 years (median age 4.3). A range of purebred cats were included (Persian, n = 2; Norwegian Forest Cat, n = 2; Devon Rex, n = 2; British Shorthair, n = 1; Maine Coon, n = 1; Scottish Fold, n = 1), but the majority were domestic shorthairs (DSH; n = 51). Meanwhile the RP group was composed of 22 females (18 intact) and 20 males (14 intact), aged 0.8–10 years (median age 3.5).
No statistical differences in age and sex (P >0.05) were found between the RP and CP groups.
Haematology RIs of the RP group are presented in Table 2. Results concerning the RIs of biochemical and hormonal analytes of the RP group are summarised in Table 3.
Haematological reference intervals (RIs) established in adult Ragdoll cats (Ragdoll population [RP], n = 42) and de novo RIs calculated in a healthy cat population (control population [CP], n = 60)

For each analyte mean, SD, median, minimum and maximum values, RIs including outliers indicated as number of removed (R) or suspected (S) outlier, between brackets, lower (LRL) and upper reference limits (URL; including 90% confidence intervals [CIs]), and method used for the calculation of the RI were reported for the RP. Only the RIs and the method used for the calculation of the RI were reported for the CP. Moreover, P values obtained from comparison of the CP with the RP were reported, as well as the number of Ragdoll cats that showed values that fell outside CP RIs (also expressed as percentage)
RBC = red blood cells; R = robust method; UNT = parametric method with untransformed data; HCT = haematocrit; HGB = haemoglobin; T = parametric method with Box Cox-transformed data; MCV = mean cell volume; MCH = mean cell haemoglobin; MCHC = mean cell haemoglobin concentration; RDW = red cell distribution width; RET = absolute reticulocyte count; WBCs = white blood cells; PLT = platelet count; NP = non-parametric method; NEU = neutrophils; LYM = lymphocytes; MONO = monocytes; EOS = eosinophils; BASO = basophils
Biochemical and hormonal reference intervals (RIs) established in adult Ragdoll cats (Ragdoll population [RP], n = 42) and de novo RIs calculated in a healthy cat population (control population [CP], n = 60)
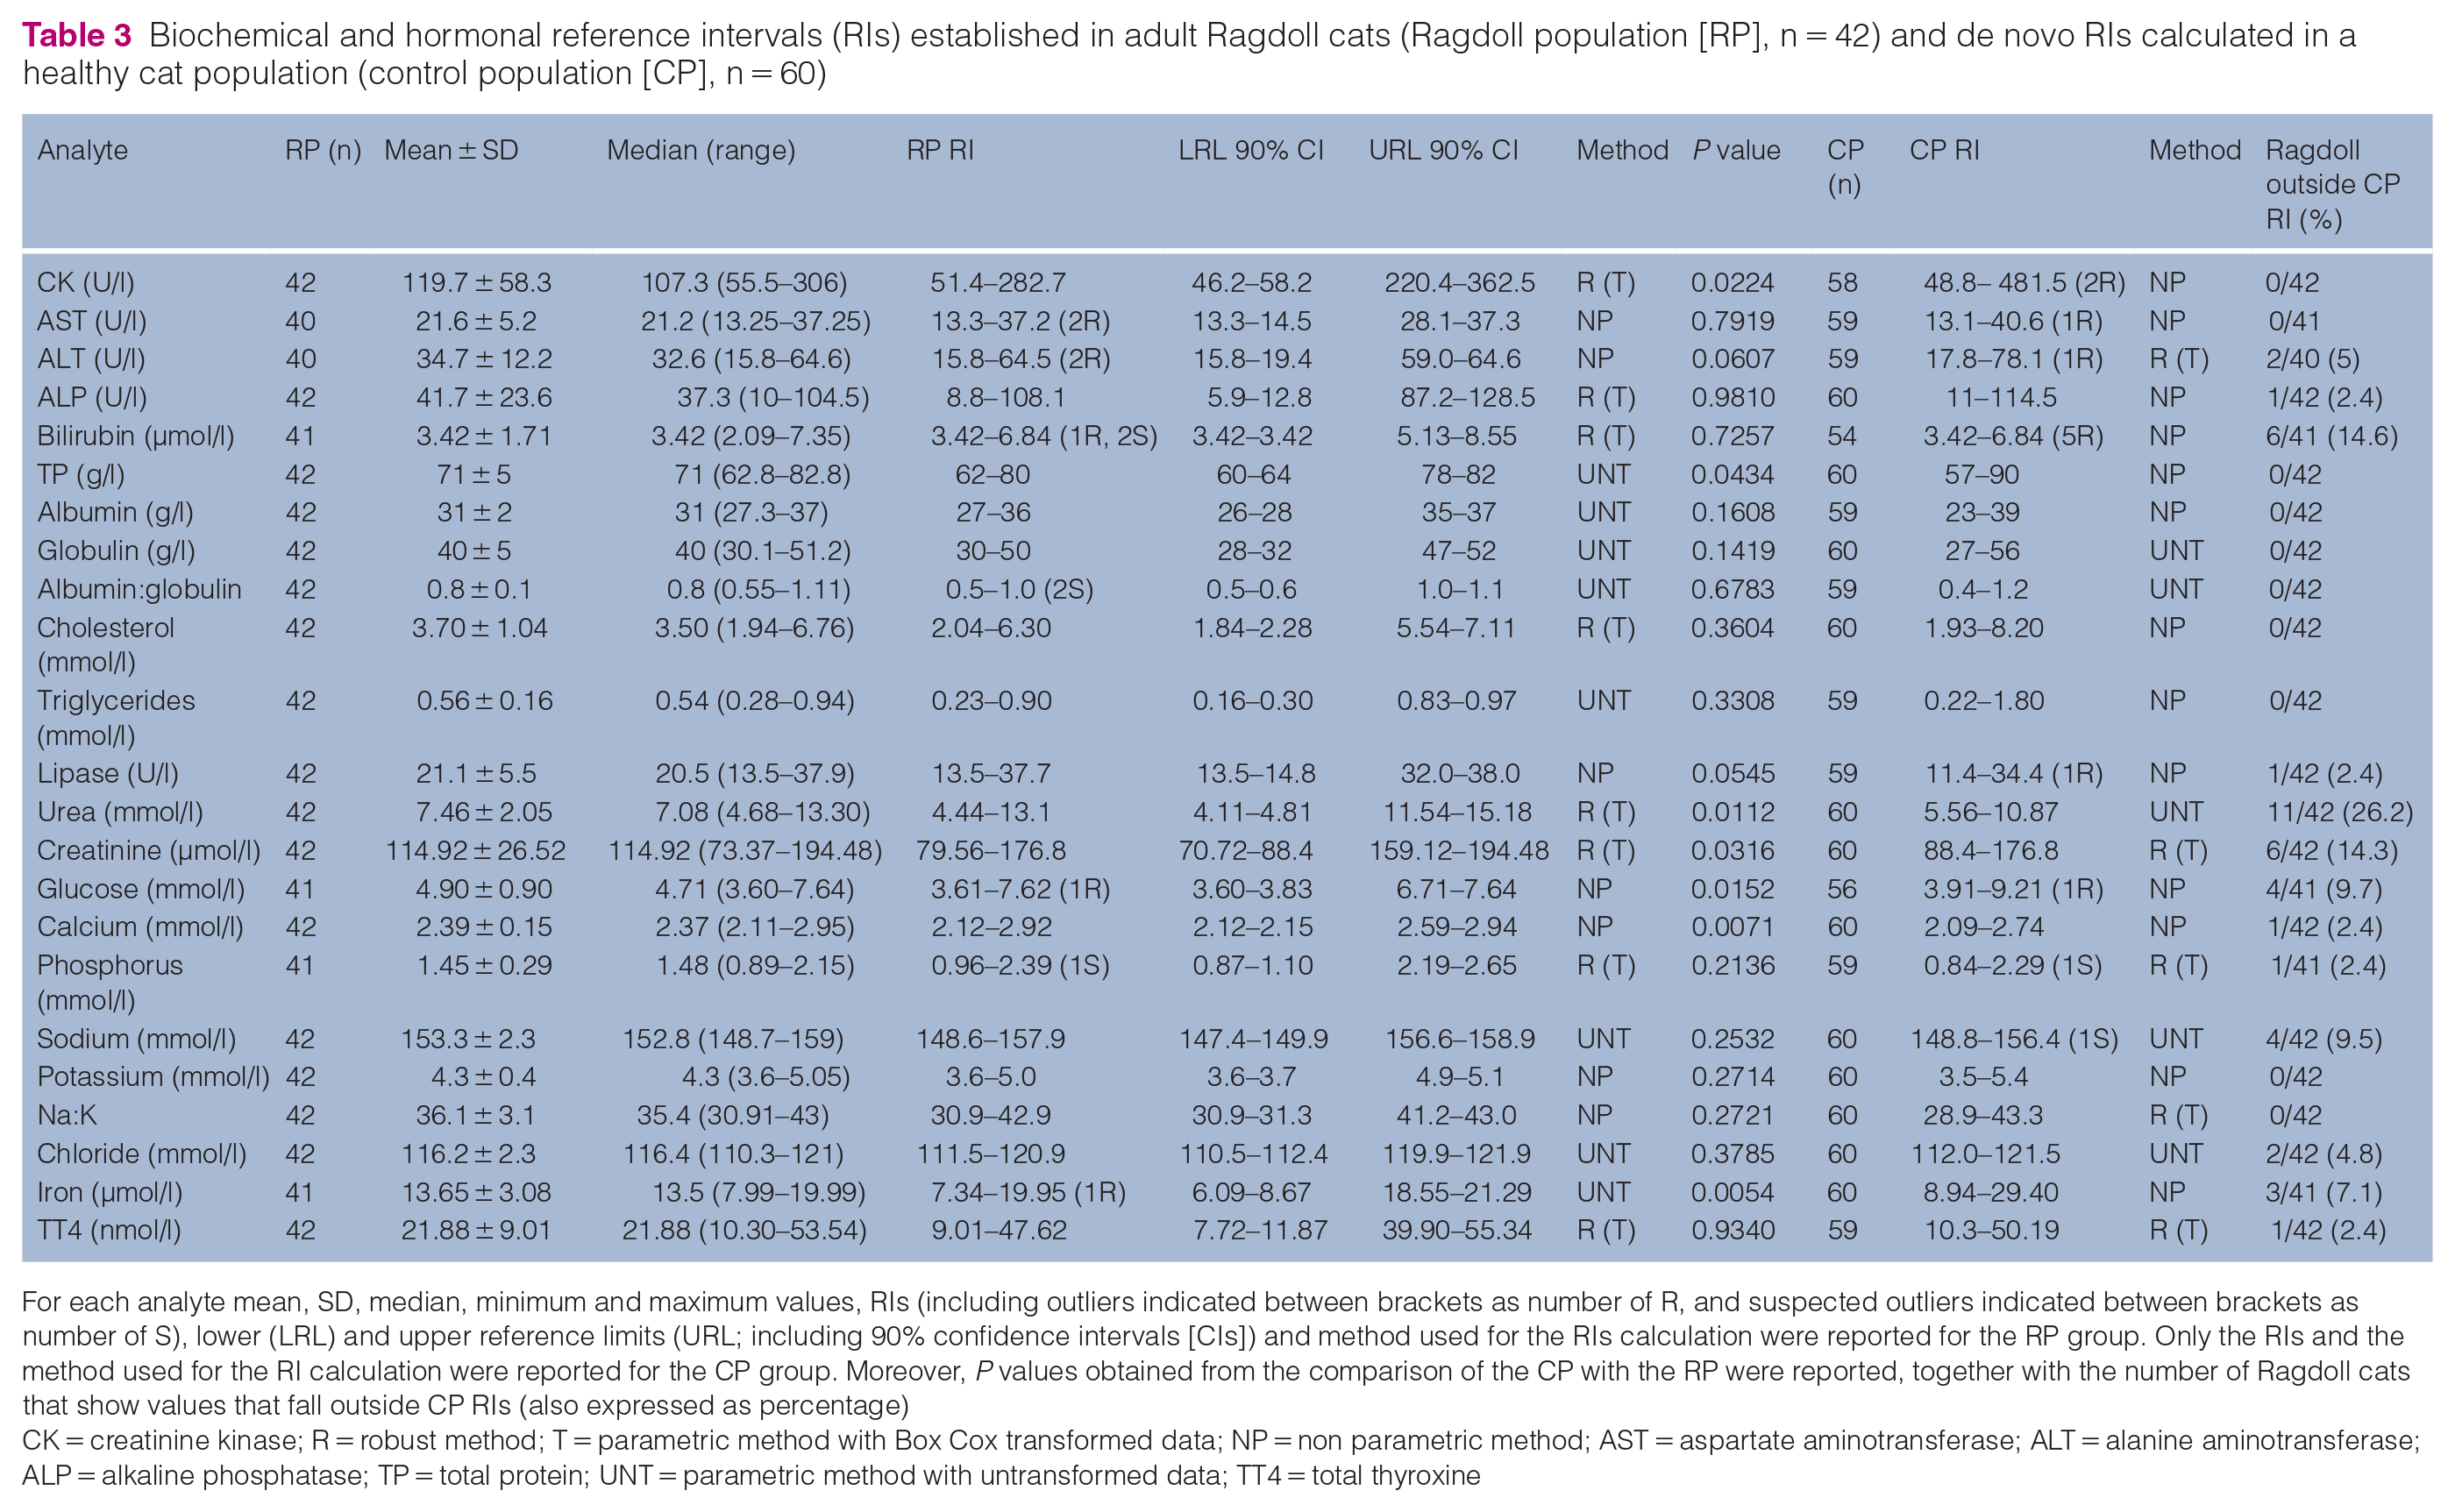
For each analyte mean, SD, median, minimum and maximum values, RIs (including outliers indicated between brackets as number of R, and suspected outliers indicated between brackets as number of S), lower (LRL) and upper reference limits (URL; including 90% confidence intervals [CIs]) and method used for the RIs calculation were reported for the RP group. Only the RIs and the method used for the RI calculation were reported for the CP group. Moreover, P values obtained from the comparison of the CP with the RP were reported, together with the number of Ragdoll cats that show values that fall outside CP RIs (also expressed as percentage)
CK = creatinine kinase; R = robust method; T = parametric method with Box Cox transformed data; NP = non parametric method; AST = aspartate aminotransferase; ALT = alanine aminotransferase; ALP = alkaline phosphatase; TP = total protein; UNT = parametric method with untransformed data; TT4 = total thyroxine
Haematology and biochemistry RIs obtained from the RP were compared with those obtained from the CP used for the calculation of de novo RIs. The percentage of the RP that fell outside the CP RIs is reported in Tables 2 and 3. The same tables also report the statistical significance obtained from the comparison of the RP and the CP. There was a significant difference for both haematology and biochemistry analytes. Specifically, haematocrit, haemoglobin, mean cell volume, mean cell haemoglobin concentration, reticulocyte count, platelet count and absolute lymphocyte number were statistically different from those measured in the CP (Table 2, Figure 1). For the biochemistry analytes, there was a statistical difference for CK, total protein, urea, creatinine, glucose, total calcium and iron (Table 3, Figure 2).

Haematological statistically different results recorded in the control population (CP) and Ragdoll population (RP). The boxes indicate the interquartile range (IQR), the horizontal lines indicate the median value and whiskers extend to further observation within the first quartile minus 1.5*IQR or to further observation within the third quartile plus 1.5*IQR. The orange ‘+’ indicates near outliers. Hct = haematocrit; Hgb = haemoglobin; MCV = mean cell volume; MCHC = mean cell haemoglobin concentration; RETIC = reticulocyte count; PLT = platelet count; LYM = lymphocyte count

Biochemical statistically different results recorded in the control population (CP) and Ragdoll population (RP). The boxes indicate the interquartile range (IQR), the horizontal lines indicate the median value and whiskers extend to further observation within the first quartile minus 1.5*IQR or to further observation within the third quartile plus 1.5*IQR. The orange ‘+’ indicates near outliers. CK = creatinine kinase; TP = total protein; CREA = creatine; GLU = glucose; tCa = total calcium; Fe = iron
Discussion
RIs are pivotal in the interpretation of clinicopathological data and to assess health status in both human and veterinary medicine. Breed influence has been previously reported in dogs16,19–22 and cats.13–15 Nevertheless, to our knowledge, no studies on haematological and biochemical RIs in healthy Ragdoll cats have been reported. In most studies breed-specific RIs have been compared with those reported in veterinary textbooks for the species of interest (transference of RIs). In the present study, the feline CP was used to calculate de novo RIs during the same period of study of RIs in the RP. In our opinion, this approach resulted in a more reliable comparison between two different populations as RIs may vary with different analysers and the data may be specific to the population assessed.3,18,19 To minimise preanalytical and analytical interference, samples from both groups were collected by a single operator (RF) during the same time period, as recommended by the ASVCP guidelines. 3 All serum samples were analysed in duplicate in three different sample runs to avoid analytical inaccuracy and imprecision. All the enrolled cats lived in similar environments (private indoor habitat in urban areas) and no difference was reported in age and sex distribution between the RP and CP (P >0.05). Partitioning RIs to evaluate any age- or sex-related differences was not performed owing to the small number of Ragdoll cats included. The use of de novo RI calculation for CP allowed a statistical comparison to be performed with the RP RIs, which resulted in some statistical differences that were probably related to data distribution.
This study demonstrated that the RP has breed-specific peculiarities for 7/15 haematological analytes and 7/23 biochemical analytes tested. Specifically, urea concentrations in the RP had a wider range and a higher upper reference limit (URL) than the CP. A possible genetic heritage may explain the results. Indeed, some theories are that Persian and Holy Birman cats are progenitors of Ragdoll cats, 23 and Holy Birman cats have been reported to have higher serum creatinine and urea concentrations;13,15,24 however, in the RP a higher URL of creatinine concentration vs the CP was not found, making this hypothesis less probable. Accordingly, although a prior study found that 11% of apparently healthy Ragdoll cats had serum creatinine concentrations greater than the authors’ laboratory RIs, 25 another study found that serum creatinine concentrations did not differ between Ragdoll cats and a control feline population. 26 In contrast to our results, the latter study also reported Ragdoll cats to have lower serum urea concentrations than their control cats. 26
Serum creatinine and urea concentrations are widely used as indirect markers for glomerular filtration rate (GFR), although they can be influenced by several extrarenal factors and show poor sensitivity in the early diagnosis of kidney disease. 27 Indeed, it is not possible to completely exclude decreased renal function in our caseload owing to the lack of other tests results (eg, urinalysis, GFR clearance tests and renal ultrasonography). However, for all the cats in which urinalysis results were available, urine specific gravity (USG) was >1.035 and no proteinuria was observed (data not shown). Finally, all cats enrolled in this study were considered healthy based on clinical history, clinical and clinicopathological data, and 2 months of follow-up. Pre-renal azotaemia was considered unlikely as a possible explanation for the higher urea URL because signs of dehydration were not evident in the RP during clinical consultation, and concurrent red blood cell count, haemoglobin, haematocrit, total proteins and albumin RIs in the RP had a lower URL than the CP. Other pathological states associated with increased urea concentrations, especially with normal serum creatinine values, such as gastrointestinal haemorrhage or increased protein catabolism, have been ruled out based on clinical history and other clinicopathological data as well. Based on these results, we suspect that a breed effect may be considered at least with regard to the urea RIs in the population of Italian Ragdoll cats.
Another biochemical difference in the RP was observed with regard to serum glucose concentration. Transient stress-associated hyperglycaemia after acute stress or fear has been reported, especially in cats – both sick and healthy.28,29 This peak is mediated by catecholamines (epinephrine [adrenaline] and norepinephrine [noradrenaline]), while glucocorticoids do not have a central role in acute stress. 29 In our study, the level of stress should have been similar for both populations as the blood withdrawal and restraint techniques were the same. The possible hypothesis is that the gentle nature of Ragdoll cats 30 could have played a role in glycaemia levels vs the CP. Unfortunately, specific stress markers (eg, lactate concentration) were not measured. Nevertheless, the significant difference observed in CK activity and absolute lymphocyte number may support our hypothesis, as both these analytes may increase during a stressful consultation with possible struggling. Specifically, CK activity may increase in healthy cats in association with excessive restraint or intramuscular injection. 31 Moreover, a transient mature lymphocytosis can occur, especially in kittens and young adults, as a response to epinephrine release. 32 In our caseload, glycaemia, CK activity and lymphocyte count showed a higher URL in the CP vs the RP; thus, it is reasonable to think that the RP may be less prone to exhibiting clinicopathological signs of stress.
Iron concentration tended to be lower in the RP, in the absence of clinicopathological signs of iron deficiency (eg, microcytosis). Absolute iron deficiency in cats is uncommon and nutritional deficiency is extremely rare in cats fed commercial diets, and thus chronic blood loss is considered the main cause. 33 In our caseload, no gastrointestinal signs or weight loss were recorded, and faecal examination excluded the presence of endoparasites. Another cause of functional iron deficiency is inflammation, 33 but the enrolled cats did not show any abnormalities consistent with systemic inflammation (eg, leukocytosis). Unfortunately, a physiopathological explanation of this specific RI was not hypothesised; measuring other analytes related to iron status (eg, ferritin, transferrin and oxygen saturation) would be useful to better elucidate a mechanism for the different iron RIs in Ragdoll cats. To our knowledge, no differences in this analyte have been recorded in other feline breeds.
PLT count showed a lower reference limit (LRL) in the RP than the CP, and both feline populations presented lower PLT counts than those generally reported in the literature. It is well known that, especially in cats, automated PLT count can be falsely decreased due to the presence of PLT clumps, a preanalytical error associated with the sampling procedure, which cannot be prevented even if prostaglandins are added to the sample, 34 hampering an accurate PLT measurement. PLT estimations were adequate for all the enrolled samples, even when the presence of PLT clumping was recorded. Because all the cats in both groups were considered clinically healthy and because it has been reported that PLT estimation is a reliable method to enumerate platelets, 35 it is reasonable to conclude that the most likely explanation for the LRL of the RIs was a PLT underestimation by the haematology analyser, as reported in a previous study. 13
The magnitude of difference of other haematological (haematocrit, haemoglobin, mean cell volume, mean cell haemoglobin concentration, reticulocyte count) and biochemical (creatinine, total calcium and total protein concentration) parameters is negligible, and lacks clinical interest. Most likely the differences between the RP and CP were caused by skewed data distribution; most of the Ragdoll cats fell between the CP RIs. Indeed, it must be noted that the presence of a statistical difference is not always associated with a clinical difference; thus, in some cases, breed-specific RIs are not needed. For example, total calcium concentration was statistically different between the RP and the CP. However, the data analysis highlighted that total calcium fell outside the CP RIs in only one Ragdoll cat. This single case was a suspected outlier and caused a skewing of the RP RIs, with an increased URL. In this case, the use of breed-specific RIs is not advised and further evaluation with more cats is suggested to confirm these results.
The CP was represented by both DSH and purebred cats. In our opinion, the use of a CP composed only of DSH cats would be misleading and it would not represent the real feline population seen in daily clinical practice. Moreover, negligible differences were found on recalculating RIs only on DSH cats, supporting the hypothesis that the inclusion of a small number of purebred cats in the CP did not influence the results obtained (see the supplementary material).
In the RP and CP, five and four cats older than 8 months but younger than 12 months of age were included, respectively. In the literature, it is well known that young cats may have age-related clinicopathological differences compared with adult cats;36,37 nevertheless, the effect of age on haematological and biochemical values after 4 months36,38 and 2 months of age 37 is not completely clear in the general feline population. It has been reported that 9–11-month-old kittens have the same RIs as adults 39 and that 7.5–10.5-month-old Turkish Angora kittens also have RIs superimposable on adult RIs. 40 For these reasons, we included ⩾8-month-old kittens in both sample populations. Further investigations with a larger caseload are recommended to evaluate a possible influence of age on the RIs of Ragdoll cats.
One of the main limitations of this study was the low number of animals in both groups. The CLSI guidelines suggest calculating RIs with a higher number (⩾120) of individuals because a larger caseload increases the chance of Gaussian distribution of data. 3 Nevertheless, Friedrichs et al 3 suggest that the minimum number of animals to allow calculation of RIs is ⩾40, especially when a robust method is used. As the sampling collection of a breed-specific population, especially when privately owned, is quite difficult and time consuming, in this study the latter approach was used. It is worth noting that all the subjects enrolled in the RP were household cats and certified as purebred. Furthermore, blood sampling was performed in the same timeframe as that of the CP. These strict criteria made the recruitment complicated as, in our clinical setting, owners are often reluctant to take healthy indoor cats to the veterinary surgery.
It is important to stress that as RIs represent the central 95% of the healthy population, in a population of only 40 subjects, as in the RP, the 2.5% of the population excluded at the higher and lower ends of the RIs was represented by only one subject. As a consequence, just one more subject could modify the RIs. Considering all these aspects, further investigations with a larger population are advised, to better evaluate any influence of sex and age in establishing Ragdoll cat-specific RIs, as these were not investigated owing to the small caseload. As an alternative to population-based RIs established on a large sample population, the use of subject-based RIs should be encouraged.
Conclusions
This study demonstrates significant differences for some analytes in the RP compared with a CP. Specifically, the use of breed-specific RIs is suggested for iron and glucose concentrations, CK activity and lymphocyte count, to reduce misinterpretation of these parameters. For the latter three measurands a possible explanation for the different RIs may be the docile and more relaxed nature of Ragdoll cats, but further investigations are needed to confirm this hypothesis (eg, measuring different stress markers such as lactate, cortisol, epinephrine and norepinephrine concentrations). Concerning urea RIs in Ragdoll cats, owing to conflicting results with a previous study, 26 it would be advisable in future investigations to perform additional tests such as GFR clearance, USG measurement and renal ultrasonography in a larger reference population of Ragdoll cats, to exclude a possible decrease in renal function.
Supplemental Material
Supplemental Material
Supplementary raw data.
Footnotes
Author note
The results of this study were presented in part as a poster at the 30th European College of Veterinary Internal Medicine Companion Animals (ECVIM-CA) annual congress (2–5 September 2020, online).
Supplementary material
The following file is available online: Supplementary raw data.
Conflict of interest
The authors declared no potential conflicts of interest with respect to the research, authorship, and/or publication of this article.
Funding
The authors received no financial support for the research, authorship, and/or publication of this article.
Ethical approval
This work involved the use of non-experimental animals only (including owned or unowned animals and data from prospective or retrospective studies). Established internationally recognised high standards (‘best practice’) of individual veterinary clinical patient care were followed. Ethical approval from a committee, while not necessarily required, was nonetheless obtained, as stated in the manuscript.
Informed consent
Informed written consent was obtained from the owner or legal custodian of all animals described in this work for the procedures undertaken (either prospective or retrospective studies). No animals are identifiable within this publication, and therefore additional informed consent for publication was not required.
References
Supplementary Material
Please find the following supplemental material available below.
For Open Access articles published under a Creative Commons License, all supplemental material carries the same license as the article it is associated with.
For non-Open Access articles published, all supplemental material carries a non-exclusive license, and permission requests for re-use of supplemental material or any part of supplemental material shall be sent directly to the copyright owner as specified in the copyright notice associated with the article.