
Abstract
Objectives
This study used computer simulation modeling to estimate and compare costs of different free-roaming cat (FRC) management options (lethal and non-lethal removal, trap–neuter–return, combinations of these options and no action) and their ability to reduce FRC population abundance in open demographic settings. The findings provide a resource for selecting management approaches that are well matched for specific communities, goals and timelines, and they represent use of best available science to address FRC issues.
Methods
Multiple FRC management approaches were simulated at varying intensities using a stochastic individual-based model in the software package Vortex. Itemized costs were obtained from published literature and expert feedback. Metrics generated to evaluate and compare management scenarios included final population size, total cost and a cost efficiency index, which was the ratio between total cost and population size reduction.
Results
Simulations suggested that cost-effective reduction of FRC numbers required sufficient management intensity, regardless of management approach, and greatly improved when cat abandonment was minimized. Removal yielded the fastest initial reduction in cat abundance, but trap–neuter–return was a viable and potentially more cost-effective approach if performed at higher intensities over a sufficient duration. Of five management scenarios that reduced the final population size by approximately 45%, the three scenarios that relied exclusively on removal were considerably more expensive than the two scenarios that relied exclusively or primarily on sterilization.
Conclusions and relevance
FRCs present a challenge in many municipalities, and stakeholders representing different perspectives may promote varying and sometimes incompatible population management policies and strategies. Although scientific research is often used to identify FRC impacts, its use to identify viable, cost-effective management solutions has been inadequate. The data provided by simulating different interventions, combined with community-specific goals, priorities and ethics, provide a framework for better-informed FRC policy and management outcomes.
Keywords
Introduction
Domestic cats (Felis catus) inhabit diverse urban and rural settings around the world. Some of these cats live exclusively or predominantly outdoors and are commonly termed free-roaming cats (FRCs). 1 Concerns about FRCs may involve their welfare,2,3 nuisance behaviors,4–6 negative impacts on wildlife,7–9 and potential to transmit diseases to humans and other animals.1,6,10,11 In many communities, these concerns generate considerable pressure to take action, particularly when FRCs are unowned. Beyond basic agreement that reducing the number of FRCs is desirable, there is often a lack of consensus about how to best accomplish this goal. 12 This has led to high-profile debates and legal battles about FRC management in municipalities (eg, Los Angeles, CA) and even countries (eg, Australia).12–17
Typically, animal welfare organizations favor using non-lethal (also termed ‘humane’) methods that rely on the surgical sterilization of cats, such as trap–neuter–return (TNR), and cite projects where this approach has been successful.6,18–22 In contrast, many wildlife conservation organizations are skeptical about the effectiveness of TNR in reducing FRC numbers. They advocate for the removal of cats from outdoor environments, and particularly from ecologically sensitive areas, using lethal means if necessary.8,23,24
Scientific research is cited in policy deliberations about FRCs primarily to quantify or characterize cat predation on wildlife or concerns about disease.8,25–30 It is less often utilized to determine the viability of a proposed action, or to define that action’s critical implementation parameters or likely outcomes. In part, this may be because potentially relevant studies tend to focus on geographically specific case studies or closed demographic environments where there is no immigration or abandonment of cats,3,31–35 which may constrain their broader utility. Additionally, much of the currently available literature does not consider management cost in conjunction with management outcomes, which makes an informed cost–benefit assessment essentially impossible.
Here, we endeavor to address both of these issues by systematically estimating the costs and outcomes of different FRC management approaches and intensities in demographically open populations. The specific management outcome on which we focus is reduction of population size over time. We acknowledge that many FRC programs have goals other than reducing cat abundance but justify our focus on this metric because it is the primary subject of contention in most policy debates. The goal of this study was to create a scientifically credible resource that can help identify workable and effective policies and programs suited to the goals and needs of communities, and in doing so to expand the ways in which best available science is used to address FRC issues. Owing to the fact that use of TNR to reduce FRC numbers is the subject of both strong advocacy and active skepticism, we pay special attention to the potential and limitations of this approach in presenting our findings.13,36–40
Materials and methods
Overview of approach
To predict the impacts of different management approaches for FRCs, we relied on simulation modeling. This analytical method uses computer-based representations of real-world systems that can be subjected to various simulated management interventions. Simulation models are often used as proxies for complex systems where systematic experiments or direct measurements are too difficult or time-consuming to be feasible, such as the Earth’s atmosphere, large physical structures, ecological systems and animal populations.
We identified five FRC management approaches, or types, that communities might plausibly consider (Table 1). The first, second and third types involved permanent removal of cats from the landscape. These three types differed from one another with respect to whether removed cats were euthanized, adopted through animal shelters or both. The fourth type was a TNR approach where cats were trapped, sterilized and returned to their original location. The fifth and final management type combined elements of TNR and removal for adoption, a common scenario for TNR programs, especially when kittens are present in the population.18,20,41 Each of these five management types was simulated at a variety of intensities (Table 1), and each of the 14 unique combinations of management type and intensity represented a specific management scenario. Every scenario was simulated over a 10-year period in a population starting with 50 cats (25 females and 25 males), and changes in these populations over time were tracked. The cumulative total cost of implementing each scenario was determined by estimating the combined costs of all elements of management over the course of the 10-year simulation. Among the 14 scenarios examined, five produced nearly equivalent final FRC abundances (ie, approximately 45% population size reduction) at the end of 10 years, and we gave these special attention as a basis for direct cost comparison. Each of the components of our analysis is detailed in the subsequent sections.
The 14 management scenarios evaluated
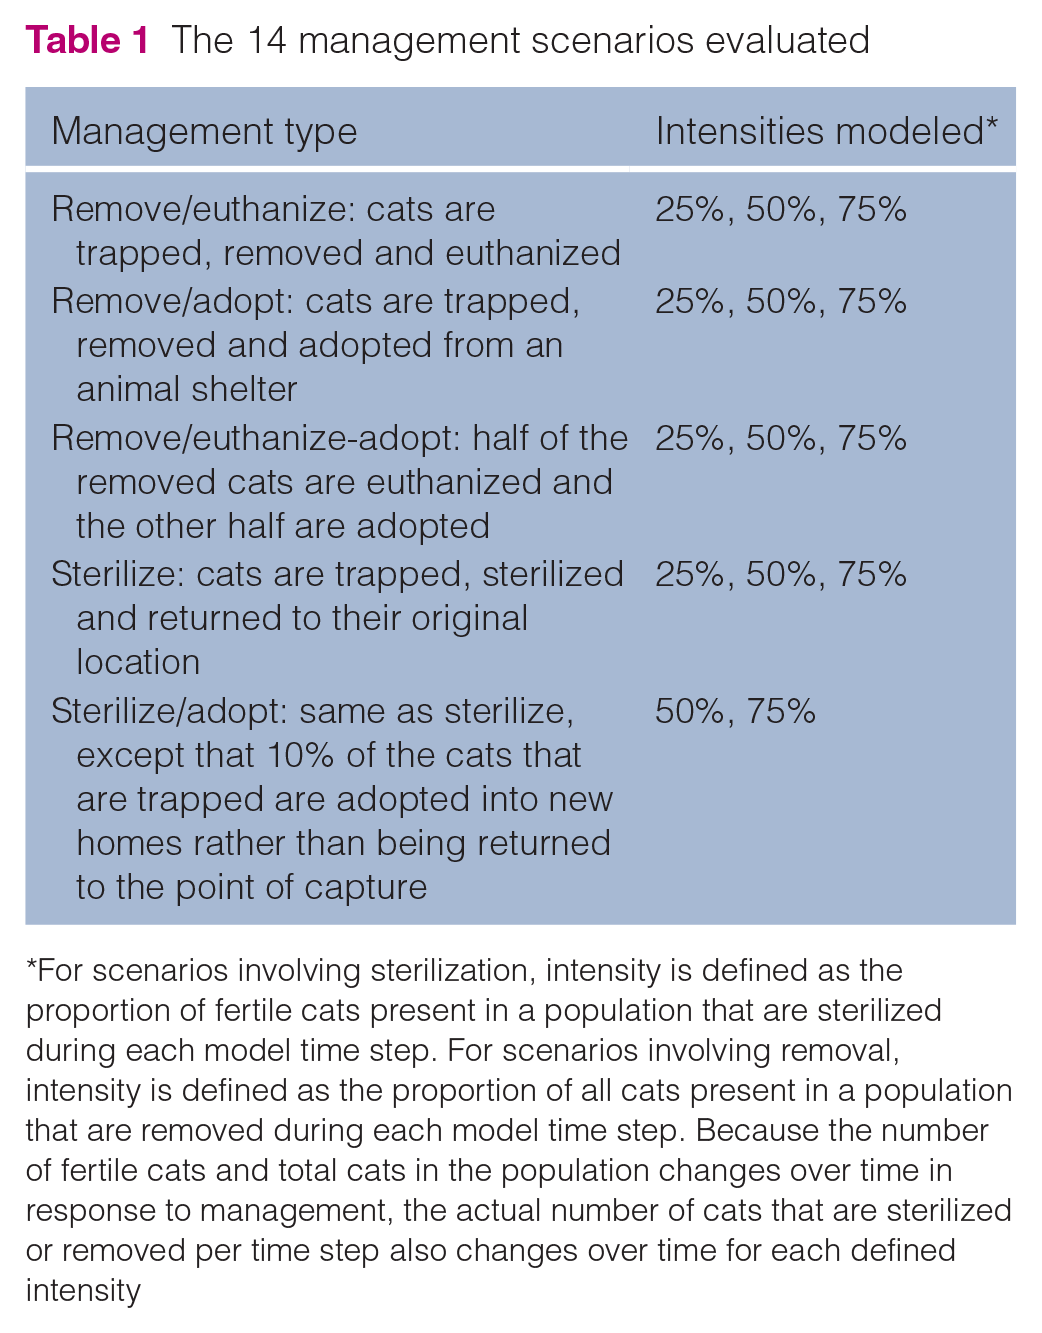
For scenarios involving sterilization, intensity is defined as the proportion of fertile cats present in a population that are sterilized during each model time step. For scenarios involving removal, intensity is defined as the proportion of all cats present in a population that are removed during each model time step. Because the number of fertile cats and total cats in the population changes over time in response to management, the actual number of cats that are sterilized or removed per time step also changes over time for each defined intensity
Population dynamics simulation model
We evaluated management scenarios using an individual-based, stochastic simulation model of FRC population dynamics, as described previously. 42 This model, built using the population dynamics simulation software package Vortex version 10, 43 identifies the sex and age of each individual, birth and death rates expressed as long-term means, and environmentally driven variability in those rates that is expressed as a standard deviation around the means. The model is structured in discrete 6-month time steps that accommodate seasonal changes in reproductive rate. It specifies a ‘focal’ population of 50 cats that is targeted for management, surrounded by a larger ‘neighborhood’ population of 200 cats that is not managed. Individuals are allowed to migrate between focal and neighborhood populations during each time step at specified rates, simulating demographic connectivity. The model also includes occasional abandonment of owned, unsterilized cats into the focal population. In the absence of any limiting environmental factors, this model would allow the simulated FRC population to increase by approximately 20% per year. However, we assumed that both focal and neighborhood populations were at a steady state (ie, at their respective carrying capacities) in terms of population size and age structure at the beginning of each simulation. All rates and quantities used to parameterize the simulations were derived from empirically measured data wherever possible, and from expert opinion where no suitable published data were available. Further details about model structure and parameterization are available elsewhere,3,42 and in supplementary material 1.
Trapping effort estimation
All management types that were simulated relied on live-trapping FRCs for either sterilization or removal. To estimate the effort and associated expense required to trap cats, we first defined the ‘trapping goal’ as the number of cats that must be captured to apply the required type of management at the required intensity within a given time step, and then defined the amount of effort needed to meet this goal in terms of ‘trap-nights’, the number of individual live traps deployed multiplied by the number of sequential nights of deployment until the trapping goal is met. There is very little published information available for parameterizing trapping effort outside of islands (see Nutter et al 44 and Page and Bennet 45 for exceptions), leading us to rely on the input of organizations with significant cat-trapping experience in TNR programs to generate estimates. The procedures used to gather and process this information are described in supplementary material 2.
Cost estimation
Estimates of the itemized costs to trap cats and apply management actions such as removal or sterilization were based on data collected during spring 2015 from 17 municipal and private (non-profit) animal welfare and animal control agencies (see supplementary material 3 for the respondent list and supplementary material 4 for the survey form). Relevant data also were extracted from a 2014 year-end report from PetPoint Data Management System, 46 which summarized data from 2265 organizations. Only cost data for items directly attributable to each management type defined above were considered; overhead costs were not. Itemized cost estimates were averaged across respondents as shown in Table 2 (for per-cat costs) and Table 3 (for per-trap-night costs) to produce the values used in our analysis. For the five scenarios that involved use of sterilization (Table 1), trapping costs were generated using both paid labor and donated labor, since both options were reported by survey respondents involved in these programs. For sterilization-based management, per-trap-night costs further varied according to whether a given trap-night was ‘productive’ (ie, captured a fertile cat that was transported for sterilization) or ‘unproductive’ (ie, captured a previously sterilized cat that was released immediately, or no cat at all). Costs associated with sheltering and adoption were primarily driven by length of stay at the sheltering facility prior to adoption. We assumed 55.6 days for adopted cats based on averages obtained from the 2014 PetPoint survey of over 2000 shelters, although we note that this quantity varies substantially among shelters. Costs associated with euthanasia assumed a 7.5-day hold time prior to euthanasia. Although some TNR programs incur additional costs for ongoing feeding and other elements of cat care, these were not incorporated into our analysis as they are not directly related to population control.
Itemized cost estimates applied on a per-cat basis
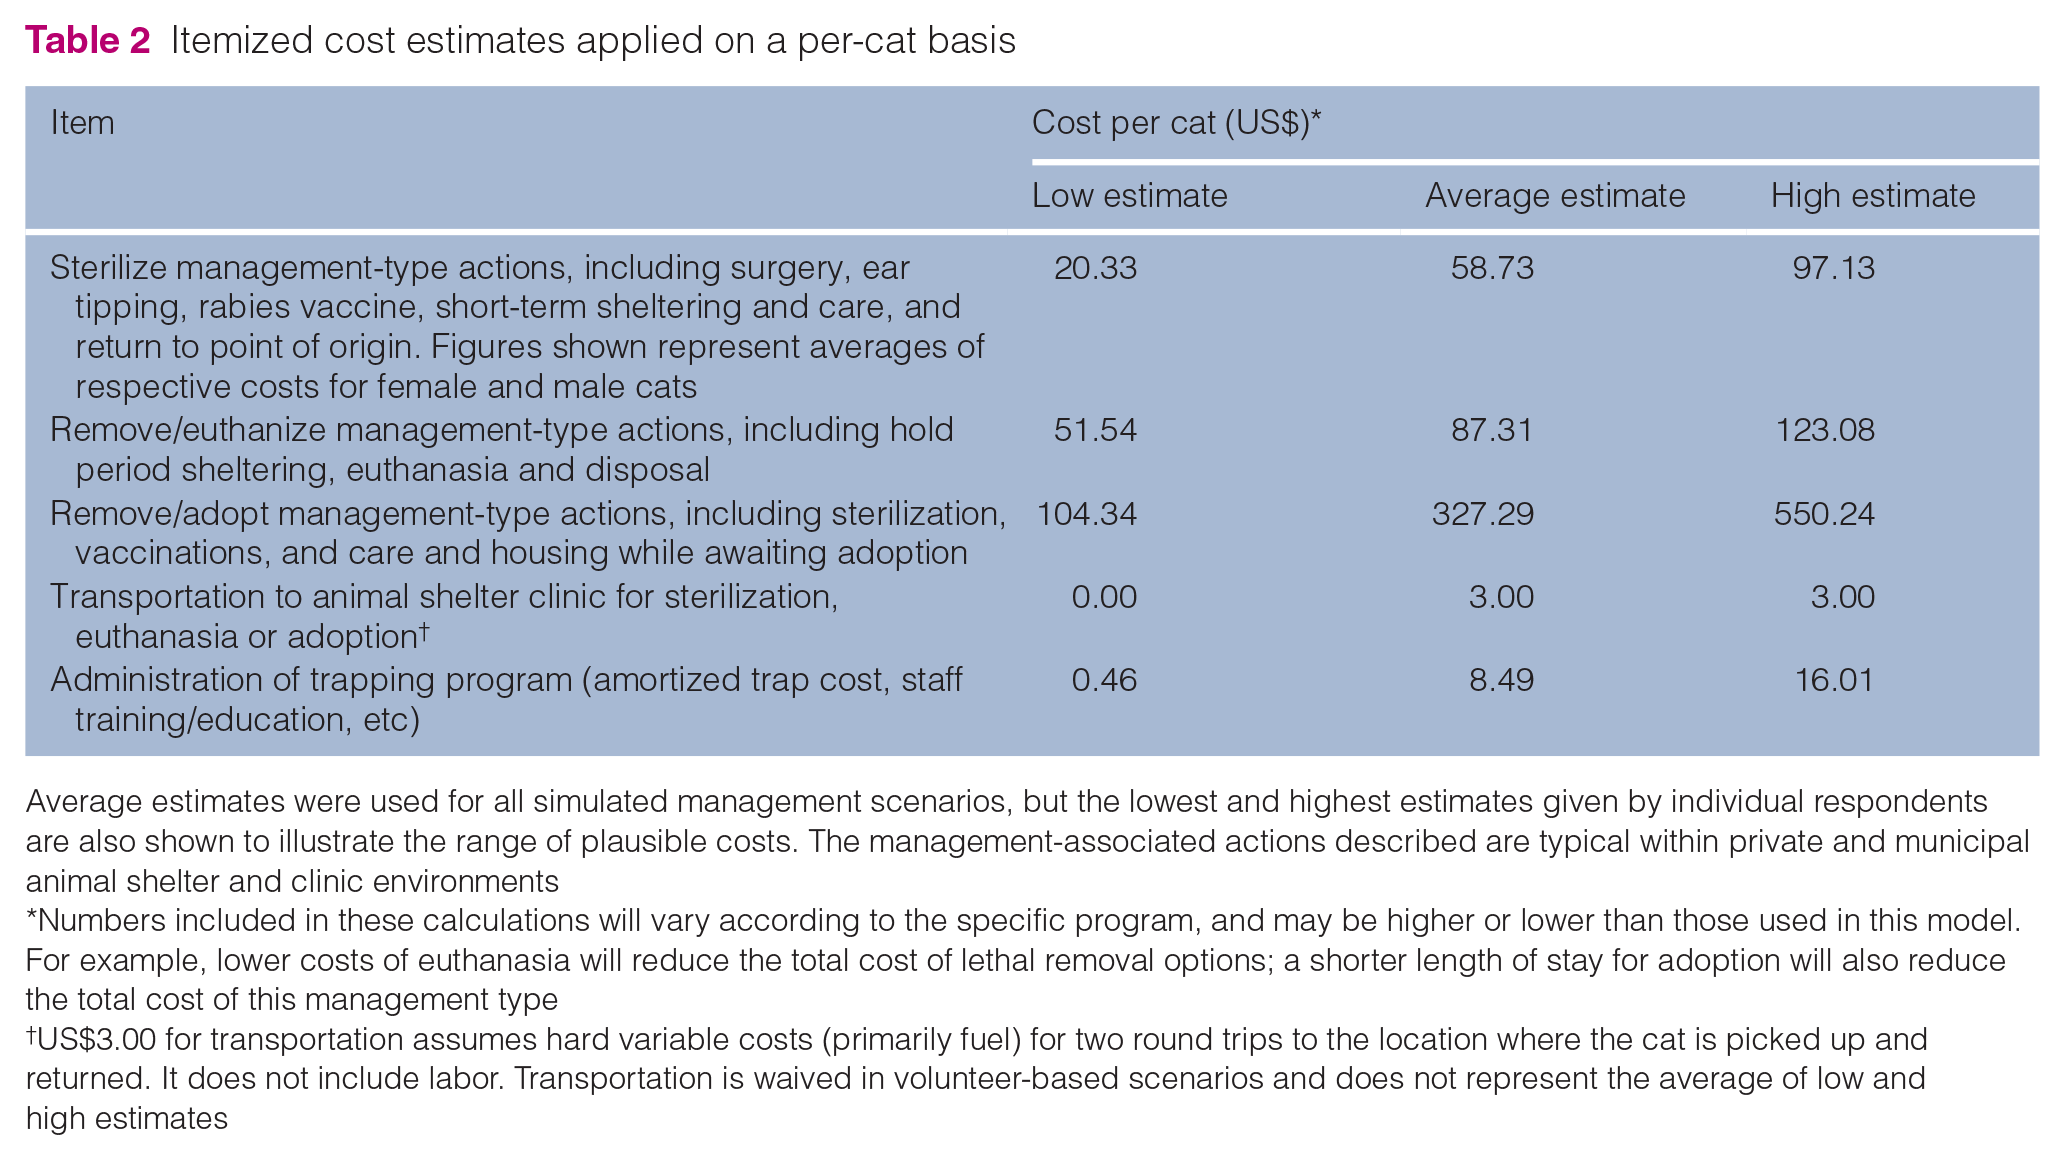
Average estimates were used for all simulated management scenarios, but the lowest and highest estimates given by individual respondents are also shown to illustrate the range of plausible costs. The management-associated actions described are typical within private and municipal animal shelter and clinic environments
Numbers included in these calculations will vary according to the specific program, and may be higher or lower than those used in this model. For example, lower costs of euthanasia will reduce the total cost of lethal removal options; a shorter length of stay for adoption will also reduce the total cost of this management type
US$3.00 for transportation assumes hard variable costs (primarily fuel) for two round trips to the location where the cat is picked up and returned. It does not include labor. Transportation is waived in volunteer-based scenarios and does not represent the average of low and high estimates
Itemized cost estimates applied on a per-trap-night basis

These costs were predominantly labor, for which estimates were fairly consistent, so high and low estimates are not shown. The difference between box traps and drop traps is defined in supplementary material 2
Estimation and evaluation of FRC final abundance and cost
For each management scenario, we performed 1000 model iterations in which the selected management type was applied at the selected intensity during each 6-month time step over the entire 10-year simulation. Costs were applied at each time step based on the numbers of trap-nights recorded and management actions (sterilizations, euthanasias or adoptions) specified. Values for FRC abundance, number of fertile cats, costs and other metrics were averaged across all iterations within each time step for every scenario. Averaged costs were then summed across all time steps to generate a total estimated cost for a given 10-year management scenario.
Management scenarios were compared and evaluated primarily based on the final abundance of FRCs after 10 years and on cost. We also developed a composite metric called the cost-efficiency index (CEI) to characterize the combined population and economic results of each management scenario. The CEI reflects the total costs required on a per-cat basis to reduce the initial population of 50 cats to its final abundance:

where Ci is the total cost of management scenario i and N10,i is final abundance under that scenario at the end of the 10-year simulation. For example, if a given management scenario reduced the abundance from 50 to 15 individuals (decrease of 35 cats) and cost US$7000 over 10 years, the CEI is calculated as (US$7000/35) = US$200. This means that each unit of decrease from the starting abundance to the final abundance required a cumulative expenditure of US$200. Management scenarios with lower CEI values are therefore more cost-efficient.
Additional models beyond the core set of 14 scenarios were run to examine how much the final abundance and total cost might change if the rates of cat immigration, abandonment and adult cat annual survival were different than what we assume in our baseline management scenario models. All of these additional models used the 75% sterilize management scenario (Table 1) that was held constant except for allowing the parameter of interest to vary.
Results
Comparisons of final abundance and cost
The full set of 14 simulated management scenarios and their cost variants generated a wide range of final FRC abundances and total costs (Figure 1, Table 4). All management types were able to produce substantial reductions in FRC abundance over time when implemented at higher intensities but performed more poorly at lower intensities. Given the rates of immigration and abandonment that we incorporated in our simulations, only medium-intensity (ie, 50%) or high-intensity (ie, 75%) removal scenarios reduced final abundance to low levels (<10 individuals) at the end of 10 years, but achieving these outcomes in the most cost-effective way relied on euthanizing (rather than adopting) removed cats (Figure 1). This is illustrated by that fact that the high-intensity remove and euthanize scenario had the most favorable CEI value, while other high-intensity removal options that involved adoption ranked much lower (Table 4). The high-intensity (75%) and medium-intensity (50%) sterilize and sterilize/adopt scenarios achieved intermediate levels of population reduction more cost-effectively than removal options, and the high-intensity sterilize scenario showed the second most favorable CEI value (Figure 1, Table 4) overall. Within each management type, higher intensities not only generated better outcomes in terms of final abundance, but also did so more cost-effectively (eg, lower CEI values) than their lower-intensity alternatives (Figure 1). Stated another way, more intensive effort at the beginning of a management program produced more rapid population decline, leading to fewer cats to sterilize or remove at later time steps, with corresponding cumulative cost savings. High-intensity scenarios functionally represented ‘front loading’ of cost and effort, which produced better final abundances for a given overall investment. In contrast, lower intensity scenarios spread out costs and effort more evenly over time, resulting in less reduction in abundance for a given investment.

Comparison of costs and final abundances. Colored arrows above the plot indicate the range of management intensities for each management type, and each symbol in the graph is a scenario. For the removal-based management types, symbols grouped by dashed ellipses correspond to different outcomes for removed cats. Paid (not volunteer) labor for trapping in sterilization-based management types is reflected in this figure
Simulation results for 14 management scenarios with two cost variants

Sterilization-based management scenarios include options for both paid and donated trapping labor, and both variants are listed in the table with different values for the ‘Labor cost’ column. Costs are cumulative over the entire 10-year simulation. CEI is the cost-efficiency index*. Scenarios and variants are ranked according to the best (lowest) CEI value to worst (highest) CEI value. Rows in bold indicate management scenarios with approximately equivalent final population abundances
CEI i = [Total cost of management scenario i]/[50 – (final abundance under management scenario i)]
A subset of simulated management scenarios produced nearly identical final abundances (26–28 cats, or a 44–48% reduction from the original 50 cats) (Table 4, Figure 2), which simplified direct comparisons of costs. These were: (1) 25% remove (without regard for whether cats were euthanized or adopted); (2) 75% sterilize; and (3) 50% sterilize/adopt. Despite their similar final abundances, the three scenarios that relied exclusively on removal were considerably more expensive than the two scenarios that relied exclusively or primarily on sterilization (Figure 3). An important factor contributing to this cost disparity was the total number of cats treated throughout the 10-year simulation, which ranged from 170 cats for 25% remove, to 108 for 50% sterilize/adopt, to 104 for 75% sterilize (Table 4). Differences in costs among the three removal scenarios in Figure 3 were attributable solely to the substantial differences in per-cat costs for euthanasia vs adoption (Table 2). In none of these scenarios did the cost of trapping exceed 23% of the total cost, and if trapping labor was donated by volunteers in sterilization scenarios, trapping costs became negligible (for bait only) (Figure 3). Use of donated labor for sterilization scenarios produced fairly small cost savings (<US$2100 in all cases) but did improve CEI scores substantially (Table 4).
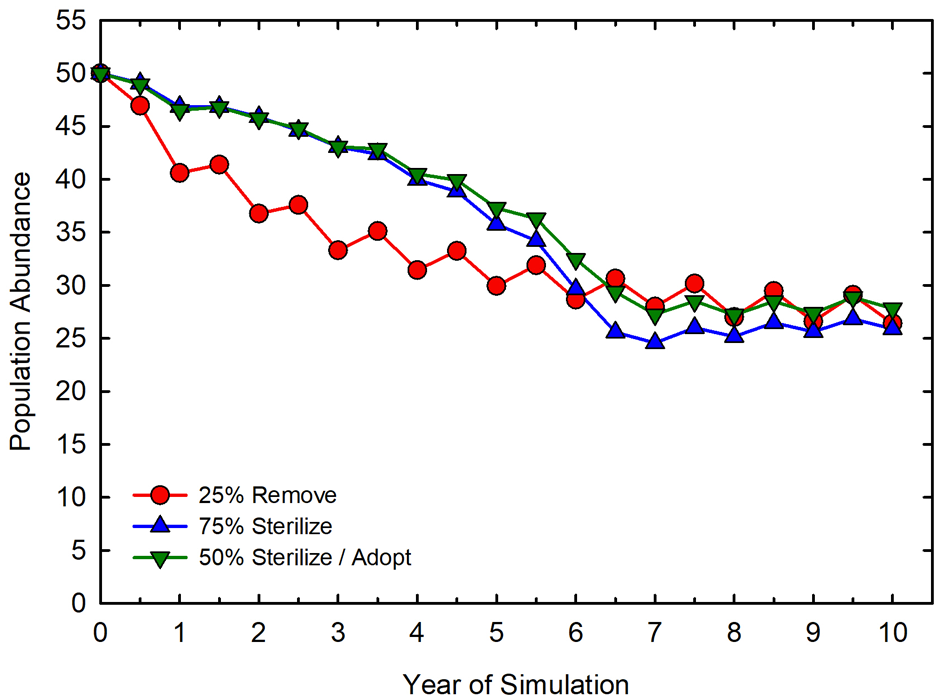
Abundance trajectories over time for management scenarios with comparable final abundances. Data points are averages of results from 1000 model iterations. The 25% remove trajectory applies to each of the three specific management scenarios (remove/euthanize, remove/adopt and remove/euthanize-adopt) conducted at 25% intensity

Cost estimates for management scenarios with comparable final abundances. Orange portions of each bar are costs of management treatments (sterilization, removal, etc), and blue portions are costs of trapping. Sterilization-based management types show two bars, one for paid trapping labor on the left and another for donated trapping labor on the right
Removal-based management types produced faster declines in abundance than the more gradual declines produced by sterilization-based management types, even when final abundance at the end of 10 years is the same (see supplementary material 5 for further details). This phenomenon is apparent in Figure 2 for the subset of scenarios with comparable final outcomes. This contrast occurs because in sterilization-based scenarios, all or most cats are returned to the population following treatment, and are not actually ‘subtracted’ from the population until they die at some later time. In contrast, removed cats are subtracted from the population immediately.
Effects of random variation and model assumptions
Our simulation models incorporated realistic levels of random variation in multiple parameters, such as reproductive output, annual survival, immigration and trapping success. As a result, each iteration of a given model scenario produced a unique pair of final abundance and cost values. As mentioned previously, these were averaged over all iterations to generate the results heretofore presented. To illustrate examples of the extent of this underlying variation, Figure 4 plots the final abundance and cost for all 1000 iterations of the 25% remove/euthanize–adopt and 75% sterilize scenarios, which had comparable average final abundances (Figure 2). Both plotted scenarios showed substantial variability in final abundance across 1000 simulation iterations, ranging from 3 to 50 for removal and from 9 to 48 for sterilization. The variability of cost, however, was noticeably wider for removal (US$11,370–US$44,435, a 3.9-fold difference) than for sterilization (US$6200–US$13,470, a 2.2-fold difference), suggesting that the potential for highly atypical results (either positive or negative) may be greater for the 25% remove/euthanize–adopt scenario than for the 75% sterilize scenario. The same comparative pattern holds with other possible comparisons of our removal and sterilization scenarios with comparative final abundances.

Variability of results for two representative management scenarios. Scatterplot of 1000 iterations of final abundance and total cost for two management scenarios. The variant with paid trapping costs was used for the 75% sterilize scenario
As previously described, our simulations used baseline parameter values (eg, mean rates of immigration, abandonment and survival in the population being managed) that were based on published literature and deemed realistic descriptors of typical FRC populations. To account for the possibility that specific populations will exhibit rates that differ from these parameter values and determine how sensitive our findings were to this uncertainty, we ran a series of models using the 75% sterilize scenario in which immigration rates, abandonment rates and adult survival rates were systematically changed. As shown in Figure 5, when both immigration and abandonment were removed from the simulation, creating a demographically closed FRC population, the model predicted that FRCs would be completely eliminated by the ninth year of 75% sterilize management. Conversely, adding individuals to the population through more immigration and abandonment increased final population abundance. Changes in rate of abandonment, which we assumed involved equal numbers of males and females, had a larger effect on final abundance than equivalent changes in rate of immigration, which we assumed was biased toward male cats.47,48 Specifically, for every one-cat increase in abandonment per time step, final abundance increased by 10.4 cats, compared with an increase of 7.6 cats for a corresponding change in immigration rate.

Effects of variation in immigration and abandonment rates on final abundance using the 75% sterilize management scenario. Each data point represents a different mean rate of either immigration (filled circles) or litter abandonment (open triangles), with all other parameters held constant. The slopes of the linear regression on immigration and abandonment are given by mI and mA, respectively. Symbols to the left of the two baseline values represent lower levels of immigration and abandonment. The dots labeled ‘Baseline’ represent the baseline values for immigration and abandonment in this analysis. The dot labeled ‘Isolated’ represents the final abundance associated with 10 years of 75% sterilize management if immigration and abandonment were eliminated. See supplementary material 1 for more details on input parameters
The effects of changes in immigration and abandonment rates on final abundance also extended to management cost. Figure 6 shows that over the 10-year period, the baseline cost of US$9353 was reduced to US$6554 when immigration was eliminated, to US$7109 when abandonment was eliminated and to US$4351 when both were eliminated. Increasing abandonment above baseline by one kitten per time step increased total management cost by US$1988, and the addition of one immigrant per time step increased total cost by US$1686. These factors not only increased cost, but also resulted in higher final abundances (Figure 5).

Effects of variation in immigration and abandonment rates on total cost using the 75% sterilize management scenario. Definitions and description are analogous to Figure 5
Changes in adult survival rate also changed final abundances and costs but less dramatically than changes in immigration and abandonment rates. This is presented in more detail in supplementary material 6.
Discussion
Our findings suggest that management intensity is, in many respects, more important than management type for reducing FRC numbers cost-effectively. Higher-intensity management does require disproportionate investment of time and resources during the early management period (ie, ‘front loading’), but these expenditures are compensated for by cost savings at later time periods and by lower final abundances for a given overall investment. These advantages of a high-intensity approach are especially notable in the open demographic environments that characterize typical communities. Removal management offers the largest and fastest reduction in FRC numbers, if consistently performed at a high intensity, but its cost-effectiveness relies on killing cats rather than adopting them, and doing so at levels higher than those typically performed in communities. High-intensity TNR is a viable, non-lethal option for reducing FRC populations substantially over time. Lower-intensity options can also reduce population size over time, but results achieved for a given cost will be less favorable than with the more intensive alternative. A possible secondary benefit of a sterilization-based approach is that outcomes and costs may be more predictable than with removal-based management (see Figure 4).
Combining these findings with those of our prior research,3,42,49 we offer the following recommendations for optimizing the outcomes and costs of FRC management:
(1) Before implementing new or revised management initiatives for FRCs, specify acceptable goals and outcomes, associated timelines and clearly delineated geographic areas to target for management. 49 In addition, recognize that sustaining reductions in FRC abundance and related desired outcomes (eg, fewer citizen complaints about FRCs, reduced shelter intake and euthanasia of cats and kittens) once they are achieved will require ongoing maintenance management, regardless of management approach, 42 and make provisions for this requirement.
(2) Front-load management activity to sterilize or remove as many cats as possible in the shortest feasible timeframe. 42 This approach will require setting time-specific goals for the number of cats sterilized or removed, and potentially adjusting those goals in response to monitoring data. Front-loading will be more effective when the size of the target area is aligned with trapping and surgical capacities.
(3) For large management areas that are logistically challenging, implement intensive management in phases. For example, several city blocks, a neighborhood, a park or a property with perceived high cat numbers or negative impacts might be the focus of intensive management effort in the first year. Once most of the cats have been sterilized or removed, the focus can move to a second area.
(4) Where possible, define program areas or phase boundaries in ways that leverage natural barriers to minimize opportunities for cat immigration. In addition, initiatives to reduce cat abandonment will be an asset to management outcomes. This includes increasing sterilization rates of owned cats through subsidized spay/neuter offerings or other mechanisms. Reducing immigration and abandonment improves FRC reduction and cost efficiencies for all management types, and it can help TNR approach or even match the levels of FRC reduction otherwise possible only with removal.
(5) When using TNR, removing some cats for adoption rather than returning them to point of capture can speed and increase FRC reduction, though it involves additional cost. Adoption is typically most viable for tame adults and kittens or young cats, and adoption-related costs could potentially be borne by non-profit animal shelters or other sources of support.
(6) Any management program with a goal of reducing FRC density should include scientifically valid monitoring 49 to assess empirically whether its specific interventions are achieving sufficient high treatment intensities. Monitoring will also facilitate periodic adjustment of management targets as needed.
Implementing some of these recommendations effectively may require securing appropriate technical assistance and advice, but this is likely compensated for by improved management outcomes and efficiencies. In addition, there are active efforts underway to develop a non-surgical sterilant that could be used in a field setting as an alternative to traditional sterilization surgery. 50 Once available, this could improve the cost-effectiveness and logistical feasibility of large-scale sterilization-based management.
Model interpretation considerations
Because they attempt to mimic complex systems with multiple causalities and feedback mechanisms, simulation models are always imperfect predictors of real-world outcomes. Our simulation framework incorporated best-available estimates of age-specific survival and reproduction, trapping effort and costs for ‘typical’ management programs. In addition, we incorporated realistic levels of abandonment and immigration. We recognize, however, that different FRC populations may be defined by different sets of demographic parameters, and that programs in some areas may incur higher- or lower-than-average costs to implement the management necessary to achieve particular FRC reduction goals. For these reasons, our findings are more appropriately used to compare and contrast different management scenarios than to predict final abundances and costs explicitly. This interpretive caveat is in accordance with general guidelines on the use of simulation models to explore wildlife population dynamics in associated fields such as conservation biology. 51
In our estimation, the greatest elements of variation and uncertainty in our analysis were those characterizing management costs and trapping effort. With only very limited published information available, we had to derive estimates for these parameters from information solicited from practitioners. Furthermore, our decisions about what to include in costs differed from some other authors. Several other studies estimating costs associated with different FRC management options make what we believe to be unrealistic assumptions about the operation of animal shelters and TNR programs, rely on data from very limited sources, or address very particular situations that may not have broad applicability.52–54 Our approach was to characterize realistic costs (based on averaging costs for multiple organizations) for typical municipal programs conducted by animal control departments and animal sheltering organizations, rather than private veterinary practitioners. Cat management planners should take into consideration local conditions such as mandated holding periods and average length of stay for cats in shelters, which can vary seasonally, geographically and in response to larger industry-wide trends. Volunteers may also serve program functions beyond those explored in our models, generating additional cost savings.
Finally, the management scenarios we simulated all began with a standardized focal population of 50 FRCs. This was an arbitrary choice, and we recognize that focal population sizes in real-world management situations will vary tremendously. In this regard, we note that: (1) in previous tests, our demographic model produced proportionally equivalent final abundances across initial abundance values ranging from 50 to 5000 cats as long as reproduction and survival rates were maintained; 3 and (2) cost estimates are based solely on number of cats treated and number of trap-nights, with unit prices that are scale invariant. Thus, we are confident that the comparisons between scenarios presented above will hold across a wide range of focal population sizes.
Conclusions
To be successful and sustainable, an FRC policy and management strategy must address community-specific goals and account for variables such as available funding and resources, size and distribution of the targeted FRC population, and the degree and speed of FRC reduction deemed necessary or acceptable. In addition, public opinions about the social or ethical acceptability of lethal management approaches, especially when implemented at high intensities, can be a significant consideration in many communities.38,55–61 All of these factors will vary among – and often within – communities, and it is not our purpose in this paper to suggest that there is a universal ‘best’ approach. Rather, our aim is to provide systematically structured information about the biological viability, relative cost-effectiveness and anticipated 10-year reductions in FRC abundance associated with different management options that is well grounded in existing knowledge about FRC populations and the realities of open demographic environments. This information, interpreted in conjunction with community-specific goals, preferences and priorities, can be used to identify management approaches that are likely to produce good results at an acceptable cost, as well as to identify management approaches that are unlikely to be successful. Considering management viability in this way would represent a significant and desirable broadening of the role of science to inform FRC policy decisions.
Supplemental Material
Supplementary material 1
Demographic model structure and input data
Supplemental Material
Supplementary material 2
Estimating trapping effort
Supplemental Material
Supplementary material 3
Basis for cost calculations with respondent list
Supplemental Material
Supplementary material 4
Worksheet to collect economic model input
Supplemental Material
Supplementary material 5
Final vs mean population abundance
Supplemental Material
Supplementary material 6
Sensitivity of final abundance to adult survival
Footnotes
Acknowledgements
Members of the ACC&D Population Dynamics Think Tank in 2011 provided valuable inspiration and information to this project in its early stages. In addition, this work was enhanced through participation in the ‘Modeling Free-Roaming Cat Population Dynamics through the Lens of a Rabies Model Investigative Workshop’, held in November 2011 at the National Institute for Mathematical and Biological Synthesis. We are grateful to the many experts who kindly responded to our requests for survey-based information. We thank R Lacy (Species Conservation Toolkit Initiative) and K Traylor-Holzer (IUCN Conservation Planning Specialist Group) for their valuable advice during model construction. We also appreciate the contributions of D Lawler to the project. Special thanks to the late D Wildt (Smithsonian National Zoological Park) for initiating the collaboration that culminated in this project.
Supplementary material
The following files are available online:
Supplementary material 1: Demographic model structure and input data.
Supplementary material 2: Estimating trapping effort.
Supplementary material 3: Basis for cost calculations with respondent list.
Supplementary material 4: Worksheet to collect economic model input.
Supplementary material 5: Final vs mean population abundance.
Supplementary material 6: Sensitivity of final abundance to adult survival.
Conflict of interest
The authors declared no potential conflicts of interest with respect to the research, authorship, and/or publication of this article.
Funding
This work was supported by the Kenneth A Scott Charitable Trust, a KeyBank Trust that covered publication fees. Early model development was supported by the American Society for the Prevention of Cruelty to Animals and Merial, now Boehringer Ingelheim Animal Health, through grants to the ACC&D. Conception of the project was supported with funding from the National Science Foundation (grant #EF-0832858) to MRS. Funders had no role in study design, data collection and analysis, decision to publish, or preparation of the manuscript.
Ethical approval
This work did not involve the use of animals and therefore ethical approval was not specifically required for publication in JFMS.
Informed consent
This work did not involve the use of animals and therefore informed consent was not required. No animals or humans are identifiable within this publication, and therefore additional informed consent for publication was not required.
References
Supplementary Material
Please find the following supplemental material available below.
For Open Access articles published under a Creative Commons License, all supplemental material carries the same license as the article it is associated with.
For non-Open Access articles published, all supplemental material carries a non-exclusive license, and permission requests for re-use of supplemental material or any part of supplemental material shall be sent directly to the copyright owner as specified in the copyright notice associated with the article.