
Abstract
Objectives
Oxidative stress contributes to chronic kidney disease (CKD) progression in humans and rodent models; F2-isoprostanes (F2-IsoPs) are established biomarkers of oxidative stress. Our primary aim was to evaluate plasma F2-IsoPs in cats with International Renal Interest Society stage 1 and 2 CKD, compared with healthy cats, and to determine whether plasma and urinary F2-IsoPs are equivalent biomarkers. The secondary aim was to assess whether consumption of a renal diet enriched in omega-3 fatty acids led to improvements in plasma and urinary F2-IsoPs.
Methods
Plasma and urinary F2-IsoPs were measured in 24 cats with stage 1 or 2 CKD, and 12 unaffected controls aged ⩾6 years. Twelve CKD cats were re-evaluated after feeding a commercial renal diet for at least 4 weeks.
Results
Median plasma F2-IsoPs were significantly higher in stage 1 CKD (96.2 pg/ml), early stage 2 CKD (83.2 pg/ml) and late stage 2 CKD (80.8 pg/ml) compared with healthy cats (22.8 pg/ml; P = 0.03−0.002). Median urinary F2-IsoPs were significantly higher in cats with stage 1 CKD (231.2 pg/mg) compared with healthy cats (152.5 pg/mg) or cats with late stage 2 CKD (124.8 pg/mg; P = 0.01). Plasma F2-IsoPs remained increased, while urinary F2-IsoPs fell with transition from stage 1 to stage 2 CKD. Feeding a commercial renal diet led to significant decreases in plasma F2-IsoPs in the small group of cats with stage 1 CKD (25−75% decrease) compared with cats with stage 2 CKD (20% decrease to 53% increase; P = 0.01).
Conclusions and relevance
Oxidative stress is prominent in cats with stage 1 CKD. Plasma and urinary F2-IsoPs are not interchangeable biomarkers in cats with stage 2 CKD. Placebo-controlled studies are indicated to evaluate dietary or pharmacologic doses of omega-3 fatty acids on redox stress and progression of renal dysfunction in cats with stage 1 CKD.
Introduction
Chronic kidney disease (CKD) is a common feline geriatric disease, with approximately 65% of cats >14 years of age having International Renal Interest Society (IRIS) stage 2 CKD or higher. 1 Feline CKD is progressive, with few interventions available to halt or reverse disease. 2 Oxidative stress is thought to contribute to the development and exacerbation of renal interstitial injury in animal models and human patients with CKD.3−5 Low plasma omega-3 fatty acid concentrations are associated with a greater decline in renal function over time in geriatric people, 6 and omega-3 fatty acid or vitamin E supplementation decreases progression of renal tubulointerstitial injury, proteinuria and hypertension in rodent models.7−9 Oxidative stress is a promising therapeutic target in CKD.
Eicosanoids, specifically F2-isoprostanes (F2-IsoPs), are generated by free radical-induced oxidation of membrane arachidonic acids. F2-IsoPs have been measured in both plasma and urine as markers of systemic oxidative stress in humans with various chronic diseases,10−12 and are established biomarkers of oxidative stress in humans with CKD.13–15 F2-IsoPs are potent renal arterial vasoconstrictors that can reduce renal blood flow and glomerular filtration rates (GFR).16,17 Therefore, F2-IsoPs are considered not only biomarkers, but also direct mediators of renal injury in vivo.18,19
We recently evaluated urinary F2-IsoPs in cats with CKD across different IRIS stages, with the hypothesis that F2-IsoPs would increase with CKD progression. However, we found that while urinary F2-IsoPs were increased in stage 1, they decreased significantly to subnormal concentrations with progression through stages 2−4. 20 We wanted to assess this early spike in F2-IsoPs in both plasma and urine, and determine whether oxidative stress as measured in either plasma or urine was a viable treatment target in cats with early CKD.
The primary aim of this study was to evaluate plasma F2-IsoPs in cats with IRIS stage 1 and 2 CKD, compared with healthy cats, and to determine whether plasma and urinary F2-IsoPs are equivalent biomarkers in cats with early CKD. The secondary aim was to determine whether consumption of a renal diet enriched in omega-3 fatty acids led to a decrease in either plasma or urinary F2-IsoPs in cats with stage 1 or stage 2 CKD.
Materials and methods
Cat screening and inclusion
Client-owned cats with diagnosed early CKD, or cats aged ⩾6 years with possible CKD, were recruited at the University of Wisconsin–Madison Veterinary Medical Teaching Hospital (UW Veterinary Care). Cats were first screened with urine specific gravity (USG), clinical history and physical examination; cats with a USG <1.035 were further screened with a complete blood count (CBC), serum biochemical panel, serum symmetric dimethylarginine (SDMA) concentrations, 21 complete urinalysis and serum total thyroxine (T4). Cats with IRIS stage 1 and 2 CKD were eligible for inclusion; stage 1 was defined as a serum creatinine <1.6 mg/dl and stage 2 was defined as a serum creatinine of 1.6−2.8 mg/dl (iris-kidney.com). Cats were excluded if they had lower urinary tract signs, or clinical or biochemical evidence of systemic disease such as hyperthyroidism, hepatopathy, chronic enteropathy, heart failure, diabetes mellitus, immune-mediated disease, systemic infection or neoplasia.
For the control group, clinically healthy cats aged ⩾6 years were also recruited from UW Veterinary Care. Control cats had a normal physical examination, no acute illness within the last month and no history of chronic systemic disease. Eligible control cats also had a USG ⩾1.035, and a normal CBC, biochemical panel and serum total T4, with a serum creatinine <1.6 mg/dl and serum SDMA ⩽14 µg/dl.
Age, breed, sex and neuter status, body weight and condition score, current medications and diet were recorded for all cats. Cats could not be on any medication other than routine antiparasitic drugs, with no antioxidant supplements (eg, S-adenosylmethionine, silybin, vitamin C or vitamin E) or diets enriched in omega-3 fatty acids (eg, joint or renal diets) within the previous month. Written informed consent was obtained from all owners, and the study was approved by the University Institutional Animal Care and Use Committee. Cats were recruited from November 2017 to February 2020.
Effect of diet on plasma and urine isoprostanes in cats with CKD
Cats with CKD were also invited to enroll in a diet intervention phase of the study. Cats were provided with several formulations of dry and wet renal diets from the same manufacturer (k/d, dry kibble, canned pâté and canned stews; Hill’s Pet Nutrition), transitioned over 3−4 days and fed the renal diet exclusively for at least 4 weeks. After dietary intervention, cats were rechecked with a physical examination, renal panel, serum SDMA, and plasma and urinary F2-IsoPs.
Study sample collection
At the time of screening blood and urine collection, an additional 0.5 ml of heparinized whole blood and 1−3 ml of urine were collected and refrigerated immediately. Within 1 h of collection, plasma was harvested in a refrigerated centrifuge, and both plasma and urine were stabilized with butylated hydroxytoluene to a final concentration of 0.005%. Urine was then centrifuged to remove particulates, and the urine supernatants and plasma were frozen in aliquots at −80°C until shipping for F2-IsoPs measurements.
Plasma total and urinary free F2-IsoPs (8-iso prostaglandin F2α) were quantified by a commercial laboratory using affinity column purification followed by a competitive enzyme immunoassay (8-Isoprostane Express EIA kit; Cayman Chemical), and urine values were normalized to urine creatinine, as previously reported. 20 In addition, our previous urinary F2-IsoP data from a separate population of cats with CKD, analyzed using the same methods in the same contract laboratory, 20 were included to increase power for comparisons among CKD groups.
Statistical analyses
Plasma F2-IsoPs and urinary F2-IsoP:creatinine ratios were compared among cats with stage 1 CKD, stage 2 CKD and healthy controls using a Kruskal−Wallis test followed by a pairwise Mann−Whitney U-test. Stage 2 CKD cats were also divided into early stage 2 (creatinine 1.6–2.1 mg/dl) and late stage 2 (creatinine 2.2−2.8 mg/dl) to further assess the relationship between F2-IsoPs and disease progression. Correlations between plasma and urinary F2-IsoPs, and between F2-IsoPs and either serum creatinine or SDMA, were assessed with Spearman rank correlation tests. For cats assigned to a renal diet after initial evaluation, plasma and urinary F2-IsoPs were compared between baseline and post-diet using a Wilcoxon signed rank test, and percent changes were compared between CKD stage 1 and 2 cats using a Mann−Whitney U-test. Serum creatinine and SDMA were also compared between baseline and renal diet consumption using a Wilcoxon signed-rank test to ensure that IRIS stage had not changed. The threshold for statistical significance was P <0.05.
Results
Population demographics
In addition to enrolling cats with known stage 1 or stage 2 CKD, we screened over 250 cats aged ⩾6 years for possible early CKD without apparent comorbidities, using a medical record review and USG. Of these, 37 cats (approximately 15%) were apparently healthy and had dilute urine, and were further screened with a physical examination, targeted history, CBC, biochemical panel, complete urinalysis and serum total T4. Thirteen of these cats were censored (eight for concurrent laboratory abnormalities or ineligible diets; four for stage 3 CKD; and one for missing biochemical data), leaving 24 cats enrolled with stage 1 or stage 2 CKD. Baseline demographics for all enrolled CKD cats, plus 12 unaffected controls, are given in Table 1. Cats with CKD were significantly older (median 14.0 years) than unaffected control cats (median 9.6 years; P = 0.02).
Demographic characteristics of healthy cats and cats with chronic kidney disease (CKD) assayed for plasma and urinary F2-isoprostanes (8-iso prostaglandin F2α)

Data are median (range)
P = 0.02, compared with controls
BCS = body condition score; SDMA = symmetric dimethylarginine; USG = urine specific gravity; CKD stage 2A = early stage 2 CKD (creatinine of 1.6–2.1 mg/dl); CKD stage 2B = late stage 2 CKD (creatinine of 2.2–2.8 mg/dl)
Plasma F2-IsoPs in cats with CKD
Plasma F2-IsoPs were more than three-fold higher in cats with CKD vs healthy cats (Figure 1), and were significantly higher in each CKD group compared with unaffected controls (22.8 pg/ml): stage 1 CKD (96.2 pg/ml; P = 0.002); early stage 2 CKD (83.2 pg/ml; P = 0.03); and late stage 2 CKD (80.8 pg/ml; P = 0.01). Plasma F2-IsoPs did not differ significantly among early CKD groups, and no trend toward increasing plasma F2-IsoPs between stage 1 and early to late stage 2 CKD was apparent (Figure 1). Furthermore, plasma F2-IsoPs were not significantly correlated with serum creatinine (r = 0.09, P = 0.59) or SDMA (r = 0.28, P = 0.09) in this small population.
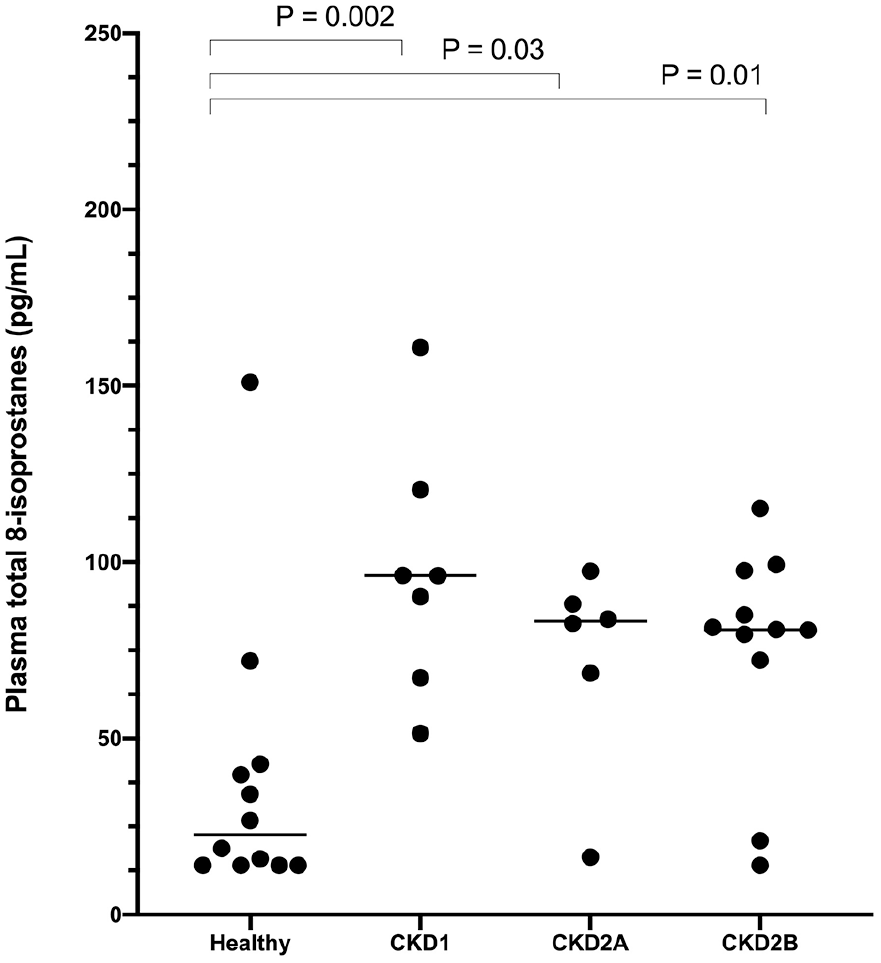
Plasma total 8-isoprostanes measured in healthy cats and cats with International Renal Interest Society (IRIS) stage 1–2 chronic kidney disease (CKD). For the purposes of this study, IRIS stage 2 CKD was divided into early stage 2 (CKD2A: creatinine 1.6–2.1 mg/dl) and late stage 2 (CKD2B: creatinine 2.2–2.8 mg/dl). Horizontal lines indicate group medians, and brackets indicate significant P values between groups
Urinary F2-IsoPs in cats with CKD
Urinary F2-IsoPs (normalized to urine creatinine) were observably highest in cats with stage 1 CKD (median 231.2 pg/mg), compared with early stage 2 (168.2 pg/mg), late stage 2 CKD (124.8 pg/mg) and unaffected cats (152.5 pg/mg; Figure 2a). This difference was statistically significant between stage 1 and late stage 2 CKD (P = 0.01). Urinary F2-IsoPs were inversely correlated with serum creatinine (r = –0.38, P = 0.02) but not with SDMA (r = –0.09, P = 0.60).

Urinary free 8-isoprostanes (normalized to urine creatinine) in healthy cats and cats with International Renal Interest Society (IRIS) stage 1 and 2 chronic kidney disease (CKD). IRIS stage 2 CKD was divided into early stage 2 (CKD2A: creatinine 1.6–2.1 mg/dl) and late stage 2 (CKD2B: creatinine 2.2–2.8 mg/dl) for these analyses. Horizontal lines indicate group medians, and brackets indicate significant P values between groups. (a) Data in 24 cats with CKD and 12 unaffected controls from the current study. (b) Data from the current study combined with our previous urinary data from a distinct population of cats analyzed using the same methods 20
We also combined urinary F2-IsoP data from these cats with another population of cats studied recently by our group using the same methods. 20 This combined analysis reinforced the current findings and was able to detect significantly higher urinary F2-IsoPs in stage 1 CKD compared with both early and late stage 2 CKD (P ⩽0.009; Figure 2b). Interestingly, urinary F2-IsoPs were not correlated at all with plasma F2-IsoPs across cats with CKD (Figure 3; r = 0.02, P = 0.91), or across cats separated into stage 1 or stage 2 disease (data not shown), showing that these two testing matrices are not equivalent in cats with CKD.

Lack of correlation between urine and plasma 8-isoprostanes across 12 healthy cats and 24 cats with International Renal Interest Society stage 1 and 2 chronic kidney disease. r = 0.02, P = 0.91
Effect of renal diet on plasma and urinary F2-IsoPs
Seventeen cats with CKD were enrolled in the diet trial and 12 of these cats consumed the provided renal diets exclusively and returned for the scheduled recheck. Cats were re-evaluated a median of 56 days after first assessment (range 35–68 days, with one outlier cat rechecked at 150 days). The renal diet had no discernable overall effect on plasma F2-IsoPs (P = 0.57), with a median decrease of 12% but a 95% confidence interval (CI) of –27 to 25. Cats with stage 1 CKD had a significantly greater improvement in plasma F2-IsoPs (25–75% decrease) after feeding a renal diet than did cats with stage 2 CKD (20% decrease to 53% increase; P = 0.01; Figure 4a,b). However, this needs to be confirmed in a larger population.
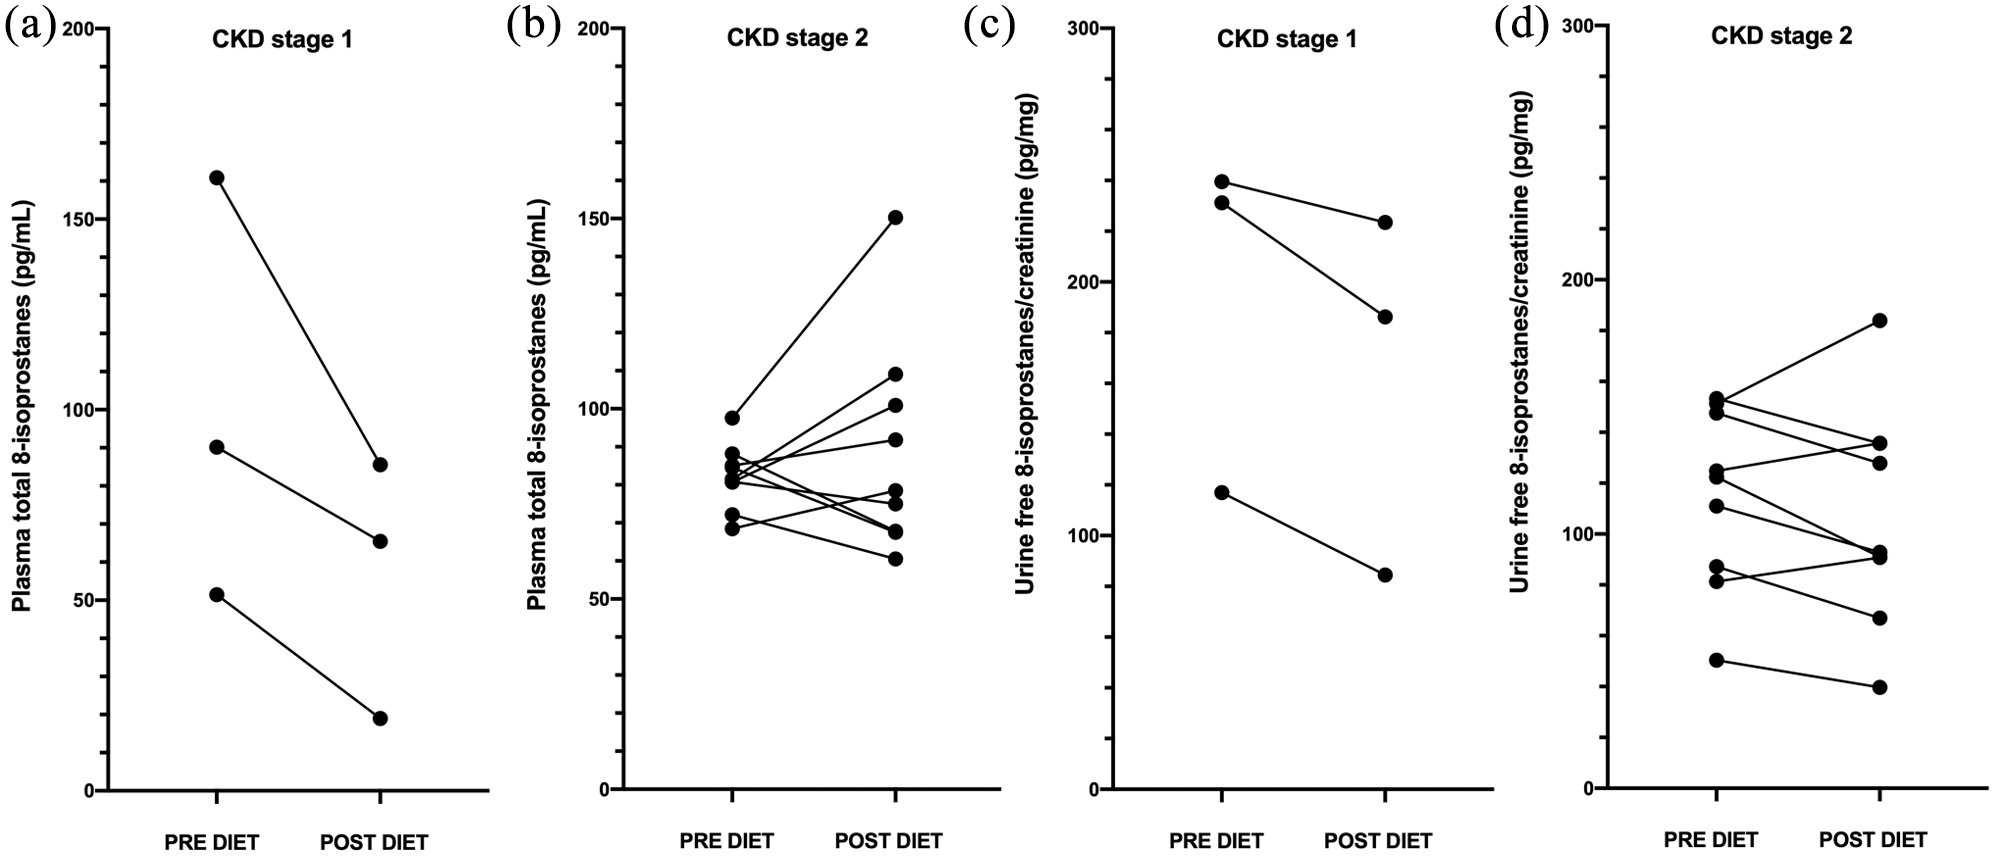
Changes in (a,b) plasma F2-IsoPs and (c,d) urinary F2-isoprostanes (F2-IsoPs) in cats with stage 1 or 2 chronic kidney disease (CKD) fed a renal diet for 4–8 weeks
The renal diet was associated with an overall median decrease in urinary F2-IsoPs of 15% (95% CI –23 to 9; P = 0.06). The dietary response in cats with stage 1 CKD (16–45% decrease) and stage 2 CKD cats (31% decrease to 33% increase; P = 0.19; Figure 4c,d) was not significantly different in this small population.
Between baseline and post-renal diet, there were no clinically or statistically significant changes in serum creatinine (median pre-diet 2.3 mg/dl, post-diet 2.1 mg/dl; P = 0.68) or SDMA (median pre-diet 14 µg/dl, post-diet 13 µg/dl; P = 0.89). Only one cat had a change in CKD stage when rechecked on the renal diet (creatinine increase from 1.4 to 1.9 mg/dl over 64 days); this cat showed an apparent decrease in both plasma F2-IsoPs (from 160.9 pg/ml to 85.6 pg/ml) and urinary F2-IsoPs (from 117.0 pg/mg to 84.5 pg/mg) during the diet trial. The cat with the largest increase in plasma F2-IsoPs (Figure 4b) had an increase in both creatinine (from 2.4 mg/dl to 2.8 mg/dl) and SDMA (from 13 µg/dl to 18 µg/dl) after 43 days on the renal diet, despite an improvement in blood urea nitrogen and phosphorous. This cat had a modest decrease in urinary F2-IsoPs (from 153.3 pg/mg to 135.6 pg/mg).
Discussion
We previously measured urinary F2-IsoPs in cats with IRIS stage 1–4 CKD and found an initial increase in stage 1, followed by a significant and unexpected decrease to subnormal concentrations with further CKD progression. 20 This prompted the question of whether this early peak and subsequent fall in urinary F2-IsoPs reflected actual changes in systemic oxidative stress, as measured by plasma F2-IsoPs, and whether this might be a viable treatment target.
In the current study, we found that plasma F2-IsoPs were increased in cats with stage 1 CKD and remained elevated in stage 2 CKD. We did not observe a worsening of plasma F2-IsoPs between stage 1 and late stage 2 CKD, in contrast to human studies that found increasing plasma F2-IsoPs with increasing CKD stage.14,22 The stable plasma F2-IsoPs across stage 1 and stage 2 CKD in our population could be due to the small sample size or our focus on only early CKD.
We did not evaluate cats with stage 3 or 4 CKD because we were interested in potential intervention targets early in the clinical course of CKD. In addition, many later stage cats are on renal diets or medications to modulate blood pressure or proteinuria, which would bias our results. The apparent stability in plasma F2-IsoPs in cats from stage 1 to late stage 2 CKD could also reflect differences in the sequelae of CKD between humans and cats. In humans, oxidative stress from CKD induces endothelial cell dysfunction and subsequent atherosclerosis and cardiovascular disease, which can trigger additional inflammation and redox stress. 23 In contrast, cats with CKD do not appear to develop this positive feedback loop of cardiovascular inflammation. Overall, our data show that systemic oxidative stress is present even in stage 1 CKD in cats. Given the role of oxidative stress in CKD progression in other species,3–9 this may merit treatment even before standard interventions are recommended (iris-kidney.com).
Urinary F2-IsoPs were highest in cats with stage 1 CKD, consistent with our previous data. 20 When urinary data from our previous and current studies were combined, we found significantly higher urinary F2-IsoPs in stage 1 CKD cats even when compared with early stage 2 CKD. Unlike plasma F2-IsoPs, urinary F2-IsoPs decreased significantly with progression to later stage 2 CKD. The observed fall in urinary F2-IsoPs in the presence of sustained systemic oxidative stress could result from a diminishing capacity to filter and excrete F2-IsoPs from the systemic circulation. 24 A recent longitudinal cohort study of children with CKD found that urinary F2-IsoPs also decreased over time as estimated GFR fell, 15 which is compatible with our data. These findings could also reflect early renal redox stress followed by progressive loss of the cells that locally generate urinary F2-IsoPs; however, this is not consistent with the sustained increase in plasma F2-IsoPs. Our data show that urinary and plasma biomarkers of oxidative stress are not interchangeable in cats with CKD.
We did not perform repeated measures of plasma and urinary F2-IsoPs over time to determine normal biologic variability, and it is not clear what percent reduction in F2-IsoPs would have clinical benefits. Plasma F2-IsoPs varied about seven-fold and urinary F2-IsoPs about four-fold among cats with stage 2 CKD. This may reflect individual differences in disease progression and redox stress, but could also have been biased by subclinical differences in hydration or occult concurrent disease. We attempted to reduce the latter possibility by screening cats with CBC, biochemical panel and T4, as well as physical examination and clinical history.
Obesity can increase F2-IsoPs in human patients with CKD 25 and in otherwise healthy cats. 26 In our study, only two cats had a body condition score over 6; these cats did not have outlier high plasma F2-IsoPs, so obesity was an unlikely confounder in our population. Additionally, loss of muscle mass in patients with CKD could have falsely lowered creatinine and led to IRIS stage misclassification. However, none of the cats had clinical evidence of sarcopenia on physical examination. Of the 24 cats enrolled, 14 had serum creatinine assessed on at least two occasions for IRIS staging. The remaining 10 cats were assessed at only a single time point, but this was combined with USG, SDMA and clinical hydration status. However, it is possible that IRIS staging may have differed in some of these cats if they had been assessed at least twice.
When cats with early CKD were fed a commercial renal diet, there was no overall consistent change in plasma or urinary F2-IsoPs. This may have been due, in part, to variable follow-up times, despite frequent owner prompts. However, the few cats enrolled with stage 1 CKD had a significantly greater decline in plasma F2-IsoPs than cats with stage 2 CKD, and this deserves further exploration. A post-hoc sample size calculation indicated that 52 cats with stage 1 CKD would be needed in a placebo-controlled dietary trial (26 cats fed their standard diet and 26 cats fed the renal diet in this study) to confirm, with 80% power, the changes that we observed in plasma and urinary F2-IsoPs over 4–8 weeks. While this seems attainable at a single institution, we struggled to recruit an adequate number of cats with stage 1 CKD, even with screening >250 cats and the addition of SDMA to our enrollment recruitment criteria. 27
We found dilute urine in about 15% of apparently healthy cats over 6 years of age, which is consistent with a previous study that reported stage 1 CKD in about 14% of cats of all ages. 1 Notably, the previous study also found stage 1 CKD in 12% of cats <5 years of age, albeit with a different staging algorithm. We may have been able to enroll more eligible stage 1 cats without comorbidities if we had screened younger cats. Enrollment in a dietary trial could also be enhanced by providing incentives to owners of stage 1 CKD cats, who may be less motivated to participate given their cats’ normal blood work and clinical status.
The prescribed feline renal diets contained, on average, twice the omega-3 fatty acids of standard non-renal diets, according to data provided by the manufacturer. As fed, the renal diets provided between 187 mg and 264 mg of omega-3 fatty acids per 100 kcal, or approximately 90–130 mg/kg/day. Human patients with CKD treated with a lower dosage of omega-3 fatty acids (approximately 30–60 mg/kg/day) did not show improvements in estimated GFR over 2–6 months.28,29 In rats, however, a much higher omega-3 fatty acid dosage (300 mg/kg/day for 3 months) showed therapeutic effects on both inflammatory mediators and tubulointerstitial fibrosis. 8 Healthy older cats fed a renal diet further supplemented with 1.41% omega-3 fatty acids as fed (estimated to provide approximately 690 mg/kg/day of omega-3 fatty acids) over 6 months showed stable estimated GFRs; however, these cats had normal GFR at baseline. 27 Partially nephrectomized dogs fed fish oil at 15% of their daily ration for 20 months showed significant improvements in creatinine clearance that were not seen with control diets. 30 These previous findings, along with our data, support the future evaluation of pharmacologic dosages of omega-3 fatty acids on both oxidative stress and renal function in cats with stage 1 CKD.
Conclusions
Overall, our study demonstrates that both plasma and urinary F2-IsoPs are increased in cats with stage 1 CKD, with persistent increases in plasma F2-IsoPs with transition to stage 2 CKD but a discordant fall in urinary F2-IsoPs. Therefore, oxidative stress is present very early in CKD pathogenesis in cats, but plasma and urinary F2-IsoPs are not interchangeable as biomarkers of oxidative stress with CKD progression. We also found that initiation of a renal diet has the potential to decrease plasma and urinary F2-IsoPs in cats with stage 1 CKD. Oxidative stress is therefore a viable treatment target in cats with stage 1 CKD, and follow-up placebo-controlled studies are indicated to evaluate the effect of early intervention with dietary or pharmacologic doses of antioxidants on the progression of renal dysfunction in cats with stage 1 CKD.
Footnotes
Acknowledgements
The authors thank Dr Jennifer Hull at Hill’s Pet Nutrition for facilitating the provision of food for the study, Kaitlyn Craun and Amanda Brooks for assistance with sample collection and processing, and the cat owners for kindly enrolling their cats in the study.
Conflict of interest
The authors declare no potential conflicts of interest with respect to the research, authorship, and/or publication of this article.
Funding
This study was supported by a Companion Animal grant from the University of Wisconsin–Madison and by a Clinical Study Grant for Residents from Hill’s Pet Nutrition. Hill’s Pet Nutrition also provided food for the study but did not participate in study design, data analysis or manuscript preparation.
Ethical approval
This work involved the use of non-experimental animals (owned or unowned) and procedures that differed from established internationally recognized high standards (‘best practice’) of veterinary clinical care for the individual patient. The study therefore had ethical approval from an established committee as stated in the manuscript.
Informed consent
Informed consent (either verbal or written) was obtained from the owner or legal custodian of all animal(s) described in this work (either experimental or non-experimental animals) for the procedure(s) undertaken (either prospective or retrospective studies). No animals or humans are identifiable within this publication, and therefore additional informed consent for publication was not required.