
Abstract
Objectives
It can be challenging to collect sufficient blood from feline patients for both a biochemical profile and a complete blood count (CBC). The ability to generate accurate hematologic and biochemical data from a single, small (<2 ml) sample could reduce patient stress and improve clinical efficiency. The objective of this study was to determine the impact of preheparinization and/or sample size on routine hematology findings in cats.
Methods
Blood was collected from 20 healthy cats; measured aliquots were placed directly into tubes containing either EDTA or lithium–heparin (Hep). Within 2 mins, specific volumes were removed from the Hep tubes and placed in additional EDTA tubes. Four distinct sample sizes/types were created from each cat: (1) 1.3 ml EDTA (criterion standard); (2) 0.5 ml EDTA; (3) 1.3 ml Hep + EDTA; and (4) 0.5 ml Hep + EDTA. Three CBCs were performed on each sample using an automated bench-top hematology analyzer. Drops of blood were contemporaneously used to create three air-dried stained slides from each tube. Triplicate results were averaged for statistical analysis; results were compared across all sample types and against the criterion standard. Significance was set at P <0.05.
Results
Preheparinization did not significantly impact determinations of erythrocyte number, hematocrit, hemoglobin concentration, mean cell volume and neutrophil count. Platelet counts for the non-traditional samples correlated poorly with the criterion standard, although numbers could be effectively estimated using stained slides. Cell morphology was well preserved across all sample types.
Conclusions and relevance
These results indicate that a 0.5 ml preheparinized EDTA blood sample can generate clinically useful hematologic data (excluding platelet count) in cats, using a bench-top analyzer. Our findings support the collection of a single small (<2 ml) sample that can be used for both biochemical and hematologic analyses. Further studies are needed to verify these findings using other hematology machines and in diseased cats.
Introduction
Blood collection from cats can be challenging, owing to the need for effective restraint and the tendency for feline blood to clot during collection or soon after. Jugular venipuncture generally permits the rapid collection of enough blood to perform a complete blood count (CBC) and a biochemical profile, but requires skilled restraint and places members of the veterinary team near the patient’s mouth and claws. The cephalic and medial saphenous veins are also routinely used in cats; the latter is often visible without the need to shave and may be accessed with gentle restraint in lateral recumbency. However, the small diameter of these vessels limits the volume and rate of blood collection; clotting can therefore limit testing options or necessitate repeated venipuncture. A low-stress sampling protocol that reliably permits the collection of enough blood for both a CBC and a biochemical profile would confer substantial benefits to both clinician and patient.
Blood intended for hematologic analysis must be promptly anticoagulated; potassium EDTA is routinely used as white cell morphology is well preserved.1,2 However, as this agent binds calcium, samples that have been in contact with EDTA are unsuitable for routine biochemical profiles. For this reason, it is advisable to fill the EDTA tube after filling serum or lithium–heparin (Hep) tubes to minimize the risk of factitious hyperkalemia and/or hypocalcemia; 3 unfortunately, this delay increases the likelihood of clot formation in samples intended for hematology.
Heparinized samples are traditionally regarded as less suitable for hematologic analysis, as this anticoagulant may adversely affect leukocyte morphology and is associated with clumping of both white blood cells and platelets in various species. 1 However, owing to issues with available blood volumes, heparinized samples are routinely used for both hematologic and clinical chemistry analysis in rodents. In a recent study, hematology findings for blood samples collected from 21 rats and immediately anticoagulated with either Hep or EDTA were compared. 4 Mean platelet count for the two sets of results were substantially discordant but mean red blood cell (RBC) count and hemoglobin concentration (Hb) were similar. Mean total white blood cell (WBC) count and mean cell volume (MCV) were significantly different from a statistical perspective, but were quite similar from a clinical perspective (9.20 K/µl vs 9.44 K/µl [P <0.0001] and 59.35 fl vs 60.41 fl [P = 0.009]). These findings suggest that heparinized samples may provide clinically useful hematologic information in rats.
In a similar study looking at human cord blood preserved with either Hep or EDTA, routine erythrocyte parameters and total WBCs generated using the Hep samples were within 5% of those reported for the EDTA samples. Automated platelet counts were significantly lower in the Hep samples. 5 The effects of Hep vs EDTA have also been reported in lambs; samples preserved in Hep had significantly higher RBCs, Hb and hematocrits (HCTs), although all results were within 5% of the EDTA findings. 6 Total WBCs were similar; platelets were not reported.
The goals of this study were to determine the impact of preheparinization and sample size on hematology results reported by an in-house analyzer, and on the microscopic appearance of the various leukocytes (ie, white cell morphology). It was hypothesized that: (1) sample heparinization prior to mixing with EDTA would not significantly impact erythrocyte and leukocyte parameters; (2) findings for 1.3 ml and 0.5 ml preheparinized EDTA samples would be similar; and (3) preheparinization would not significantly impact leukocyte morphology.
Materials and methods
At least 5 ml of blood was collected via jugular venipuncture from 20 clinically healthy client-owed cats. Samples were collected using a plain 12 ml plastic syringe and a 20 G, 1-inch needle. Immediately following collection, the needle was removed from the syringe, and two aliquots (1.3 ml and 0.5 ml) were placed in screw-top, non-vacuum EDTA-containing tubes (Sarstedt AG), with a recommended volume of 1.3 ml. Two additional aliquots of 1.3 ml were placed into screw-top, non-vacuum tubes containing Hep (BD Microtainer Tube; Becton Dickinson), with a recommended volume of 1.3 ml. Within 2 mins, either 1.3 ml or 0.5 ml was extracted from each Hep tube and transferred into a fresh EDTA tube (Sarstedt AG), also with a recommended volume of 1.3 ml. Four different sample sizes and types were therefore generated from each cat, namely 1.3 ml EDTA, 0.5 ml EDTA, 1.3 ml Hep + EDTA and 0.5 ml Hep + EDTA.
Within 5 mins, a licensed veterinary technician began to process the four samples. Sample order was deliberately randomized. Each was run in triplicate through an in-house hematology machine (HM5; Zoetis Diagnostics), as per the manufacturers’ instructions. Samples were maintained at room temperature and processing was completed within 45 mins. In addition, three drops of blood were removed from each sample and used to create three standard blood smears. These were air-dried and stained with a Romanowski-type stain (DipQuick Stain; Jorgensen Laboratories). Each slide was identified using a random three-digit number and submitted to a blinded board-certified clinical pathologist (CJL) for an assessment of WBC morphology. Each slide was evaluated for evidence of platelet clumping, and a qualitative assessment of platelet number (adequate or decreased).
Four erythrocyte parameters were evaluated from each CBC, namely RBC count, calculated HCT, Hb and MCV. The WBC count, along with counts for neutrophils, lymphocytes, monocytes and eosinophils, were tabulated. Automated platelet counts were also included in the data analysis.
Statistical analysis was performed using a commercially available software program (GraphPad Prism 8.3). Data were tested for normality using the D’Agostino and Pearson test, with alpha set at 0.05. The mean ± SD for each triplicate set of results was determined. Triplicate sets (n = 80 for each parameter) containing outliers were identified using the ROUT method on the SDs, with Q set conservatively at 0.1. Essentially, this method identifies any triplicate set in which one value was substantially discordant from the other two. The authors then scrutinized each triplicate set to identify the outlying result and exclude it from further analysis. A χ2 test was used to compare the number of outlying data points for the various sample types and the impact of sample size on out-of-range results. The Pearson correlation calculation was used to compare the average from each set of triplicate results between the various sample sizes and types, with the 1.3 ml EDTA samples as the criterion standard. Correlation was expressed as r, with 1.0 indicating perfect positive correlation. Agreement between selected parameters and for selected sample types was assessed by the Bland–Altman method (using the difference between the two sets of results [ie, criterion standard minus other] vs the average of the two sets of results); confidence intervals were not reported for the Bland–Altman plots owing to the small number of paired sets of results (n = 20). Two-tailed paired t-tests were used to identify differences between results. Significance was set at P <0.05.
The study protocol was approved by the Texas A&M University Animal Care and Use Committee (#2019-0210). Informed client consent was obtained from each owner.
Results
Twenty cats (15 domestic shorthair, three domestic longhair and two Siamese) were enrolled. Median age was 6 years (range 3–11 years); 17 were castrated males and three were spayed females. All cats were judged to be healthy based on physical examination and recent medical history. An adequate volume of blood was successfully collected from all 20 cats and used to create a 1.3 ml EDTA sample, a 0.5 ml EDTA sample, a 1.3 ml Hep + EDTA sample and a 0.5 ml Hep + EDTA sample from each individual. Each sample was run in triplicate, generating a total of 240 CBCs (12 reports for each cat). Ten specific parameters were evaluated on each CBC; a total of 2400 individual measurements were therefore included in the data set.
All of the 10 hematologic parameters passed the normality test, so the mean of each triplicate set was used for data analysis. A total of 46 outliers (1.9%) were identified by the ROUT method and censored from further analysis. These were not associated with any particular cat(s). The proportions of outliers were not uniformly distributed across the sample types, with significantly more (n = 19/46; 41%) identified in the 1.3 ml EDTA samples (P = 0.042).
Although all the cats appeared clinically normal, at least one of the 10 parameters was outside the machine’s reference interval on at least one CBC report for 18/20 cats. In all, 260/2354 (11.0%) parameters met this criterion, with a median number of one per CBC report (range 0–6). Thrombocytopenia was the most common issue; this was identified on 107/240 reports (44.6%) and was listed in at least one CBC report in 14/20 cats. A subnormal platelet count was significantly associated with heparinization (65 Hep + EDTA vs 42 EDTA; P = 0.0156). One cat accounted for 68/260 (26.2%) out-of-range values; this individual had a mild macrocytic anemia (RBC count: 4.39 ±0.139 M/µl; MCV: 53 ± 0 fl), along with a lymphopenia (0.885 ± 0.286 K/µl) and thrombocytopenia (292 ± 10 K/µl).
Platelet count was the most variable parameter (Figure 1), with some highly discordant values reported in some individuals. Pearson correlation coefficients were calculated for the 10 targeted parameters across the four sample types, with the 1.3 ml EDTA sample regarded as the criterion standard (Table 1).

Graph of mean ± SD platelet counts for 20 cats as determined on four different blood sample types/sizes. See text for further details
Correlation (Pearson coefficient) for selected hematology parameters obtained using various sample sizes and types with the 1.3 ml EDTA sample designated as criterion standard (n = 20 cats)

RBCs = red blood cells; HCT = hematocrit; Hb = hemoglobin; MCV = mean cell volume; WBCs = white blood cells
Correlation between the criterion standard and the three other sample types for RBC count, HCT, Hb and MCV was acceptable (r >0.9). Correlation results were particularly good for the 0.5 ml Hep + EDTA samples, with r ⩾0.97 for all four erythrocyte parameters.
As the ability to obtain reliable hematologic data using a small-volume, preheparinized blood sample provides the greatest potential benefits from a clinical perspective, detailed comparisons were made between results for the 1.3 ml EDTA (ie, the criterion standard) and the 0.5 ml Hep + EDTA samples. Bland–Altman plots were generated for RBC count, HCT, Hb and MCV for these two sample types. The difference between mean RBC counts for 17/20 paired results was within 0.5 million of their average (Figure 2); the bias was –0.1582 (SD 0.2595). Differences in HCT for all 20 paired results were <3% (Figure 3); bias was –0.3656 (SD 1.191). For Hb concentration, 19/20 paired results differed by ⩽0.6 g/dl from the average; bias was –0.14 (SD 0.379) (Figure 4). MCVs were well matched, with all differences in paired means ⩽2 fl; bias was 0.3333 (SD 0.5298) (Figure 5).

Bland–Altman plot of averaged red blood cell count (RBC; ml/µl) for 1.3 ml EDTA samples (gold standard) and 0.5 ml Hep + EDTA samples collected from 20 cats

Bland–Altman plot of averaged calculated hematocrit (HCT; %) for 1.3 ml EDTA samples (gold standard) and 0.5 ml Hep + EDTA samples collected from 20 cats

Bland–Altman plot of averaged hemoglobin concentration (Hb; g/dl) for 1.3 ml EDTA samples (gold standard) and 1.3 ml Hep + EDTA samples collected from 20 cats

Bland–Altman plot of averaged mean cell volume (MCV; fl) for 1.3 ml EDTA samples (gold standard) and 1.3 ml Hep + EDTA samples collected from 20 cats
Two-tailed paired t-tests were performed to compare erythrocyte parameters for the 1.3 ml EDTA and 0.5 ml Hep-EDTA samples. Findings for the RBC count, HCT and Hb were similar, with no evidence of a consistent bias or error. However, MCVs reported using the 0.5 ml Hep + EDTA samples were significantly lower than results obtained with the standard samples (P = 0.011), despite excellent correlation between the two sets of results (r = 0.99)
Bland–Altman plots were generated to compare WBC and neutrophil counts for the 1.3 ml EDTA and 0.5 ml Hep + EDTA samples. Some of the differences for WBC count were substantial and exceeded 3 K/µl for 3/20 cats; bias was –0.2489 (SD 1.532) (Figure 6). Neutrophil counts differed by >2 K/µl for two individuals; bias was –0.3711 (SD 0.8491) (Figure 7).

Bland–Altman plot of averaged total white blood cell counts (WBC; K/µl) for 1.3 ml EDTA samples (gold standard) and 0.5 ml Hep + EDTA samples collected from 20 cats
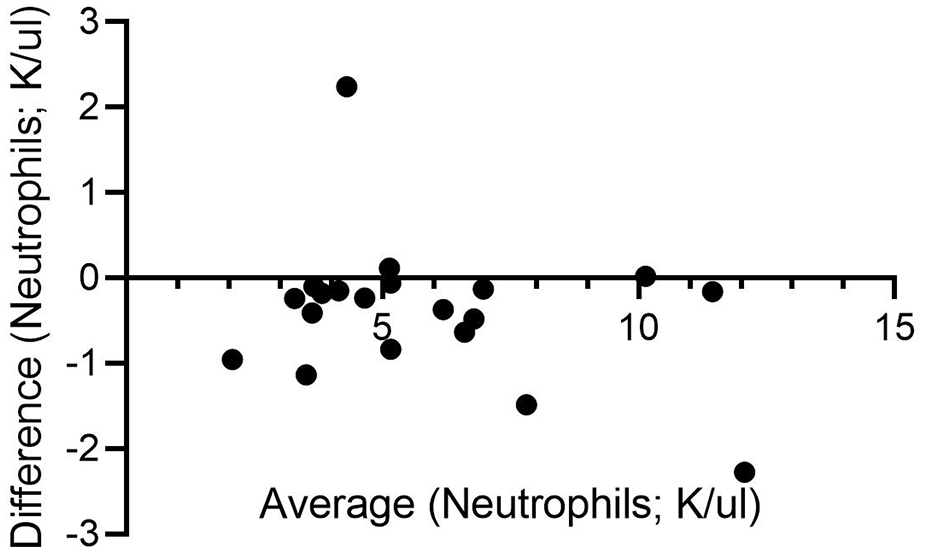
Bland–Altman plot of averaged neutrophil counts (K/µl) for 1.3 ml EDTA samples (gold standard) and 0.5 ml Hep + EDTA samples collected from 20 cats
A paired t-test comparing WBCs derived from these two sample types did not identify a significant difference. There was a trend towards an under-reporting of neutrophil counts with the 0.5 ml Hep + EDTA samples, but this did not achieve statistical significance (P = 0.0655).
The pathologist reported acceptable WBC morphology on all the slides evaluated; there was no evidence that heparinization affected the appearance of any of the white cell subsets or created challenges in the performance of a manual 100-cell differential.
Sample size was found to markedly impact platelet counts; very poor correlation with the criterion standard was found for both the 0.5 ml EDTA and 0.5 ml Hep-EDTA samples (r <0.3 for both). The 1.3 ml Hep + EDTA samples performed substantially better than either of the 0.5 ml samples (r = 0.86).
The mean platelet count was below 250 K/µl for 4/20 of the 1.3 ml EDTA samples. The pathologist reported subjectively decreased platelets and evidence of clumping on 3/4 slides associated with these samples. Three of these four were also reported to have counts <250 K/µl with the 0.5 ml EDTA, 1.3 ml Hep + EDTA and 0.5 ml Hep + EDTA samples. Only one sample set was substantially discordant, with very low mean platelet counts for both 1.3 ml samples (63 K/µl for 1.3 ml EDTA; 77 K/µl for 1.3 ml Hep + EDTA) and robust counts for both 0.5 ml samples (765 K/µl for 0.5 ml EDTA; 667 K/µl for 0.5 ml Hep + EDTA).
Discussion
The primary purpose of this study was to determine the impact of preheparinization on CBC results and WBC morphology in cats. The findings reported indicate that useful hematology data can be obtained from preheparinized EDTA blood using an in-house analyzer. In addition, results from 0.5 ml samples were comparable to those for 1.3 ml samples (with the exception of the platelet count). These results support the generation of a single, small-volume (⩽2 ml) heparinized sample; a 0.5 ml aliquot can then be promptly transferred to an EDTA tube for hematologic analysis while the remainder is used for biochemical testing. This approach simplifies feline sample collection and may reduce patient stress and the need for jugular venipuncture.
Preheparinization and sample size had minimal impact on the erythrocyte parameters evaluated, namely RBC count, Hct, Hb and MCV. Although reported MCVs were significantly smaller for the 0.5 ml Hep + EDTA samples, this difference was not clinically impactful. Total WBC, neutrophil and lymphocyte counts for all three non-traditional samples were well correlated with the criterion standard (r ⩾0.88 for all), but correlation for monocyte and eosinophil counts was somewhat disappointing. This finding is not surprising, as these cell types each usually constitute <5–10% of the total WBCs and small differences in the percentages identified will therefore have a much greater impact on the total number. As cell morphology was adequately preserved across all sample types, results can be readily verified with a manual 100 cell differential.
It is interesting to note that platelet counts for both 0.5 ml samples correlated very poorly (r <0.2) with the 1.3 ml EDTA samples. This finding is contradictory to a previous study looking at the impact of sample size on feline CBC results generated using a reference laboratory analyzer. 7 In that study, platelet counts for 0.5 ml aliquots of blood placed in EDTA microsample tubes were similar to 2.5 ml samples placed in EDTA vacuum tubes (r = 0.91). This discordancy may simply reflect issues with feline platelets; these are known to aggregate quickly, resulting in erroneous machine counts. Fortunately, clumping is easily recognized on a blood smear, and clinically significant thrombocytopenic disorders are uncommon in cats. 8 If an accurate platelet count is important, it would be prudent to rely on a sample placed immediately into EDTA.
It is also possible that the discrepant platelet counts reported in this study were influenced by limitations inherent to bench-top analyzers. In-house hematology devices are routinely used in companion animal practice, and may allow clinicians to identify and address medical issues in a more timely fashion. Appropriate operator training and routine quality control are needed to achieve reliable results. 9 There is limited information in the peer-reviewed literature regarding the reliability of these devices, although an extensive study of seven in-clinic and two commercial hematology analyzers found that the overall performance of the in-clinic devices was acceptable. 10 However, platelet counts were the least reliable of the variables examined. Another study reported similar limitations regarding platelet counts for three laser-based bench-top hematology devices; these were attributed to a combination of preanalytic and analytic issues. 11
There are several limitations to this study. One consideration is the size and nature of the population studied. As just 20 cats were included, it is possible that the study was underpowered to detect small differences between results for the various sample types. However, statistically significant differences may not be clinically significant, and the correlation for most of the variables examined was high. It is also important to recognize that the cats enrolled were clinically well, and that findings may differ in study population with a high prevalence of hematologic abnormalities. Further studies with more cats and including patients with spontaneous disease are needed to verify the findings of this preliminary investigation. This study also included a preponderance of male cats; it seems unlikely that gender would influence the results, but a more balanced study population may have been preferable. Caution must also be used when extrapolating these findings to other automated hematology analyzers. It is our opinion that results would be similar with other laser-based systems, but clinicians should be cautious when diverging from a manufacturer’s recommendations regarding appropriate sample type and size.
Further studies looking at other non-traditional sample handling options may generate alternative protocols for routine blood sample processing in cats. For example, it would be interesting to know if cell preservation in EDTA following exposure to Hep conveys any advantages over performing a CBC on a Hep-only sample. In addition, the impact of a delay between sample generation and subsequent processing merits investigation, as many practitioners send blood samples to reference laboratories, thereby separating sample collection and analysis by several hours.
Conclusions
This study indicates that exposure to heparin prior to placement in EDTA may not significantly impact routine hematology findings in cats, and that results (with the exception of the platelet count) obtained using 0.5 ml samples are similar to those from 1.3 ml samples. Preheparinization may simplify sample collection and improve patient welfare.
Footnotes
Acknowledgements
The authors wish to thank Ashley Morrone, RVT, and Aimee Duffy, Head Technician, Alamo Feline Health Center, for their diligence in collecting and organizing the blood samples and for performing the analyses.
Conflict of interest
The authors declared no potential conflicts of interest with respect to the research, authorship, and/or publication of this article.
Funding
The authors received no financial support for the research, authorship, and/or publication of this article.
Ethical approval
This work involved the use of non-experimental animals (owned or unowned) and procedures that differed from established internationally recognised high standards (‘best practice’) of veterinary clinical care for the individual patient. The study therefore had ethical approval from an established committee as stated in the manuscript.
Informed consent
Informed consent (either verbal or written) was obtained from the owner or legal custodian of all animal(s) described in this work for the procedure(s) undertaken. No animals or humans are identifiable within this publication, and therefore additional informed consent for publication was not required.