
Abstract
Measuring moment-to-moment interactions between teachers and students with persistent challenging behavior can help explain broader behavioral patterns in the classroom and identify ways to initiate change in teacher–student interaction cycles. In this U.S. descriptive observational study, we conducted a series of classroom observations for each of 20 students referred for individualized behavior support. We collected timed-event count data on teacher opportunities to respond (OTRs), teacher praise, student challenging behavior, and student active responding. Using sequential analysis and multilevel modeling to account for observations nested within student, we tested a series of hypotheses on whether and how certain behaviors impacted the momentary likelihood of others. Among other findings, results showed teacher OTRs decreased the momentary likelihood of student challenging behavior; student challenging behavior decreased the momentary likelihood of teacher OTRs; and student active responding increased the momentary likelihood of subsequent OTRs and praise. Our findings extend the literature on teacher OTRs to students with persistent challenging behavior and contribute evidence to recently developed sequential analysis methods designed to better control for base rates and chance sequencing of behaviors.
Teacher–student interactions in the classroom are the building blocks for a safe and supportive learning environment at school. Yet, even within the same classroom, the quality and quantity of interactions can vary by student. Observational studies have shown students who engage in challenging behavior (e.g., aggression, disruption) tend to receive higher rates of negative feedback relative to students without challenging behavior (e.g., Hirn & Scott, 2014; Scott et al., 2011). Over time, these negative interaction patterns can lead to strained teacher–student relationships, learned helplessness, and negative learning trajectories (O’Connor et al., 2011; Pianta et al., 2008; Sutherland & Singh, 2004).
Student challenging behavior can be maintained by a variety of factors. Yet, when it comes to instructional interactions, persistent challenging behavior has long been explained in terms of a negative reinforcement cycle that drives both student and teacher behavior (Gunter & Coutinho, 1997; Gunter et al., 1994). That is, student challenging behavior is negatively reinforced by the avoidance or termination of instructional demands and teachers’ withholding or withdrawal of instructional demands is then negatively reinforced by the avoidance or termination of challenging behavior. Aspects of this negative reinforcement cycle hypothesis have been supported by studies that have documented (a) escape as a common maintaining consequence of challenging behavior in classrooms (Lloyd, Weaver, & Staubitz, 2016; Nesselrode et al., 2022); (b) low levels of positive consequences when students with challenging behavior do comply with teacher directives (suggesting a lack of positive reinforcement; Gunter & Coutinho, 1997); and (c) teachers delivering fewer or more limited instructional opportunities to students with challenging behavior relative to those without challenging behavior (Carr et al., 1991; Scott et al., 2011).
Although delivering task demands has been shown to evoke challenging behavior for students referred for individualized behavior support (e.g., Carr et al., 1991), research from the classroom management literature suggests certain types of instructional interactions have a positive impact on student behavior. Namely, incorporating frequent opportunities for students to respond (OTRs) during instruction has been found to lead to higher levels of academic engagement and on-task behavior—and in some cases, lower levels of disruptive behaviors—for students identified as having academic or behavioral risk markers (e.g., Haydon et al., 2009; Lambert et al., 2006; Sutherland et al., 2018). Results of systematic reviews have shown most of the research identifying positive impacts of OTRs has focused on students without disabilities who were nominated by teachers based on patterns of classroom behavior (Common et al., 2020; Leahy et al., 2019). It is less clear whether these positive impacts of OTRs extend to students with persistent challenging behaviors (i.e., those referred for individualized behavior support).
Another commonly recommended instructional practice from the classroom management literature is teacher praise. Teacher praise has been shown to produce improvements in class-wide and student-level behaviors including on-task and disruptive behavior (Royer et al., 2019). Like the literature on OTRs, evaluations of teacher praise have largely focused on students without disabilities or those with behavioral risk markers (Moore et al., 2019; Royer et al., 2019). Although questions remain with respect to for whom teacher praise is most effective (Moore et al., 2019), recent evidence suggests students at risk for behavior disorders may have more to gain from teacher praise relative to their peers (Downs et al., 2019).
Sequential Analysis to Investigate Teacher–Student Interaction Patterns
One data analytic method with direct application to measuring teacher–student interactions is known as sequential analysis. Broadly, sequential analysis involves breaking down observations into units that are classified by the presence or absence of two events or behaviors occurring in sequence (e.g., teacher OTR → student challenging behavior). These units are tallied in a 2 × 2 contingency table and the tallies are used to calculate an index of sequential association, which represents whether and how one behavior impacts the momentary likelihood of another behavior throughout the observation. To produce interpretable sequential associations, each event or behavior must be free to occur in both the presence and the absence of the other. Importantly, sequential associations themselves do not allow causal inferences. A positive sequential association between teacher OTRs and student challenging behavior would not mean OTRs caused challenging behavior—nor would it allow conclusions related to the function of challenging behavior. However, the degree of specificity in defining the sequence of interest (e.g., challenging behavior must follow an OTR within 10 s) rules out more alternative explanations for the association of interest relative to summary-level correlations (Yoder et al., 2018).
A series of classroom observational studies in the 1990s and early 2000s used sequential analysis methods (and variations thereof) to explore a range of instructional interactions involving teachers and students with emotional and behavioral disorder (EBD; e.g., Nelson & Roberts, 2000; Shores et al., 1993; Sutherland et al., 2002; Van Acker et al., 1996; Wehby et al., 1995). These studies revealed distinct glimpses into the social ecologies of classrooms from the vantage points of students with challenging behavior. Broadly, results pointed to the prevalence of behavioral requests, reprimands, and other negative consequences and the scarcity of praise and other positive consequences (e.g., Shores et al., 1993; Van Acker et al., 1996; Wehby et al., 1995).
Yet, with respect to specific instructional interactions surrounding challenging behavior, results of these studies are difficult to synthesize based on variation in the types of teacher behaviors measured. Some studies captured “teacher attention” or “teacher commands” broadly (Erickson et al., 2006; Nelson & Roberts, 2000), whereas others differentiated types of teacher commands (positively vs. negatively stated; social vs. instructional; Shores et al., 1993; Wehby et al., 1995). Only Van Acker et al. (1996) and Sutherland et al. (2002) included teacher OTRs in their coding manuals. Sequential analyses by Sutherland et al. (2002) revealed teacher OTRs increased the momentary probability of teacher praise (sequences involving student behavior were not included). Interestingly, Van Acker et al. identified distinctions in sequences involving OTRs, correct responses, and praise between students identified as “mid-risk” versus those identified as “high risk” for aggression (based on teacher and peer ratings). Specifically, for the mid-risk group, they identified positive associations between (a) student volunteering and teacher OTRs and (b) student correct responses and teacher praise. However, these associations were not present for the high-risk group, suggesting teachers were unlikely to respond positively when the “high risk” students did actively participate in instruction.
Another reason this literature is difficult to interpret has to do with the methods of sequential analysis used. With two exceptions (Erickson et al., 2006; Sutherland et al., 2002), researchers used conditional probabilities to quantify the likelihood of one behavior or event given another. For example, the conditional probability of student challenging behavior given a teacher OTR would be calculated as the number of times challenging behavior followed an OTR (e.g., within 10 s) divided by the total number of OTR occurrences. Because single conditional probabilities are calculated from only two of the four tallies from a 2 × 2 contingency table, they are limited in the extent to which they control for base rates of each event as well as the chance occurrence of the two-event sequence (Yoder et al., 2018). Single conditional probabilities also do not inform how likely the occurrence of each behavior is in the absence of the other, meaning they cannot be used to identify negative sequential associations (i.e., one behavior decreasing the momentary likelihood of another).
Apart from the reliance on conditional probabilities, some studies included behavior sequences that were not independent from one another (e.g., teacher instructional commands and student responses; Shores et al., 1993; Van Acker et al., 1996), making them inappropriate targets for sequential analysis. Some researchers also opted to pool observational data across participants rather than preserve the participant as the unit of analysis (e.g., Shores et al., 1993), raising questions around the interpretability of statistical analyses and significance testing. Finally, to our knowledge, none of the studies set minimum occurrence thresholds for behaviors to be included in sequential analyses. Such thresholds can prevent “sparse” 2 × 2 contingency tables, which can lead to undefined or inaccurate sequential association values (Reynolds, 1984; Yoder et al., 2018). Since the publication of these observational teacher–student interaction studies, there have been meaningful advances in sequential analysis methods. These include the development of new methods that better control for behavior base rates and chance sequencing as well as recommendations to identify minimum behavior base counts for sequential analysis (Bakeman & Quera, 2011; Lloyd, Yoder, et al., 2016; Yoder et al., 2018).
Study Rationale and Research Questions
Although research has pointed to the positive impacts of OTRs and praise on engagement for students identified as being “at risk” for behavioral or academic difficulties (including mild forms of challenging behavior), the impact of these instructional interactions is less clear for students with more persistent challenging behavior who are referred for individualized behavior support. Sequential analysis offers a tool for quantifying momentary interactions that may help explain broader behavioral patterns and identify ways to initiate change in teacher–student interaction cycles. Previous applications of sequential analysis have largely focused on students with EBD in self-contained settings and relied on conditional probabilities as the index of sequential association, and few focused specifically on interactions involving teacher OTRs. The purpose of the present study was to apply a rigorous method of sequential analysis to investigate instructional interaction patterns between classroom teachers and students with persistent challenging behavior. For a sample of students referred for individualized behavior support, we addressed the following research questions:
Method
Participants and Settings
The research team recruited participants by contacting leaders of two behavior support teams in a large urban school district. Behavior support team leads were asked to nominate students who were (a) in Grades K–6, (b) referred for functional behavior assessment (FBA) due to severe and/or persistent patterns of challenging behavior, and (c) reported by their classroom teacher to engage in frequent challenging behavior during one or more instructional routine. We defined “frequent” as five or more occurrences during an instructional routine lasting 30 min or less. Students were not required to be receiving special education services to participate.
Twenty students and 19 teachers participated in the study (two students were in the same classroom and had the same teacher). With one exception, all observations were completed in elementary general education classrooms. One set of observations was conducted in a classroom in a public day school for students with behavioral disorders. Although this classroom had a lower student-to-staff ratio than the others, the instructional contexts were similar (i.e., mostly class-wide instruction).
Participants included students in kindergarten (n = 4), first grade (n = 7), second grade (n = 5), third grade (n = 1), fourth grade (n = 2), and sixth grade (n = 1). Seventeen students were boys; three were girls. Student race/ethnicity was reported as Black (n = 9), White (n = 8), and Hispanic (n = 1; data on race/ethnicity were missing for two students). Thirteen students were receiving special education services under the following eligibility categories: emotional disturbance (n = 5), developmental delay (n = 4), other health impairment (n = 2), autism spectrum disorder (n = 1), and speech impairment (n = 1). Seven students had no identified disability. Topographies of challenging behavior (as reported by teachers and in FBA records) varied by student and included physical aggression (n = 15), property destruction (n = 15), noncompliance (n = 15), verbal aggression or disruption (n = 13), elopement (n = 6), tantrums (n = 5), and self-injury (n = 1). Teacher ratings on a 16-item questionnaire designed to identify potential sources of reinforcement for challenging behavior (Functional Analysis Screening Tool [FAST]; Iwata et al., 2013) suggested all students’ challenging behavior was socially mediated. Based on which category of reinforcement had the most questions answered “yes” (Iwata et al., 2013), results suggested both positive and negative social reinforcement (n = 10), social positive reinforcement (i.e., access to attention/preferred items; n = 9), and social negative reinforcement (i.e., escape from tasks/activities; n = 1). Across participants, the mean number of questions answered “yes” (out of 4) was 3.7 for social positive reinforcement and 3.1 for social negative reinforcement. Functional Analysis Screening Tool scores are listed by student and reinforcement category in the Online Supplemental Material (see Table A1).
Demographic data were collected for 18 of 19 teachers (one teacher’s form was not returned). Of the 18 teachers with demographic data, most were women (n = 16). Thirteen teachers identified as White; five teachers identified as Black. Thirteen teachers had Bachelor’s degrees and five had master’s degrees. With respect to teaching certifications, 15 teachers were certified in elementary education; four were certified to teach English learners; two were certified in early childhood (PreK–3); and two were certified in special education (four teachers had more than one certification). The average number of years teaching was 12.4 (range = 1–33). Demographic data are reported at the level of teacher and student in the Online Supplemental Material (see Table A2).
We completed all observations in 19 K–6 classrooms across 11 schools in a large urban school district in the southeastern United States. Schools varied with respect to student demographics; the percentage of students who were Black, Hispanic, or American Indian ranged from 8% to 92%; the percentage of students who were economically disadvantaged ranged from <5% to 72%; and the percentage of students with disabilities ranged from 9% to >95% (one student attended a public day school for students with behavior disorders). Observations were conducted in classrooms that had an average of 18.1 students (range = 5–33) and 1.6 teachers/classroom staff (range = 1–4). All observations took place in the students’ usual classroom setting during naturally occurring instructional activities. We selected times and instructional routines according to when teachers reported challenging behavior frequently occurred. Across participants and observations, the two most common instructional contexts were large group instruction and independent work. Academic content areas varied by participant, and included reading, language arts, or literacy (n = 11), math (n = 6), and combinations of two content areas (n = 3; e.g., math and social studies). These times and instructional routines were held constant across all classroom observations for each student. We told teachers to follow their instructional routines as they typically would during all observations.
Study Procedures
Teacher Interview and Questionnaire
We completed brief interviews with each participating classroom teacher prior to conducting observations. We asked teachers to describe topographies of their student’s challenging behavior to ensure they were captured by our operational definitions. We also asked questions about the contexts in which challenging behavior most commonly occurred. Based on this information, we determined when (i.e., during which instructional routine) observations would be scheduled. We also discussed where observers should stand or sit in the classroom to minimize distraction, and we reminded teachers to do their best to refrain from interacting with observers when they were present. At the end of the interview, we asked teachers to complete the FAST (Iwata et al., 2013). We incorporated this brief indirect measure of behavior function to inform the likelihood that student challenging behavior was socially mediated (as opposed to automatically maintained).
Classroom Observations
For each participating student, one to two graduate research assistants completed live classroom observations on 5 days within a 2- to 5-week period. We intended for each set of observations to be completed within 2 to 3 weeks, and this was the case for 15 students. Due to absences and holiday breaks, however, five students’ observations spanned 4 or 5 weeks. Each classroom observation included three consecutive 10-min sessions (30 min total). We broke each 30-min observation into three parts to reduce coder fatigue and provide opportunities for brief between-session discrepancy discussions on days two independent coders collected data. For each student, all observations took place at the same time of day and during the same instructional routine.
At the end of each classroom observation, research assistants completed an observation context form in which they documented the number of students and staff in the classroom, noted what, if any, topographies of challenging behavior occurred, and briefly described instructional activities in place during observations. There was also space to write in comments on any unusual or unexpected events that happened during the observation (e.g., fire alarm).
After completing the five classroom observations for each participant, we compiled and shared student-level data summaries with each classroom teacher. Summaries included definitions of teacher and student behaviors, study procedures, interview and FAST results, teacher–student interaction data, and behavior support recommendations matched to the data summary. A member of the research team reviewed the contents of the summary with each teacher and discussed potential implications of their interaction patterns on instruction.
Observational Measures and Data Collection
We developed a coding manual to collect systematic direct observation data on a variety of student and teacher behaviors in the classroom. Definitions were adapted from existing coding manuals in the teacher–student interaction and classroom management literature (Wehby, 2006; Wehby, 2013) as well as common antecedents and consequences of challenging behavior from the functional assessment literature (e.g., Vollmer et al., 2001). Student behaviors included in the sequential analyses were challenging behavior and active responding. We originally coded two categories of challenging behavior (i.e., high-risk and low-risk) but ultimately combined them to meet base count criteria for data analysis. Teacher behaviors included in the sequential analyses were OTRs and praise. Opportunities to respond were coded if directed to the target student individually or a group of students including the target student; praise was coded only if directed to the target student individually. We also collected data on reprimands but did not include them in sequential analyses based on low base counts. Operational definitions with examples and non-examples for challenging behavior, active responding, OTR, and praise are provided in Table 1.
Operational Definitions, Examples, and Non-Examples of Student and Teacher Behaviors.
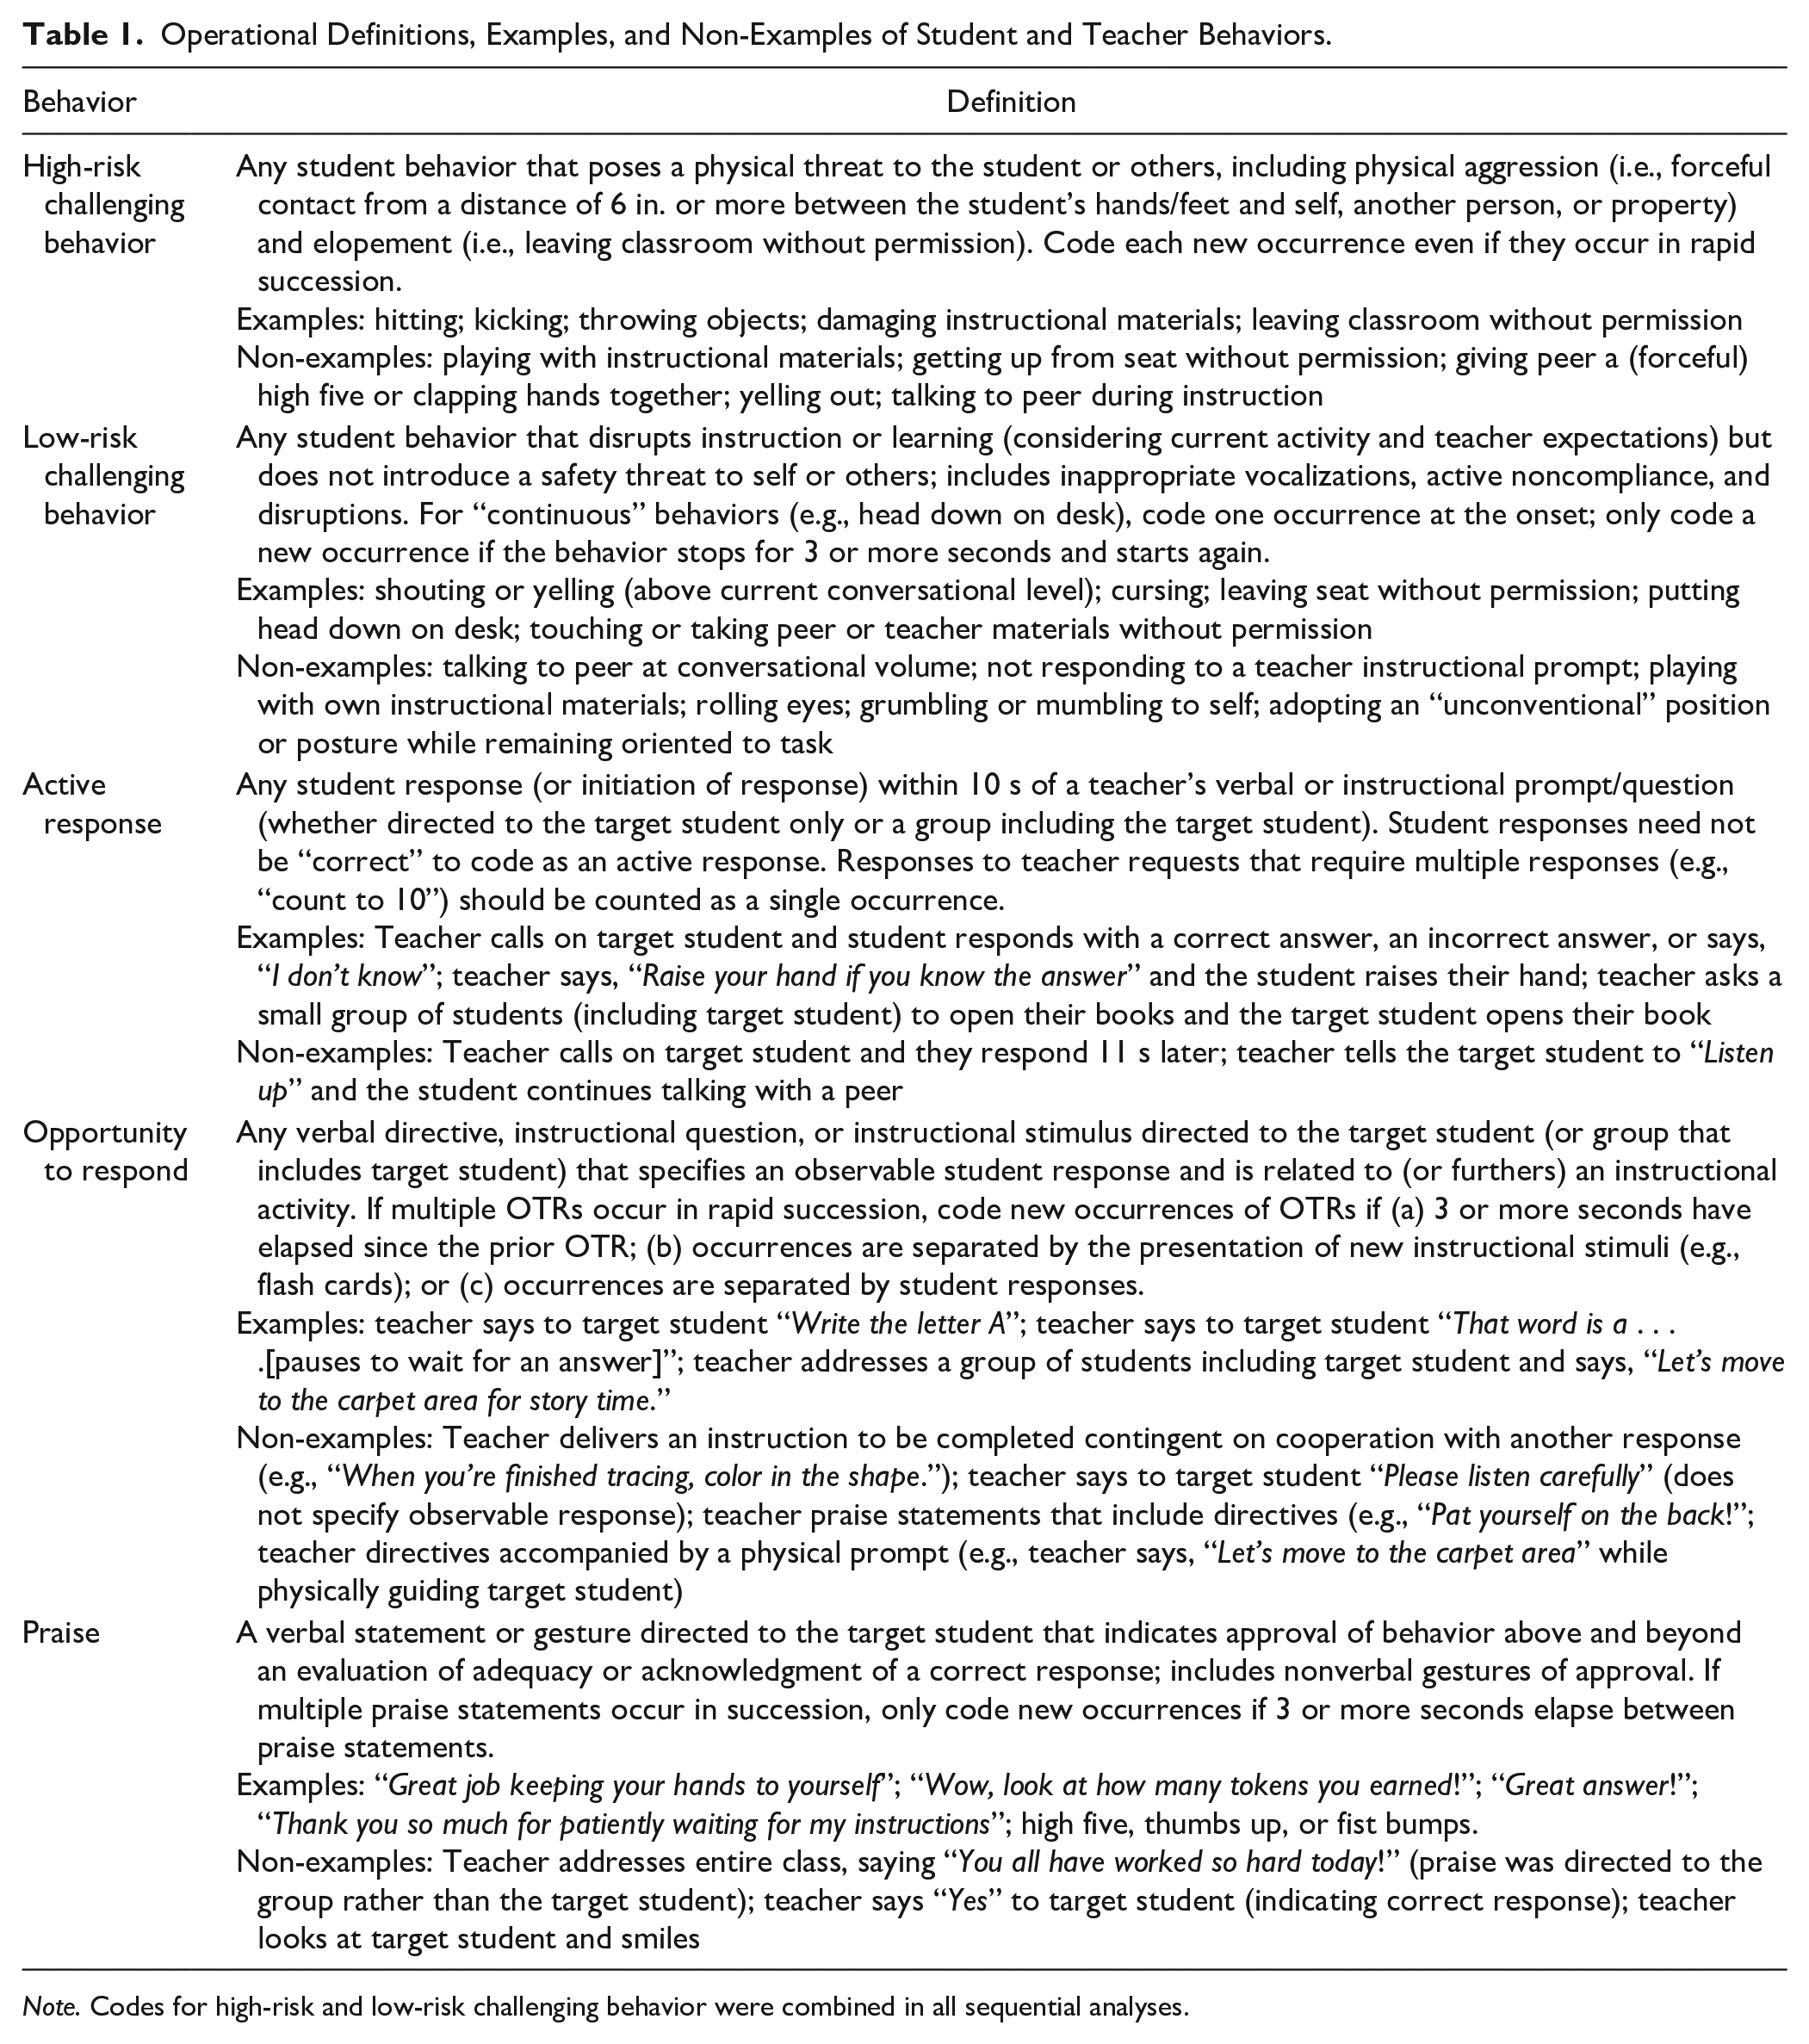
Note. Codes for high-risk and low-risk challenging behavior were combined in all sequential analyses.
Graduate research assistants collected timed-event count data on student and teacher behaviors using tablets equipped with the Multi-Option Observation System for Experimental Studies (MOOSES; Tapp et al., 1995). All data were collected live. Each daily observation consisted of three back-to-back 10-min observation segments, which were combined and treated as one 30-min observation. Five 30-min observations were conducted for each student.
Observer Training
Seven trained graduate research assistants in Special Education collected study data. Each coder completed the same sequence of training activities. First, they were instructed to read the coding manual prior to an in-person meeting in which the lead faculty member or doctoral student reviewed the operational definitions of all target behaviors, highlighted prototypical examples and “close in” non-examples, and solicited and answered questions. Then, each coder was required to meet three training criteria: (a) score 90% or higher on a written quiz on coding manual content; (b) code two practice videos and reach agreement of 85% or higher with a consensus code; and (c) practice coding live in the research setting and code two consecutive 10-min sessions with at least 85% agreement with another data collector. The third criterion had to be met in each new classroom setting (i.e., for each participating teacher-student dyad).
Inter-Observer Agreement
Two graduate research assistants simultaneously and independently collected data during at least three of the five 30-min observations per student. Inter-observer agreement (IOA) was collected for a total of 87 (87%) of the 100 thirty-minute observations. Inter-observer agreement was calculated per student and teacher behavior using point-by-point occurrence agreement (Yoder et al., 2018) with a 5-s agreement window. We calculated percentage occurrence agreement as the number of exact agreements divided by the sum of exact agreements plus disagreements, multiplied by 100. We did not calculate agreement percentages if both coders agreed the behavior did not occur. Mean percentages of agreement were 85.6% (observation range = 0%–100%) for challenging behavior, 84.7% (observation range = 0%–100%) for active responding, 88.9% (observation range = 37.5%–100%) for OTRs, and 78.0% (observation range = 0%–100%) for praise. Excluding observations in which the behavior occurred fewer than three times (see Data Analysis section), mean percentages of agreement were 83.8% (observation range = 0%–100%) for challenging behavior, 84.7% (observation range = 33.3%–100%) for active responding, 88.8% (observation range = 37.5%–100%) for OTRs, and 83.1% (observation range = 0%–100%) for praise. To provide context for the very low minimum agreement percentages at the session level, we calculated the percentage of sessions for which agreement fell below 50% for each behavior. These percentages were 4.4 (challenging behavior), 1.3 (active responding), 3.5 (OTR), and 7.7 (praise).
Data Analysis
For each sequence of interest (e.g., OTR → challenging behavior), we first selected all 30-min observations in which there were at least three occurrences of each key event. We used this minimum base count requirement to prevent “undefined” sequential association values and increase the likelihood of obtaining accurate and interpretable indices of sequential association 1 (Reynolds, 1984; Yoder et al., 2018). This meant the total number of participants and observations included in each analysis varied by the sequence investigated (see Table 2).
Results of Sequential Analyses and Multilevel Unconditional Models per Sequence and Pause Duration.
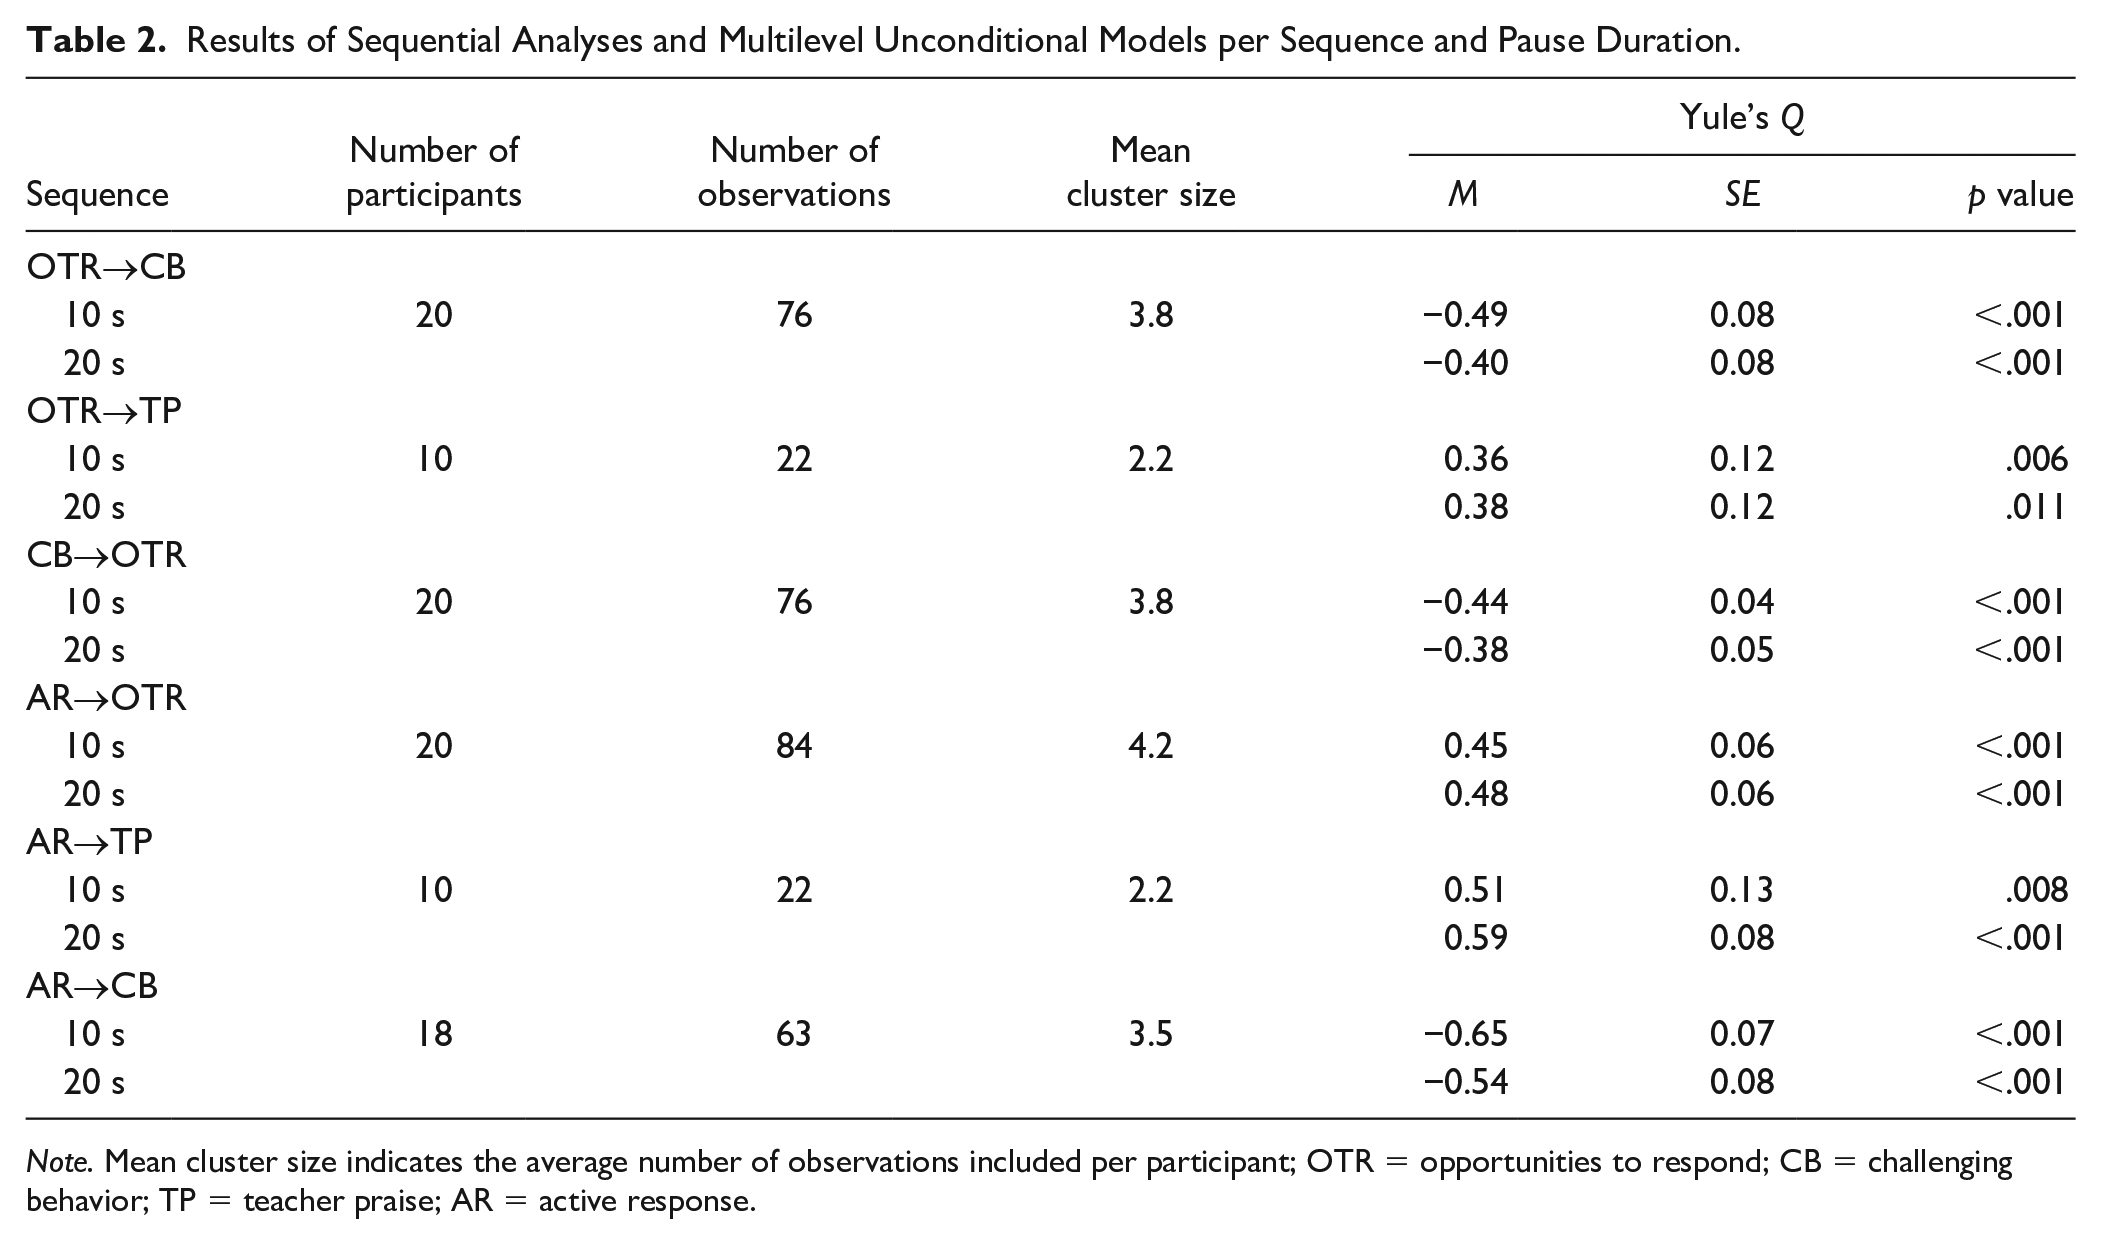
Note. Mean cluster size indicates the average number of observations included per participant; OTR = opportunities to respond; CB = challenging behavior; TP = teacher praise; AR = active response.
We used MOOSES (Tapp et al., 1995) to conduct all sequential analyses using the “event lag with pauses” method, which has been shown to produce accurate and interpretable indices of sequential association in simulation studies (Lloyd, Yoder, et al., 2016; Yoder et al., 2018). This method involves stripping out all non-key events from the observation file; inserting “pause” events of an investigator-selected duration; and tallying overlapping event pairs among the four cells of the 2 × 2 contingency table according to whether the pair represents both events in sequence (Cell A), only the first event in sequence (Cell B), only the second event in sequence (Cell C), or neither event in sequence (Cell D). The duration of the pause event (e.g., 10 s) represents the amount of time within which the two key events must occur (in sequence) to be considered the sequence of interest. Additional details on the event lag with pauses method are reported in Lloyd, Yoder, et al. (2016).
Little guidance exists on selecting the window of time that defines a two-event sequence. When testing for positive sequential associations, short windows are considered stringent tests of the extent to which one event increases the momentary likelihood of another; yet, it is also important to select this window based on content expertise related to the behaviors and contexts for measurement (Yoder et al., 2018). We initially set the pause duration at 10 s based on prior classroom observational studies in which conditional probabilities were calculated based on a 10-s window (e.g., Shores et al., 1993; Wehby et al., 1995). Because we hypothesized negative sequential associations involving student challenging behavior, we conducted a second round of sequential analyses with a longer pause (20 s). We did this to assess whether any negative sequential associations identified based on a 10-s window still held when we extended the window to 20 s.
The sequential analysis output from MOOSES provided a set of 2 × 2 contingency table tallies for each observation and sequence of interest. We used these A, B, C, and D cell tallies to calculate Yule’s Q (YQ; Yule & Kendall, 1957) as the index of sequential association. Yule’s Q is a linear transformation of the odds ratio that ranges from −1 to 1. Based on recommended benchmarks for the odds ratio (Rosenthal, 1996), YQ benchmarks include .20 (weak association), .43 (moderate association), and .60 (strong association; Yoder et al., 2018). Relative to single conditional probabilities, YQ incorporates all four tallies of the 2 × 2 contingency table, thus accounting for both the occurrence and non-occurrence of each key event. In addition, relative to other metrics of sequential association, YQ has been shown to (a) better control for key event base rates and the chance occurrence of a two-event sequence and (b) follow a normal distribution, making it appropriate for parametric significance tests (Bakeman et al., 1996; Lloyd et al., 2013; Yoder et al., 2018).
To inform the interpretability of YQ scores produced from the event lag with pauses method, we calculated correlations between YQ and the chance estimate of each two-event sequence (calculated by multiplying the simple probabilities of each behavior; Lloyd, Yoder, et al., 2016; Yoder et al., 2018). The field lacks consensus on a threshold positive correlation beyond which sequential associations should be considered “uninterpretable.” Stringent thresholds (e.g., .10) have been referenced in prior simulation studies (e.g., Lloyd et al., 2013; Lloyd, Yoder, et al., 2016); yet, estimates of correlations with chance have not been reported in studies applying sequential analysis to “real world” observational datasets. Across sequence types in the current dataset, mean correlations were .15 (range = .13–.19) for the sequential analyses based on 10-s pauses and .09 (range = −0.02 to .29) for the analyses based on 20-s pauses. With one exception, none of the correlations were statistically significant and the chance estimate of the sequence accounted for between .01% and 3.6% of the variance in YQ scores. One outlying correlation between the chance estimate and YQ scores was for the active response → OTR sequence using a 20-s pause (r = .29, p < .01). For this sequence and pause duration, the chance estimate accounted for 8.2% of the variance in YQ scores.
We used Mplus (Version 8.10) to conduct a series of multilevel unconditional (i.e., intercept only) models to determine whether mean YQ scores for each sequence of interest were significantly different from zero. These models accounted for the clustering of observations within participants. After selecting observations according to the minimum base count criterion, the average number of observations per participant ranged from 2.2 (i.e., both sequences involving teacher praise) to 4.2 (student active response → teacher OTR); means for each tested sequence are reported in Table 2. Although our hypotheses were directional, all significance tests were two-tailed to account for the possibility of an effect in the opposite direction (thus guarding against Type I error). Given the number of sequences we tested (i.e., 6), we applied a Benjamini–Hochberg correction (Benjamini & Hochberg, 1995) to all p values to control the false discovery rate, which we set at .05.
Results
Total counts of teacher and student behaviors varied by participant and observation. Based on all observations collected (20 participants × five 30-min observations), mean counts were 28.5 (range = 9.2–72.0) for teacher OTRs, 13.1 (range = 3.2–39.4) for student active responses, 10.9 (range = 1.2–36.0) for student challenging behavior, and 2.4 (range = 0–21.4) for teacher praise. The mean percentage of OTRs followed by active responses was 47.9% (range = 0%–100%). This sequence of behaviors (OTR → active response) was not included in the sequential analysis because active responses could not be coded in the absence of a prior teacher OTR (based on its operational definition).
Results of the sequential analyses and multilevel models are presented in Table 2. All mean YQ values were significantly different from zero in the direction hypothesized (across both the 10- and 20-s pause durations). Specifically, (a) teacher OTRs decreased the momentary likelihood of student challenging behavior (moderate association), whereas (b) OTRs increased the momentary likelihood of teacher praise (weak association). (c) Student challenging behavior decreased the momentary likelihood of a subsequent OTR (weak to moderate association). Student active responding (d) increased the momentary likelihood of subsequent OTRs (moderate association); (e) increased the momentary likelihood of teacher praise (moderate association); and (f) decreased the momentary likelihood of challenging behavior (moderate to strong association). The direction and statistical significance of each sequential association held across both the 10- and 20-s pause durations. However, the strength of YQ varied by pause duration. For the negative associations, the strength of association was slightly stronger with the 10-s pause. For the positive associations, the strength of association was slightly stronger with the 20-s pause. This small difference in strength is not surprising, as the likelihood of detecting the second event following the first event increases as the pause duration (i.e., window of time defining the sequence) increases.
Discussion
The goal of the current study was to investigate instructional interaction patterns between classroom teachers and students with persistent challenging behavior. Using sequential analysis methods, we tested a series of sequential associations involving teacher OTRs, student challenging behavior, student active responding, and teacher praise. Directional hypotheses were confirmed based on mean YQ scores, which showed evidence of negative sequential associations between teacher OTRs and student challenging behavior, and positive sequential associations among student active responding, teacher OTRs, and teacher praise. This study extends previous research on OTRs as a classroom management strategy, suggesting the positive effects of OTRs on student behavior may extend to those with individualized behavior support needs. It also extends prior research focused on quantifying teacher–student interactions for students with severe challenging behavior by applying more rigorous sequential analysis methods and evaluating multiple windows for defining the sequences of interest.
A primary finding of this study was that on average, teacher OTRs decreased the momentary likelihood of challenging behavior (based on both 10- and 20-s windows) for students with individualized behavior support needs. Interestingly, the students in our sample actively responded to less than 50% of teacher OTRs, on average. This suggests that OTRs alone—regardless of whether students actively respond to them—may still inhibit the momentary occurrence of challenging behavior. Although OTRs might be considered a type of instructional demand, they are also a form of teacher attention. It is possible that the provision of attention via OTR was enough to momentarily inhibit challenging behavior that was attention-maintained. It is also possible that OTRs helped keep the target student engaged and oriented to their teacher’s instruction or peer responses, and this engagement effectively “competed” with challenging behavior (Sutherland & Wehby, 2001). Consistent with this hypothesis, active responding further decreased the momentary likelihood of challenging behavior relative to OTRs alone (likely because these two student behaviors are incompatible).
Incompatibility of active responding and challenging behavior aside, student active responding was also found to increase the momentary likelihood of both teacher praise statements and subsequent OTRs. These patterns are consistent with those identified by Sutherland et al. (2002; OTRs and teacher praise) and Van Acker et al. (1996) with respect to the “mid-risk” students, but not the “high-risk” students, for whom such positive associations were absent. The present study did not include a direct comparison group to inform whether or how these positive associations vary depending on behavior risk or severity status. However, our results suggest that when students with persistent challenging behavior did actively participate in instruction, their teachers were more likely to engage in positive interactions and provide subsequent opportunities to participate relative to chance likelihoods of these teacher behaviors.
Although much of the prior literature on instructional interactions for students with persistent challenging behavior has focused on negative reinforcement cycles, the positive sequential associations we identified among student active responding, subsequent teacher OTRs, and teacher praise suggest the presence of positive reinforcement mechanisms too. Both OTRs and praise are forms of teacher attention. Opportunities to respond were delivered far more often than praise in the current data set, yet the provision of OTRs did increase the momentary likelihood of praise statements. This suggests OTRs were not just opportunities for students to respond, but also opportunities to access teacher praise. Although the goal of this study was not to test functional hypotheses surrounding challenging and appropriate behavior, taken together, our results point to the potential roles of both negative and positive reinforcement in instructional interactions between teachers and students with persistent challenging behavior.
Results of the present study also contribute to the literature on sequential analysis methods. This study represents one of the first applications of the “event lag with pauses” method—a method of sequential analysis that has outperformed other methods in simulation studies—to observational data from active classroom settings. When applied with minimum base count rules, the event lag with pauses method produced mean YQ scores that varied by sequence and reached thresholds of statistical significance in directions that were consistent with a priori hypotheses. While more applications of these methods are needed, these results offer initial evidence of convergent construct validity of YQ scores derived from the event lag with pauses method (Yoder et al., 2018). Moreover, we evaluated the interpretability of YQ scores produced from this sequential analysis method by calculating correlations between YQ and chance estimates of each two-event sequence. With the exception of one sequence (i.e., active responding → OTR), correlations were nonsignificant and chance estimates accounted for trivial amounts of variance in YQ. Finally, we tested the “durability” of significant YQ values across multiple pause durations. Our results confirmed significant negative and positive sequential associations held regardless of whether 10 or 20 s was selected as the pause duration.
Limitations and Future Directions
Study results should be considered with the following limitations in mind. First, percentages of IOA varied by behavior type and observation and were low for a subset of behaviors for which there were relatively few occurrences (e.g., teacher praise) or a lack of observational cues to signal when to look for them (e.g., challenging behavior). It is worth noting our estimates of IOA are similar to those from other studies involving live, timed-event data collection on a similar set of student and teacher behaviors in active classroom settings (e.g., Shores et al., 1993), and that we used conservative methods to calculate agreement (i.e., exact occurrence agreement based on a 5-s window). We acknowledge, however, that in a subset of observations, 2 × 2 contingency table values—and thus YQ scores—would differ depending on coder. Second, the correlation between the chance estimates and YQ scores for the active response → OTR sequence using a 20-s pause (r = .29) raises questions about the interpretability of YQ scores for this sequence. The positive and significant sequential association identified between student active responding and subsequent teacher OTRs should be interpreted with caution, as more variance in YQ scores was accounted for by the chance likelihood of the two-event sequence (relative to other sequences investigated). More applied sequential analysis studies that report similar correlations are needed to inform empirical guidelines on interpretability. Third, our sample of participants was small (n = 20), and though they all had been referred for individualized behavior support, they varied with respect to grade level and special education eligibility. Future studies with larger samples are needed to evaluate the replicability of these findings as well as explore potential differences in teacher–student interaction patterns by grade level and/or eligibility status. Finally, it bears repeating that sequential analysis does not allow conclusions of causality between each pair of behaviors.
With respect to future research, larger-N studies that include reliable and valid measures of student behavior function could help inform whether teacher–student interaction patterns vary depending on whether challenging behavior is maintained by negative reinforcement only (e.g., escaping task demands, avoiding teacher interaction), positive reinforcement only (e.g., accessing teacher or peer attention), or both. Teacher report data from the current sample suggested a combination of positive and negative reinforcement as the most common profile. Future studies might recruit balanced samples of students whose challenging behavior is confirmed (via rigorous functional assessment methods) to be maintained by positive vs. negative reinforcement. Researchers could then evaluate, for example, whether the negative sequential association identified between OTRs and challenging behavior is attenuated for students with negatively reinforced challenging behavior.
Future studies might also expand the number and types of student and teacher behaviors included in sequential analyses. As an example, our intention was to include teacher reprimands in these analyses, yet they were not coded frequently enough to meet our base count criteria. As another example, teacher OTRs could be further distinguished with respect to whether they are directed to the target student individually versus delivered to a group of students including the target student (our coding manual definitions combined these together). This level of differentiation could reveal distinctions in how individual versus group interactions impact the momentary probability of target student appropriate and inappropriate behavior. Such information could then be used to inform strategies to tailor classroom management practices to address the needs of both the classroom at large and individual students with histories of persistent challenging behavior.
Finally, given the resources needed for classroom observational data collection that allows rigorous methods of sequential analysis, it would be advantageous to embed sequential analysis research questions within large-N intervention trials (e.g., randomized controlled trials evaluating the efficacy of classroom management interventions; Kamps et al., 2015). Such studies would allow researchers to take advantage of large classroom observational data sets while also expanding the knowledge gained from these efficacy trials. For example, pre-intervention observations could be used to address questions similar to those posed in the current study, including potential comparisons among subgroups. In addition, sequential associations could be compared between post-intervention treatment and control groups to evaluate the extent to which moment-to-moment interaction patterns (beyond summary-level counts or durations) changed as a function of intervention.
Conclusion
Measuring moment-to-moment interactions between teachers and students with persistent challenging behavior can inform important aspects of the learning environment as well as bidirectional influences on student and teacher behavior. Results of the present study point to the potential importance of providing students with persistent challenging behavior explicit opportunities to participate and respond during academic instruction. In particular, the delivery of OTRs may help interrupt negative interactions surrounding challenging behavior and set into motion positive student–teacher interactions, including student active responses, teacher praise, and subsequent opportunities to engage.
Supplemental Material
sj-docx-1-pbi-10.1177_10983007251335350 – Supplemental material for Momentary Impacts of Opportunities to Respond and Praise for Students With Persistent Challenging Behavior
Supplemental material, sj-docx-1-pbi-10.1177_10983007251335350 for Momentary Impacts of Opportunities to Respond and Praise for Students With Persistent Challenging Behavior by Blair P. Lloyd, Gabrielle E. Crowell, Johanna L. Staubitz, Emily S. Weaver and Kristen L. Granger in Journal of Positive Behavior Interventions
Footnotes
Authors’ Note
We thank Mary Etta Castles, Emily Doak, Justine Katzenbach, Gretchen O’Henley, and Naomi Parikh for their support with data collection. Emily Weaver is now at the Institute of Education Sciences (IES). She contributed to this article in her private capacity before joining IES; no official support or endorsement by the U.S. Department of Education is intended or should be inferred.
Declaration of Conflicting Interests
The first author of this manuscript co-authored a textbook on observational methods for which she receives royalties. The textbook includes descriptions of the sequential analysis methods used in the current study.
Funding
The author(s) received no financial support for the research, authorship, and/or publication of this article.
Notes
References
Supplementary Material
Please find the following supplemental material available below.
For Open Access articles published under a Creative Commons License, all supplemental material carries the same license as the article it is associated with.
For non-Open Access articles published, all supplemental material carries a non-exclusive license, and permission requests for re-use of supplemental material or any part of supplemental material shall be sent directly to the copyright owner as specified in the copyright notice associated with the article.