
Abstract
The purpose of this article is to describe the methods and results used to establish the district capacity assessment’s (DCA) content validity, response process validity, construct validity, internal consistency, and test–retest reliability. The DCA measures a district’s ability to support school-level implementation of evidence-based practices (EBPs). Assessment results are then used to guide action planning. The DCA is grounded in the understanding that districts must develop knowledge and skills in the use of implementation science methods if they are to support successful use of an innovation. Specifically, three studies were conducted. The first study established the DCA’s content validity, that is, the extent to which the DCA represents constructs comprising district-level implementation capacity. The second study established the DCA’s internal structure, or the relationships among the items compared to the constructs being measured and how well the items measured the same construct. The third and final study assessed how the results of the DCA varied over time, thus establishing the instrument’s test–retest reliability. District Implementation Teams, researchers, or facilitators who use the DCA can be confident that the assessment is founded on research drawing from implementation science practices and methods.
A two-part challenge facing educators today is the identification of practices (programs) that have demonstrated benefit to students, and implementation of those practices with a level of precision that allows students to experience any research-validated benefits (Fixsen et al., 2013). As gains in identifying effective practices have mounted, increasing consternation is building over our collective struggle to implement these practices with adequate fidelity (Fixsen et al., 2015). Despite the push to enhance the quality of education and outcomes for all students in U.S. schools, nationally students are still not considered proficient in core academic areas such as reading and mathematics (National Center for Education Statistics, 2019). Pressure to implement solutions to address lackluster student outcomes in education is not new. In fact, the case may be made that we have never known more about the components of effective educational practices than we do now (Archer & Hughes, 2011; McIntosh & Goodman, 2016), yet we fail to see the benefits of these practices in outcomes for students. The new challenge is to articulate the implementation supports for initiating, growing, and sustaining these evidence-based practices (EBPs; Kelly & Perkins, 2012). In this mission to effect meaningful change, we must simultaneously focus on not only what EBPs are selected but also how they are implemented.
Implementation Drivers
Within the field of implementation science, almost all published implementation frameworks and compilations of implementation strategies include capacity building and infrastructure development as critical components of successful implementation (Powell et al., 2015). A common implementation framework used in K–12 education is the Implementation Drivers (Fixsen et al., 2015; Forman et al., 2017). The Implementation Drivers are mechanisms needed to support practice, organizational, and systems change for improved outcomes. The categories of competency and organizational drivers are supported by effective leadership.
Specifically, competency drivers are factors necessary to develop and improve staff efficacy in using EBPs as intended. Competency drivers include selection of individuals with required skills and abilities to use practices; training to ensure individuals’ knowledge and skills to use practices with fidelity; coaching using multiple sources of data to provide ongoing support for use of EBPs; and use of fidelity data to support ongoing improvement and understanding of outcomes. Organizational drivers create a supportive environment and data systems for decision-making. Administrators facilitate new practice by (a) providing necessary leadership to address challenges and create solutions, (b) developing clear communication feedback loops, (c) adjusting and developing policies and procedures to support practice, (d) reducing barriers impeding implementation efforts, and (e) connecting with external organizations to ensure availability of financial, organizational, and human resources required to support new practice.
A relationship between an organization’s implementation infrastructure as defined by the Implementation Drivers and improved fidelity in use of EBPs and outcomes for a target population has been demonstrated within other disciplines such as child welfare (Metz et al., 2014) and mental health (Ogden et al., 2012). In K–12 education, researchers have examined the role of various factors outlined by the Implementation Drivers at the district level. For example, McIntosh et al. (2013) in their analysis of factors related to the implementation of school-wide positive behavior supports found that capacity-building efforts at the district level were significantly related to sustained implementation at the school level. Capacity-building efforts were defined as ongoing access to professional resources including provision of coaching by external providers and ongoing professional development. George et al. (2018) report a qualitative examination of district implementation practices for school-wide positive behavior supports that revealed key themes including provision of training, coaching, use of effective communication, use of teaming structures with leadership support, and a district coordinator.
A Measure to Assess Implementation Capacity
Over time, we have learned that many of the factors outlined in the Implementation Drivers often define the “capacity” of a school district to successfully adopt and sustain use of EBPs (Horner et al., 2017). As such, it is important to assist any district to establish an implementation infrastructure to assist schools in their adoption of effective practices. To support districts to do so and to be able to comprehensively examine the relationship between a system’s capacity, implementation fidelity, and improved outcomes, a valid and reliable measure is needed. An implementation capacity assessment can inform district planning by identifying and assessing the processes and methods needed to support effective use of EBPs. A district capacity assessment (DCA) is also needed to establish a relationship between district capacity and implementation fidelity and ultimately student outcomes.
Historically, attempts to measure the methods and techniques of implementation have taken several approaches, such as (a) very general measures that do not specifically address core implementation components (Mihalic & Irwin, 2003); (b) measures specific to a given innovation that may lack generalizability across programs (Elliott & Morrison, 2008); or (c) measures that only indirectly assess the influences of some of the core implementation components (Aarons et al., 2012). From these efforts, it was clear that rather than emphasizing the development of narrow measures of implementation tied to each practice (i.e., literacy, math, behavior, mental health), the field needed a tool that could both guide and measure basic capacity elements. Rather than building capacity for literacy and then shifting to building capacity for math or behavior support, the logic is to identify integrated features of organizational capacity that facilitate adoption of any EBP.
Early conceptualization of district-level capacity measures also focused on districts being able to engage in an iterative improvement process such as a Plan, Do, Study, Act cycle (Bryk et al., 2015); however, developing implementation capacity is time-consuming and requires a concerted effort. Any measure of district capacity that is used for improvement must be sufficiently efficient for use multiple times a year and flexible enough to guide districts early in the process as well as later in development. A 2-day capacity assessment will likely be used once, but not repeated. A capacity assessment that can be administered within 2 hr, and produces action steps for the next 6 months, becomes a viable systems change tool. Additional characteristics of a useful assessment include a focus on system functioning, an evaluation of how implementation activities are used, and a means to determine whether necessary resources are allocated for successful use of EBPs. The DCA (Ward et al., 2015; https://nirn.fpg.unc.edu/resources/district-capacity-assessment-dca) has been developed to meet this need. The DCA measures a district’s ability to support school-level implementation of EBPs and then use those data to guide action planning. The DCA is grounded in the understanding that districts must have the ability to develop an implementation infrastructure if they are to support successful use of EBPs.
The DCA is a 27-item, team-based self-assessment developed for use by a District Implementation Team, inclusive of district leadership and others knowledgeable of the district’s implementation practices and the EBP. A scoring guide is provided to operationalize response options along a 0- to 2-point scale. A trained DCA administrator facilitates the team’s discussion during administration and guides the team in their use of results for action planning to improve implementation. In addition, the DCA can be used as part of a feedback cycle to improve and focus work between districts and their state or regional agencies.
During administration, the district team members (in collaboration with an external facilitator) work through the DCA items, but always with respect to a specific practice or program. Consequently, a district team uses the DCA to determine the capacity of the district to implement any practices or programs that are occurring (or are planned) within the system. To make the process most effective, the team selects an EBP (e.g., early literacy) and uses the DCA to determine the capacity of the district to adopt the core features of this practice. The resulting action plan defines the highest priority actions needed to improve adoption of the practice (e.g., early literacy). The team may later use the DCA to consider another EBP (e.g., a behavior support innovation). In this later use, the same core capacity features will be considered (e.g., training, coaching) but with a different practice (e.g., behavior support) as the target. In this way, common elements (i.e., team, review, selection, alignment processes, barrier removal processes) of the DCA can be applied across content areas and the district builds integrated capacity rather than isolated (and too often conflicting) systems.
The DCA is designed to measure the district supports needed to implement, scale-up, and sustain EBPs. These activities are organized into three major constructs: Leadership, Competency, and Data System for Decision Making supports. Items included in the DCA were developed through an investigation of capacity assessments available and drawn from research on the Implementation Drivers. Authors worked to integrate both implementation science research and practical experience within educational environments. Items are mapped to the Implementation Drivers and carefully aligned to specific tasks or resources considered critical to support EBP implementation and sustainability.
Purpose of the Technical Adequacy Studies
Establishing the psychometric properties of an assessment significantly influences the accuracy of assessments and the ability to assign meaning to its results (Popham, 2008). Assessments are routinely used within a cycle of district and school improvement. Results have the power to sway resource allocation and determine priorities for action planning. In light of this, it is essential that assessments are developed in a technically sound manner with appropriate attention paid to psychometric properties, such as reliability and validity. Before a team adopts a measure, they should ensure that the assessment measures what it is intended to measure and that the meaning and interpretation of scores are consistent with each intended use. Thus, the purpose of this article is to describe the methods and results used to establish the DCA’s content validity, response process validity, construct validity, internal consistency, and test–retest reliability. The technical adequacy methodologies used in the current studies are grounded in best practices of establishing validity as outlined by the Standards for Educational and Psychological Testing (American Educational Research Association et al., 2014).
Specifically, three studies were conducted, which resulted in refinements to DCA content that were released as Versions 6.0 and 7.0 of the DCA. The first study established the DCA’s content validity, that is, the extent to which the DCA represents all facets of the constructs comprising district-level implementation capacity. The analyses from the first study resulted in Version 6.0 of the DCA. The second study established the DCA’s internal structure, or the relationships among the items compared to the constructs being measured and how well the items measured the same construct. The analyses from the second study resulted in Version 7.0 of the DCA. The third and final study assessed how the results of the DCA 7.0 varied over time, thus establishing the instrument’s test–retest reliability.
Test Content and Response Process Validity Study
Method
Participants
The researchers recruited 56 individuals via email to request their participation in the DCA content validity survey. Thirty-four experts completed the survey, yielding a 57% response rate. Participants included (a) researchers with at least one publication in the area of implementation science (n = 2); (b) state or national technical assistance providers for implementation of effective EBPs (n = 21); and (c) district practitioners directly involved in training or coaching of district teams (n = 11). An additional four individuals were recruited with varying viewpoints to assess the response process or the fit between the items and the process engaged in by those using the assessment. Efforts were made to select individuals with differing roles in supporting district implementation or various levels of experience in using previous iterations of DCAs. Roles represented by the four additional participants included administrator, school psychologist, and Multi-Tiered System of Support (MTSS) Coordinator. This sample also met standards set by Virzi (1992) regarding number of participants necessary within a response process study.
Measures
A test content validity survey was created to gather feedback related to the DCA. Participants were invited to complete the survey through a secure online survey program.
The survey was presented in four separate sections to organize the responses and to give natural breaking points for participants as they responded. All components of the assessment were included within the content validation, including instructions, response formats and response scales, relevance, and representativeness, along with probing respondents to share what inferences can be drawn from the information gathered after the assessment has been completed (Haynes et al., 1995).
In the first section, participants were asked to consent to participation requirements and to read through the entire DCA. While reading, participants were asked to propose changes directly within a Microsoft® Word® document of the DCA using track changes. Participants were taught through video demonstration how to denote questions, suggestions for rewording, re-ordering, and any other comments. Results from track changes were used as a companion to the subsequent quantitative data collected.
The second segment of the survey asked participants to rate each item’s attainability and importance on a 3-point scale (i.e., 3 = Very, 2 = Somewhat, and 1 = Not at All). Three Content Validity Index (CVI) scores were calculated for each item. First, the number of experts who rated an item as very or somewhat important was counted for each item. Next, the number of experts who rated an item as very important was counted for each item. Finally, the number of experts who rated an item as very attainable was counted for each item. Each sum was divided by the total number of experts to calculate the three CVIs for each item. The overall CVI for the instrument was determined by averaging the CVI for each item. A CVI of .80 or higher is recommended for new assessment measures, and items below .80 should be examined for revision (Davis, 1992). Participants were also asked to select five items they identified as representing the most important aspects of district capacity.
The third segment of the survey gathered feedback regarding the comprehensiveness and clarity of the definitions for key constructs of capacity—Leadership, Organization, and Competency—using the aforementioned 3-point scale. Participants also matched items to the constructs to assist in setting up item mapping to subscales of the assessment as a precursor to the construct validity research, which was conducted 3 years after the content validity study.
The final portion of the content validation survey posed questions related to the sequencing of items and frequency of assessment. If minimal or significant reordering was selected, participants were asked to reorder items and provide a rationale for the suggestion. The administration frequency options presented in the survey were: monthly, quarterly, bi-annually, annually, or every 2 years. If participants had experience administering a previous version of the DCA or any other planning tool, they were asked: (a) whether the current version of the DCA (Version 6.0) is an improvement from previous versions and (b) to give input on what benefits have been experienced from using the DCA or other planning tools in the past.
The researchers used a Think-Aloud Protocol (TAP) Guide as a script during the response process think aloud to standardize observation and recording of verbal responses (Willis, 1999). Specifically, the TAP Guide included scripted instructions for the administrator to follow, a practice phase for participants to practice the TAP process with the administrator, and clear instructions on how the administrator should respond to participant input throughout the process.
Procedure
The hallmark of content validation is to ensure comprehensive and clear items. When analyzing data compiled for each item, developers first considered item ratings on importance and how many reviewers rated the item as one of the five most important within the DCA. If an item met the first importance CVI criteria of .90 or higher and second importance CVI criteria of .50 or higher, DCA developers kept the item. Other content validation research has used a CVI of .80 to warrant inclusion without revision, but using a 4-point rating scale that was consolidated to two ratings (McIntosh et al., 2017). Given the 3-point rating scale used for this study, we conservatively used two importance CVI thresholds. To meet the first threshold for inclusion, at least 90% of experts needed to rate the item as very or somewhat important. To meet the second CVI threshold for inclusion, at least 50% of experts had to rate the item as very important. If an item failed to meet both of these criteria, it was removed from the assessment. Comments and edits from the track changes document were then used as a guide for identifying minor edits like grammar or word order to enhance the item. Most suggestions made via track changes addressed consistency in language and did not conflict with each other. Item attainability ratings were used by the developers to note areas where educators would need a set of supporting resources to implement the practice addressed in the DCA item.
CVI for ratings of comprehensiveness and clarity were calculated in the same way using experts’ ratings of the construct definitions and the administration and scoring procedures section. Similar to the importance ratings, the DCA development team made changes to the construct definitions if the CVI was less than .90 for comprehensiveness or clarity.
Results
Item analysis
Results of the survey and track changes related to item analysis are organized in Table 1. At least one participant rated each DCA item among the five most important. Items 1, 2, 8, 14, and 17 were the items that received the greatest number of “most important” ratings. All five of these items were included in the next iteration of the DCA and careful attention was paid to any additional participant suggestions related to those items. Only one item did not meet both CVI thresholds for importance. Item 21 was deleted: A process is in place to evaluate selection outcomes. Reviewer feedback in the form of track changes guided additional edits to items’ clarity. If there was a conflict among reviewer suggestions without a clear majority, then a solution was put in place to address all feedback. For example, reviewers disagreed on the appropriate number of District Implementation Team members, so the development team removed references to a specific number of team members in Item 1. One example of how attainability ratings were used by the DCA development team was related to a set of low attainability ratings for Competency-related items. The DCA development team interpreted this finding as an indication that districts likely need resources (e.g., examples, guidance documents) to establish stronger Competency supports.
Item Analysis Results (District Capacity Assessment prior to Version 6.0).
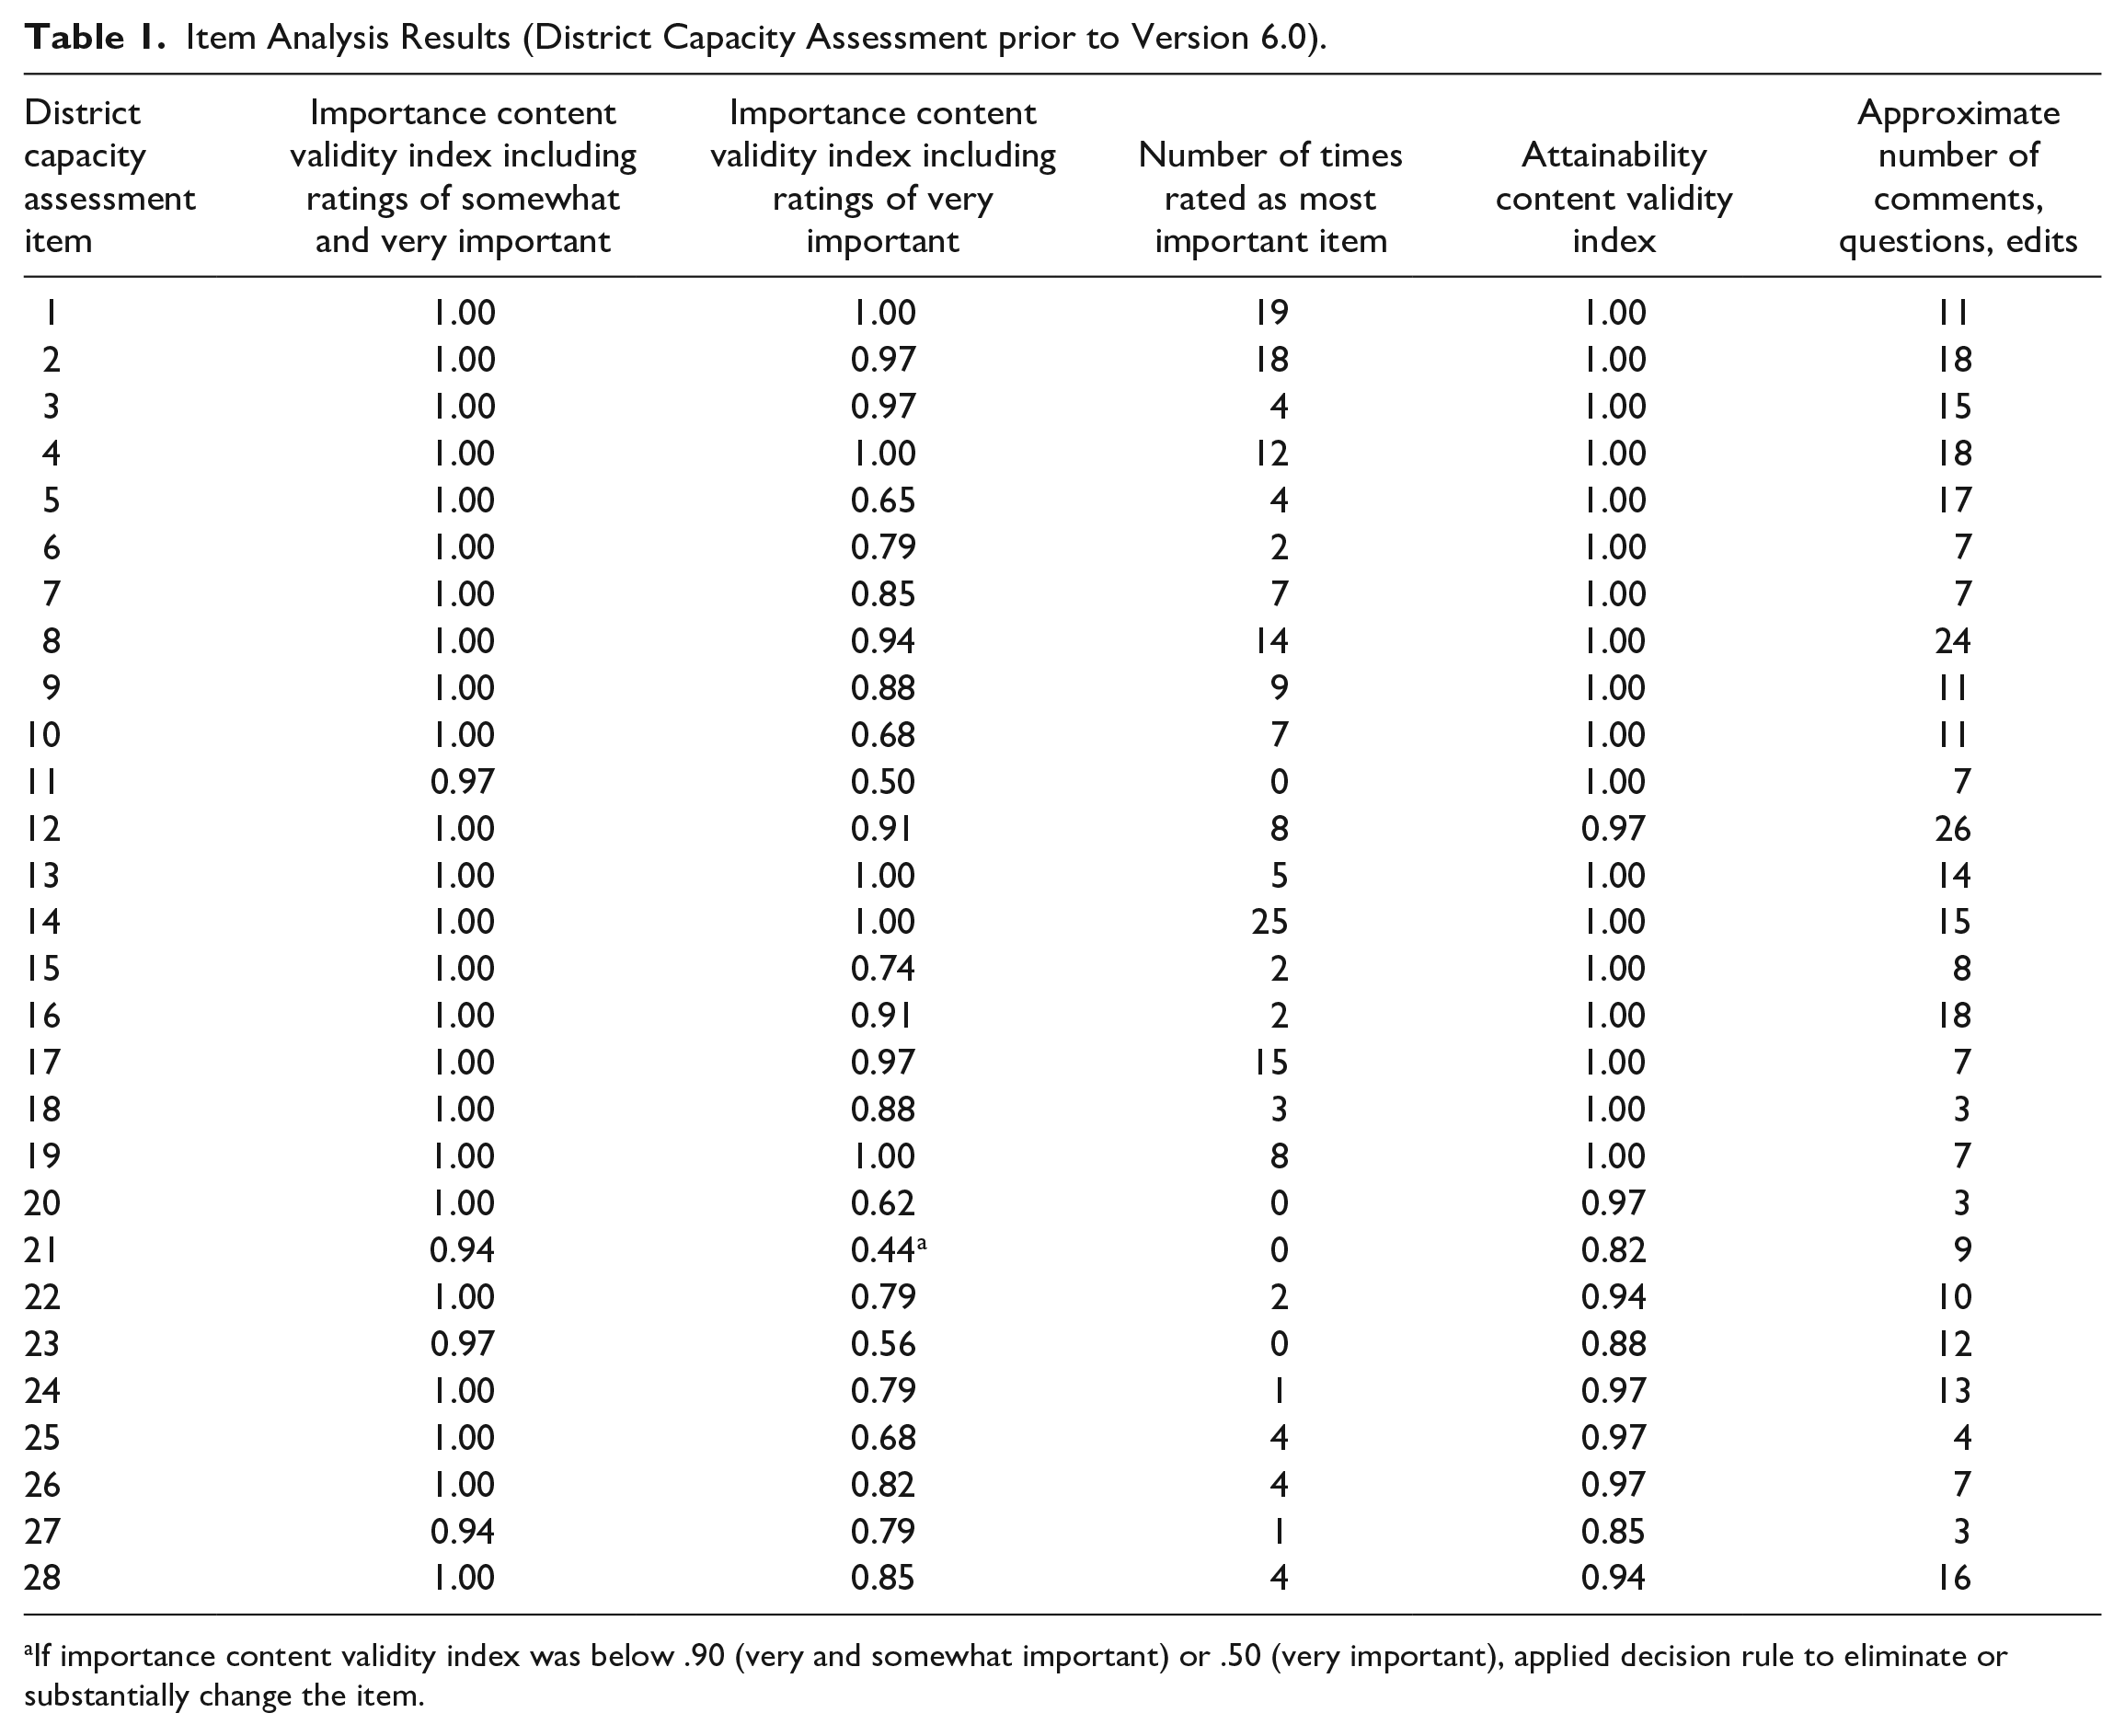
If importance content validity index was below .90 (very and somewhat important) or .50 (very important), applied decision rule to eliminate or substantially change the item.
Construct definitions, comprehensive and clear sections
Using a criterion of an average rating of .90 or higher, results indicated no significant revisions were needed for the Capacity (Comprehensive = .97, Clear = .97) and Competency (Comprehensive = 1.0, Clear = 1.0) construct definitions. Ratings for Organization (Comprehensive = 1.0, Clear = .94) and Leadership (Comprehensive = .94, Clear = .85) definitions were lower. In response to this finding, comments and track changes were used to rewrite both definitions, with the most focus on Leadership due to the scores falling below the desired CVI threshold. All sections of the DCA administration protocol met the threshold for comprehensive and clear language (CVI of .90 or higher). DCA developers analyzed the track changes and made minor edits to the content and format accordingly.
Frequency of assessment
Results for this survey section were inconclusive. The decision rule of 70% of respondents suggesting one option was not met. For all questions related to frequency, most results were split between annual (38%) and bi-annual (50%) use of the DCA. Although the results were similar between the two options, more respondents commented that a bi-annual assessment schedule would be most beneficial. Comments also indicated that a more frequent schedule was warranted for such a difficult area of work for teams. Developers determined that directing teams to return to the assessment on a regular basis would help keep the teams focused and moving forward on activities; thus, the majority recommendation to assess twice annually was adopted. Given the budgeting and improvement planning schedule within districts, assessment developers recommended the assessment to be conducted in the August–September time frame with progress monitoring and action planning in January–February time frame.
Item match with constructs
Fifty-seven percent of participants matched 20 items to the same construct. Thus, reviewers were not consistently matching the items to the constructs initially identified by the authors and also were not mapping the items to a consistent alternate construct. A hypothesis generated for these results is that confusion from the variety of definitions used within the field of implementation science clouded clarity of the constructs. In addition, the practices outlined in the Implementation Drivers are interrelated and integrated which may have contributed to the difficulty in mapping the constructs. For these reasons, the DCA development team determined that the developers would map the items using the comments provided by reviewers as an additional resource. Furthermore, these results indicated the need for a more formal factor analysis, which is described in the next study presented. It was hoped that having participants map items to constructs could serve as a precursor to a later factor analysis. However, results demonstrated little value added by this part of the content validation procedure.
Sequencing of items
The decision rule for reordering items stated that the item would be reordered if a majority consensus was reached by 50% of respondents suggesting that an item be moved. Seventy-seven percent of reviewers suggested no reordering of items. A few items, however, were reordered based on comments and edits to the assessment items. The final sequencing of DCA items was based on the following considerations: (a) starting with easier to answer, less complex concepts; (b) putting items next to each other which were related in focus; and (c) sequencing items so that responses to one item could support responses to later items.
Improvements compared to other measures
Seventy-six percent (n = 26) of respondents had previously completed a similar assessment related to district capacity for implementation. On a response scale of 0 to 10, the new version of the DCA was given an average improvement rating of eight. Comments indicated that the new version was simpler, had shorter and more concise items, and was improved by the addition of a scoring rubric. This information was used to confirm continued work on the new version of the DCA (Version 6.0).
Response process results and modifications to the measure
The response process results were analyzed and acted upon by the developers following completion of the think-aloud procedures. No significant changes were necessary; however, minor improvements were made (e.g., item and scoring rewording) to improve clarity. The response process highlighted difficult-to-read sentences and inconsistencies in language and wording that could be interpreted multiple ways. Comments and suggested edits prompted a final editing process that ensured consistency and clarity in wording across the DCA (Version 6.0).
Internal Structure Analysis Study: Factor Structure and Internal Consistency
Method
Participants
An extant data set was analyzed for the internal structure analysis study, representing 663 district teams across 27 different states. District teams were recruited by their state leadership teams for district capacity efforts within school improvement, MTSS, or Positive Behavioral Interventions and Supports initiatives. Districts varied in urbanicity (32% suburban, 20% town, 22% city, 26% rural) and demographics of enrolled students (i.e., averages of 68% White, 9% Black, 15% Hispanic, 4% Asian, 1% American Indian, 3% two or more races). On average, 18% of students were eligible for free and/or reduced-price lunch, 11% of students were receiving special education services, and 7% of students were receiving services as English language learners. Scores from the test–retest reliability study were not included in this sample.
Procedure
The DCA administration process involves the following: (a) a trained facilitator, (b) the District Implementation Team respondents, and (c) the assessment tool (DCA Version 6.0). Trained facilitators were often external coaches supporting districts’ implementation efforts for their selected innovation. All facilitators were required to successfully complete an online training course (passing score of 80%) prior to receiving access to the DCA and use of the online data collection system. To support using the administration and scoring process as intended, a fidelity checklist outlining the needed roles, resources, and steps prior to, during, and after the administration is provided for facilitators to complete. One hundred percent of facilitators reported administering the DCA with at least 95% fidelity.
Results
Confirmatory factor analysis
A confirmatory factor analysis (CFA) was conducted using structural equation modeling (Mplus) for the three a priori hypothetical scales of Leadership, Competency, and Data System for Decision Making. The structure (number of factors and which item loaded on which factor) was specified in the model and the fit of the data to that model was tested. This provided the strongest level of support for the scales of the instruments and the extent to which the test items define those scales.
Descriptive statistics for each of the scales and their hypothesized items are in Table 2. An item correlation matrix prior to the CFA was analyzed. Items within the hypothesized scales had higher correlations among each other than with items from other hypothesized scales. In the CFA, each item was required to load on the designated factor. The items were assumed to be ordinal. Two sets of fit criteria: amount of residual variance and overall fit (Fabrigar & Wegener, 2011) were examined given these fit measures tend to perform well with respect to detecting model misspecification and lack of dependence on sample size (Jackson et al., 2009). The root mean square error of approximation (RMSEA) of .071 and comparative fit indices (confirmatory factor index [CFI] = .93, Tucker–Lewis Index [TLI] = .92) suggested an adequate fit, providing good support for the hypothesized factors of Leadership, Competency, and Data System for Decision Making. See Table 3 for the model results.
Descriptive Statistics for District Capacity Assessment (Version 6.0).
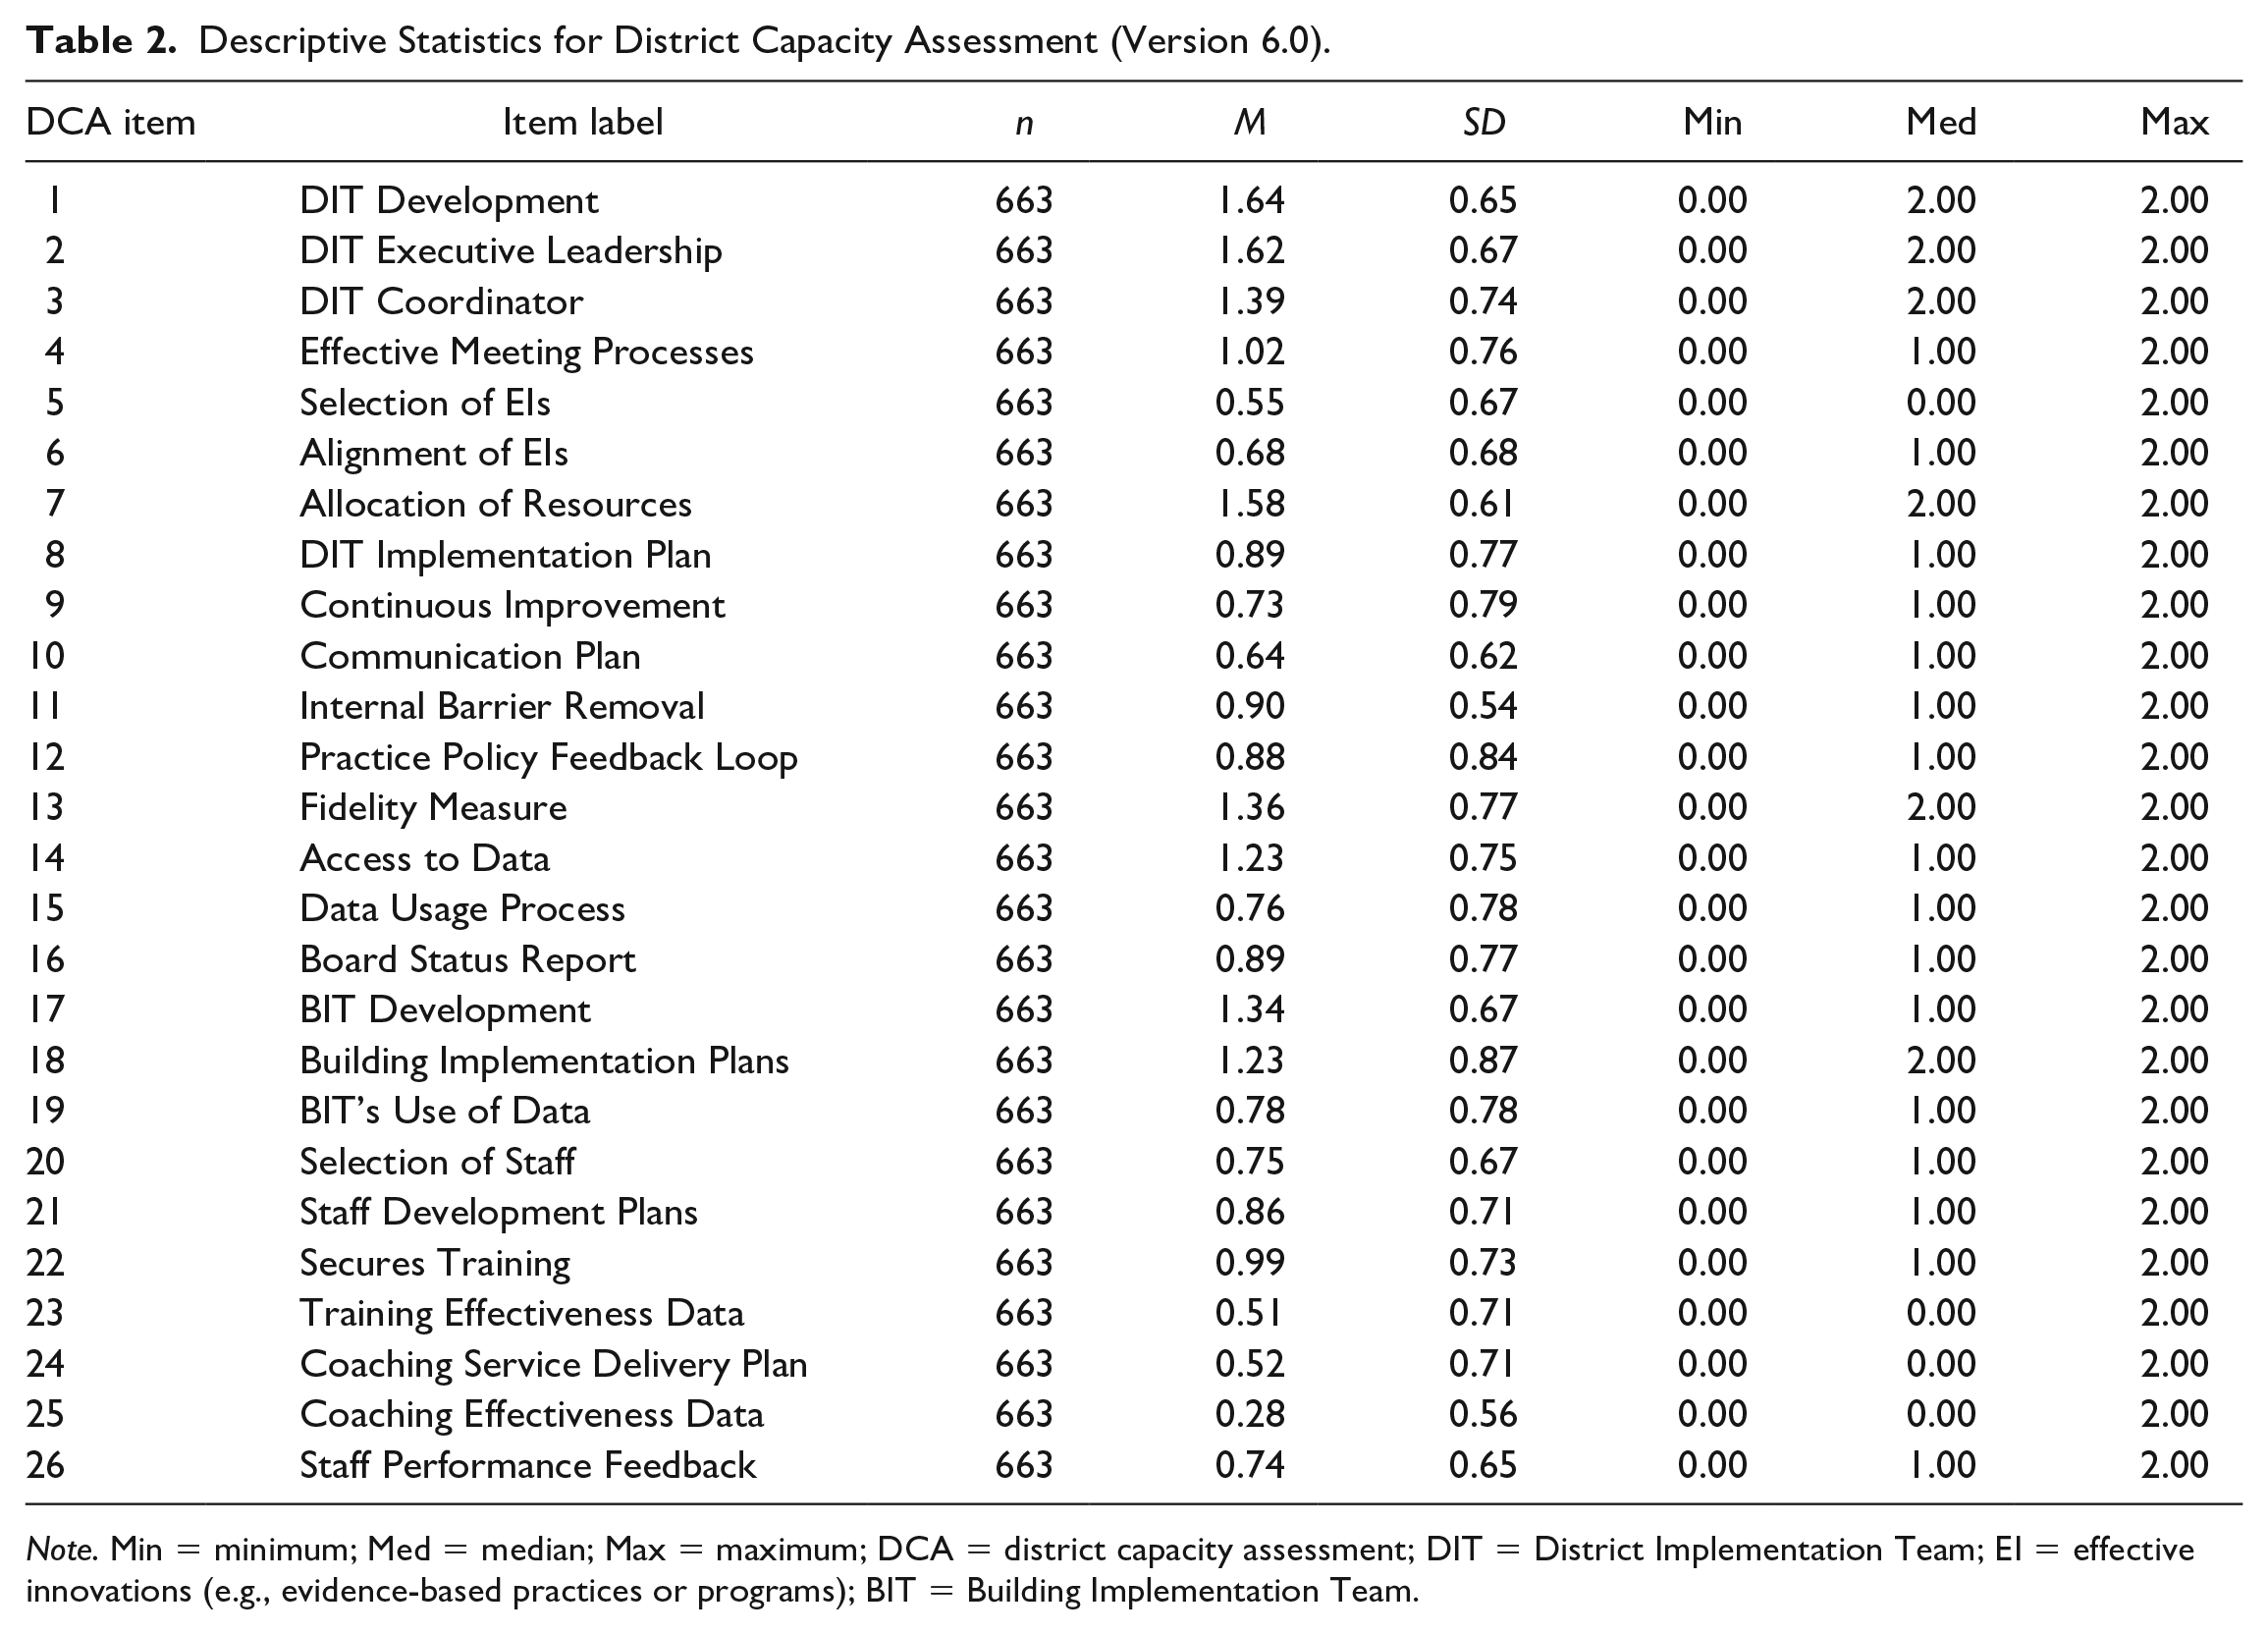
Note. Min = minimum; Med = median; Max = maximum; DCA = district capacity assessment; DIT = District Implementation Team; EI = effective innovations (e.g., evidence-based practices or programs); BIT = Building Implementation Team.
Confirmatory Factor Analysis Model Results (DCA Version 7.0).
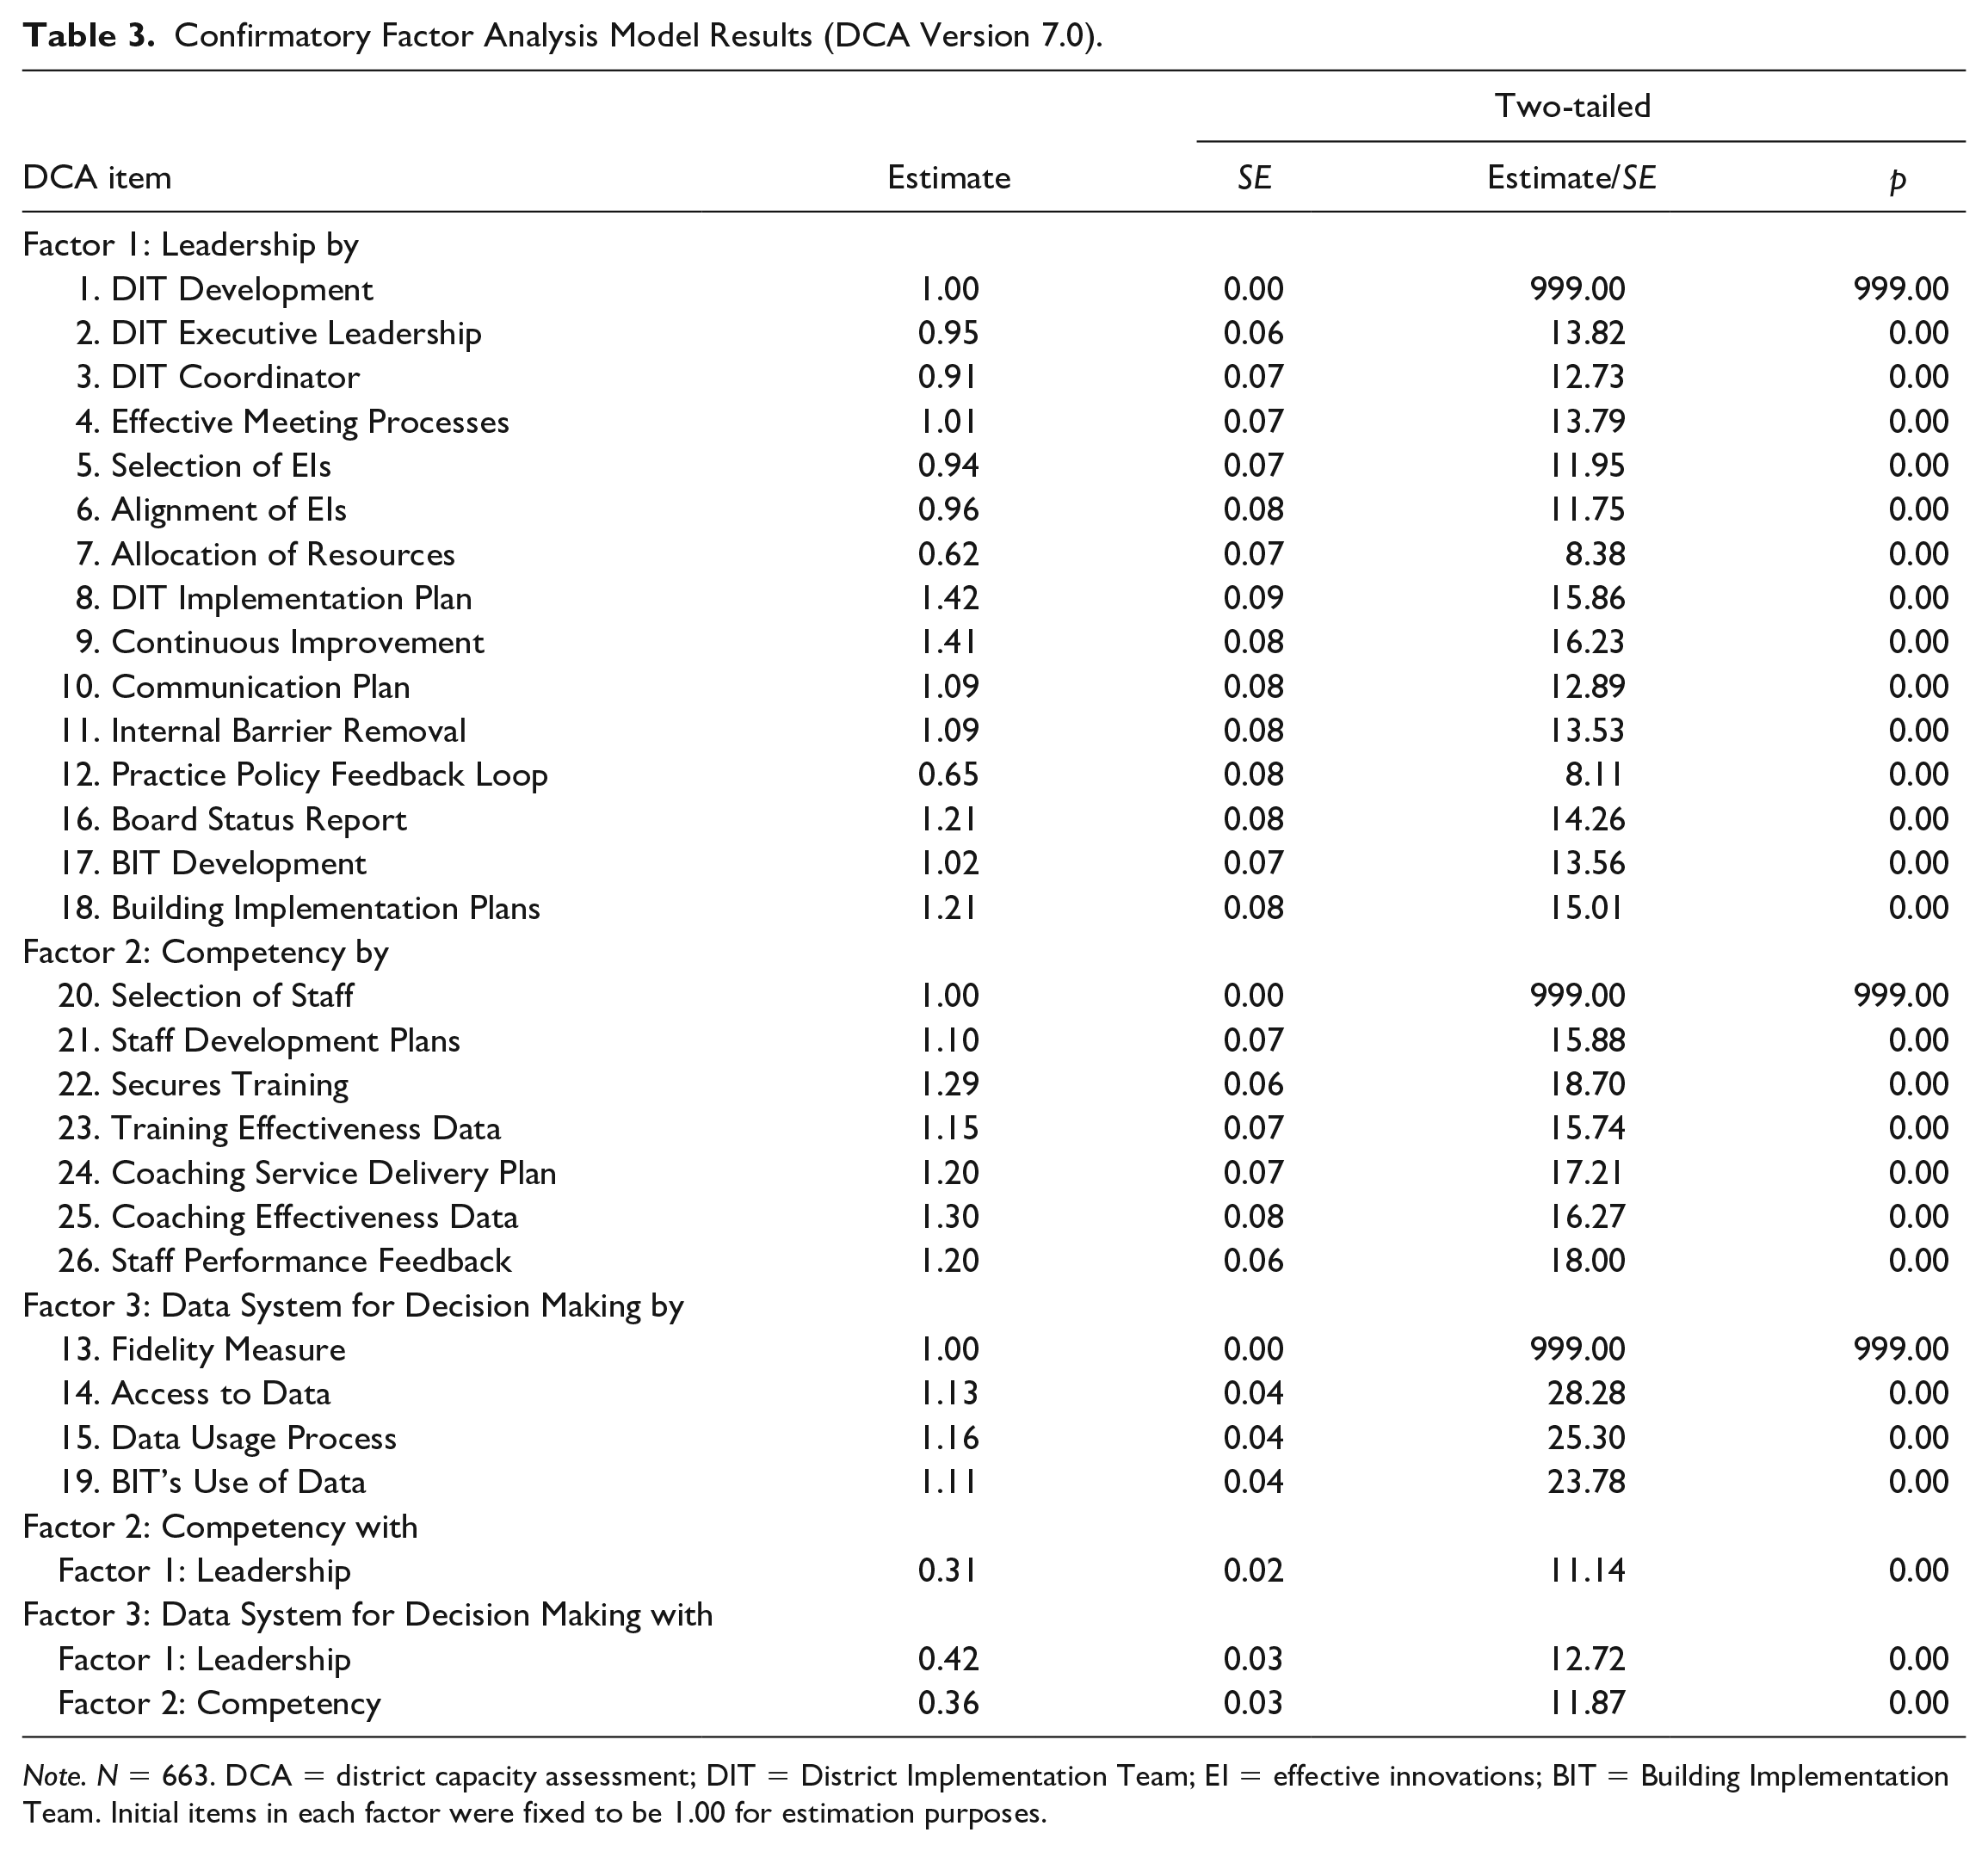
Note. N = 663. DCA = district capacity assessment; DIT = District Implementation Team; EI = effective innovations; BIT = Building Implementation Team. Initial items in each factor were fixed to be 1.00 for estimation purposes.
An exploratory factor analysis (EFA) was conducted to see what optimal fit might look like and serve as a sensitivity test. It allowed for correlated errors but ignored nesting of individual within individuals (Porter & Fabrigar, 2012). Specifically, the EFA involved a principal component analysis, retaining factors with an Eigenvalue of 1 or more, and conducting a varimax rotation (orthogonal) given the inter-factor correlations ranged between .27 and .38. Results suggested a three-factor solution with six items loading on a different factor than what was found in the CFA. A factor loading of .4 or greater was used as criterion. Decision rules, such as minimum average partials or parallel analysis, could have been considered for the EFA (Gordon & Courtney, 2013). A second CFA with these items switched was run and the fit indices were very poor. Overall, these results provide good support for the three hypothesized scale scores and initial CFA.
Internal consistency analysis
Coefficient alpha was used to evaluate the internal consistency of the measure using the same sample (n = 663). The overall internal consistency of the measure was strong with a score of .91. Scale scores were found to be adequate (α = .79 for Data System for Decision Making, α = .80 for Competency, and α = .81 for Leadership). Based on the factor analysis results and internal consistency analysis, an item was deleted regarding use of performance feedback data and two additional items were added: one item regarding the use of different types of data and one item regarding the use of a coaching system. These additional items were added based on a review of scoring criteria outlined in the rubric on related items and noting the complexity of the criteria. An additional item was added for each to simplify the scoring criteria, separate the functions being assessed, and ensure greater alignment with the best practices of the relevant Implementation Driver. These changes resulted in Version 7.0 of the DCA.
Reliability Study: Test–Retest
Method
Participants
Five district teams and their external coaches across two mid-western states (Minnesota and Michigan) participated. District teams were recruited by their state leadership teams for district capacity efforts within school improvement with identified literacy practices (n = 1), MTSS model with focus on mathematical practices (n = 1), or PBIS initiatives (n = 3). The five districts were in various stages of implementation ranging from exploration of their innovation to initial or full implementation in their third or fourth years of work.
Procedure
External coaches facilitated the DCA (Version 7.0) twice, exactly 2 weeks apart, with each District Implementation Team. Respondents on the teams remained consistent between administrations. Researchers calculated test–retest reliability, the extent to which scores vary when the DCA is used across time, by comparing the scores of the teams’ initial results with those of the 2-week retest.
Results and Changes to Measure
Kappa and correlated scale scores over time were computed using Pearson product correlations. It should be noted that intraclass correlations were not possible with only five districts contributing. The test–retest reliability correlations for the Leadership and Data Systems scales indicated very strong agreement (r = .98 for both scale scores) and most items had 100% agreement. The test–retest reliability correlations for Competency are adequate (r = .78 for scale score). The test–retest reliability coefficient for the competency scale was lower than the other scales even with respondents remaining constant across administrations. DCA developers confirmed that no training events or interventions occurred within the 2-week period. It is hypothesized that this may have been because one of the repeated administrations with changes in scores was framed around an unclearly defined practice, as evidenced by lack of a consistent fidelity measure and clearly defined critical components. An unintended consequence of the DCA can be the learning of the practice being unclearly defined. Prior to administration, the trained administrators confirmed with the district team the identified components of the practice and presence of fidelity measure. The scoring of DCA, however, highlighted inconsistent use of a fidelity measure across implementing sites as well as lack of consistency in definitions of the practice’s core components.
Results indicated three items needed minor edits for clarity and alignment of scoring descriptors. Specifically, these items included item 21 regarding the use of a process to select staff, item 22 regarding the use of a plan to continuously strengthen staff skills, and item 25 regarding the use of a coaching system.
Discussion
In an effort to address the research-to-practice gap present in education and address improved outcomes for students, knowledge and skills in the use of research-based implementation practices is needed by districts. A measure of a district’s implementation capacity can provide the needed information for improving district-wide supports for EBPs. The purpose of this study was to examine the validity and reliability of such a measure, the DCA (Versions 6.0 and 7.0). Validity is a complex concept with a variety of components to unpack and examine prior to making strong claims regarding how accurately the assessment measures what it is intended to measure. In an effort to begin documenting evidence of the DCA’s validity, this article reports the results of three studies conducted to establish the measure’s content validity, response process validity, construct validity, internal consistency, and test–retest reliability. After each study, improvements were made to the measure to enhance its technical adequacy. Overall, the results from each study demonstrated the DCA to be a reliable and valid measure of district capacity for the implementation of EBPs.
Content Validity
Respondents within the test content and response process validity study consistently indicated the measure was an improvement over previous measures, is a support to the area of assessing capacity for implementation of effective innovations, and using the assessment will help to support action planning and growth related to a district’s ability to support schools. Through the use of expert and practitioner feedback, the DCA developers were able to establish that the DCA items were important and feedback was used to improve the item clarity.
A large response pool throughout the content validity and response process study served multiple purposes. Putting the DCA in front of individuals who had used or administered previous versions of a capacity assessment for districts gave those who had been involved with early capacity assessment work an opportunity to build an understanding of the proposed changes. The DCA developers also valued feedback from those who had not previously interacted with an assessment of this type. In addition, the large participant group allowed input from those who facilitate, train, and support District Implementation Teams while also targeting practitioners on district teams who serve in a broad range of educational roles.
Internal Structure and Reliability
The CFA results established an internal structure comprising three scales: Leadership, Competency, and Data System for Decision Making. The sample size used within the analysis was of sufficient power to support a strong goodness-of-fit index. The three-scale structure is in alignment with the underlying theory of the Implementation Drivers. Thus, the DCA is measuring and providing useful information regarding the district’s ability to develop their staff’s competency and confidence in the use of the innovation, as well as provide the necessary leadership supports and enabling procedures such as use of data and communication processes. In terms of reliability, internal consistency analyses and results of test–retest reliability demonstrated the DCA to be reliably measuring the implementation constructs over time. Throughout the studies, DCA developers proactively modified identified areas of limitations and, as a result, created a capacity assessment that can be considered a well-designed assessment.
Implications for Practice and Policy
Investing in adoption of new practices should always include ongoing fidelity to the practice being used and ongoing assessment of the host organization’s (district) capacity to support and sustain implementation. Without these two measurement components, district investment in adoption of new practices and its supports (e.g., training, coaching, data systems) is much less likely to result in initial adoption, sustained use, and/or benefits for students. Evidence for this can be seen in the evaluation of school reform efforts, where often these two components were not reported as being measured (Dragoset et al., 2017).
Implementation science practices and structures as outlined in the Implementation Drivers are considered a new area of focus for district and school leaders. Using the DCA as a formative assessment with a district team does not simply provide a final score but also offers opportunity for learning, discussion, and planning throughout the assessment. Through group exploration of items and the scoring rubric, teams are able to arrive at organizational consensus regarding the intensive work necessary to support schools. No longer can a district consider itself as fully supporting schools with implementation when simply scheduling a presenter or trainer to introduce new practices to school staff or over relying on student outcome data to guide decision-making without including fidelity data. Training without systems (e.g., data systems for decision-making, coaching) to support implementation is not adequate. However, many districts lack a clear path to follow when aligning supports to school implementation. The Implementation Drivers provide information regarding systems, practices, and structures that, when in place at the district level, enable schools’ effective use of innovations. The DCA can guide districts to determine quality of supports being provided and what additional implementation supports (e.g., leadership, competency, data systems) should be enhanced through action planning to obtain improved student outcomes. Specifically, Districts can use results to prioritize areas for improvement through use of prioritization matrices, create a detailed action plan, and monitor their progress on these actions at regular meetings.
Limitations
The content and response process validation were conducted based on standards and best practice in the area of assessment validity. One limitation is many of the respondents were in a fiscal or organizational relationship with the DCA developers. Although this created a purposive sample with noteworthy expertise, it is possible that this subset has similar experiences with implementation and sustainability that may not apply as readily to those working with another organization or without direct implementation and scale-up support. As use of the DCA broadens both nationally and internationally, it will be beneficial to continue to seek feedback on the items, rubric, and assessment sections to continue to ensure the assessment is comprehensive and clear for all users.
Additional limitations are present for the study of the instrument’s internal structure. Given the changes made to the instrument as a result of the factor analysis and internal consistency results, additional psychometric research is needed to re-confirm its internal factor structure. It cannot be assumed the factor structure of Version 6.0 will generalize to Version 7.0. Although this article outlines initial validity work, continued validation is necessary. Specifically, additional research is needed to explore the DCA’s predictive validity, concurrent, and criterion-related validity for a full validation of the assessment tool. As more districts utilize the DCA for district improvement, the DCA development team is gathering additional evidence of the DCA’s validity including relationship of the DCA to the critical outcomes of increased implementation fidelity and student outcomes, and consequences of testing. Without these further validation studies, it is not yet appropriate to consider the DCA a fully validated tool. Further validation will strengthen the assessment and confidence of those using the DCA.
Conclusion
District Implementation Teams or researchers who use the DCA can be confident that the assessment is founded on implementation science research. Users can also be assured that a strong process was put in place to confirm test content validity and that the response process of the tool is strong. In addition, this assessment is developed within a continuous improvement model where further validation plans are intended. Modification and improvements will be made to the measure as deemed necessary based on further research. Work to validate the DCA has been guided by most recent developments in validity testing with the objective of constructing an assessment of district capacity for districts to use in evaluation and action planning. Using detailed qualitative feedback in conjunction with the quantitative results from the content validation survey provided an elevated level of response and a wealth of information for use in the content validation process. Given that full validation of an assessment evolves over time as additional validity evidence can be accumulated, DCA developers devoted significant time and resources to ensure quality evidence of the initial validity of the current tool. District teams who are interested in progressing forward with actions and activities related to improving district capacity to support implementation of effective innovations can use the DCA confidently in this endeavor.
Footnotes
Declaration of Conflicting Interests
The author(s) declared no potential conflicts of interest with respect to the research, authorship, and/or publication of this article.
Funding
Development of this paper was supported by the Office of Special Education Programs U.S. Department of Education (H326K120003). Opinions expressed herein are those of the authors and do not necessarily reflect the position of the U.S. Department of Education, and such endorsements should not be inferred.