
Abstract
Three-level multisite individual randomized trials (MIRTs), in which individuals are nested within teachers and schools and randomly assigned to treatment or control conditions, provide a robust framework for assessing overall intervention effects and moderation at multiple levels. This study develops a statistical framework for designing three-level MIRTs to evaluate moderated treatment effects and examines the impact of ignoring one level of nesting on Type I error rates and statistical power. We illustrate the framework with an example of an online tutoring program and derive formulas for statistical power and the minimum detectable effect size difference. These formulas are validated through Monte Carlo simulations, which also demonstrate the risks of ignoring nesting. Finally, we introduce a software tool to facilitate power analysis for moderation in three-level MIRTs and summarize key findings.
Keywords
Multisite randomized trials (MRTs), including multisite individual randomized trials (MIRTs) and multisite cluster randomized trials (MCRTs), are widely used in program evaluation, particularly in educational and social science research (e.g., Bai et al., 2025a, 2025b; Cox et al., 2024; Shen & Kelcey, 2022; Spybrook et al., 2020). These designs are especially valuable for assessing the effectiveness of interventions across diverse settings. In educational contexts, it is common to encounter a three-level nested data structure, where students (Level 1) are nested within teachers or classrooms (Level 2), which are further nested within schools or sites (Level 3). Three-level MIRTs, where individuals within classrooms within schools are randomly assigned to treatment or control conditions, provide a powerful framework for examining both overall treatment effects and heterogeneous effects across levels.
Treatment effects may vary across teachers and schools, and these heterogeneous effects may be explained by moderator variables. Moderators are variables that influence the strength or direction of a treatment effect (Baron & Kenny, 1986), allowing researchers to explore for whom or under what conditions an intervention is effective (Spybrook et al., 2020). In educational research, moderators can be at different levels (student-, teacher-, or school-level) and scales (binary or continuous). For instance, student characteristics (e.g., prior achievement and socioeconomic status), teacher attributes (e.g., experience), or school contexts (e.g., urban vs. rural) often serve as moderators (Raudenbush, 1988). In addition, these moderation effects can also exhibit random or nonrandom variation across higher levels, making it essential to properly account for the hierarchical structure of the data (e.g., Cox et al., 2025; Dong et al., 2021a).
Power analysis is a critical step in designing three-level MIRTs because it ensures that studies are adequately powered to detect meaningful effects. Including power calculations for moderators is essential because moderation effects are often central to theory and practice. For example, moderators help determine whether a tutoring program benefits students with lower baseline math scores more than higher scorers, or whether a professional development initiative is more effective in schools with more or less experienced teachers. By formally integrating power analyses for moderation effects into study planning, researchers can ensure that their MIRTs are appropriately designed to detect meaningful variation in treatment impacts across contextual and individual levels. Although statistical tools for power analysis of moderation effects in two-level MIRTs and three-level MCRTs have been developed (Dong et al., 2021a, 2021b, 2024a, 2024b; Snijers, 2001, 2005), such tools are notably absent for three-level MIRTs. This gap in the literature leaves researchers without the necessary methods to accurately plan and analyze studies involving three-level nested data.
Additionally, the consequences of ignoring one level of nesting have been examined in three-level cluster randomized trials (CRTs) and regression discontinuity designs (Bulus & Dong, 2022; Moerbeek, 2004; Opdenakker & Van Damme, 2000; Van den Noortgate et al., 2005; Zhu et al., 2011); however, their impact on moderation effects in three-level MIRTs has not been well studied. Prior research suggests that in some instances, a level can be safely ignored (e.g., Bloom et al., 2008). In other cases, ignoring a level of nesting can lead to underestimated standard errors, inflated Type I error rates, or overstated statistical power, which undermine the validity of results (Moerbeek, 2004; Van Landeghem et al., 2005). In addition, ignoring a level of nesting limits the ability to examine effect heterogeneity and/or moderator effects in MRTs. For example, removing the classroom level eliminates the possibility of assessing whether effects vary across classrooms, in addition to variation across schools. Clear guidance for addressing these issues in the design and analysis of moderation in three-level MIRTs remains limited.
By addressing these gaps, this study aims to enhance the rigor and applicability of three-level MIRTs in educational and social science research, enabling researchers to better understand and account for the complexities of hierarchical data structures. Specifically, the purpose of this study is to develop a statistical framework for designing three-level MIRTs to investigate a moderated treatment effect, explore the consequences of ignoring one level of nesting on statistical power for moderation effects, and provide researchers with a practical tool for designing such studies. In the following, we first provide an illustrative example of an online tutoring program for investigating moderation effects in three-level MIRTs. We then present the formulas to calculate the statistical power and the minimum detectable effect size difference (MDESD) for moderator effects in three-level MIRTs. We validate these formulas and investigate the consequences of ignoring one level of nesting using Monte Carlo simulation, offering insights into the potential risks of model misspecification. We demonstrate how to conduct power analyses for moderation effects in three-level MIRTs using a user-friendly software tool we developed. Finally, we conclude by summarizing key findings.
An Illustrative Example for Investigating Moderation Effects in Three-Level MIRTs
Our working example is based on a recent MIRT evaluating the impact of an online tutoring program on students’ math achievement (Gortazar et al., 2024). In the study, students were randomly assigned within each classroom, within each school, to either receive an online tutoring intervention or continue with business as usual. This design represents a three-level MIRT, where students (Level 1) are nested within teachers/classrooms (Level 2), which are in turn nested within schools (Level 3), with treatment occurring at the student level.
In addition to estimating the average treatment effect in this experimental evaluation, the researchers probed the degree to which the treatment effects were moderated by characteristics at the student, classroom, or school level, and whether these moderation effects varied across sites. Moderators can be either continuous (e.g., student's pretest scores, teacher's years of teaching, and school size) or binary (e.g., student's sex, teacher with master's degree or not, and urbanity).
Using this example, we present and explain formulas for calculating the statistical power and the MDESD for different moderated treatment effects. We also examine the consequences of ignoring one level of nesting by simplifying the model to two levels on the Type I error rate and statistical power of moderation effect estimates.
Statistical Framework
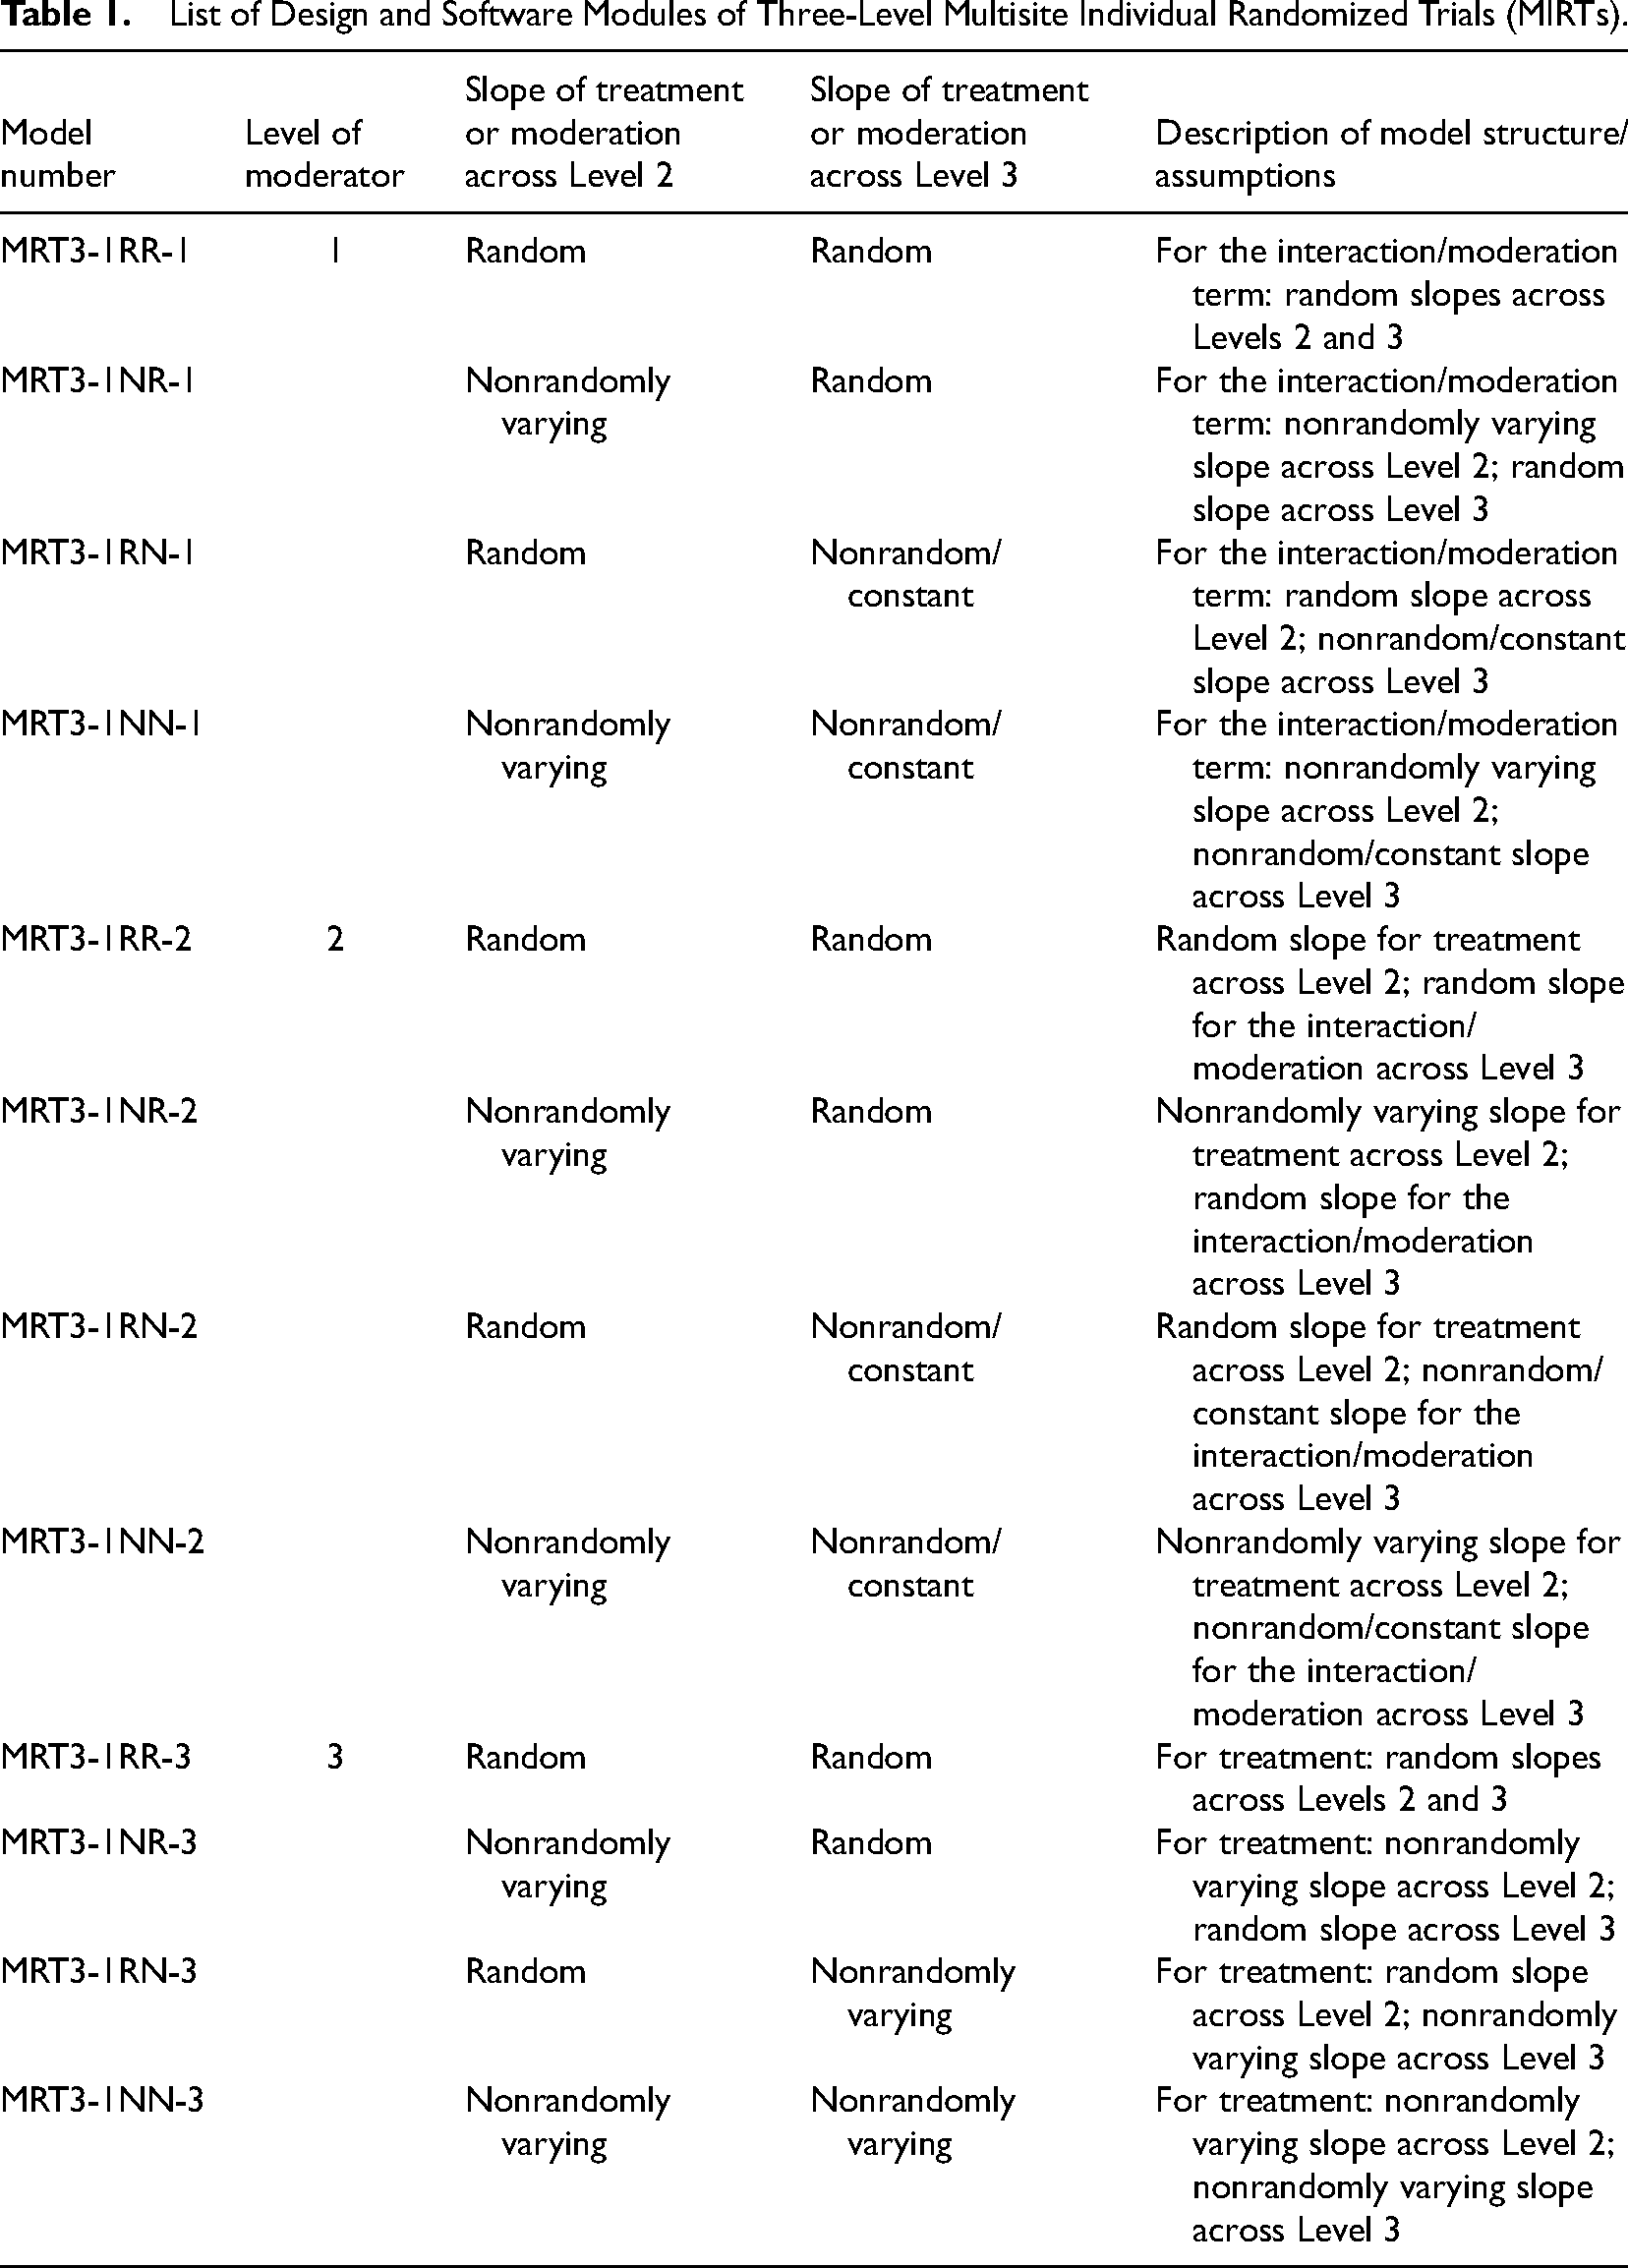
The statistical models used to investigate moderator effects in three-level MIRTs depend on three key factors: the level of the moderator, whether the moderation slope varies across Level 2 units (teachers/classrooms), and whether the moderation slope varies across Level 3 units (schools). Table 1 presents 12 model variations based on different combinations of these factors. A description is provided to help distinguish each model and clarify the model structure/assumptions necessary for interpretation. For example, Model MRT3-1RR-1 represents a three-level MIRT with treatment at Level 1 (MRT3-1), a Level 1 moderator (such as pretest scores), and random slopes for the interaction between treatment and the moderator across both classrooms and schools (RR-1). This model allows the moderated treatment effect to vary randomly at both classrooms and schools. By contrast: MRT3-1NR-1 allows random variation only across schools, MRT3-1RN-1 allows random variation only across classrooms, and MRT3-1NN-1 assumes no random variation, with the moderated treatment effect constant across classrooms and schools.
List of Design and Software Modules of Three-Level Multisite Individual Randomized Trials (MIRTs).
For the power analysis, researchers can calculate either the statistical power or the MDESD, along with 95% confidence intervals (CIs). It is also important to distinguish between binary and continuous moderators, as their effect size metrics differ. For a binary moderator (e.g., sex), the focus is on the difference in treatment effect between the two subgroups (e.g., girls vs. boys). For a continuous moderator (e.g., pretest score), the focus is on the change in the treatment effect associated with a one-standard-deviation change in the moderator (i.e., the standardized regression coefficient).
For models with nonrandomly varying (or constant) slopes, the formulas for the statistical power and the MDESD can be derived by omitting the variance components that represent treatment or moderation effect variability across the corresponding level of nesting in the random slope models. Therefore, we focus on presenting and explaining the formulas for the statistical power and the MDESD (with CIs) for three primary models with random slopes across both the classroom and school levels. These models are MRT3-1RR-1, MRT3-1RR-2, and MRT3-1RR-3, which correspond to moderators at Level 1, Level 2, and Level 3, respectively. We begin by describing the case of a continuous moderator, and then extend the formulas to accommodate binary moderators and models with nonrandom slopes. To conserve space, derivations of the standard error (SE) and some MDESDs are provided in the Supplement. All 12 statistical models and their corresponding formulas for statistical power are summarized in Table 2. Additional formulas for MDESD and CIs are provided in Table S1 in the Supplement.
Summary of Standardized Noncentrality Parameters for Three-Level MIRTs.
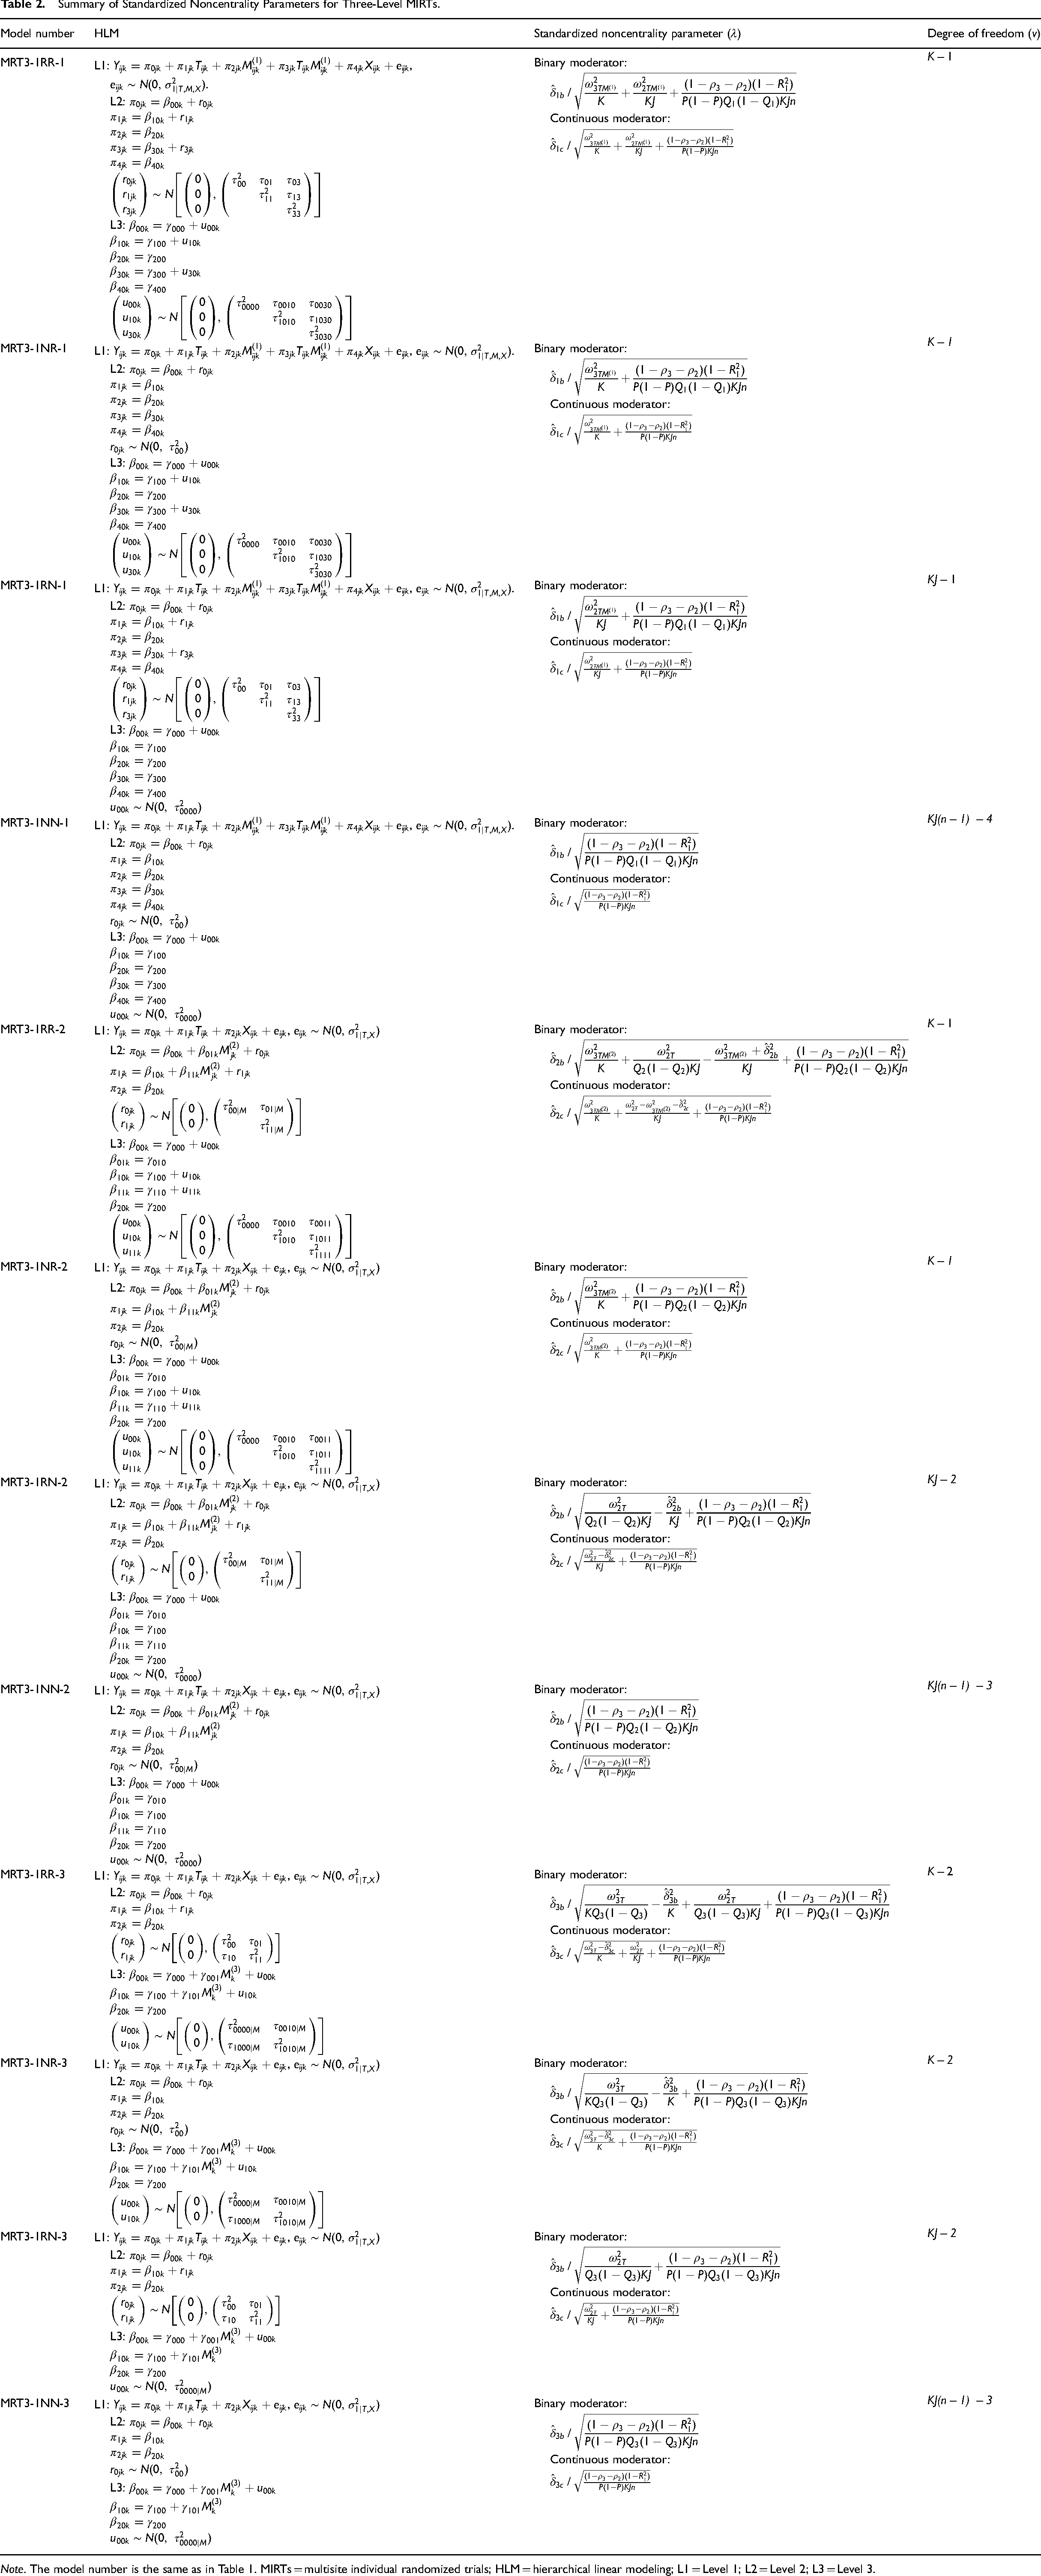
Note. The model number is the same as in Table 1. MIRTs = multisite individual randomized trials; HLM = hierarchical linear modeling; L1 = Level 1; L2 = Level 2; L3 = Level 3.
Model MRT3-1RR-1 for a Level 1 Moderator
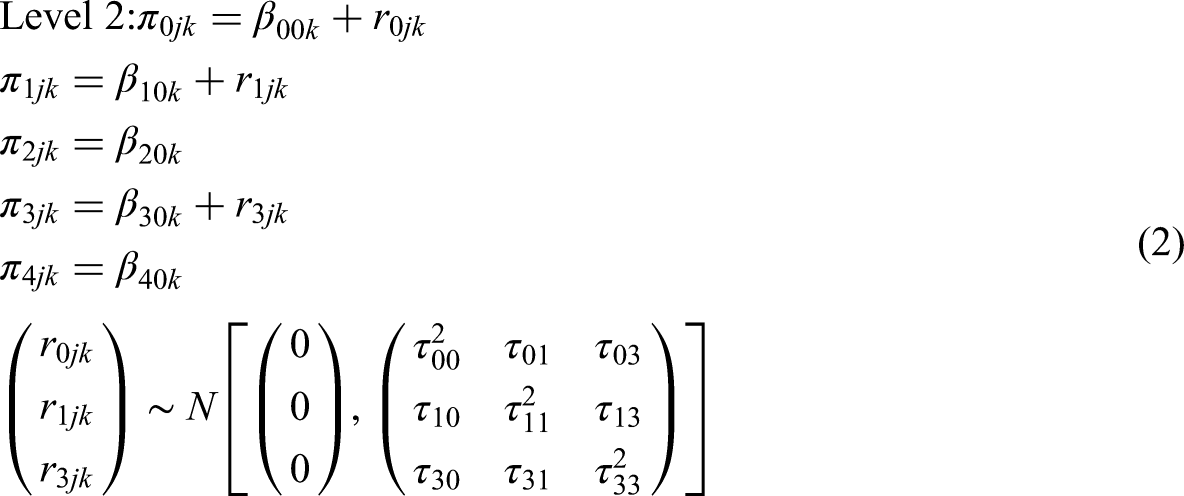
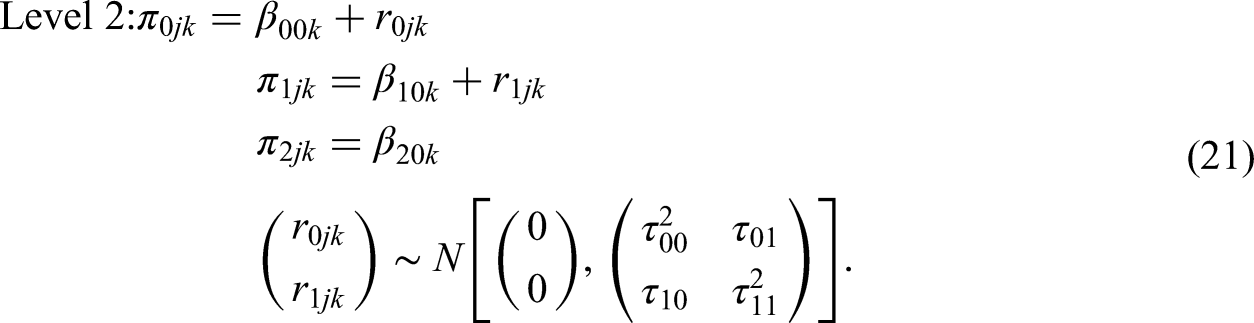
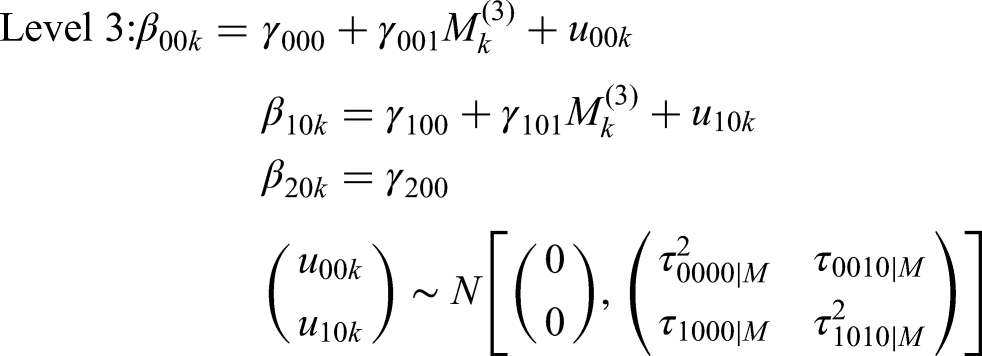
To test for the Level 1 moderation in Model MRT3-1RR-1, we use three-level random slope hierarchical linear modeling (HLM) (Raudenbush & Bryk, 2002):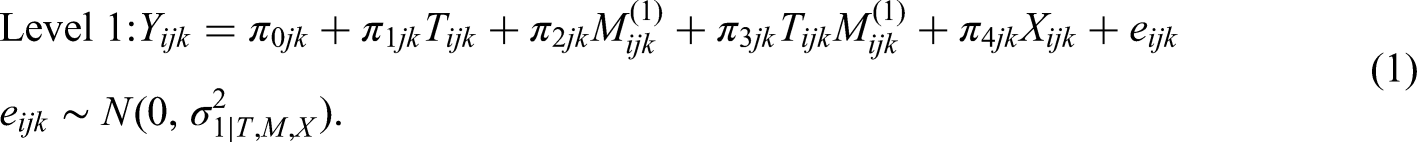
The combined model is:
Power Formulas
We test the moderation effect of pretest or sex (
The unstandardized noncentrality parameter is defined as the ratio of the Level-1 moderator effect to its standard error. The standard error incorporates multiple sources of variability: the variance of the moderation effect across schools (


The statistical power for a two-sided test with the degrees of freedom of 
MDESD with CI
In addition to knowing the statistical power for a study to detect a desired effect size, it is useful to know the minimum effect size difference that a moderation study can detect with sufficient power (e.g., 80%) given sample sizes. This goal is to derive the formulas for calculating the MDESD with a CI.
The MDESD can be expressed as (Bloom, 1995; Dong et al., 2018; Murray, 1998):
Hence, based on the standard error formula provided in (S1), the MDESD regarding the standardized coefficient for a continuous Level 1 moderator, where 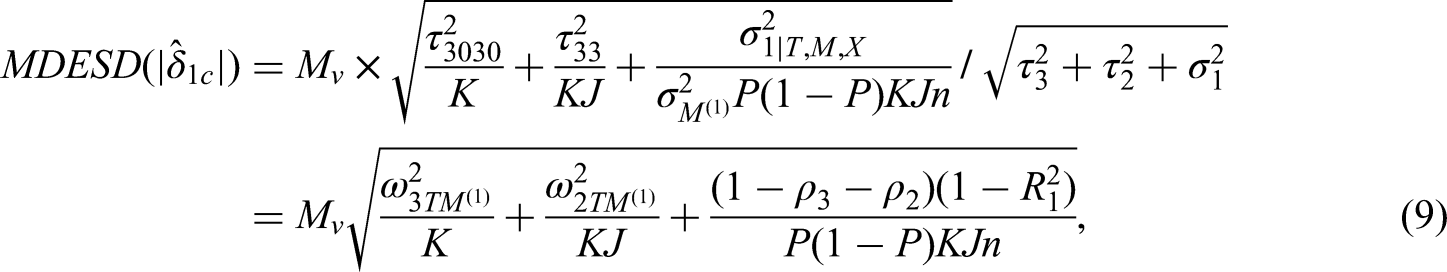
The 100*(1-α)% CI for 
Similarly, the MDESD regarding the standardized mean difference for a binary moderator is:
The 100*(1-α)% CI for 
Model MRT3-1RR-2 for a Level 2 Moderator
To test for Level 2 moderation, we use three-level random slope HLM (Raudenbush & Bryk, 2002):
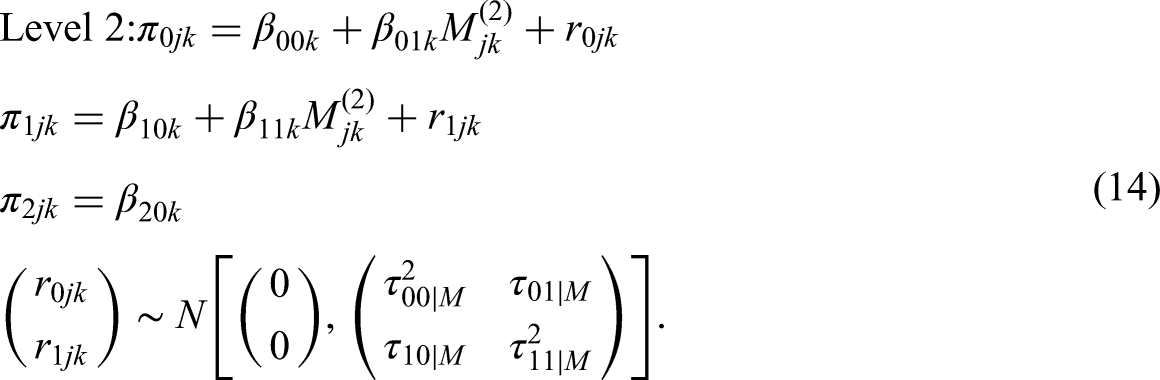
The combined model is:
Power Formulas
We test the moderation effect of teacher's years of teaching (
The unstandardized noncentrality parameter is defined as the ratio of the Level 2 moderator effect to its standard error. The standard error incorporates multiple sources of variability: the variance of the moderation effect across schools (


The statistical power for a two-sided test with the degrees of freedom of 
MDESD with CI
Based on the definition of MDESD in (8) and the standard error formulas in (S5) and (S7), we derive the MDESD for the standardized coefficient associated with a continuous Level 2 moderator, as well as the MDESD for the standardized mean difference associated with a binary moderator. The derivations and formulas for MDESD and their corresponding CIs are provided in the Supplement.
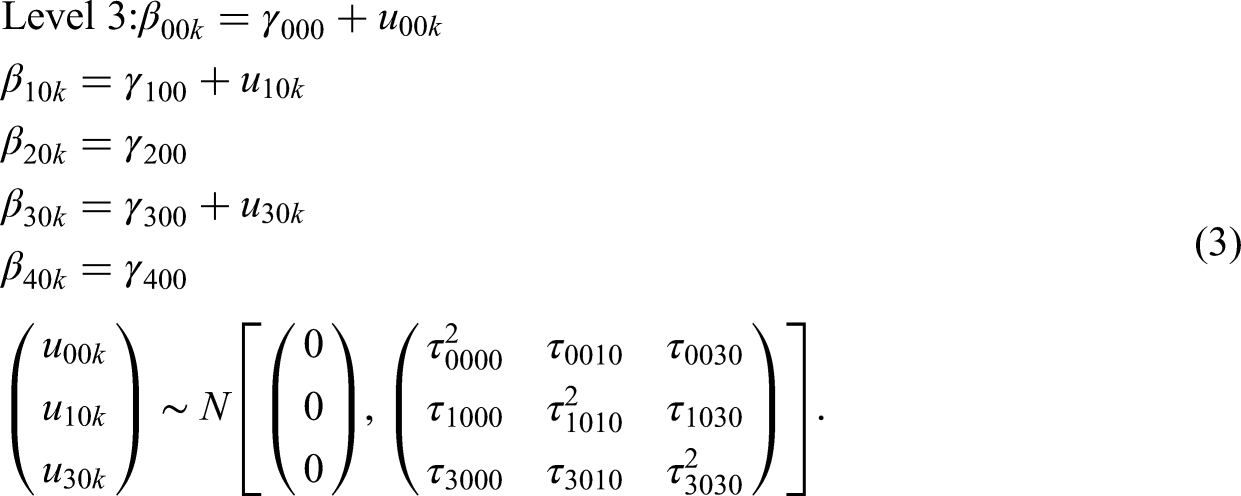
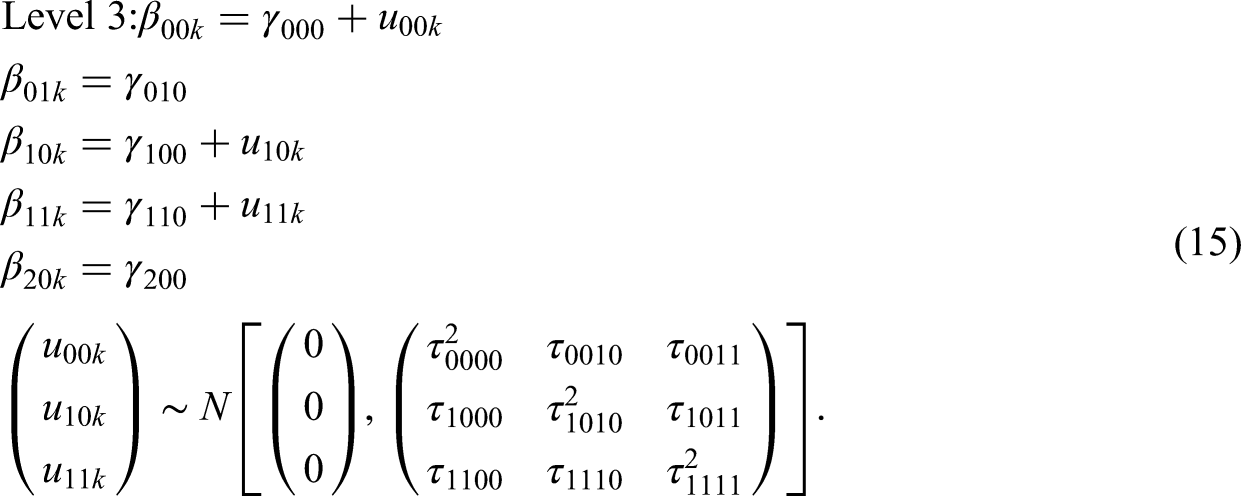
Model MRT3-1RR-3 for a Level 3 Moderator
To test Level 3 moderation, we use three-level random slope HLM (Raudenbush & Bryk, 2002):
The combined model is:
Power Formulas
We test the moderation effect of school size or urbanity (
The unstandardized noncentrality parameter is defined as the ratio of the Level 3 moderator effect to its standard error. The standard error incorporates multiple sources of variability: the variance of the treatment effect across schools without conditional on the moderator (


The statistical power for a two-sided test with the degrees of freedom of 
MDESD with CI
Based on the definition of MDESD in (8) and the standard error formulas in (S13) and (S15), we derive the MDESD for the standardized coefficient associated with a continuous Level 3 moderator and the MDESD for the standardized mean difference associated with a binary moderator. The derivations and formulas for MDESD and their corresponding CIs are provided in the Supplement.
The Other Models
We presented and explained the formulas for statistical power and the MDESD for three primary models with random slopes across both the classroom and school levels. In summary, the statistical power and the MDESD are primarily influenced by three sources of variability: the standardized effect variabilities of the moderation or treatment across schools and classrooms, and the residual variance at the student level.
For the models with the nonrandomly varying (or constant) slope, the power and MDESD formulas can be obtained by dropping the corresponding parameters that represent the variability of the moderation or treatment across that level of site in the random slope models. For example, consider Model MRT3-1NR-1, in which the moderation effect does not randomly vary across classrooms but does randomly vary across schools (see Tables 1 and 2). In this case, the standardized effect variability of the moderation across classrooms is 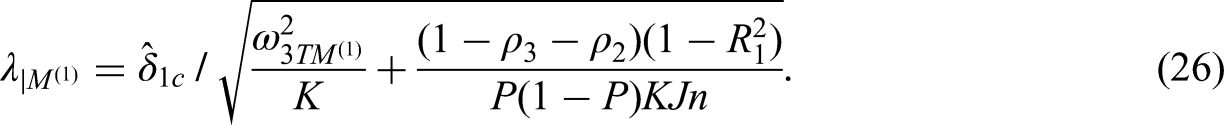
Similarly, for Model MRT3-1RN-1, the moderation effect does randomly vary across classrooms but does not randomly vary across schools. In this case, the standardized effect variability of the moderation across schools is
This approach also applies to models with Level-2 and Level-3 moderators. As a result, the formulas for statistical power and MDESD are identical across Models MRT3-1NN-1, MRT3-1NN-2, and MRT3-1NN-3, in which all standardized effect variabilities of the moderation (or treatment) across schools and classrooms are zero and thus dropped from the corresponding formulas in the random slopes models. For instance, the standardized noncentrality parameters for the continuous Level-1, Level-2, and Level-3 moderators are all equal to the moderator effect size divided by the same factor,
Monte Carlo Simulation
We conducted Monte Carlo simulations to validate the formulas for the standard error and power and to investigate how power/Type I error changes when one level of nesting (Levels 2 or 3) is ignored when the moderator is at Level 1.
The Procedures for the Monte Carlo Simulation
In the first step, we generated data using 12 HLMs in Table 2. For each model, we generated data for a continuous and a binary moderator separately, and with a zero and nonzero (0.20) moderator effect separately. Hence, there were 48 scenarios: 3 (levels of moderators) × 4 (random and nonrandom slope combinations) × 2 (scales of the moderator: continuous and binary) × 2 (nonzero and zero moderator effect). The parameters (
Furthermore, we conducted additional simulations to validate our formulas for the standard error and statistical power for a continuous moderator under more varied assumptions: (1) smaller sample size (K = 10, J = 4, n = 20); (2) non-negligible classroom-level variance, consistent with prior research (Jacob et al., 2010; Mulolli et al., 2025; Nye et al., 2004; Xu & Nichols, 2010), with classroom-level ICC (
In the second step, we used SAS PROC MIXED to analyze the data sets. We first used three-level HLMs for data analysis. We estimated unconditional ICCs at school and class levels using unconditional HLMs. We estimated the moderator effect, the standardized effect variability of the moderation across schools and classrooms (
Then, we used two-level HLM models for the Level 1 moderator analysis by ignoring classroom and schools, separately. When classrooms were ignored, the two-level HLM comprised students nested within schools; when the schools were ignored, the two-level HLM comprised students nested within classrooms and the total number of classrooms were K*J. We estimated the moderator effect, SE, and other parameters for the two-level MIRTs.
In the third step, the moderator effect was standardized to the standardized mean difference for the binary moderators or the standardized coefficient for the continuous moderators. A p-value of the moderator effect less than .05 was coded as a rejection of the null hypothesis of no moderation.
Lastly, we replicated the first three steps 2,000 times and calculated the means of the moderator effect size and the other parameters; The standard deviation of 2,000 moderator effect sizes served as the standard error estimate based on the empirical distribution of the moderator effect; We also calculated the standard error based on our formulas, and constructed the 95% CI for each point estimate. We then calculated the absolute difference and relative difference between the standard errors based on our formulas and from the empirical distribution. Furthermore, we calculated the coverage rate of the 95% CI as the percentage of the 95% CI based on our formulas covering the true moderator effect. The proportion of times the null was rejected across the 2,000 replications estimated the Type I error rate when the moderation effect was set to 0 and the empirical power when the moderation effect was not set as 0. We compared the power and Type I error rate calculated from our derived formulas with those estimated from simulation.
Simulation Results
Accuracy of Formulas for Standard Error and Statistical Power/Type I Error Rate
Tables 3–5 present the coverage rates of the 95% CI, statistical power, and Type I error rates from the main Monte Carlo simulations, alongside corresponding results from the analytical formulas for Level 1, Level 2, and Level 3 moderators, respectively. The results demonstrate strong agreement between the formula-based calculations and the empirical distributions obtained from the simulations. For example, across all scenarios, the absolute and relative differences between the standard errors derived from simulations and those calculated using our formulas range from −0.009 to 0.004 and from −12.0% to 4.6%, respectively. The coverage rates of the 95% CIs range from 0.92 to 0.97. The absolute differences between the Type I error rates from the formulas and those estimated from simulations range from −0.008 to 0.011. Similarly, the absolute differences in power estimates between the formulas and simulations range from 0.013 to 0.076.
Coverage of 95% CI and Power (Type I Error Rate) from Monte Carlo Simulation and the Formulas for Level-1 Moderator.
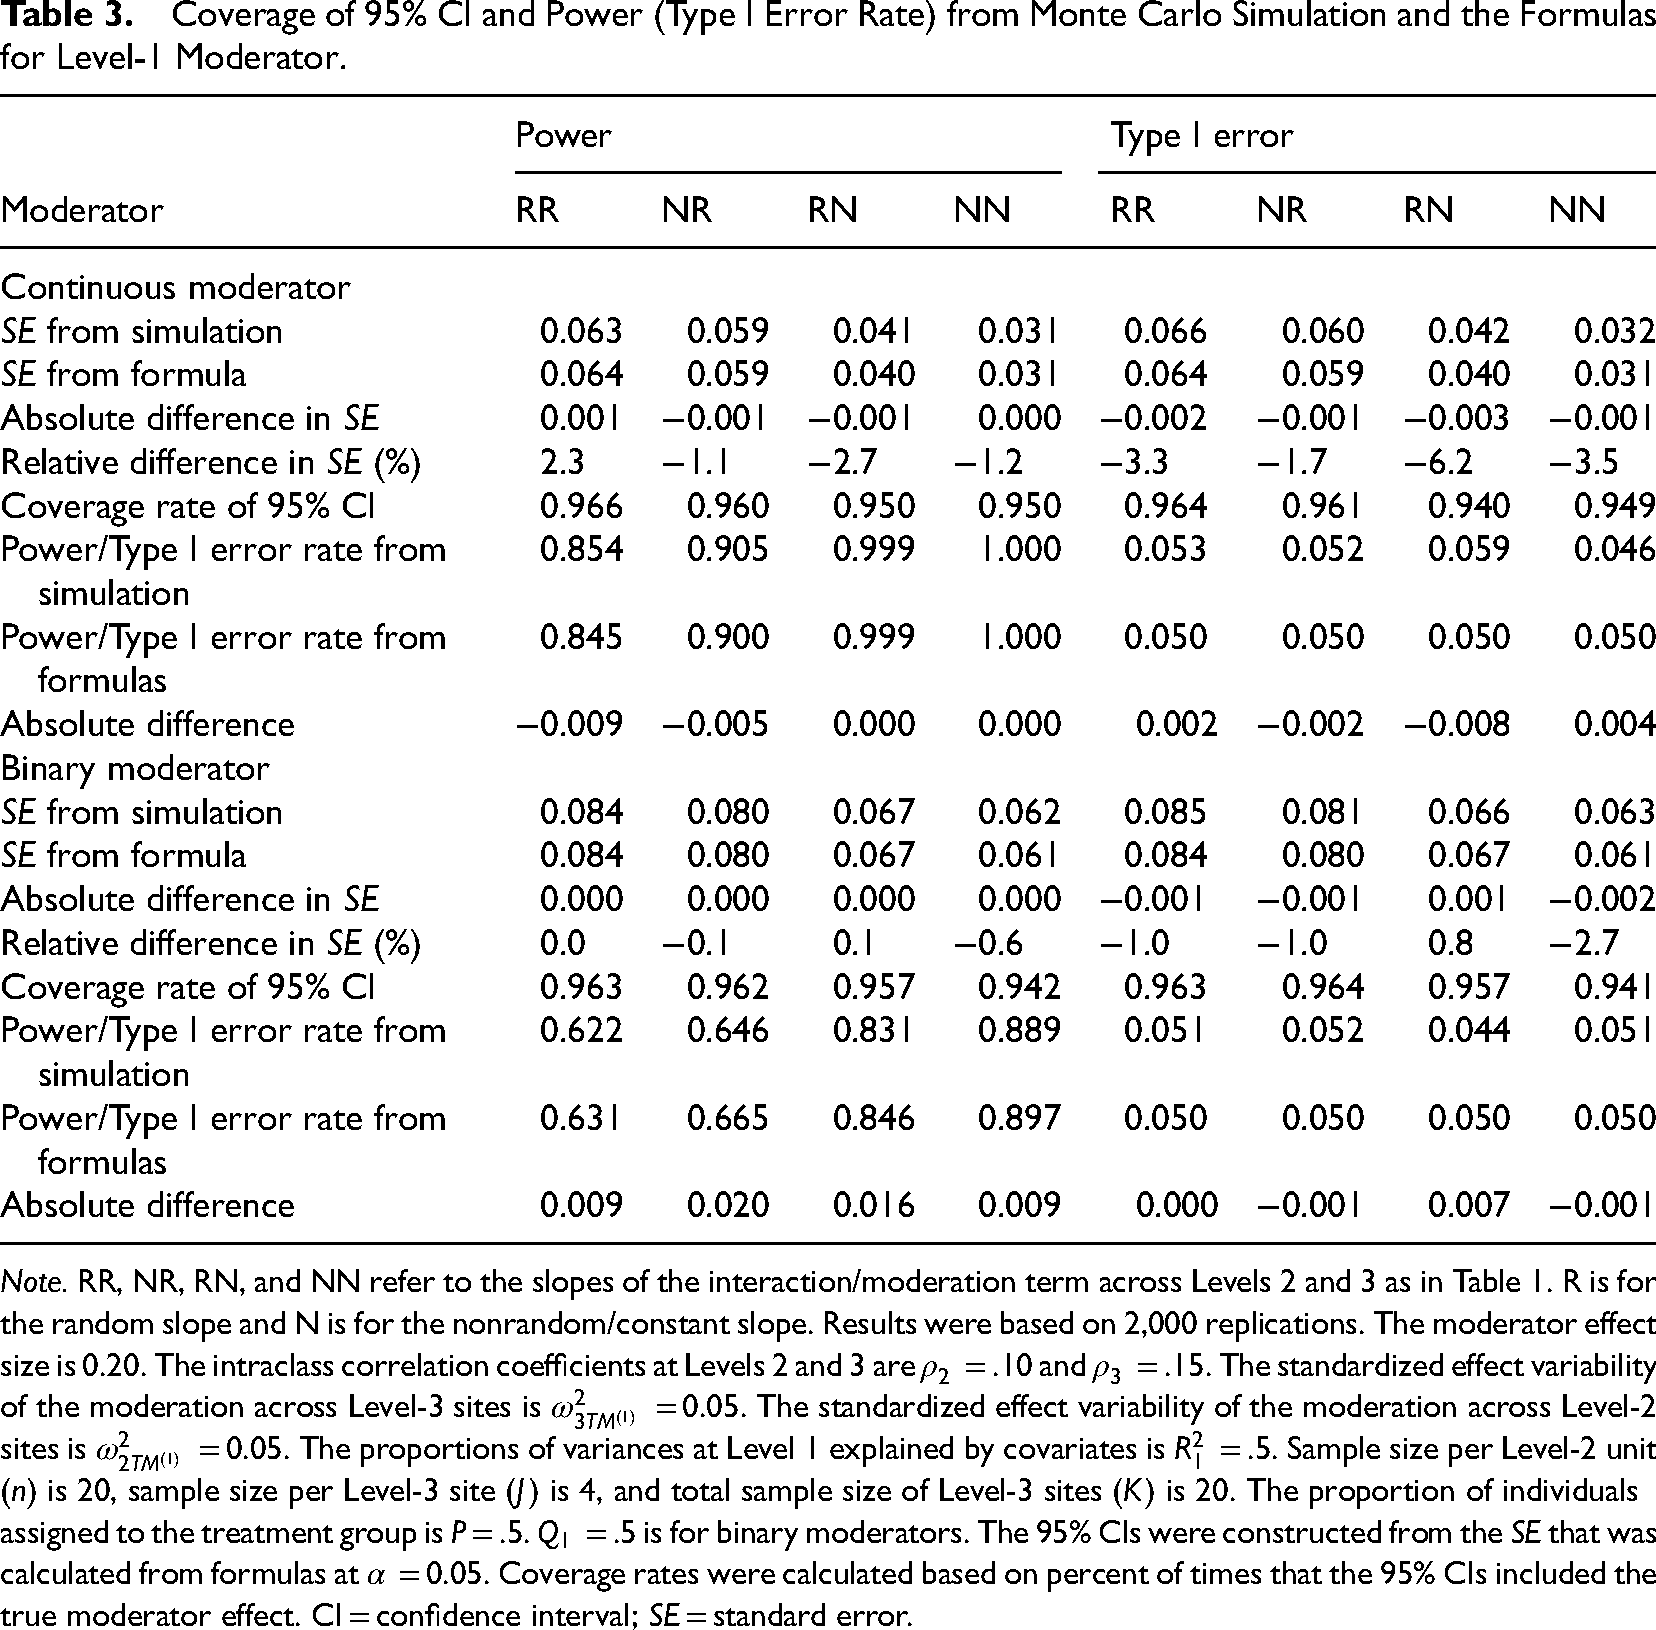
Note. RR, NR, RN, and NN refer to the slopes of the interaction/moderation term across Levels 2 and 3 as in Table 1. R is for the random slope and N is for the nonrandom/constant slope. Results were based on 2,000 replications. The moderator effect size is 0.20. The intraclass correlation coefficients at Levels 2 and 3 are
Coverage of 95% CI and Power (Type I Error Rate) from Monte Carlo Simulation and the Formulas for Level-2 Moderator.
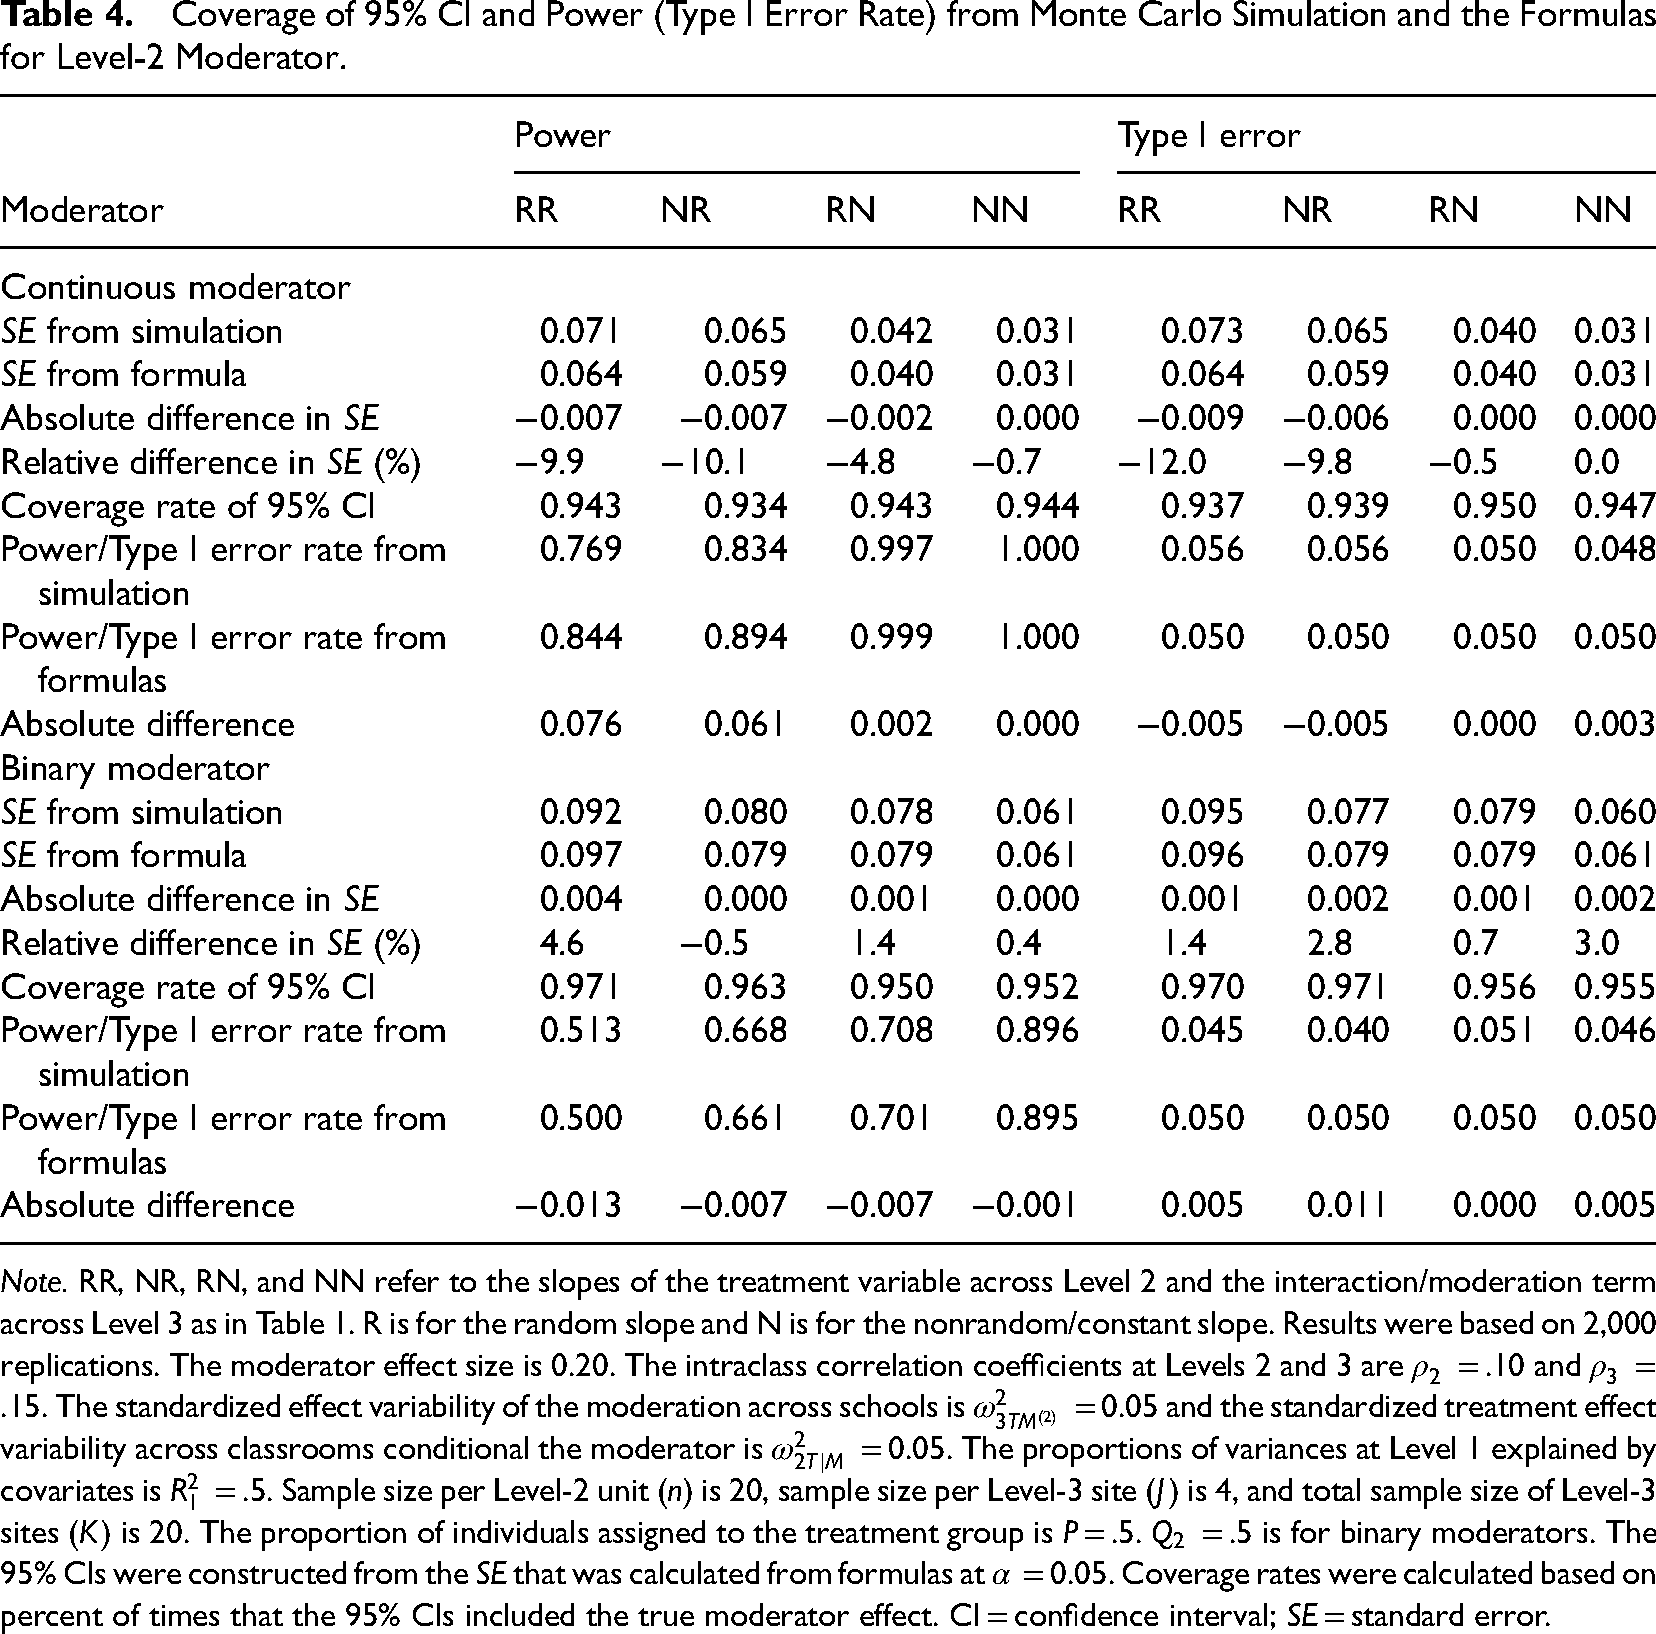
Note. RR, NR, RN, and NN refer to the slopes of the treatment variable across Level 2 and the interaction/moderation term across Level 3 as in Table 1. R is for the random slope and N is for the nonrandom/constant slope. Results were based on 2,000 replications. The moderator effect size is 0.20. The intraclass correlation coefficients at Levels 2 and 3 are
Coverage of 95% CI and Power (Type I Error Rate) from Monte Carlo Simulation and the Formulas for Level-3 Moderator.
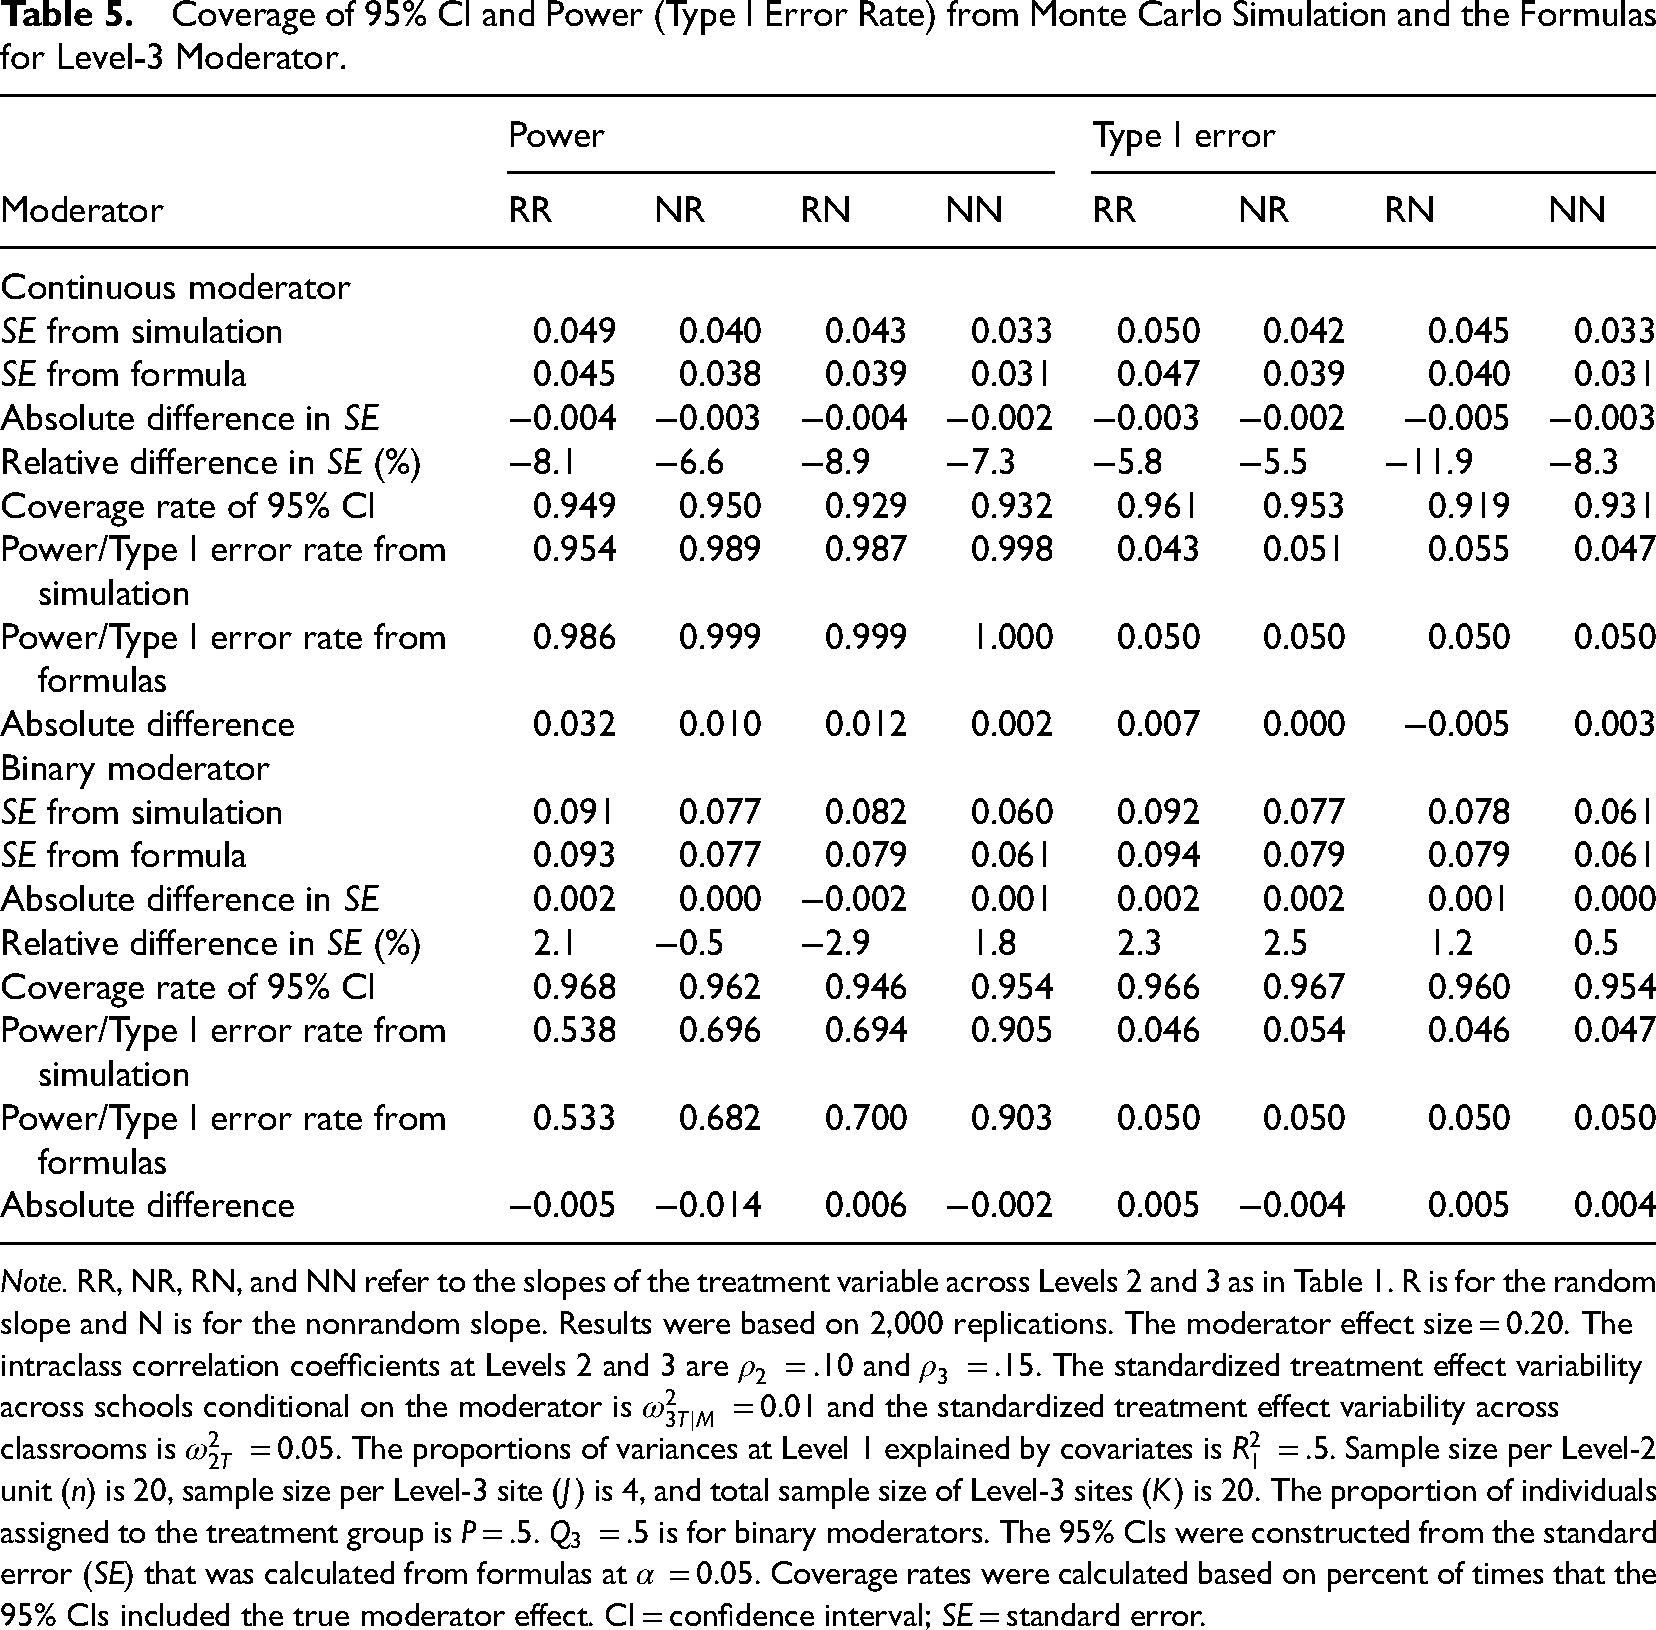
Note. RR, NR, RN, and NN refer to the slopes of the treatment variable across Levels 2 and 3 as in Table 1. R is for the random slope and N is for the nonrandom slope. Results were based on 2,000 replications. The moderator effect size = 0.20. The intraclass correlation coefficients at Levels 2 and 3 are
In addition, Table S2 reports results from supplementary simulation conditions designed to further evaluate the accuracy of our formulas. Specifically, we examined scenarios with classroom-level ICCs larger than school-level ICCs, greater effect variability, and smaller sample sizes. The findings under these alternative conditions are consistent with those from the main simulations.
Consequence for One Level of Nesting (Level 2 or 3) Ignored
When either classrooms or schools were ignored, two-level HLMs for a Level 1 moderator analysis still produced unbiased point estimates of the moderator effect. However, ignoring schools (using a two-level HLM with students nested in classrooms) led to underestimated standard errors (0.047), with an absolute bias of −0.016 and a relative bias of −25.4% compared to the standard error (0.063) from the simulation. In contrast, ignoring classrooms (using a two-level HLM with students nested in schools) produced standard errors nearly identical to those from the simulation and the three-level HLM.
As a result, the Type I error rate was inflated when schools were ignored (0.152 vs. 0.05), while ignoring classrooms had a negligible impact on Type I error rates (0.049 vs. 0.05). Furthermore, the statistical power calculated from formulas based on the two-level model ignoring schools was overestimated, with an absolute bias of 0.136 and relative bias of 15.9%. By comparison, power estimates from the two-level model ignoring classrooms closely matched both the simulation results and the three-level HLM model (Table 6).
SE and Power in Mis-Specified Models for the Analysis of the Moderated Treatment Effect of a Level-1 Continuous Moderator.
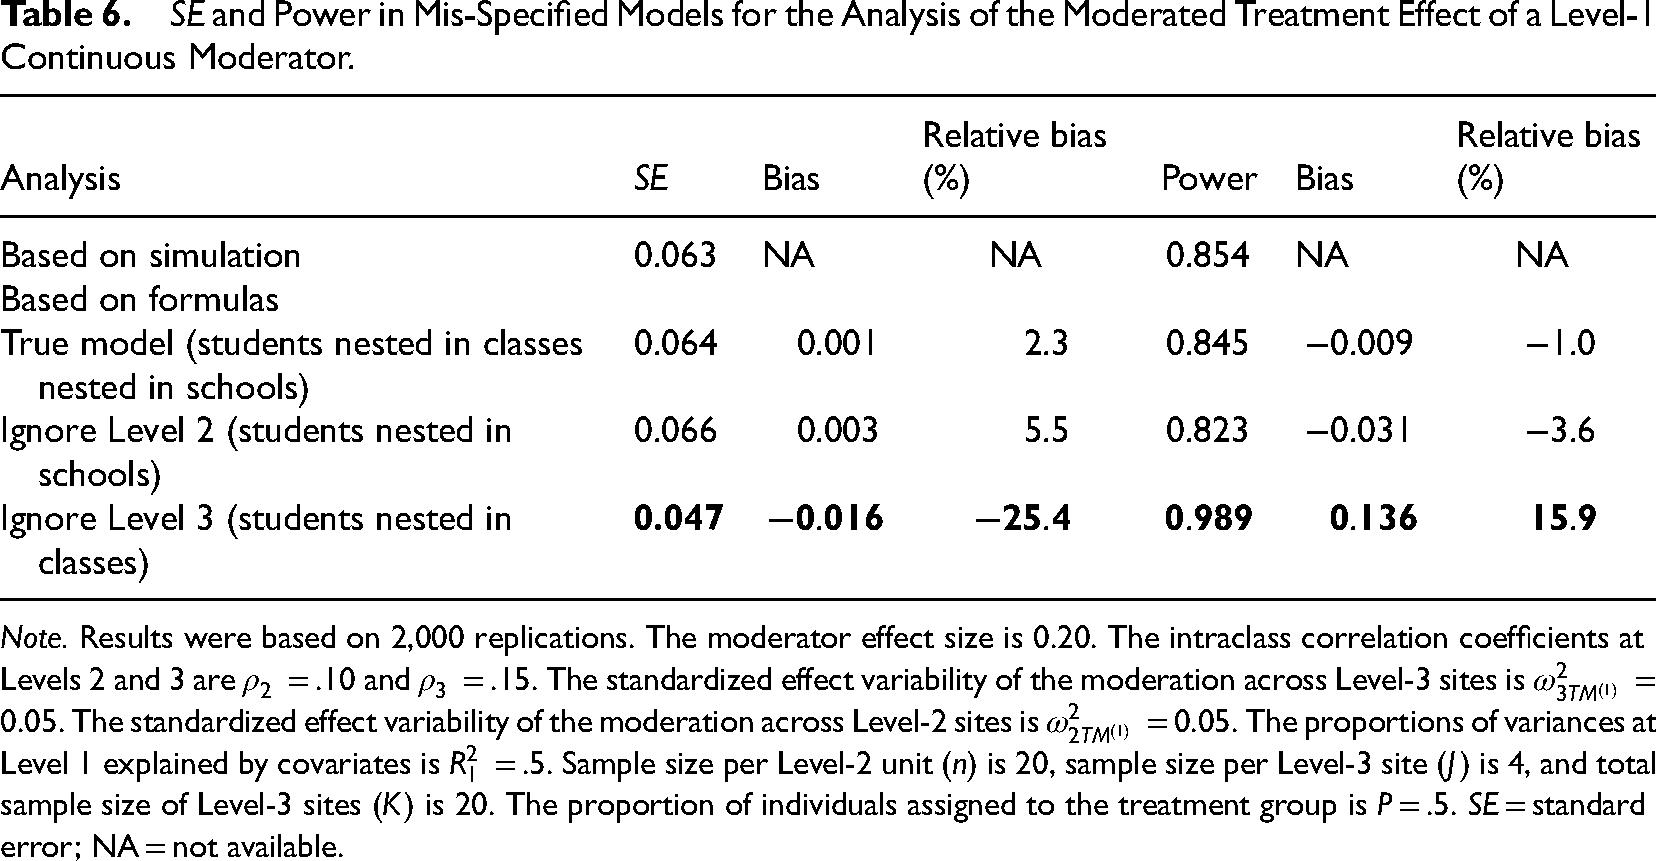
Note. Results were based on 2,000 replications. The moderator effect size is 0.20. The intraclass correlation coefficients at Levels 2 and 3 are
The simulation results also revealed that ignoring one level of nesting shifted variance components. When schools were ignored, the variance at the school level would be shifted to the new top level (classroom) (Moerbeek, 2004; Van den Noortgate et al., 2005). As a result, the classroom-level ICC rose to .24, close to the sum of Level 2 and Level 3 ICCs in the true model (
Conversely, when classrooms were ignored, the unconditional ICC (
The findings under the supplementary simulation conditions are consistent with those from the main simulations (Tables S3 and S4).
Software Demonstration
We implemented the formulas in Microsoft Excel to develop PowerUp!-Moderator-MRTs, a tool for calculating statistical power and MDESD for moderation analysis in MRTs. Similar to power analysis procedures for moderation in two-level MRTs and three-level CRTs and MCRTs (Dong et al., 2018, 2021a, 2024a; Spybrook et al., 2016), researchers first identify the moderator of interest (binary or continuous) and its level (1, 2, or 3). They can then select the appropriate module for either MDESD or statistical power calculations based on their study design.
Within each module, users input key design parameters, such as ICCs. Guidance for selecting these parameters is available in the literature (e.g., Bloom et al., 2007; Dong et al., 2016, 2024b; Hedges & Hedberg, 2007, 2013; Jacob et al., 2010; Kelcey & Phelps, 2013; Kelcey et al., 2016; Mulolli et al., 2025; Shen et al., 2023; Spybrook et al., 2016; Westine et al., 2013). Each module accommodates both random and non-random slope models. For non-random slope models, the effect size variability is set to zero. Once the parameters are entered, the MDESD and its 95% CI, or the statistical power, is automatically calculated. Users can adjust sample sizes to achieve the desired MDESD or power.
For example, Figure 1 shows the module for calculating MDESD for a Level-1 binary moderator (e.g., sex) effect with random slopes across both schools and classrooms. We used typical assumptions for power analysis with a Type I error rate of 0.05 for a two-tailed test with a power of 0.80. In addition, we chose ICCs at classrooms and schools:
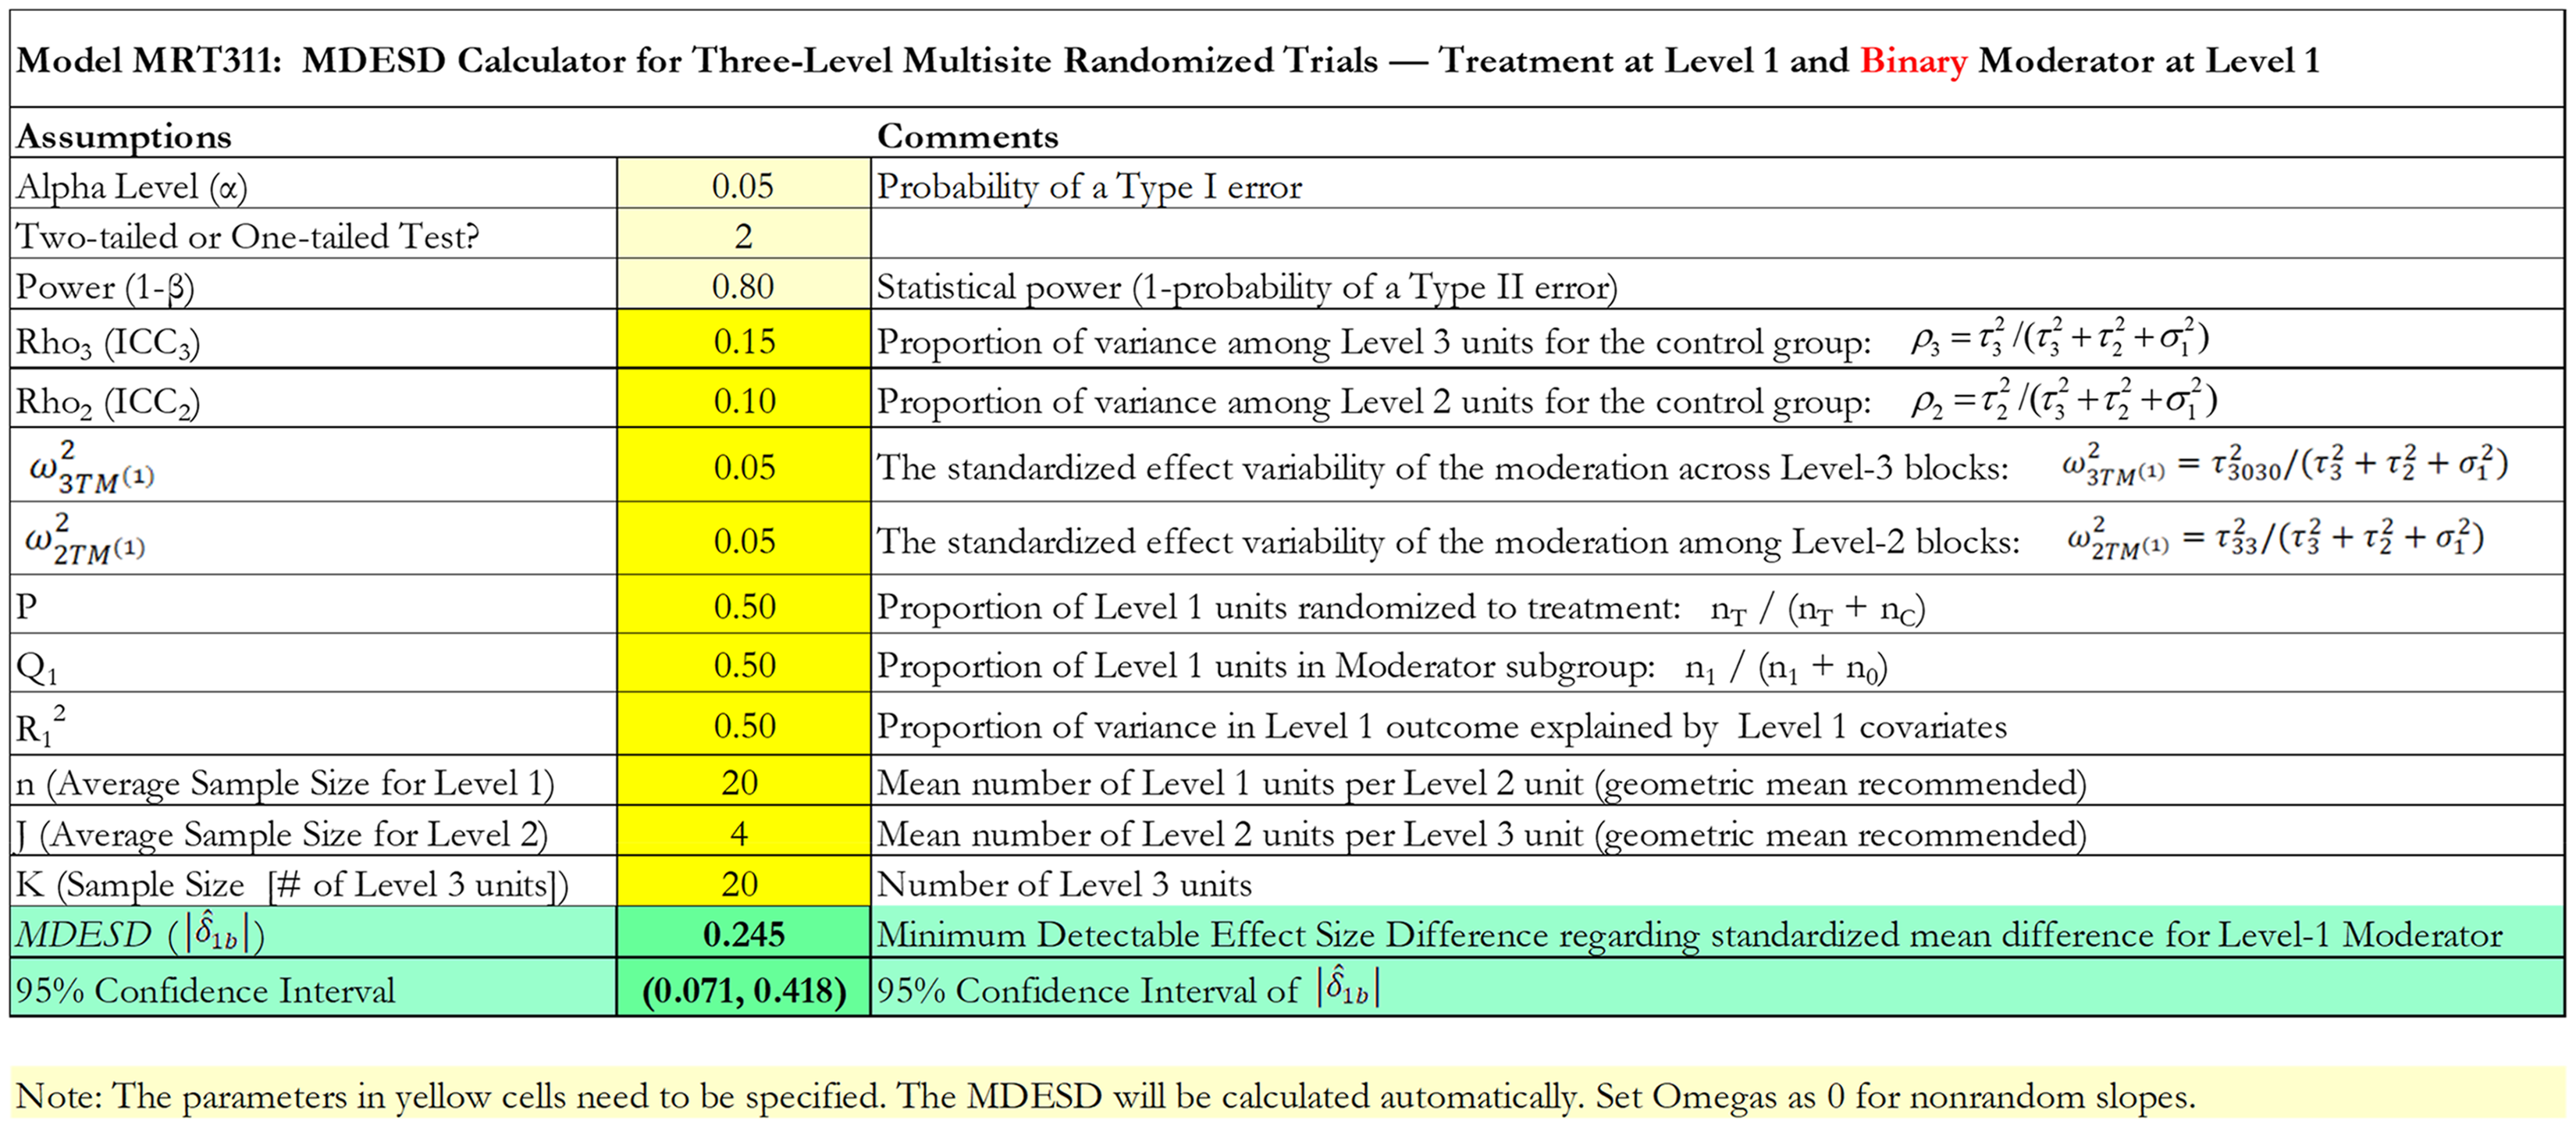
MDESD Calculator for Three-Level MIRTs—Treatment at Level 1 and Binary Moderator at Level 1.
Furthermore, Figure S1 shows the module for calculating statistical power for a Level 1 continuous moderator (e.g., pretest), Figure S2 shows the module for calculating MDESD for a Level 2 continuous moderator (e.g., years of teaching), and Figure S3 shows the module for calculating statistical power for a Level 3 binary moderator (e.g., urbanity).
Conclusion
This study investigates formulas for calculating the MDESD and statistical power for moderation effects in three-level MIRTs. Monte Carlo simulations confirm the accuracy of these formulas and examine the consequences of ignoring one level of nesting for Level 1 moderation. A software tool was developed to implement these formulas in Microsoft Excel.
Based on our formulas (Table 2 and Table S1), we draw the following conclusions:
First, statistical power increases (and MDESD decreases) with larger sample sizes at each level (K, J, and n), as is typically expected in power analyses, because larger sample sizes enlarge the standardized noncentrality parameters. Consistent with findings from two-level MIRTs (Dong et al., 2021a, 2021b) and three-level MCRTs (Dong et al., 2024a, 2024b), sample sizes at higher levels are generally more influential in random slope models, while in nonrandom slope models, lower-level sample sizes can be equally important.
Second, statistical power decreases (and MDESD increases) as the standardized variability of treatment and moderation effects increases, because greater variability reduces the standardized noncentrality parameters. Power and MDESD reach their optimal values when these variabilities are zero (i.e., in nonrandom slope models), regardless of whether the moderator is at Level 1, 2, or 3. Hence, when conducting power analyses for moderation in three-level MIRTs, it is advisable to assume random effects in the absence of clear theoretical justification or prior evidence indicating fixed (non-random) variation in treatment or moderation effects (Dong et al., 2021a, 2021b).
Third, as in two-level MIRTs (Dong et al., 2021a, 2021b), statistical power increases with higher ICCs at Level-2 and Level-3 sites, because greater site-level variance reduces the Level-1 variance and thereby enlarges the standardized noncentrality parameters.
Fourth, power increases with higher proportions of Level-1 variance explained by covariates (
Fifth, statistical power increase (and MDESD reduces) when the allocation proportions to the treatment group (P) and moderator subgroups (
Sixth, because the treatment variable is assigned at Level 1 in three-level MIRTs, statistical power is generally higher than in three-level MCRTs and CRTs under comparable assumptions (e.g., sample sizes and design parameters). For example, detecting a meaningful moderation effect for a school-level moderator in three-level CRT often requires very large sample sizes (Dong et al., 2018; Spybrook et al., 2016), and similar limitations apply to three-level MCRTs (Dong et al., 2024a). In contrast, three-level MIRTs can achieve adequate statistical power for detecting school-level moderation effects with a more modest sample size. This is because a Level-3 moderator in three-level MIRTs functions analogously to a Level-1 moderator in three-level CRTs, conditions under which power is typically higher than for detecting main effect analysis in three-level CRTs (Dong et al., 2018; Spybrook et al., 2016).
Finally, based on our simulation results, we can conclude that ignoring Level 2 nesting has minimal impact on the standard error or power for Level 1 moderator effects. However, ignoring Level 3 nesting leads to underestimated standard errors, inflated Type I error rates, and overestimated power for Level 1 moderator effects. This result aligns with findings in the literature on main effect estimates when nesting structures are overlooked (Bulus & Dong, 2022; Moerbeek, 2004; Opdenakker & Van Damme, 2000; Van den Noortgate et al., 2005; Zhu et al., 2011).
This study focuses on Level 1 moderator effects when either Level 2 or Level 3 nesting is ignored in three-level MIRTs. Future research could extend this work by examining the impact of omitting a level of nesting on other types of moderation effects—for example, assessing Level 2 moderator effects after ignoring Level 3 nesting, or Level 3 moderator effects after ignoring Level 2 nesting.
Supplemental Material
sj-docx-1-aje-10.1177_10982140251394304 - Supplemental material for Statistical Power for Moderation in Three-Level Multisite Individual Randomized Trials and Consequences of Ignoring a Level of Nesting
Supplemental material, sj-docx-1-aje-10.1177_10982140251394304 for Statistical Power for Moderation in Three-Level Multisite Individual Randomized Trials and Consequences of Ignoring a Level of Nesting by Nianbo Dong, Ben Kelcey, Jessaca Spybrook, Kyle Nickodem and Ning Sui in American Journal of Evaluation
Footnotes
Funding
This project is supported by the National Science Foundation [1913563]. The opinions expressed herein are those of the authors and not the funding agency.
Declaration of Conflicting Interests
The authors declared no potential conflicts of interest with respect to the research, authorship, and/or publication of this article.
Supplemental Material
Supplemental material for this article is available online.
References
Supplementary Material
Please find the following supplemental material available below.
For Open Access articles published under a Creative Commons License, all supplemental material carries the same license as the article it is associated with.
For non-Open Access articles published, all supplemental material carries a non-exclusive license, and permission requests for re-use of supplemental material or any part of supplemental material shall be sent directly to the copyright owner as specified in the copyright notice associated with the article.