
Abstract
This study constructed hotel demand curves at the disaggregate level to uncover the heterogeneity of demand curves across consumers and during both normal periods and times of crisis, exemplified by the pandemic. The novel demand modeling technique fits nonlinear demand curves, parameterizes elasticity dynamics, and enables the comparison of demand curves by essential value. The demand curves for three hotel types in normal and pandemic situations were fitted and decomposed by consumers’ socio-demographics, preferences, and risk tolerance. A pandemic made the demand curve for midscale (upscale) hotels more inelastic (elastic) and mitigates (amplifies) the influence of individual differences on the demand curve, whereas the demand curve for economy hotels was unaffected by a pandemic. The findings offer insights into the business operations of different hotels, including optimal pricing, customized marketing across consumer segments, and business strategies in case of a health crisis.
Highlights
The dynamics of elasticity along a complete demand curve are parameterized.
Demand curves are heterogeneous across consumers and contexts.
The pandemic affects the demand curves for different hotels to various extents.
Introduction
Building on neoclassical economic demand theory, the existing econometric demand models in hospitality and tourism studies have concentrated on analyzing market demand using aggregate data. These methods are underpinned by the theoretical assumptions that the market demand curve is the horizontal summation of individual demand curves, where individuals are mathematically regarded as homogeneous entities. Although the hospitality and tourism literature on consumer behavior has explored the salient role of sociodemographic factors in shaping tourists’ preferences (N. Chen et al., 2019), the fitting of demand curves has not been disaggregated to consider consumer characteristics. The estimates of quantity demanded and elasticity coefficients using the existing econometric demand models represent average levels only, while the possible heterogeneity across individual demand curves stemming from individual differences has been overlooked.
Moreover, the contextual dependence of the shape of the demand curve has been neglected in the existing modeling practices despite the findings that many environmental factors are significant in altering consumers’ decisions. In particular, various societal disruptions could break the typical/long-term economic trends in the hospitality and tourism industry, which it is hard to capture well in time-series models. The past COVID-19 pandemic is the most memorable one. As a health crisis causing unprecedented public health responses (in terms of lockdowns and social distancing and stimulating novel consumer behaviors; Kim et al., 2022), this pandemic is a potent example to study the dynamic shifts in demand patterns amid an abrupt change in the consumption situation. While researchers have made significant progress in using existing demand modeling techniques to describe its impact (Zhang & Lu, 2022), examining the resulting distortion of the demand curves of different consumers remains an intriguing topic.
In addition, due to the modeling of incomplete demand curves, the estimation and interpretation of demand elasticity along the demand curve have been restricted to a single elasticity value at the average price, which is insufficient to describe the real economy as the elasticity of demand mainly increases with price (Perloff, 2018). Understanding elasticity dynamics along a complete demand curve can help establish the linkages between price, demand, and revenue, and provide implications for cost-related business strategies or public policies. Thus, a novel econometric demand model is required to properly parameterize the elasticity dynamics along the demand curve and depict the demand curves of various consumers and contexts. This will comprehensively reveal consumers’ changing cost-benefit evaluations and the heterogeneity of demand curves at the disaggregate level.
An innovative demand framework originating from the behavioral branch of behavioral economics (BE) provides a promising solution to fitting complete demand curves at the disaggregate level. There are two branches of research within BE: the cognitive branch, which investigates the cognitive biases in decision-making, and the behavioral branch, which examines the environmental influences on behavior (Hursh & Roma, 2013). The cognitive branch helps explain the mental processes that influence decision-making. However, it may be difficult to generalize the results of cognitive studies and predict the demand because the theoretical framework underpinning the cognitive branch of research is based on the point estimation of choices and decisions. Therefore, any explored demand pattern is described in a discrete and contingent mode but cannot be well integrated into a universally applicable demand function.
In contrast to the prevalent applications of “cognitive” BE in hospitality and tourism research (e.g., prospect theory [Kahneman & Tversky, 1979]), “behavioral” BE has received little attention. Still, it is more relevant to the issues above in hospitality and tourism demand modeling. First, because the behavioral branch comprehends individual behavior (e.g., consumption) as the consequence of reinforcement by the presence of a specific stimulus (e.g., a product that the consumer values), it stresses the distinctions between individual behaviors caused by different personal valuations and environmental influences. Second, the behavioral branch is based on demand curve analysis to establish an exponential functional relationship between price and demand with a focus on dynamic elasticity, and it enables the fitting of demand curves at any disaggregate level, such as individual demand curves and group demand curves. Song and Lin (2023) first introduced “behavioral” BE and its research methodology to the hospitality and tourism field and developed a new conceptual framework for demand modeling at the disaggregate level. However, no empirical study has been conducted to test the framework.
Therefore, this study aimed to demonstrate the BE approach to hospitality and tourism demand modeling and to quantitatively capture the influence of individual differences and environmental factors on demand curves. The hotel sector in China was selected as the empirical research context to demonstrate the methodology, with three hotel types subjected to demand modeling. The specific environmental factor analyzed was the consumption situation, which we classified as a “normal” or a “pandemic” situation. Using COVID-19 as a case context, this study was designed to demonstrate the broader applicability of the proposed approach during times of societal disruption and crises, such as future pandemics, political instability, or other impactful events. This approach provides a valuable tool for the hospitality and tourism industry to respond to shifts in consumer behavior and implement crisis-mode operations amidst instability. Individuals’ demand data were collected and segmented by the consumption situation and individual differences, and group demand curves were fitted and compared accordingly.
This is one of the first empirical studies to uncover the heterogeneity of hotel demand curves across consumers and contexts. The innovative methodology has two significant advantages over traditional econometric methods. First, it allows the fitting of independent demand curves based on any characteristic variable of interest, thereby giving a more realistic and accurate estimation of the demand of different consumers. Second, the proposed methodology expands the construction of demand curves to a full price range, over which demand elasticity analysis is a dynamic process. The model, therefore, describes the interrelationship between price, demand, and revenue and can be used to derive the optimal pricing point. The study also provides insights into hotel business strategies for different hotel types and market situations.
Literature Review
Demand Curve Modeling in Tourism Economics Research
Tourism economics research on demand curve modeling has primarily concentrated on analyzing the effects of demand determinants and forecasting future trends (Song et al., 2009). The vast majority of the currently applied econometric demand models have fitted the market demand curve, which is the summation of the individual demand curves of all the market consumers. According to neoclassical microeconomic demand theory, an individual demand curve is formed by a consumer’s optimal choices given their personal preferences and budget constraints. Thus, a market demand curve assumes utility maximization at the individual level and is modeled as the sum of the individual demand of many identical “representative consumers” with statistically average indicators (Thomas, 1985). With this theoretical underpinning, most hospitality and tourism demand modeling studies have been based on aggregate data and have treated the market as a homogeneous group (Qiu et al., 2020). Individual differences, such as age, gender, and income, have been indexed to market average values or proportions and used as explanatory variables to model the market demand curve and estimate their effects on average market demand (Aguilar & Díaz, 2019).
Little research has been conducted to construct disaggregate demand curves by segregating the market demand data based on consumer characteristics to identify the heterogeneity of those demand curves within individual consumers or consumer segments. The individual/group demand curves are likely to be notably different from each other instead of identical in shape and parameters as estimated before, as consumers allocate varying budgets and have distinct personal preferences for a particular product because of their sociodemographic characteristics (Barbieri & Mahoney, 2010) and past experiences (Masiero & Qiu, 2018). However, when integrating individual differences into the econometric demand models, researchers have yet to focus on the segmentation of consumers based on personal characteristics and its significant influence on the shape of the demand curve at the disaggregate level. The demand heterogeneity across consumer groups has been explored only concerning consumer utility, which has been modeled using discrete choice techniques to explain an individual’s or a group’s choice from alternatives (Kemperman, 2021).
Although choice and demand are intuitively similar and considered part of the demand analysis, they are essentially disparate concepts expressed in different mathematical terms in the modeling processes (utility value vs. quantity demanded). Therefore, although discrete choice models have been used to analyze choices at the individual level, the derived results cannot be regarded as equivalent to the demand curve of the same individual for the chosen product, nor can any direct statistical comparisons be made between the parameters of a choice model and those of an econometric demand model. The demand curves of heterogeneous consumer groups have yet to be directly modeled, although such demand models would produce useful economic information, such as elasticities, revenue, and demand forecasts.
Moreover, consumers’ demand curves are likely to be influenced by environmental changes, especially during a pandemic. This argument is bolstered by the observed asymmetric demand pattern throughout a business cycle, with mismatched elasticities between fast- and slow-growth periods (Smeral, 2018). Nevertheless, there have been few studies in hospitality and tourism research to explicitly examine how environmental factors such as COVID-19 and other pandemics or crises would affect the shape of the entire demand curve, given that most of the relevant studies have paid attention to the temporary dropped demand only (He et al., 2022).
Another area for improvement is that traditional econometric demand models generally construct incomplete demand curves, which yield merely point estimation of quantity demanded and demand elasticity at around the market average price. In contrast, the complete shape of a demand curve and the decay of demand over the entire price range have yet to be thoroughly investigated. Constructed over a very narrow price range, the hotel/tourism demand curves have seemed to be sufficiently fitted as logarithmically linear forms with constant price elasticity (Song et al., 2019). Even when a dynamic elasticity parameter is functionally allowed, researchers tend to calculate the elasticity coefficient at the average price; otherwise, there would have been a series of statistically inconsequential elasticity coefficients at various price points. As a result, the shape of the demand curve has not been successfully linked up with the shape of the total revenue curve to reflect the pricing strategy.
However, economists widely believe that the elasticity of demand increases with price on most demand curves (Perloff, 2018), implying that the complete demand curve is nonlinear on the logarithmic coordinates. Thus, it is necessary to improve the demand modeling methodology to construct complete demand curves over the entire price range and parameterize the elasticity dynamics along the demand curve. In this way, we can get a full image of the shape of a demand curve at all price points, efficiently describe the demand curve using parameters, and ultimately establish the linkages between price, demand, and revenue to make more informed economic decisions.
BE Demand Curve Analysis
We used a BE approach in this study to address the above-mentioned problems and model demand curves at the disaggregate level. This approach is not based on the branch of BE popular in the social sciences, which introduces cognitive psychology to economics to explore how humans’ cognitive biases affect their rational decision-making. It is known as “cognitive” BE. The branch relevant to this study is “behavioral” BE (Song & Lin, 2023). In contrast to cognitive BE, behavioral BE originates from the introduction of economic theories to operant psychology to quantify the operant behavior of humans and animals, giving answers to how the operant conditioning—that is, the presence or removal of a positive/negative stimulus acting as a reinforcer or punisher—shapes and modifies behavior. This branch is less widely known, as discussion of it has generally been limited to the field of behavioral psychology.
Apart from the different focuses (cognitive biases vs. environmental influences), the behavioral branch has a critical advantage over the cognitive branch in exploring demand heterogeneity at the disaggregate level. In contrast with the point estimation of discrete and contingent choices in cognitive BE, behavioral BE has developed a demand model to specify the continuous functional relationship between demand and its determinants, giving its empirical results greater descriptive power and more straightforward implications for mass economic activities than the cognitive branch. The dynamics of elasticity are parameterized in the model to reflect consumers’ cost-benefit evaluations, and are applied as an indicator to interpret and compare the demand curves. Consequently, the demand heterogeneity can be precisely quantified and systematized within one quantitative framework.
In behavioral BE, economic goods are likened to reinforcers of consumption behavior, and the strength of reinforcement against costs reflects the value of goods. Behaviorists have used demand curves to describe the interaction between costs and reinforcement and the scale of the reinforcing efficacy. A complete demand curve is mapped by two fundamental parameters: demand intensity (the demand at zero price,
Estimating demand elasticity as a single coefficient is insufficient. However, this practice has been common in hospitality and tourism demand studies because researchers prefer the double-log functional form (Song & Lin, 2010) or the average of point elasticities to cover much information in one parameter statistically (Li et al., 2006). BE demand models overcome this problem by employing one parameter (
The hypothetical purchase task (HPT) has been a prominent data collection method in behavioral BE. Data collected by HPTs provide a range of sensitive and instructive measurements for assessing the value of goods, and the drive of consumption. The advantages of HPTs lie in their flexibility in manipulating various consumption scenarios to explore the impacts of external stimuli on demand curves (Gentile et al., 2012) at different levels of aggregation: individual, group, market, and population. It is instrumental when the direct measurement of actual demand in laboratory settings or real-world markets is impractical or unethical (Roma et al., 2016). In an HPT, participants are asked to state their demand at a wide range of predetermined price points in a particular scenario, and under certain assumptions and restrictions. Demand can be measured in terms of both quantity and probability, depending on how frequently the goods are purchased in everyday life. Many relevant studies have applied the probability format (Reed et al., 2016). It has been proven equally suitable and informative for analyzing demand curves as the quantity format, although it tends to yield higher BE value measures (Roma et al., 2016).
Unlike conventional post-market economic demand curves (Oliveira-Castro et al., 2011), HPTs inherently do not track actual consumption. Despite this limitation and potential hypothetical biases, they have demonstrated remarkable validity and reliability (Murphy et al., 2009), supported by their sensitivity to demand-altering factors (McClure et al., 2013), temporal stability verified by significant test–retest reliability (Few et al., 2012), and the significant correlations with self-reported actual behavior (Bruner & Johnson, 2014). HPTs can be applied to study diverse economic questions in specific consumption scenarios as long as demand and cost are quantifiable. Therefore, HPT data are the best alternative to secondary demand data for demand curve modeling, given the deficiency of individual data over a wide price range. Although BE demand models and HPTs have been used primarily to examine addictive behaviors (Kaplan et al., 2018), they have also been used effectively to analyze demand for various generic goods, such as chocolate (Chase et al., 2013), air-flight Internet access (Broadbent & Dakki, 2015) and snack foods (Epstein et al., 2010). However, using the BE approach for demand modeling has remained in its infancy in many research fields.
The present study is one of the first attempts to analyze hotel demand using the BE approach. This approach enables econometric demand modeling at the disaggregate level to quantify the heterogeneity of demand curves across consumers and contexts. Consumers are not regarded as homogeneous entities but as heterogeneous groups in terms of individual differences to fit group demand curves over the entire price range. In addition, this study examines to what extent a major environmental factor influences consumers’ consumption decisions and reshapes group demand curves. Integrating an experimental design, demand curves, and consumer segmentation, this study demonstrates an approach that can be readily applied as a demand modeling tool for more than just typical products; it can also be tailored to individual businesses.
Methodology
Research Design
This study focused on three hotel types: economy (1 to 2 star), midscale (3 to 4 star), and upscale (5 star). The environmental factor analyzed was a pandemic, given its significant impact and disturbance of the hospitality and tourism industry worldwide. We framed a binary treatment of the consumption situation using COVID-19 as a representative case example to illustrate the demand pattern during societal disruption and crises. As COVID-19 has had a wide-ranging and enduring influence on Chinese consumers’ behavior, the Chinese market has been a suitable context to examine how the demand curves have shifted because of the pandemic. The specific type of consumer demand modeled was domestic hotel demand in China. A 3 (hotel type: economy/midscale/upscale) × 2 (consumption situation: normal/pandemic) between-subjects experiment was conducted using randomly assigned HPTs.
HPT Questionnaire
Individual demand data were collected using HPT questionnaires. The questionnaire for each experimental group contained an image representing the given hotel type, a written description of the consumption scenario, the assumptions, and 13 predetermined price points where the participants were asked to state their demand. Demand was measured by the probability of a single purchase. This was deemed more appropriate than the quantity demanded to measure slow-moving consumer goods like hotels, which individual consumers do not frequently purchase in large quantities (Roma et al., 2016). The questionnaire was developed in Chinese. Examples of English-translated scenario descriptions for economy hotels in normal and pandemic situations are as follows:
Normal situation:
Imagine that you are living your normal life before the COVID-19 pandemic. You plan to take a 1.5-hour flight or a 4-hour high-speed train to a domestic first-tier city for a 1-week leisure trip. You have your eye on a typical standard room in an economy hotel as one of your possible accommodation choices. (Note: Economy hotels are equivalent to 1-/2-star hotels.)
Pandemic situation:
The COVID-19 pandemic has not yet subsided in China; outbreaks of varying scales have continued to occur across the country since 2021. In this situation, you plan to take a 1.5-hour flight or a 4-hour high-speed train to a domestic first-tier city that is not currently experiencing an outbreak for a 1-week leisure trip. You have your eye on a typical standard room in an economy hotel as one of your possible accommodation choices. (Note: Economy hotels are equivalent to 1-/2-star hotels.)
Two manipulation check questions were presented following the scenario description. The manipulation of hotel type was measured by asking about the cost of staying in a particular hotel type, while the participants’ rating of the potential health risk in the described trip was used to measure the manipulation of consumption situation, both on a 7-point Likert scale. The statistics confirmed that the manipulations of both hotel type (F = 679.33, p = .00) and consumption situation (teconomy = -10.49, tmidscale = -11.54, tupscale = -11.91, p = .00) were successful.
The following section was the main purchase task. Under all scenarios, the participants were asked to assume that (1) they had no access to any economy hotels other than their preferred hotel as described in the scenario, (2) their income and savings remained unchanged, and (3) price variation would not affect the room or service quality. Based on those assumptions, the participants stated their purchase probability (0%~100%) if the standard room rate in their preferred economy hotel was ¥0, ¥80 (US$11), ¥100 (US$14), ¥130 (US$18), ¥180 (US$25), ¥230 (US$32), ¥300 (US$42), ¥400 (US$56), ¥520 (US$73), ¥670 (US$94), ¥870 (US$121), ¥1,150 (US$161) and ¥1,500 (US$209). The minimum price was ¥0. According to pilot tests, the maximum price was five times the average market price to locate zero demand. The progression of prices generally followed a logarithmic scale. Following the same procedure, the price points for the midscale hotel groups were ¥0, ¥120 (US$17), ¥150 (US$21), ¥200 (US$28), ¥260 (US$36), ¥350 (US$49), ¥450 (US$63), ¥580 (US$81), ¥770 (US$108), ¥1,000 (US$140), ¥1,300 (US$181), ¥1,700 (US$237) and ¥2,250 (US$314), and those for the upscale hotel groups were ¥0, ¥160 (US$22), ¥200 (US$28), ¥270 (US$38), ¥350 (US$49), ¥460 (US$64), ¥600 (US$84), ¥780 (US$109), ¥1,000 (US$140), ¥1,300 (US$181), ¥1,750 (US$244), ¥2,300 (US$321) and ¥3,000 (US$419).
Lastly, there were questions about sociodemographic characteristics, consumption preferences (frequent accommodation choice), and risk tolerance. The measure of risk tolerance was adopted from Williams et al. (2022), and the standardized factor scores were derived with high factor loadings (0.893) and a satisfactory internal consistency (Cronbach’s α = 0.678). The participants assigned to the three groups under the pandemic scenario were also guided to list the primary factors they would consider when choosing accommodation for leisure trips during a pandemic. The texts were coded by keywords and ranked by frequency.
Participants
The target population was Chinese adults. Participants were recruited through a reputable online research firm—Credamo—and each was randomly assigned to one of the six experimental groups to complete the HPT online. Two pilot studies, each with 120 sample responses, were conducted in April 2022 to test and refine the research design and questionnaire components. In the first round of main data collection (April–May 2022), the questionnaire was released and opened to the entire sample pool of the research firm. The participant characteristics and distributions were then scrutinized, and the questionnaire was republished in the second round (June 2022) to target specific groups that lacked sufficient samples. Finally, 822 valid responses were obtained, with few sizable differences in participant distribution across categorized groups. See Tables A and B in the online Supplemental File for sample distribution in experimental groups and sociodemographic characteristics, respectively.
Females represented 54% of the participant pool. Ages ranged from 18 to 78 years (mean = 36.46). The median annual household income was between ¥137,000 (US$19,127) and ¥239,000 (US$33,367). More than half of the participants held a bachelor’s degree, were wage-employed, and had children under the age of 18 years. Preliminary chi-square analyses were conducted to check the sociodemographic distributions across the six experimental groups. The statistics confirmed that the groups did not significantly differ in their distributions of gender: Χ2(5) = 3.85, p = .57; age interval: Χ2(20) = 13.41, p = .86; income interval: Χ2(20) = 20.18, p = .45; education: Χ2(10) = 6.03, p = .81; or employment: Χ2(30) = 31.35, p = .40. The one-way analysis of variance tests verified that all six groups were equivalent regarding mean age: F(5) = 0.81, p = .54, and average number of children under 18 years old: F(5) = 0.99, p = .43. Thus, the experimental groups did not differ from each other in participant characteristics.
Data Analysis
The BE demand model was chosen for its ability to capture the dynamic nature of hotel demand curves. This model analyzes elasticity along the entire demand curve, offering a nuanced view of how elasticity changes with price variations. Its capacity to fit demand curves at a disaggregate level accounts for individual differences in consumer preferences, socio-demographics, and risk tolerance. Additionally, it incorporates environmental influences through HPTs, making it ideal for examining the impact of crises on demand curves.
The first BE demand model is the exponential model that fits data on the logarithmic scale (Hursh & Silberberg, 2008), written as:

where
Koffarnus et al. (2015) reorganized Equation (1) to an exponentiated functional form:

where the meanings of parameters remain unchanged. This model is advantageous in directly processing zero values, thereby avoiding potential distortion of the model fitting. Therefore, this study used Equation (2) to fit hotel demand curves. The derived parameter
EV was calculated according to Hursh (2014):

The above equation adjusts for
Results and Discussion
The demand curves across the three hotel types differed significantly (F = 581.12, p = .00). Thus, differences in demand curves between normal and pandemic situations were tested for each hotel type separately. Significantly different demand curves were generated for midscale hotels (F = 17.38, p = .00) and upscale hotels (F = 15.04, p = .00), but the demand curve for economy hotels did not differ significantly between the two situations (F = 1.37, p = .24). Figure 1 displays the demand curves of all six experimental groups. Compared to normal circumstances, the pandemic dragged the demand curve for midscale (upscale) hotels to be more inelastic (elastic) at each price point, indicating a higher (lower) consumer demand (i.e., purchase likelihood) for midscale (upscale) hotels at a fixed price when traveling to a first-tier city for leisure purposes.
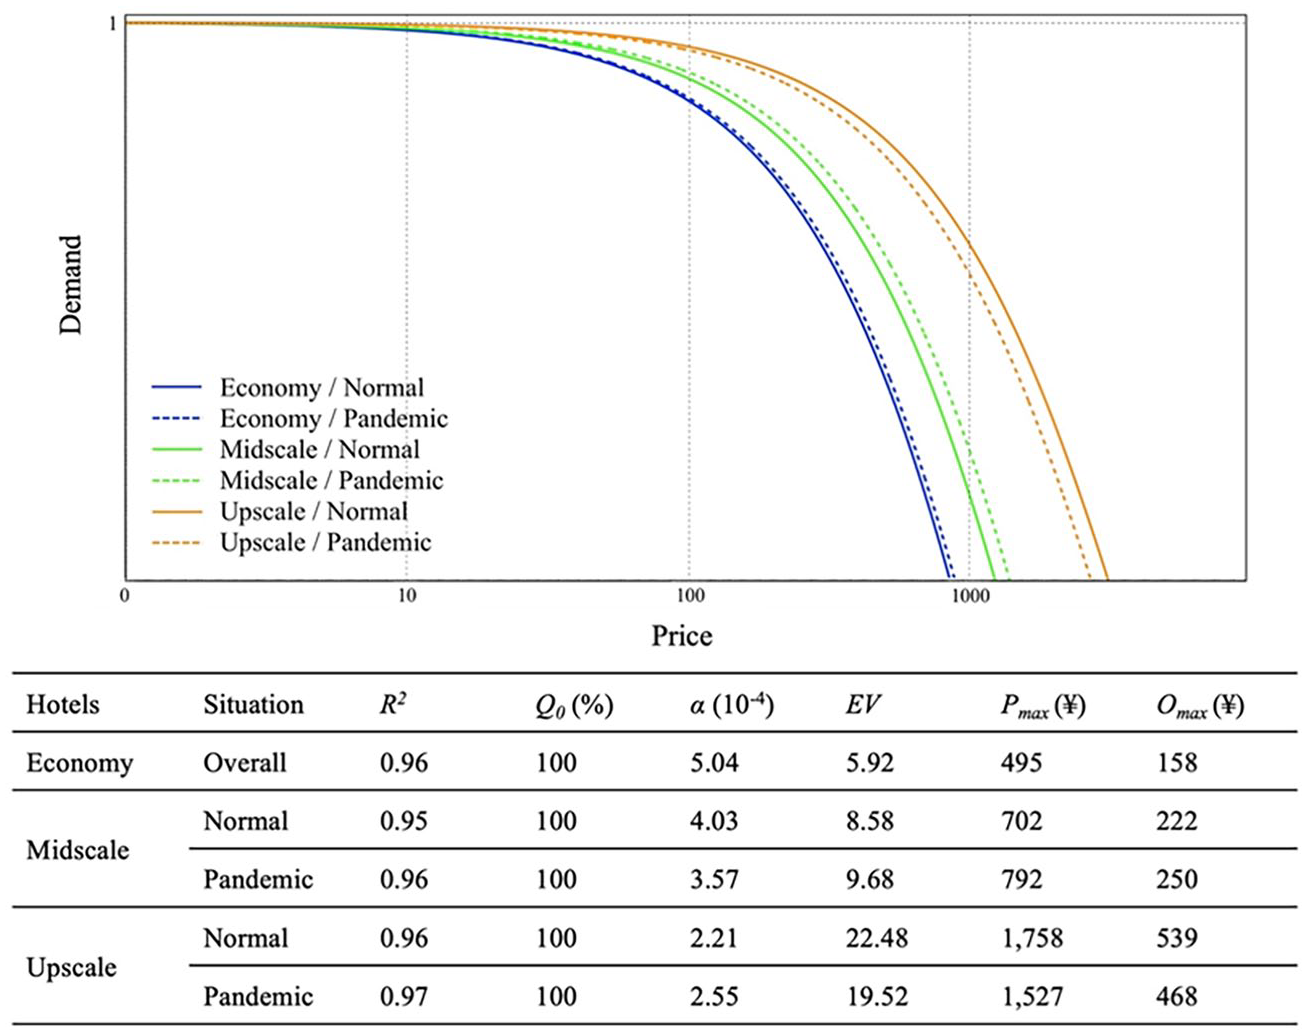
Demand Curves for Three Hotel Types.
Group Demand Curves by Consumption Situation
The pandemic situation did not substantially alter the demand curve for economy hotels. Compared with the other hotel types, the demand elasticity for economy hotels exhibited a relatively high rate of increase with price, resulting in an EV as low as 5.92. The estimated optimal pricing point was ¥495 (US$69). However, the fast decay rate for demand indicated a swift drop in consumer demand in the ¥716 (US$100) to ¥929 (US$130) price range.
In the normal situation, the demand elasticity for midscale hotels increased at
For upscale hotels, in a normal situation, the demand elasticity grew with price at a low rate, indicating a high EV. The estimated optimal price was ¥1,758 (US$245). Consumer demand declined to zero, given a price between ¥1,988 (US$278) and ¥2,731 (US$381). In contrast to midscale hotels, upscale hotels in the pandemic situation showed a significantly higher rate of elasticity increase compared to the normal situation, reducing the optimal pricing point (¥1,527, US$213) and the breakpoints. Consequently, the EV of upscale hotels became smaller in the pandemic situation.
This analysis exemplifies the effectiveness of EV as a standardized index to quantify the value of goods by specifying the dynamics of demand elasticity along a demand curve, making different goods comparable. In general, upscale hotels were valued highest by consumers, followed by midscale and then economy hotels. However, the demand curves for the three hotel types were affected by the pandemic to various extents. The pandemic did not alter the demand curve for economy hotels, but it did cause a slower (faster) exponential decay rate in the demand curve for midscale (upscale) hotels. These situational changes indicated that under the influence of a pandemic, consumer demand for midscale (upscale) hotels became more inelastic (elastic) at all prices, as noted in a larger (smaller) EV and a higher (lower) optimal pricing point.
The above differences between the demand curves can be explained by referring to the participants’ questionnaire responses concerning their primary considerations when choosing accommodation during a pandemic (see Table C in the online Supplemental File). The participants’ priority was the epidemic prevention conditions and measures in a hotel. While location remained a top consideration, a hotel’s comfort level was also fundamental because the participants knew they might have to stay there for a long time during a city lockdown. Price and hygiene held almost equal importance.
In this regard, midscale hotels appeared to offer a good balance between cost and risk reduction and were preferred during the pandemic. Conversely, staying in an upscale hotel might incur a considerable financial risk if a sudden lockdown occurs. Economy hotels differed from midscale and upscale hotels in terms of goods and services provided. An economy hotel is analogous to a necessity good in the lodging sector. It is designed to meet fundamental needs and has a constant value. Therefore, the demand curve for economy hotels remained stable regardless of the state of the market. In sum, a pandemic increased consumers’ perceived health and financial risks when booking a hotel stay, affecting the corresponding demand curves.
The results confirm the finding that the impact of a pandemic on the demand for high-end (low-end) hotels was the most (least) significant (He et al., 2022). However, in terms of demand elasticity, studies have focused on either the industry-wide elasticity affected by a pandemic (Guizzardi et al., 2022) or the long-term elasticity for different hotel types (Zhang & Lu, 2022) and thus have not explicitly investigated the potentially inconsistent shifts of elasticities for different hotel types amid a crisis. Therefore, the results of the current study provide deeper insights into pre- and post-crisis hotel demand and its elasticity concerning hotel types than offered by the literature.
Disaggregate Demand Curves of Consumer Groups
The influence of individual consumer differences on demand curves was examined by disaggregating the participants based on selected characteristic variables and testing the significant differences across group demand curves. The demand intensity
As can be seen in Table 1, gender, age, income, and risk tolerance significantly affected the shape of the demand curve for economy hotels. Males generated a more inelastic demand curve than females, with a larger EV and optimal price, and people aged 26 years and above valued economy hotels more than those aged 18 to 25 years. Unsurprisingly, income and risk tolerance positively (negatively) affected the EV (demand elasticity), yet no significant difference in demand curves was detected among the middle- and high-income (above ¥98,000) groups. Differences in consumer preferences did not affect the demand curve.
Model Results by Consumer Group: Economy Hotels.
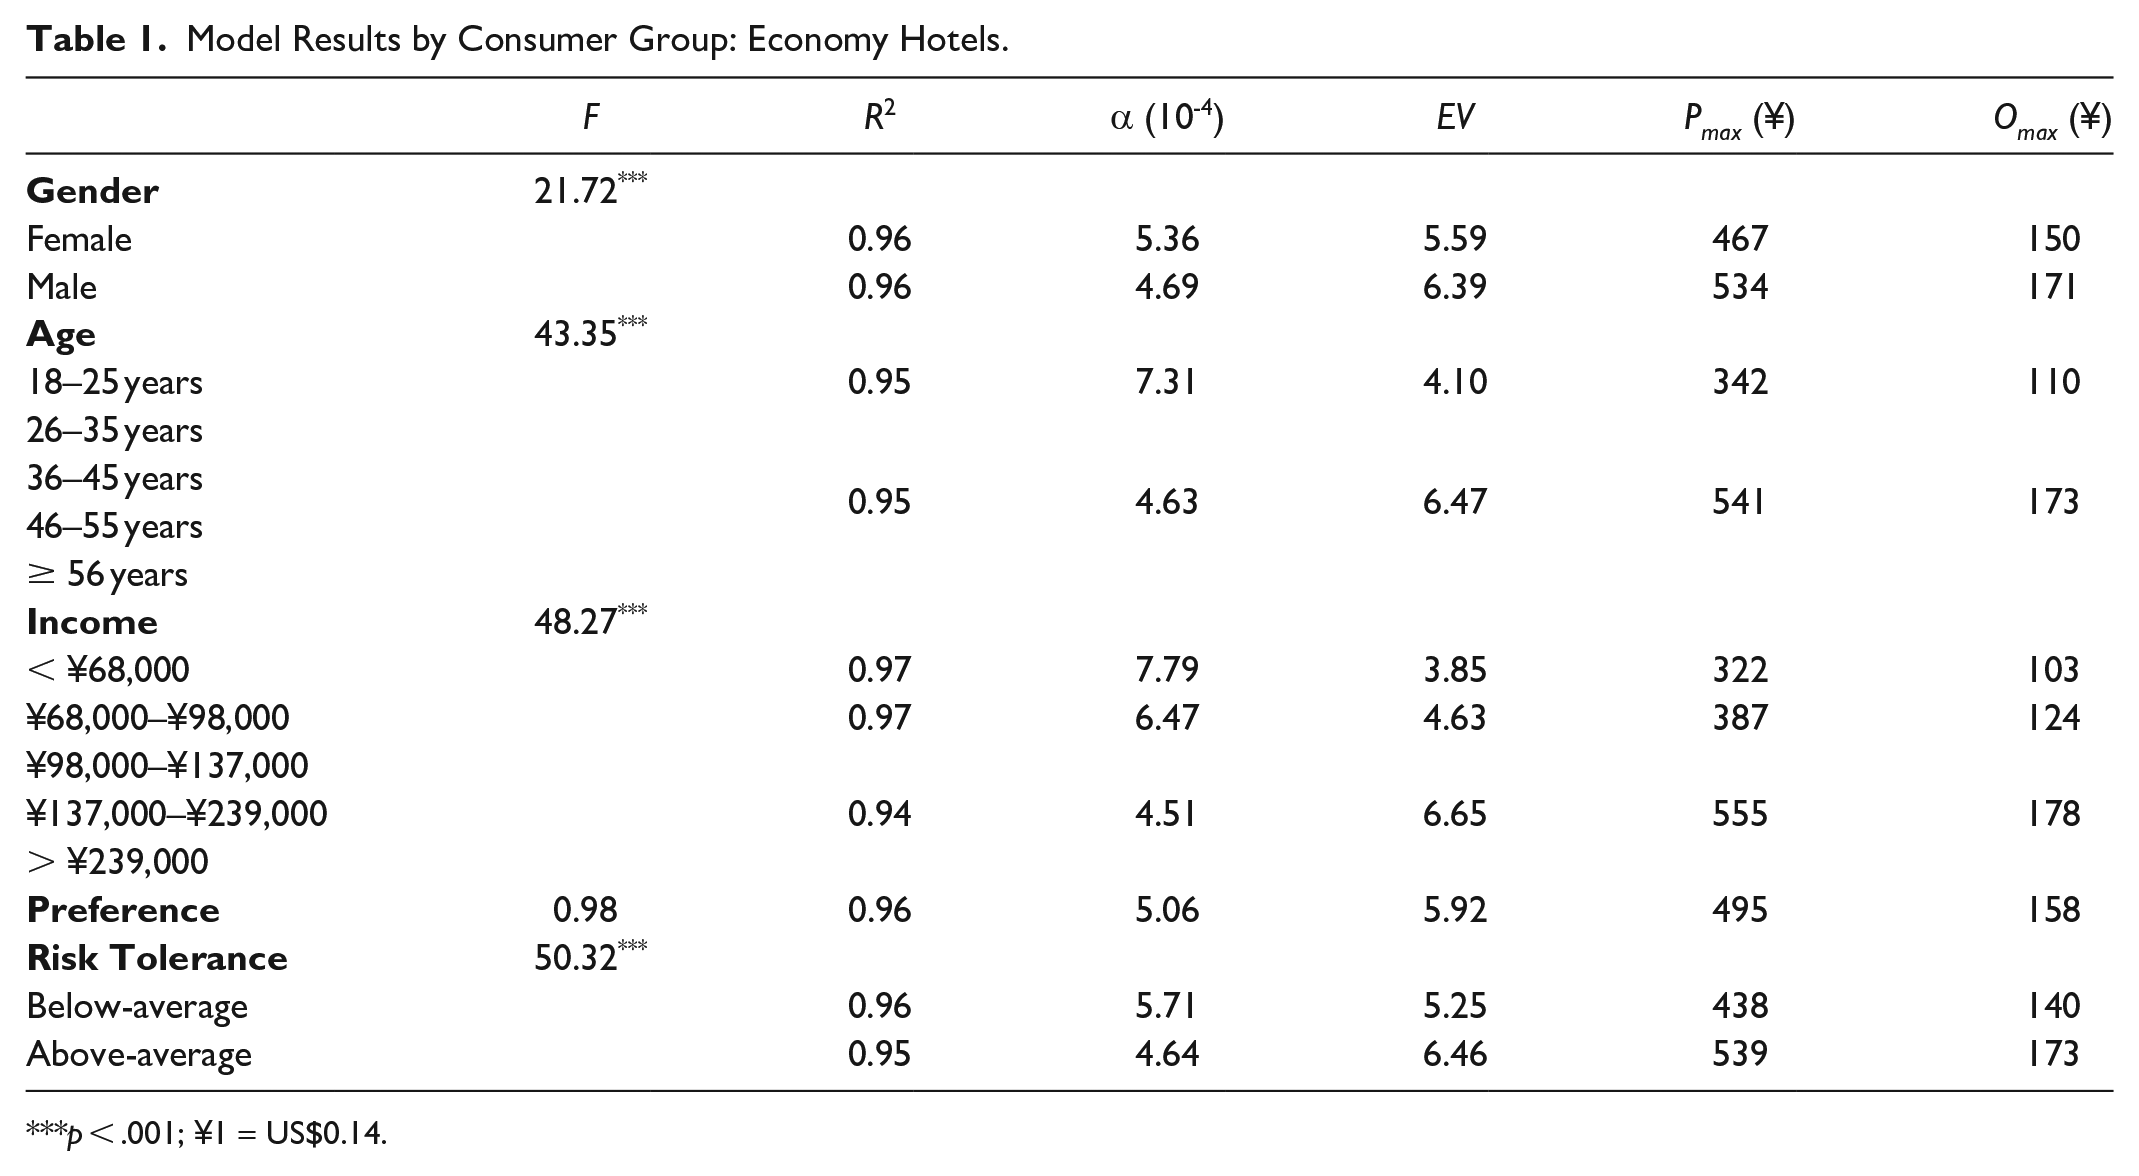
p < .001; ¥1 = US$0.14.
For midscale and upscale hotels, the impact of individual differences was assessed in both normal and pandemic situations. As reported in Table 2, all the characteristics except gender significantly differentiated the demand curve for midscale hotels in both situations. Gender was a significant influencing factor in the normal situation, with females generating a more elastic demand curve than males, but the impact of gender vanished in the pandemic. Young adults (18–25 years) and senior adults (56 years or above) valued midscale hotels the least in the normal situation, but the valuation reported by senior adults significantly increased in the pandemic situation. In both situations, people aged 26 to 35 years attached the greatest EV to midscale hotels compared to the other age groups. The positive correlation between income and EV was confirmed. However, the segmentation of income groups differed between the two situations, most noticeably in the considerable increase in the EV for middle-income people (¥98,000–¥137,000) during the pandemic. People who preferred to stay in bed-and-breakfast inns (B&Bs) and economy hotels had the most elastic demand curve in the normal situation but experienced a tremendous increase in EV for midscale hotels in the pandemic situation, such that there was no difference between their EV and that of frequent customers of midscale hotels. Risk tolerance exerted a negative influence on the rate of elasticity increase. People with an above-average level of risk tolerance valued midscale hotels markedly higher in the pandemic than in the normal situation, while the valuation of the below-average risk tolerance group remained relatively stable.
Model Results by Consumer Group: Midscale Hotels.
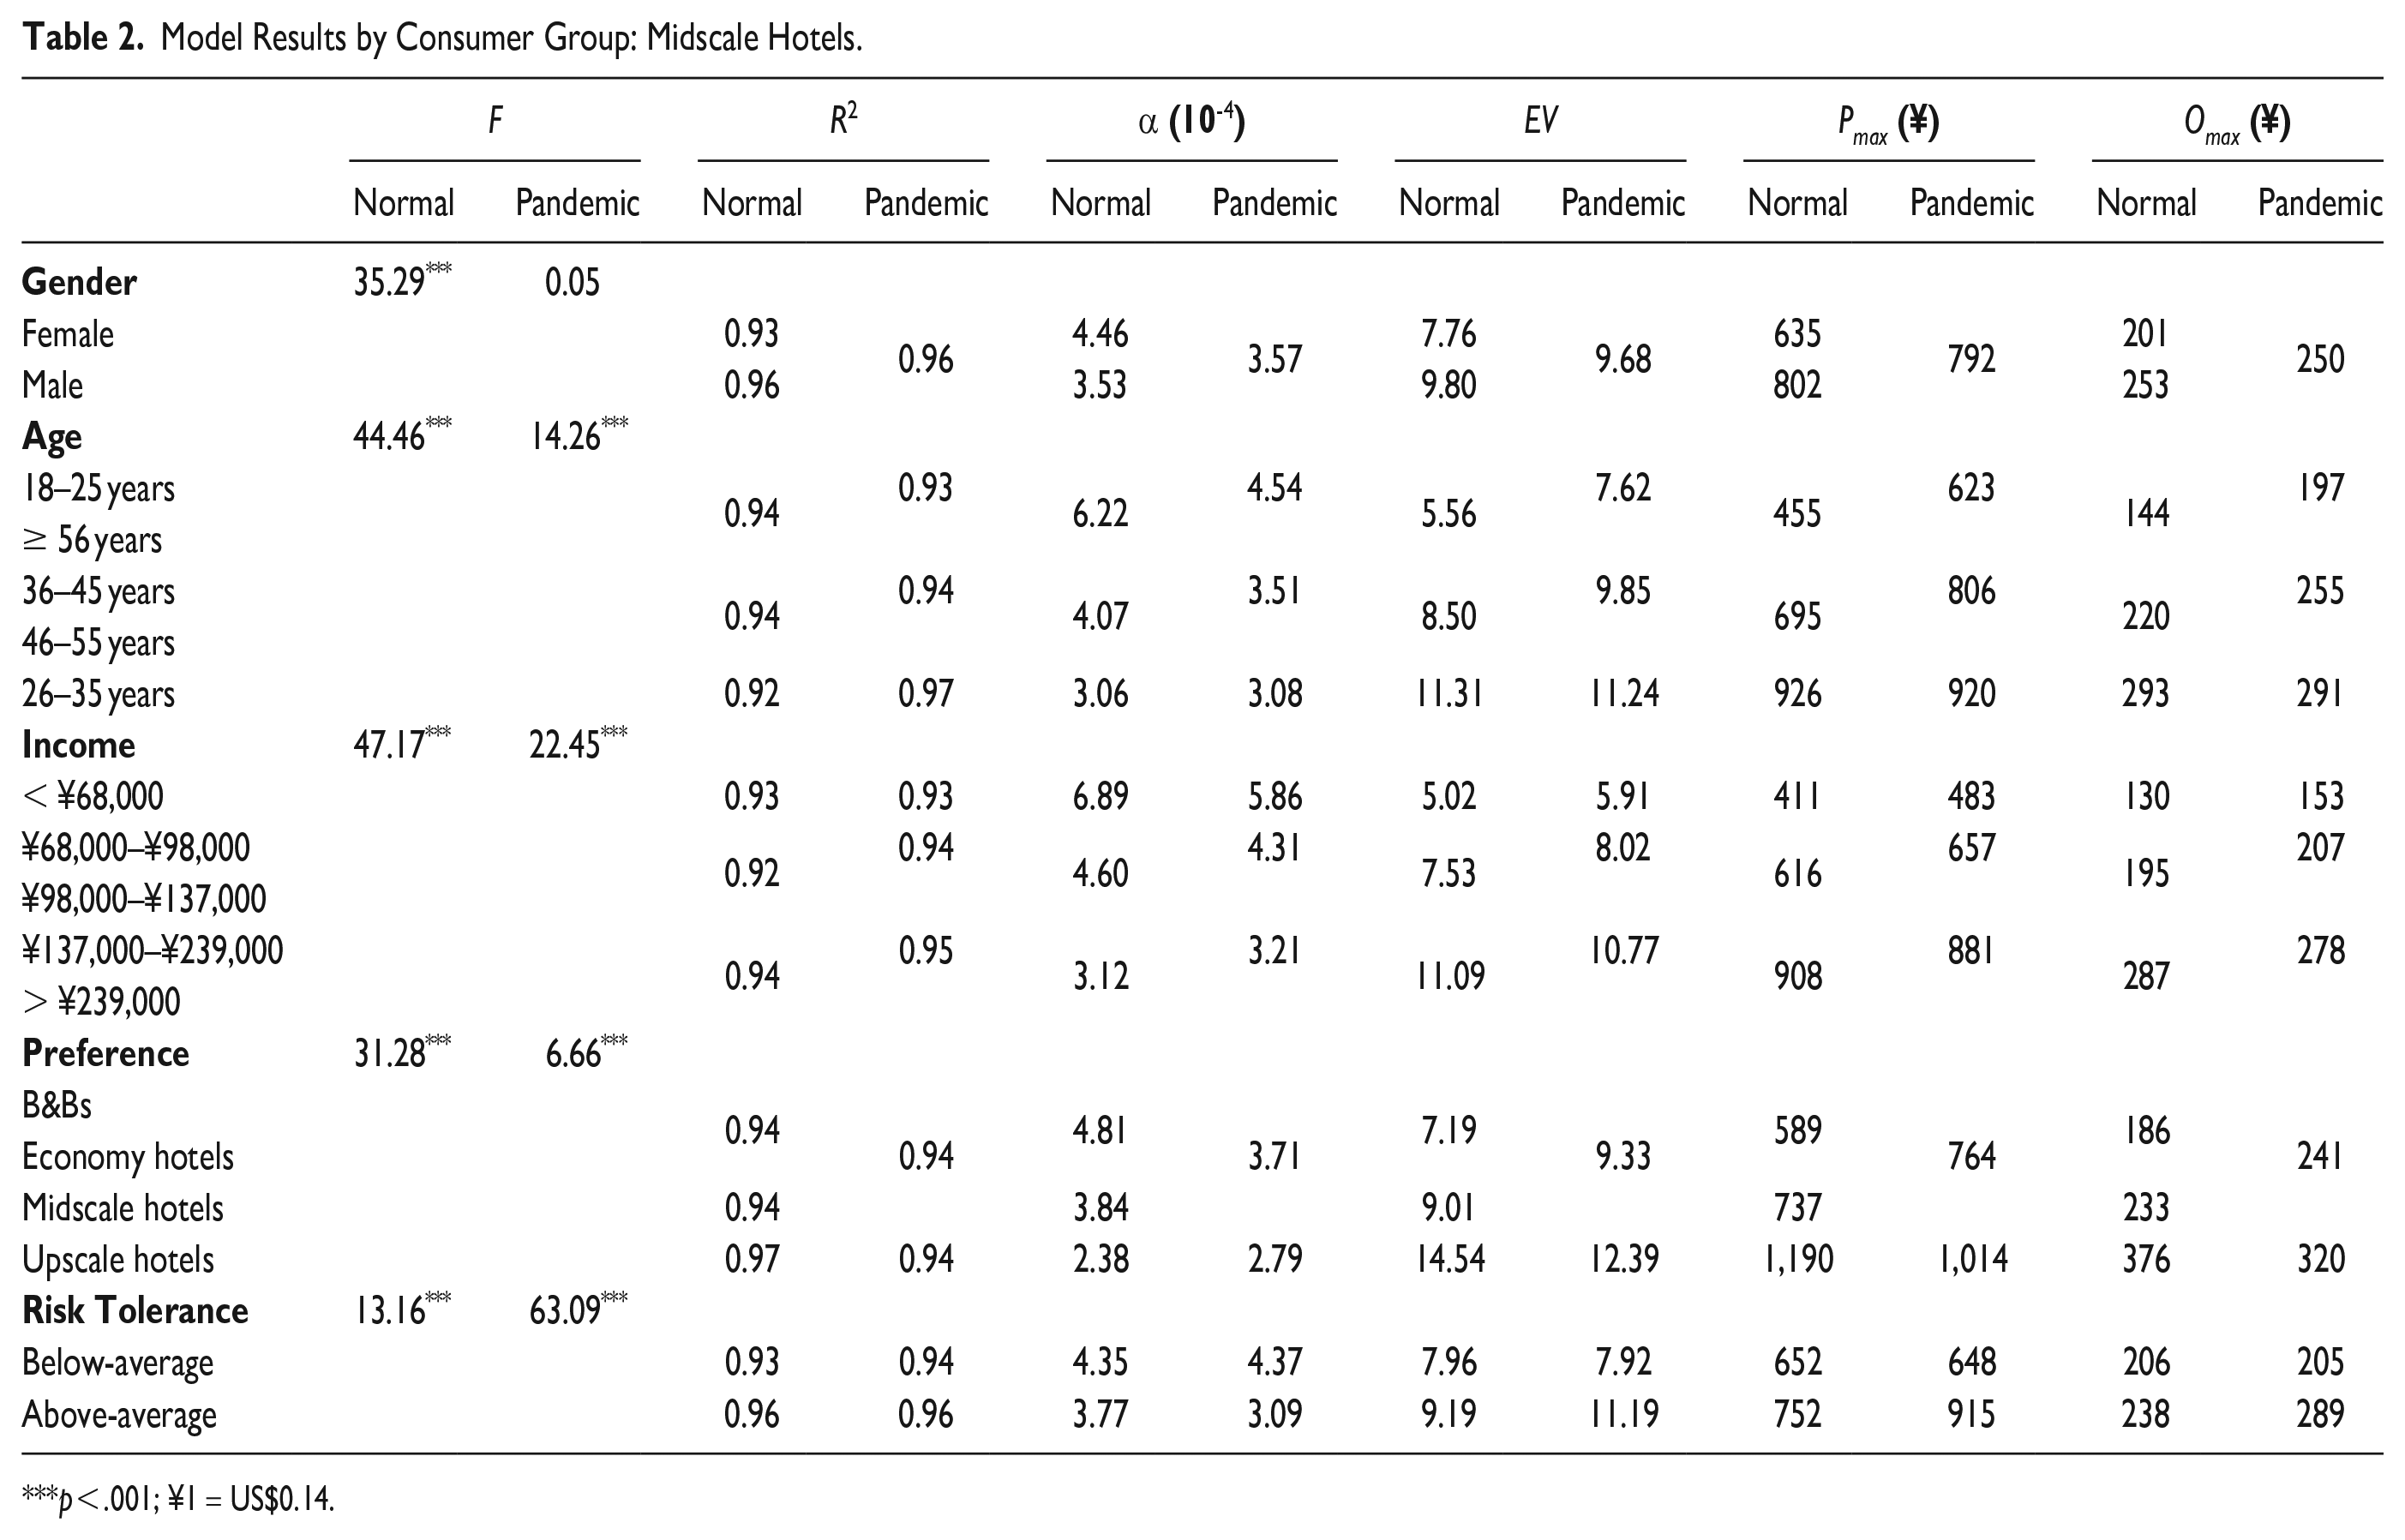
p < .001; ¥1 = US$0.14.
All the characteristics significantly impacted the demand curve for upscale hotels in both normal and pandemic situations. Females valued upscale hotels less than males, but females’ valuations were more vulnerable to a pandemic, dropping by a larger magnitude than males. Age segmentation in the normal situation revealed a simple two-group result, with 26 years old as the dividing point. However, this pattern did not hold during the pandemic, as there was a sizable decrease in EV among middle-aged and senior adults compared with young adults. The positive effect of income on EVs was also verified. In a normal situation, the demand curve of individuals in the highest income group (above ¥239,000) was significantly more inelastic than the curves of the other groups. The occurrence of the pandemic altered this pattern by shifting the cut-off income level to ¥137,000, suggesting a decline in upscale hotels’ EV among high-income consumers. Participants who preferred economy and midscale hotels showed the same demand curve for upscale hotels, with a relatively small EV, irrespective of the consumption situation. People who preferred B&Bs valued upscale hotels as much as frequent customers of upscale hotels in the normal situation, but drastically less in the pandemic situation. Frequent customers consistently showed the most inelastic demand of all customers. Risk tolerance negatively affected demand elasticity, and people with below-average risk tolerance lowered their valuation in the pandemic situation to a greater extent than people with above-average risk tolerance (see Table 3).
Model Results by Consumer Group: Upscale Hotels.
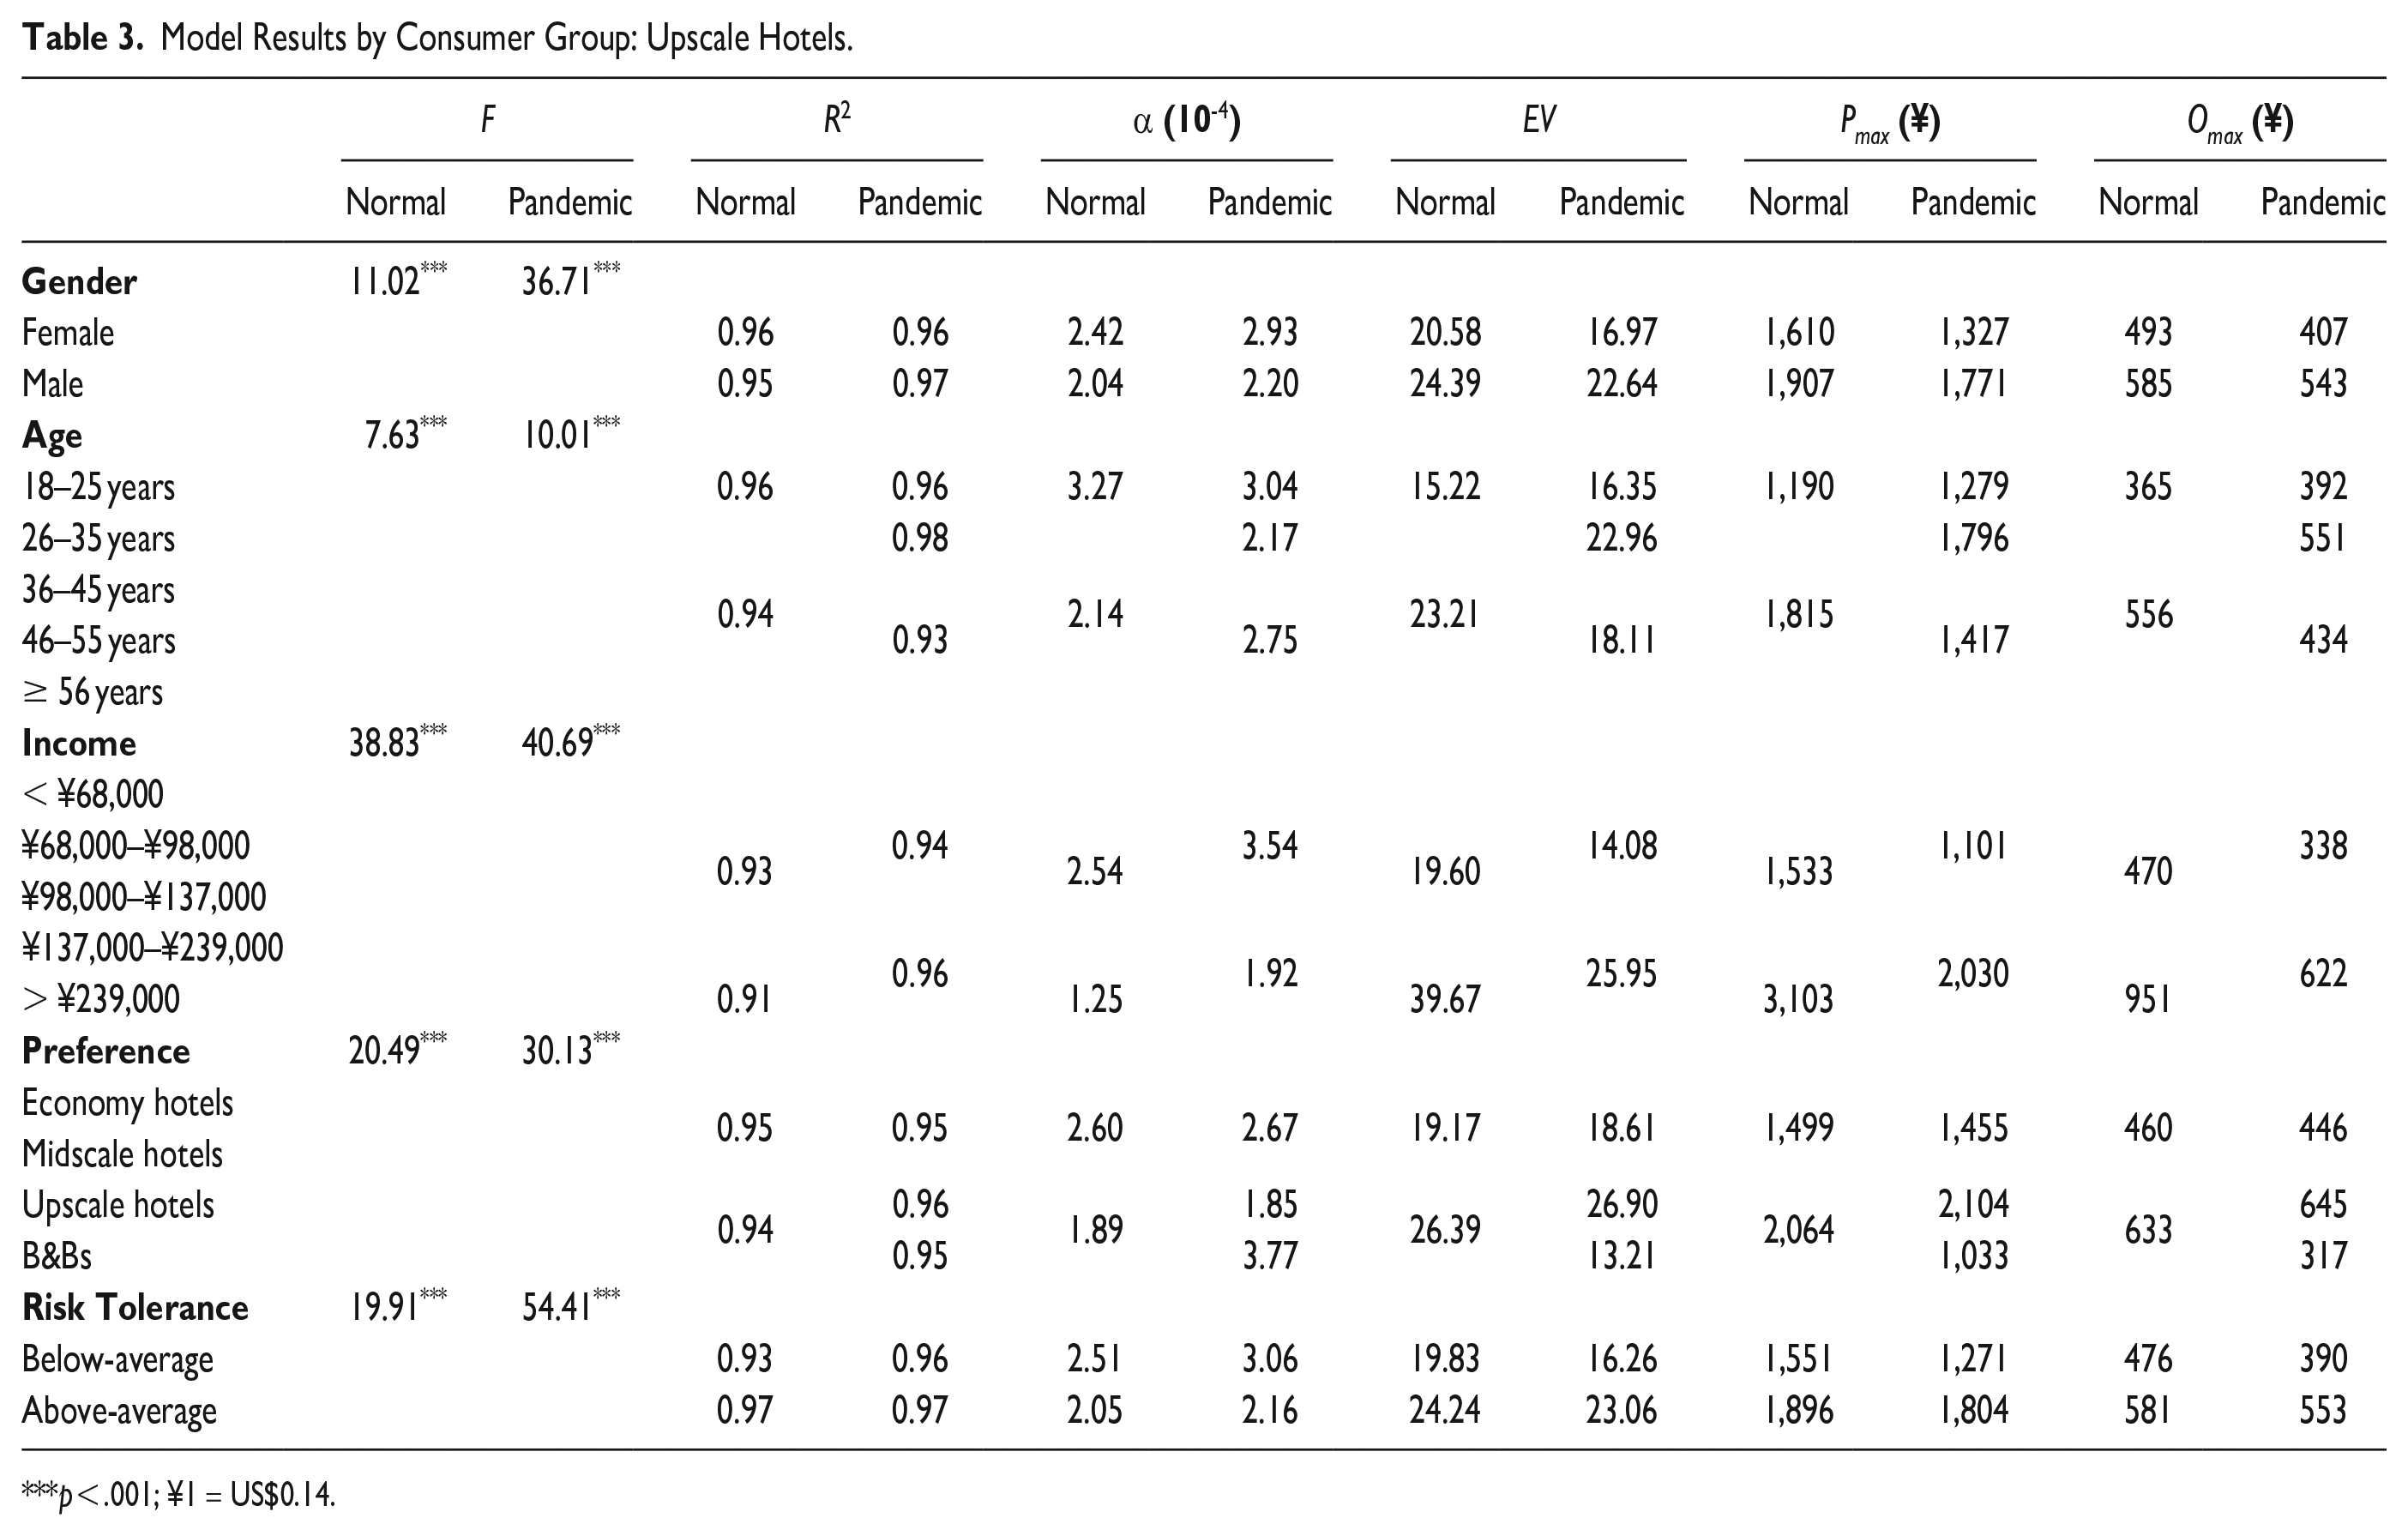
p < .001; ¥1 = US$0.14.
Many studies have corroborated the impact of demographic and psychological characteristics on consumers’ choices of and demand for hotels and other tourism products (Lee & Hwang, 2011). This study deepens our understanding by showing how these characteristics diversify the demand curves for different hotels. The demand curves for the economy and upscale hotels generally showed less heterogeneity among consumers, whereas heterogeneity was most remarkable for the demand curve of midscale hotels. Consequently, consumers’ characteristics affected the valuation of midscale hotels more than other hotels’ valuations, implying that midscale hotels faced more varied market segmentation and needed more diversified marketing strategies than other hotels. The pandemic mitigated (amplified) the influence of the sociodemographic factors and consumption preferences on the demand curve for midscale (upscale) hotels.
Combining the results of three hotel types, we recognized that, first, the demand curves of middle-aged and older adults varied depending on the situation, whereas those of young adults were unresponsive to situational changes. Among the young adults, the group aged 18 to 25 years (26–35 years) had a substantially elastic (inelastic) demand curve. Studies have identified age as a vital influencer of consumers’ everyday choices (Tran et al., 2019) and decision-making amid COVID-19 (Foroudi et al., 2021). The present study further highlights the impact of age on consumers’ demand curves in the normal versus pandemic situation. Second, regarding consumption preferences, frequent customers of a specific hotel type tended to demonstrate relatively inelastic demand and high EVs, which were resilient to the pandemic. This is consistent with findings regarding customer loyalty (Blinder et al., 1998). Third, people who preferred B&Bs generally attached low (high) value to midscale (upscale) hotels, implying a potential substitutive (non-substitutive) interaction, as suggested by Guttentag and Smith (2017). However, this valuation pattern was reversed during the pandemic. Fourth, risk tolerance differentiated the demand curves to a greater extent during the pandemic, aligning with many studies indicating that risk tolerance significantly influenced consumer demand amid COVID-19 (Landry et al., 2021).
Furthermore, several demand patterns remained consistent across hotel types and consumption situations. First, females tended to have more elastic demand curves and lower EVs than males. This difference in demand may reflect differences in decision-making between the genders. Females are generally more concerned than males about budget, time, uncertainty, and the consequences of decisions, whereas men focus more on motivation and goals (Cannon-Bowers et al., 1996). In addition, females tend to perceive higher risks in various circumstances than males (Finucane et al., 2000), displaying more negative reactions to cost increases. A higher price sensitivity for females compared with males has been documented in other economic domains, such as alcohol consumption (Saffer & Dave, 2006). Second, we found that the higher the income or the risk-tolerance level, the more inelastic the demand curves were. The effect of income on price elasticity is consistently significant in various consumption settings (Canina & Carvell, 2005), as consumers with higher incomes have a greater spending capacity at all prices. Risk-tolerant individuals tend to make riskier decisions than risk-averse individuals (Williams et al., 2022) and, therefore, generally exhibit less concern about potential loss and disappointment.
Conclusions
This study developed a demand model based on a BE approach to analyze the heterogeneity of demand curves based on the consumption situation and individual differences across three hotel types. For midscale (upscale) hotels, the pandemic situation slowed (accelerated) the rate of elasticity increase along the demand curve, making demand more inelastic (elastic) at all price points and indicating a higher (lower) valuation from consumers compared with a normal situation. However, this change in the consumption situation did not significantly influence the demand curve for economy hotels due to the necessity of economy hotels perceived by consumers. This research corroborates previous studies showing that high-end hotels are often most impacted by a crisis (He et al., 2022), while the demand for mid-end hotels has the momentum to grow after the occurrence of a crisis (Song et al., 2011). The identified distinct shifts of demand curves for different hotels amid a pandemic are a result of the combined influences of health and financial risks, with the former raising consumers’ standard of choice while the latter impose tighter budget constraints, leading to midscale hotels being favored and upscale hotels disfavored.
Individual differences affected the shape of the demand curve and differentiated various consumer segments, which are relatively diversified (undiversified) for midscale (economy and upscale) hotels. The pandemic situation mitigated (amplified) the influence of individual differences on the demand curve for midscale (upscale) hotels, but it amplified the impact of risk tolerance under all conditions. One noteworthy finding is the gender-based differences in demand curves affected by hotel levels and consumption contexts. During the pandemic, gender differences in demand for midscale hotels were minimized, likely due to blurred economic roles and unified health concerns (Alon et al., 2020). In contrast, gender differences in upscale hotels were amplified, influenced by unequal financial security and different resource priorities due to social and family roles (Craig & Churchill, 2021).
This is one of the first empirical studies to apply the demand framework of “behavioral” BE—including a novel demand model and the HPT technique—to explore the heterogeneity of hotel demand curves across consumers and contexts. The study fills three main research gaps in current hospitality and tourism demand studies: (1) modeling the complete demand curve over a wide price range to map the detailed shape of the demand curve; (2) parameterizing the dynamics of elasticity along the demand curve and interpreting them conceptually and empirically; and (3) increasing the flexibility of econometric demand modeling by extending it to the disaggregate level to discover and compare the demand curves of consumer segments and individual businesses in different consumption situations.
From a managerial perspective, the findings provide insights into business strategies. First, understanding complete demand curves and elasticity dynamics allows managers to establish the linkages between price, demand, and revenue. The optimal pricing point derived from the demand side maximizes revenue. It is more relevant than the long-term market equilibrium price in informing managers in individual enterprises of the pricing decisions. Second, insights into the influence of individual differences on demand curves can support customized marketing strategies across consumer groups. Third, the observed shifts in the demand curves resulting from the pandemic have critical implications for the crisis management strategies hotels employ to proactively adapt and safeguard against fluctuations in demand during periods of crisis. Since crises and economic downturns distort standard market patterns and therefore shift household economic structure (Craig & Churchill, 2021; Smeral, 2018), it is critical for businesses to focus on their essential (ideal) customers who exhibit relatively inelastic demand and high EVs that are insensitive to external disruptions and to implement appropriate price adjustments (i.e., lowering price if the demand curve becomes more elastic and EV becomes smaller, and vice versa) to achieve higher revenue. Specific managerial advice for each hotel type is as follows:
Economy hotels are necessity goods in the realm of lodging products, as they meet consumers’ most basic needs and, therefore, demonstrate a relatively consistent market valuation and a stable demand curve unaffected by the pandemic. It is recommended that economy hotels maintain their status-quo pricing strategies during a health crisis. Their essential customers are middle-income people aged 26 years or older. As the demand curves for economy hotels are less heterogeneous across consumer segments than those of other hotels, economy hotels have little room to customize pricing or marketing. Nevertheless, as the pandemic has led consumers to prioritize epidemic prevention measures and hygiene when choosing an accommodation, and as this new emphasis is likely to persist in the aftermath of the pandemic (Jiang & Wen, 2020), an economy hotel can differentiate itself from its competitors by enhancing its professional and managerial abilities to address these issues and improve service quality, customer satisfaction, brand image, and reputation, as emphasized by Ren et al. (2018).
Midscale hotels must manage the most complicated array of market segments, as the valuation of midscale hotels fluctuates among different consumers. The essential customers in a normal situation are middle-aged and high-income individuals. The pandemic substantially altered the demand curve for midscale hotels, making the demand more inelastic at all prices. Thus, midscale hotels could consider increasing their room rates to generate increased revenue amid a health crisis. Particular attention should be paid to young adults, senior adults, middle-income people, and people who usually stay in economy hotels and B&Bs, as they markedly raised their valuations of midscale hotels during the pandemic. Because of the differentiated products and services offered, each midscale hotel has the potential to distinguish itself from its competitors by developing unique selling points and branding strategies that allow it to charge premium-level prices (C.-F. Chen & Rothschild, 2010).
Upscale hotels have a clear market image as luxury lodging products and a demand curve relatively unaffected by consumers’ characteristics. The essential consumers are high-income earners aged 26 years or above with an accommodation preference for upscale hotels. A differentiated pricing strategy is favorable for these hotels, given the wide gap in optimal prices among different consumer groups. The pandemic increased the demand curve’s overall elasticity for upscale hotels, with consumers showing varying reactions to this environmental change. Therefore, upscale hotels should be cautious about increasing their room rates during a health crisis. The status quo can be maintained for young adults, and there is an opportunity to improve the hotels’ market penetration by targeting moderately high-income people. Frequent customers are an asset in both normal and pandemic circumstances, so earning and keeping frequent customers should be at the core of upscale hotels’ business strategies to stand out in the hospitality industry (Kandampully et al., 2015).
Furthermore, individual hotels can use the findings of this study to develop customized and effective pricing strategies according to their market positions. A hotel can match its customer composition to the demand curves of the corresponding consumer segments to obtain its own EV(s) and optimal pricing point(s). In this way, the hotel can establish its own demand curve and business strategies specific to its situation.
The findings have implications for various industry stakeholders beyond hotel managers. Destination managers can enhance collaboration with hotels to promote safe travel experiences, encouraging the development of midscale hotels to create a balanced and sustainable tourism infrastructure. For investors, understanding the differential impacts of crises on hotel segments can inform investment strategies, highlighting the resilience of midscale hotels during economic uncertainties. Assessing hotel portfolio risk profiles by considering demand elasticity and EV enables better financial planning and risk mitigation. For policymakers, the study highlights the need for robust crisis management frameworks adaptable to changing demand dynamics. Policies promoting hygiene standards and consumer protection can strengthen consumer confidence. Supporting economy hotels through financial aid and regulatory relief can sustain affordable accommodation options during economic downturns.
This study has some limitations. First, the demand curve analyses assumed stable market supply and did not consider competition within the same hotel type, warranting future exploration. Second, HPT measures stated behavior, which may not accurately predict actual behavior, a common challenge in laboratory experiments. Despite being the best option due to the lack of secondary data, future studies should use eligible secondary data to model actual consumer demand at a disaggregate level. Third, online surveys might introduce sample selection bias. While this study presents a novel methodology for modeling disaggregate demand curves, future research should use sufficiently representative samples to construct and interpret demand curves for specific market segments.
The current study focuses on the Chinese hotel market. Future research should aim to validate these findings across different geographical and cultural contexts to enhance generalizability. This could include studying how cultural differences influence hotel demand curves, examining various segments of the hospitality industry (e.g., luxury resorts, boutique hotels, Airbnb), and investigating seasonal impacts on demand in different climates and tourist destinations. Additionally, research should explore the effects of other types of crises (e.g., economic crises, natural disasters, policy instability) on hotel demand to understand demand elasticity under various conditions. Longitudinal studies could track changes in consumer demand over multiple crises to identify emerging trends. Furthermore, evaluating the performance of various BE demand models across different contexts and consumer segments is recommended to refine the methodology.
Supplemental Material
sj-docx-1-jht-10.1177_10963480241271307 – Supplemental material for The Heterogeneity of Hotel Demand Curves Across Consumers and Contexts
Supplemental material, sj-docx-1-jht-10.1177_10963480241271307 for The Heterogeneity of Hotel Demand Curves Across Consumers and Contexts by Gabrielle Lin, Jason Li Chen and Haiyan Song in Journal of Hospitality & Tourism Research
Footnotes
Acknowledgements
Gabrielle Lin would like to acknowledge the financial support of The Hong Kong Polytechnic University for this study as part of her PhD research.
Declaration of Conflicting Interests
The authors declared no potential conflicts of interest with respect to the research, authorship, and/or publication of this article.
Funding
The authors received no financial support for the research, authorship, and/or publication of this article.
Supplemental Material
Supplemental material for this article is available online.
Author Biographies
References
Supplementary Material
Please find the following supplemental material available below.
For Open Access articles published under a Creative Commons License, all supplemental material carries the same license as the article it is associated with.
For non-Open Access articles published, all supplemental material carries a non-exclusive license, and permission requests for re-use of supplemental material or any part of supplemental material shall be sent directly to the copyright owner as specified in the copyright notice associated with the article.