
Abstract
Empirical research has shown that incorporating big data into tourism and hospitality forecasting significantly improves prediction accuracy. This study presents a comprehensive review of big data forecasting in the tourism and hospitality industry, critically evaluating existing research and identifying five key research questions and trends that require further attention. These include the lack of theoretical foundation, the rise of high-frequency forecasting research, less attention to unstructured data, the necessity of dynamic data analysis in forecasting, and the construction of a tourism and hospitality demand information system based on cloud computing. Importantly, this study constructs a theoretical framework by combining relevant theories from psychology, communication, information processing, and other fields. Five types of big data used for tourism and hospitality forecasting are identified: web-based volume data, social media statistics, textual data, photo data, and video data. Additionally, more recent tactics such as mixed data sampling and machine learning methods are discussed.
Keywords
Highlights
A theoretical framework of tourism and hospitality forecasting with big data is proposed by integrating multiple theories from various disciplines.
The study found that high-frequency forecasting research is emerging.
Two frameworks are proposed to clarify how unstructured big data can be applied to tourism and hospitality forecasting.
Dynamic analysis should be explored given the inherent unpredictability of the real world.
Introduction
Swift advances in internet technology have revolutionized modern society. Online operative traces are produced and recorded constantly on a vast scale, generating big data that capture users’ behavior, including preferences and intentions. The term big data, which first appeared in the 21st century, has been used extensively in the fields of management, science, tourism, and healthcare, among others (Hashem et al., 2015). This concept can be described in several ways, with the most popular definition being Laney’s (2001) “3Vs”: volume, variety, and velocity. Gantz and Reinsel (2011) later added “value” as a fourth characteristic, transforming big data into a “4V” concept. The increasing popularity of internet applications has birthed platforms and tools such as search engines (e.g., Google), photo-sharing sites (e.g., Flickr), and social media networks (e.g., Facebook), through which users can search for travel information. These sources have drastically altered users’ decisions. Industry practitioners have also come to acknowledge the growing importance of operational footprints generated during users’ search processes and are beginning to rely on these data for strategy formulation (Ghose et al., 2014; G. Li & Wu, 2019). Over the last decade, big data forecasting in tourism and hospitality has garnered scholarly and practical attention due to ever-evolving industry dynamics and an emphasis on data-driven decision-making (D. C. Wu, Wu, & Song, 2021). A better understanding of big data will enable the tourism and hospitality industry to harness this information for more precise forecasting (G. Li & Wu, 2019).
Real-time big data can supplement conventional types of data in tourism and hospitality research, especially for demand forecasting (Song et al., 2019). To this point, tourism and hospitality forecasting studies have tended to feature low-frequency and structured statistical data. Yet, tourism and hospitality industries are inherently perishable; it is thus essential to generate timely and accurate demand forecasts to help tourism and hospitality stakeholders adjust their practices as needed. In the big data era, internet technology offers a viable alternative data source to enhance forecasting performance (J. Li, Xu et al., 2018). Although big data have been widely applied in this vein, it should be noted that most of tourism and hospitality forecasting studies are overly data-driven and rarely discuss the theoretical foundation of big data used in tourism and hospitality forecasting (Song et al., 2019).
Tourism-related big data, such as those from search engines, have been applied to tourism and hospitality forecasting to improve associated performance (Han et al., 2023; X. Li et al., 2021). Choi and Varian (2012) and Pan et al. (2012) are two of the earliest articles in the field of tourism and hotel forecasting that employed Google Trends data for predictions. Bangwayo-Skeete and Skeete (2015) pioneered the use of mixed data sampling (MIDAS) to integrate weekly Google data in the tourism demand modeling process. Moreover, Pan and Yang (2017) adopted multiple big data sources (e.g., search engine queries, local website traffic data, and weather data) to forecast tourism demand. Hu et al. (2021) compared the forecasting performance of web search data from personal computers and mobile devices, discovering that computer-based search queries led to better forecasting performance than mobile queries.
Apart from search engine data, social media data are regarded as another valuable information source. They can reflect users’ preferences and decision-making processes and subsequently bolster forecasting accuracy (Khatibi et al., 2020; H. Li, Hu, & Li, 2020; Tian et al., 2021). As big data tourism and hospitality forecasting has gained popularity, scholars have started to devise advanced techniques such as MIDAS models (Havranek & Zeynalov, 2021; H. Liu, Liu, et al., 2021), deep learning methods (Han et al., 2023; Law et al., 2019), decomposition methods (X. Li et al., 2016), and ensemble methods (Sun et al., 2022).
Academic interest in the realm of big data tourism and hospitality forecasting has witnessed a surge in recent years (J. Li, Xu, et al., 2018). Various types of big data have emerged as crucial components in tourism and hospitality forecasting research. However, potential scholars still seem to lack a clear understanding of how to effectively integrate dissimilar types of big data with tourism and hospitality forecasting. For instance, there exists an ambiguity surrounding the specific categories and types of big data utilized in forecasting and how to utilize unstructured data, such as textual and visual features, for forecasting in the tourism and hospitality industry. In comparison to traditional economic data and small data, big data possess more information, are complexly structured, and exhibit different characteristics, thereby requiring distinct analysis techniques (D. C. Wu, Wu, & Song, 2021).
Despite the existence of reviews on big data, a systematic evaluation on the application of multivariate big data in tourism and hospitality forecasting has yet to manifest. Furthermore, the existing reviews have yet to cater to the tourism and hospitality forecasting domain. In comparison to L. Huang and Zheng (2023) regarding hotel demand forecasting, and Doborjeh et al. (2022) concerning AI methods in tourism and hospitality research, our study primarily focuses on big data forecasting and its potential applications, incorporating only some aspects of their related content. We have not placed significant emphasis on traditional hotel forecasting data and methods, nor have we exclusively concentrated on AI methods. There is a pressing need for a comprehensive review to understand how diverse tourism-related big data have contributed to the theoretical and methodological development of tourism and hospitality forecasting research. This study seeks to summarize and critique the existing research on big data tourism and hospitality forecasting while identifying the core issues and trends that demand careful attention. We also plan to delineate an itinerary for research that applies big data in tourism and hospitality forecasting through a detailed discussion of gaps in the literature.
The remaining sections of this article are structured as follows. Section 2 elucidates our data collection methodology and presents descriptive statistics on the articles reviewed. Section 3 provides an in-depth analysis of five primary types of big data for tourism and hospitality forecasting and their corresponding variable construction methods. Section 4 delineates the methodological advancements in tourism and hospitality forecasting with big data. In Section 5, this study critiques and discusses the existing research, identifying key gaps and trends requiring future attention. Finally, Section 6 concludes this study and outlines possible avenues for future research in this field.
Methodology
The study followed the quantitative approach proposed by Pickering and Byrne (2014) to conduct systematic reviews. First, define the research objectives. This study focused on the application of big data in tourism and hospitality forecasting, aiming to clarify the main data types of tourism-related big data, as well as the methods of big data variable construction and forecasting. Second, identify and formulate database and literature selection criteria. Big data–related tourism and hospitality demand forecasting studies were chosen from the Web of Science and Scopus databases, which are two world-leading and competing citation databases (J. Zhu & Liu, 2020), well-known and widely used in academia (W. Liu et al., 2020). Google scholar was also employed. To ensure and extract the maximum inclusion of relevant articles, the keywords “big data,” “social media,” and “search data” along with the terms “hotel,” “hospitality,” “tourism,” and other primary derivatives representing major research subjects and objects were used to identify related publications on tourism and hospitality demand forecasting. The following query strings were applied to articles’ titles, abstracts, and keywords: (forecast* OR predict*) AND (“big data” OR “search data” or “social media”) AND (touris* OR hotel* OR hospitality* OR visit*) AND (demand* OR volume*). The reference lists of selected articles were reviewed as well. Conference papers were excluded from the study sample. Third, evaluate literature and refine theme. After three rounds of screening, which included keyword and abstract recognition, duplicate and irrelevant exclusion, and reference list check, 86 studies published between 2012 and 2023 were deemed relevant to this study. The next step was to identify the topical focuses. As all the selected literature focused on big data tourism and hospitality forecasting, the main themes and target industry were determined. The core of these selected studies is the methodology applied, which includes big data categories, big data analysis methods, and big data forecasting methods.
Descriptive statistical analysis was then carried out. Eighty-six studies were retained for analysis and the number of studies in different publication journals can be seen in Figure 1. The leading journals publishing research on big data tourism and hospitality forecasting were Tourism Management (12 studies), Tourism Economics (12 studies), Annals of Tourism Research (seven studies), Journal of Travel Research (seven studies), and International Journal of Contemporary Hospitality Management (seven studies).
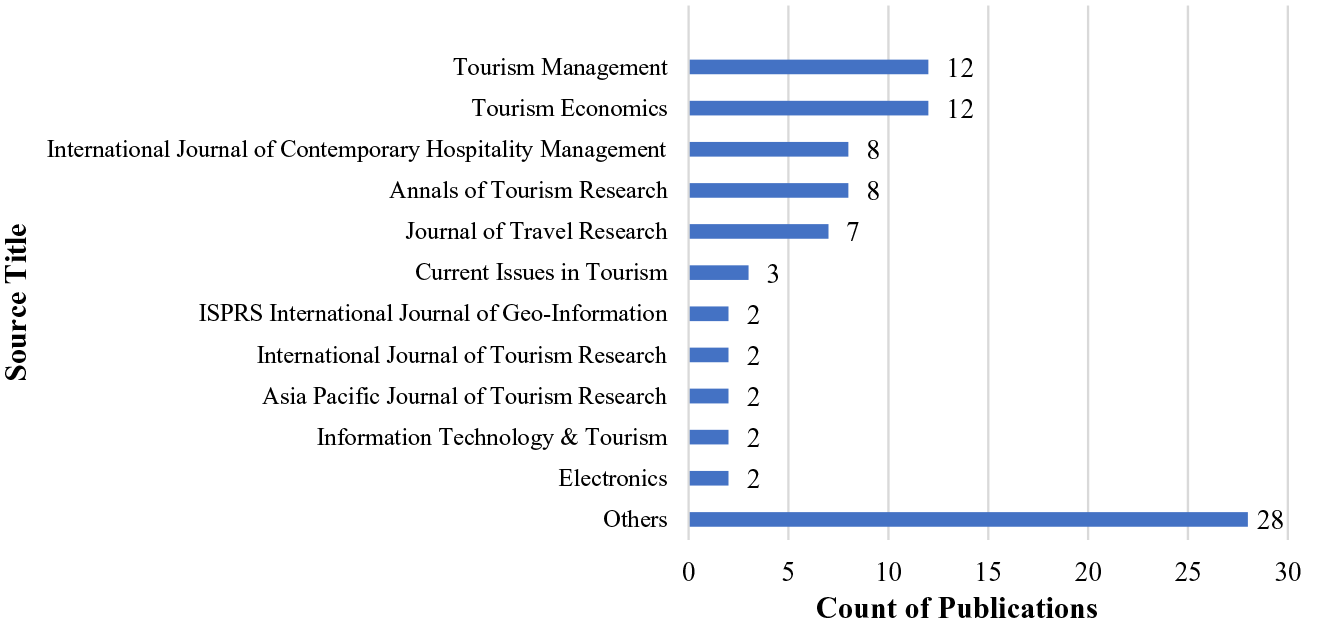
Distribution of Major Published Journals.
Big data forecasting emerged in tourism and hospitality studies in 2012 and the majority of related studies have been published within the past 4 years. The number of related studies between 2012 and 2018 did not exceed 10, but the number of such studies has significantly increased since 2019. In terms of data frequency for model estimation, monthly data was used by 50 studies, weekly data by 18, daily data by 26, and annual data by one. Seven studies used mixed frequency data and one used daily data to verify long-term equilibrium between actual arrivals and web search queries without demand forecasting. Popular accuracy measurements for forecasting included the mean absolute percentage error (MAPE) used in 48 studies, root mean square error (RMSE) used in 45 studies, mean absolute error (MAE) used in 29 studies, and root mean square percentage error used in 12 studies. Furthermore, three studies used the mean absolute square error (MASE) and Theil’s U statistic. Specifically, the MAPE index focuses on the average of the absolute percentage error, and the lower the value, the higher the forecasting accuracy. Similarly, the RMSE index is a widely accepted criterion to assess forecasting accuracy by examining the difference between forecasts and actual demand (Song & Li, 2008; D. C. Wu et al., 2017). MASE is calculated by dividing the MAE by a scaling factor, which is the forecast error based on the historical data. MASE is able to overcome the limitations of absolute error metrics such as RMSE and MAE for time series, and has better interpretability and comparability. In addition, seven studies adopted the Diebold-Mariano test to examine the significance of differences in forecasting performance.
This study synthesized the current research progress of big data tourism and hospitality forecasting and proposed a classification framework of tourism-related big data for forecasting. Figure 2 presents the classification of tourism-related big data based on the data category and the corresponding variable construction methods. The gridlines and highlighted boxes indicate areas that merit further investigation in the future. In this study, we classified tourism-related big data into five types: web-based volume data, social media statistics, online textual data, online photo data, and potentially valuable online video data that warrant exploration. Web-based volume data consists of web search data and web traffic data, which provide insights into the volume of online activities related to tourism. Social media statistics encompass sentiment indicators such as likes or ratings, as well as online metrics like review or photo counts. It is worth noting that online textual data and online photo data, being unstructured forms of big data, primarily involve sentiment information, topic information, and metadata in their forecasting applications. The identification of topics and the extraction of visual contents highlighted in this study present avenues for further exploration. Online video data were rarely mentioned, and attention should be paid to video objects, definition, semantic, speech, and other data types. Big data variables are constructed using several methods. Building comprehensive indices for web-based volume data and social media statistics remains a key issue. The concrete construction methods include principal component analysis, dynamic factor model, deep learning, and so on. Sentiment analysis is often used to transform textual data into specific variables, including dictionary and machine learning. Topic modeling has also begun to be used to extract textual topic information for forecasting, including Latent Dirichlet allocation, Dynamic Topic Model, and Structural Topic Model. Visual content analysis is a common approach to Analyzing online photo data and video data, in which clustering analysis and convolutional neural networks are used.
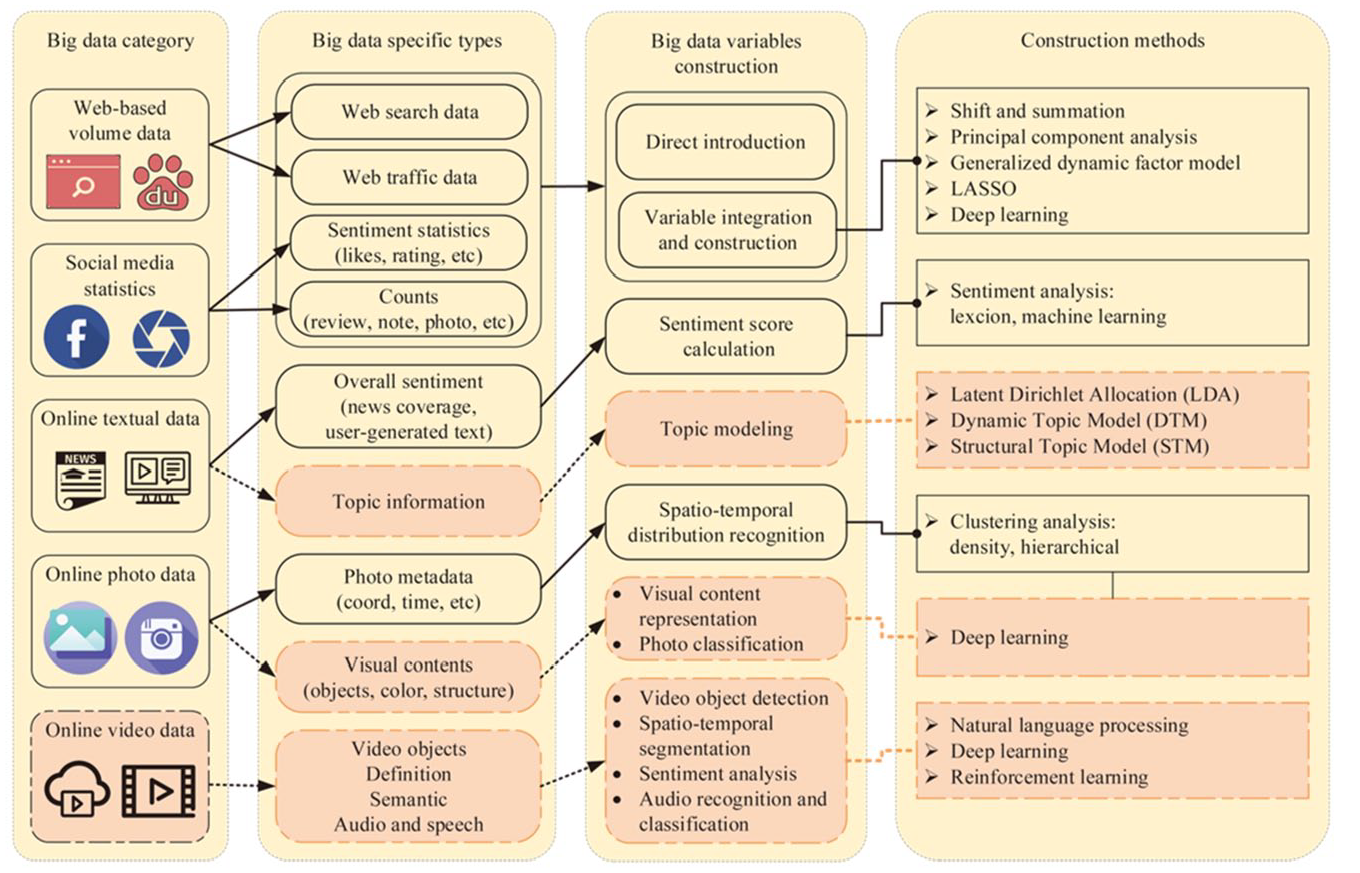
Classification Framework of Tourism-Related Big Data for Forecasting.
Data and Variable Operationalization
Given the expansion of information-based technology, tourists can now generate various forms of tourism-related big data. Five major types have permeated tourism and hospitality forecasting as noted: web-based volume data, social media statistics, online textual data, and online photo and video data. Of these options, the majority of papers (nearly 76%) in this study’s sample used web search and web traffic data. Forecasting research containing social media statistics totaled 14.1% of the sample. Relatively few studies concerned online textual data and online photo data, accounting for 8.4% of sources. Four articles explored the predictive ability of multi-source big data.
Web-Based Volume Data
According to J. Li, Xu, et al. (2018), tourism encompasses a complex system with multiple operating modes that result in transaction data based on web searches and website traffic, hotel guest records, and other sources. Tourism scholars have wielded these data to great effect, especially in tourism and hospitality demand forecasting. Web search data are the most widely used and, in 66 relevant studies, were found reliable for forecasting tourism demand. In three studies, website traffic data were also applied to tourism forecasting exercises.
Web search data and index construction
The ongoing evolution and ubiquity of network and information technology have brought search engines to the forefront: they are prevalent platforms for worldwide travel planning, and users’ web searches are recorded. Individuals’ search behavior can reflect their preferences and decision-making in relation to destinations, accommodation, and cuisine (Ghose et al., 2014; Önder, 2017; Z. Yuan & Jia, 2022). The timeliness and convenience of search query data have propelled their infusion into tourism and hospitality demand forecasts over the last few years. Pan et al. (2012) used five related Google queries about the United States destination of Charleston, South Carolina, to predict hotel room demand. These Google data were deemed useful in improving forecasting accuracy. Önder and Gunter (2016) retrieved Google Trends indices for web and image searches to forecast tourism demand in Vienna, Austria, observing that forecast error declined upon including Google Trends data. Other studies have examined the forecasting performance of search engines apart from (or in addition to) Google, such as Baidu (X. Yang et al., 2015) and Naver (S. Kim and Shin, 2016). Historical data series and conventional economic variables are often prominent in the realm of tourism and hospitality forecasting. When these factors are integrated with big data, it enhances the overall forecasting accuracy (Hu & Song, 2020; Sun et al., 2022)
Many scholars have incorporated search data directly into their forecasting models (Artola et al., 2015; W. H. Kim & Malek, 2018; E. H. Wu, Hu, & Chen, 2022). Keywords for web search data must be carefully selected to ensure that they mirror actual demand data (Bangwayo-Skeete & Skeete, 2015). X. Yang et al. (2015) developed a four-stage query selection process based on the Pearson correlation coefficient between web search data and Chinese tourist volume. B. Zhang, Huang, et al. (2017) and S. Li, Chen, et al. (2018) subsequently used this method to generate search indices for tourism forecasting.
However, keeping all exogenous variables in the forecasting model can lead to problems due to potential multicollinearity and overfitting (X. Li et al., 2017). The shift and summation method, devised by X. Yang et al. (2015), was originally used to construct search indices. Rivera (2016) adopted a similar approach to construct a composite index by aggregating highly correlated queries. More recently, principal component analysis (PCA) has been carried out to extract key information from search data. S. Li, Chen, et al. (2018) combined PCA with econometric and artificial intelligence (AI)-based models to compress the number of input variables, removing redundant information and reducing operational costs. The prediction accuracy of PCA-based models was clearly superior to other benchmark models in their case. Wen et al. (2019) applied PCA to construct composite indices from a large number of search queries. Xie, Li, et al. (2021) took KPCA-based web search indices as predictors to model tourism demand; these models outperformed PCA-based models with respect to prediction accuracy.
Other methods of web search index construction include the generalized dynamic factor model (Camacho & Pacce, 2018), least absolute shrinkage and selection operator (LASSO; H. Liu, Liu, et al., 2021; Tian et al., 2021), and deep learning (Peng et al., 2021; Sun et al., 2022). Deep learning techniques possess advantages in extracting discriminative features and establishing big data variables (Pouyanfar et al., 2018). Lv et al. (2018) and Sun et al. (2022) also confirmed stacked autoencoder (SAE) to be a powerful generalization of PCA.
Web traffic data
Tourists often search for information by visiting the websites of destination marketing organizations (DMOs) when planning trips (Gunter & Önder, 2016). These websites’ traffic reflects tourists’ preferences and consumption intentions. Such traffic has been applied to tourism forecasting in three studies. Y. Yang et al. (2014) took the lead in using web traffic data from a DMO website to forecast hotel room demand, measured by occupancy rates and room nights, in Charleston, South Carolina. Gunter and Önder (2016) employed 10 Google Analytics website traffic indicators (e.g., average session duration, average time on page, bounce rate) to develop forecasts in Vienna, Austria. Pan and Yang (2017) adopted multiple sources of big data including search engine queries, local tourism website traffic data, and weather data, to construct a forecasting model; however, including different data sources did not substantially improve forecasting accuracy.
Social Media Statistics
Social media statistics are a core form of user-generated content available from microblogs, social networking sites, and other social media platforms. These statistics have been frequently used in tourism research. Their application in tourism forecasting studies remains rare by comparison; this study’s sample contained only eight examples. The social media statistics appearing in tourism and hospitality forecasting cover several sources: (1) social media metrics from Facebook, WeChat, Douyin, Weibo, or Twitter (e.g., number of posts, views, comments, likes, and forwards; Gunter et al., 2019; Önder et al., 2020; Qiu, Liu, et al., 2021; Tian et al., 2021); (2) online social interaction statistics on TripAdvisor (e.g., number of social network links, average response time; Colladon et al., 2019); and (3) travel review counts or review ratings on Booking.com and TripAdvisor (Antonio et al., 2019; Khatibi et al., 2020) or Ctrip and Qunar (H. Li, Hu, & Li, 2020). Gunter et al. (2019) and Önder et al. (2020) discovered that Facebook likes can help explain tourism demand at various destinations. Both studies took Facebook likes as leading indicators. Qiu, Liu, et al. (2021) adopted Twitter post frequency to measure crisis severity. Results revealed that social media coverage (as indicated by tweet count data) led to more adaptable modeling and enhanced forecasting accuracy.
Review data have also been used as supplementary predictive variable sources, albeit only for quantitative statistics or rating thus far (Khatibi et al., 2020). H. Li, Hu, and Li (2020) attempted to integrate review data from Ctrip and Qunar with the Baidu index to construct forecasting models. Forecasting performance was found to improve when using data from multiple platforms. Hu et al. (2022) used the SARIMA–MIDAS model, incorporating review volume and ratings to forecast international tourist arrivals to Hong Kong. They observed that tourism predictions involving review data could strengthen forecasting accuracy.
The preceding discussion indicates that web search data or social media statistics can increase forecasting performance. However, few studies have explored the joint effects of these two forms of tourism-related big data; Colladon et al. (2019), Gunter et al. (2019), H. Li, Hu, and Li (2020), and Tian et al. (2021) stand as notable exceptions. Efforts have typically pertained to structured big data with far less exploration of unstructured big data such as text or photos. Scholars should consider these in hotel and tourism forecasting as well. Furthermore, because collinearity or overfitting issues can arise when including a large number of big data variables in the modeling process, the question of how to process different big data sources requires closer attention. It is also necessary to determine the lead or lag orders between these variables and actual demand.
Online Textual Data
Researchers have performed text content analysis of online textual data to discern users’ perceptions and anticipate their needs in a timely manner (Ghose & Ipeirotis, 2010; Xu & Li, 2016). Yet, these data have seldom been used in tourism and hospitality forecasting. The online textual data featured in tourism and hospitality forecasting thus far have consisted of news media coverage and user-generated text (Colladon et al., 2019; Önder et al., 2019; D. C. Wu, Zhong, et al., 2022).
Sentiment analysis can divulge users’ perceptions by transforming online textual data into sentiment categories (i.e., positive vs. negative). Sentiment index construction is currently one of the most common methods used to apply text information to forecasting, and has been proved effective in product sales forecasting, unemployment rate forecasting, and stock market fluctuation forecasting (Fan et al., 2017; Nti et al., 2020; Rambaccussing & Kwiatkowski, 2020). Within the tourism and hospitality industry specifically, six studies have applied textual sentiment information to tourism and hospitality forecasting. Online news outlets’ sentiments about a destination shape individuals’ travel decisions as well. Önder et al. ( 2019) were the first to evaluate the sentiment of online news coverage—extracted via automated semantic algorithms—in tourism demand forecasting. Including web sentiment indicators resulted in performance improvements. Starosta et al. (2019) further verified the relationship between online news sentiment and tourist arrivals. Additionally, user-generated textual data mining can assist tourism and hospitality practitioners in understanding and anticipating tourists’ preferences. However, at present, few studies have utilized these opinion-rich resources, such as online reviews, to project tourism and hospitality demand. Colladon et al. (2019) collected travel forum data, which included review text, to create predictions. They attempted to use social network analysis and semantic analysis to explore the predictive potential of user-provided reviews, and confirmed that sentiment-based textual data are suitable supplementary variables for forecasting. Ampountolas and Legg (2021) analyzed textual data from social media platforms such as Twitter and SocialMention to capture tourists’ sentiment information. Incorporating textual sentiment data into the forecasting framework was shown to increase the forecasting accuracy. More recently, D. C. Wu, Zhong, et al. (2022) extracted sentiment from tourists’ hotel reviews and noted that the three constructed sentiment indices (i.e., a bullish index, an average index, and a variance index) heightened hotel demand forecasting accuracy. Similarly, Chang et al. (2021) used review sentiment and ratings to forecast hotel occupancy rates in Taiwan. Combining a long short-term memory (LSTM) model with review sentiment analysis led to promising outcomes in hotel demand prediction.
The extraction of sentiment indicators has become a common practice in demand forecasting. The advancements in computer science have led to the development of deep learning models that are appropriate for sentiment analysis (Chang et al., 2021). Some of these deep learning models, such as CNN and RNN, have been utilized to determine emotional polarity (Priyadarshini & Cotton, 2021; Sun et al., 2017). Among these methods, LSTM has the advantage of being able to process sequences of any length and to learn the time dependence from the data through cell states (Hochreiter & Schmidhuber, 1997). Compared with a standard RNN, LSTM has a better memory storage capacity, and can prevent the issue of the gradient explosion or gradient disappearance. Additionally, LSTM can assimilate the leading or lagging order as the environment changes, making it highly suitable for processing sequential data (Bi et al., 2020). Future tourism and hospitality forecasting studies can harness these methods to extract sentiment information from online textual data.
Apart from sentiment analysis, text analysis methods including topic modeling (X. Li, Wu, & Mai, 2019) and latent semantic analysis (Xu & Li, 2016), have been applied to process textual data. Practitioners can use the extracted topics to infer tourists’ varied needs. Research along this line has generally focused on overall sentiment scores per review, overlooking myriad review-based details (Wang et al., 2017). More granular sentiment analysis, such as joint sentiment-topic analysis (X. Li, Wu, & Mai, 2019), could facilitate the construction of multidimensional demand variables for forecasting. Latent Dirichlet allocation (LDA) is a popular topic modeling algorithm (Blei et al., 2003; Guo et al., 2017) that deserves greater attention given its ability to identify and extract valid topic information to anticipate individuals’ needs. In summary, the predictive ability of text topic information extracted from online textual data warrants careful exploration. Relatedly, Park et al. (2021) used online news to forecast tourist arrivals in Hong Kong. They employed structural topic modeling (STM) to identify key topics and then used ARIMAX to assemble forecasts. The integration of online news topic data improved the forecasting accuracy. Y. Chen et al. (2023) further verified the influence of news on tourism demand using the LDA model. LDA was applied to identify the most frequent news topics and their interpretations. The results of topic word correlation analysis indicated that positive topics can influence the number of tourist arrivals at specific destinations. Moreover, with the passage of time, the text keywords under the same topic may change. The parameters of the topic model and the distribution of topics for each document also vary over time. Therefore, the dynamic topic model (Blei & Lafferty, 2006), which partitions textual data in terms of time slices, deserves further investigation.
Sentiment analysis and topic modeling techniques are two primary methods for converting unstructured textual data into structured prediction data. However, a lack of a forecasting application framework for collecting, processing, and mining online textual data exists. Therefore, determining how to effectively extract sentiment and topic information from online texts for tourism and hospitality forecasting is a key area of research for both scholars and industry practitioners.
Online Photo and Video Data
Growth in information technology has spurred the multiplication of photograph-sharing platforms such as Flickr and Panoramio. These sites offer scholars a vast amount of online photo data from travelers. According to H. Li, Zhang and Hsu (2023), visual content has become a vital aspect of sharing travel experiences. User-generated photo data has been widely utilized in tourism and hospitality research, focusing on four primary categories of topics: sharing motivation, destination image, spatiotemporal behavior, and influential effect. However, these data are rarely utilized in tourism and hospitality forecasting.
According to the studies of users’ spatiotemporal behavior based on user-generated photo data, tourists’ digital trajectories can be captured to depict travel paths (Önder et al., 2016). Önder et al., (2016) pointed out that user-generated photo data served as explanatory variables of tourism demand. Relatedly, Mou et al. (2020) scrutinized the correlation between photo data and tourism demand. Their Flickr-based analysis of tourist flows’ spatiotemporal distribution and changes revealed that geotagged photo metadata from Flickr can serve as an alternative data source in tourism forecasting. However, the use of online photo data in tourism forecasting has so far been limited to photo metadata, including geographic information and temporal features. Few studies have investigated the utility of visual photo content in tourism demand analysis. Specifically, Orsi and Geneletti (2013) were the first to use geotagged photographs to estimate tourist flows through a gravity model. They observed that geotagged photos could provide valuable information about tourists’ movements. Miah et al. (2017) employed photo data from Flickr to investigate tourists’ perceptions, proposing a density-based clustering approach to extract information from photo data for tourism forecasting. W. Chen et al. (2019) then used geotagged photo metadata from Flickr to develop several methods to create a model for predicting inbound tourist flows. They processed photo metadata using text analysis and clustering analysis to obtain predictive variables, contributing to satisfactory prediction accuracy.
Online photo data, as a relatively new type of reliable and low-cost information, can helpfully inform tourism projections, among which there are two types of data/attributes that can be further explored and applied, namely photo metadata and photo content (C. Li, Kwok et al., 2023). Photo metadata consists of geographic coordinates, upload time, and tourist information, among other things, while photo content encompasses landscape, theme, semantics, and other features. Although metadata applications have become widespread, the actual content of individual photos contains dense information that can aid in tourism prediction. Recently, deep learning methods like convolutional neural networks have achieved significant success in image recognition (Samani et al., 2018). It is essential to investigate how visual variables from photo content, rather than photo metadata, can aid in tourism prediction. However, photo content always includes unstructured features, necessitating the use of sentiment analysis, topic clustering analysis, deep learning, reinforcement learning, and other techniques to transform the data structure for tourism forecasting.
Social media videos, such as those found on YouTube and Bilibili.com, have become a significant source of tourism and hospitality research. Interactions with other viewers while watching the video lead to comments being posted, which are interesting and informative, providing insight into how the public responds to the video (Khan, 2017; Thelwall, 2018). Sentiment analysis and topic modeling analysis are useful tools for analyzing video text, as are association mining methods or word associations (Carvache-Franco et al., 2023). Similar to online photos, the content of videos, including perspective, color, definition, and other aspects, contains rich information that can guide tourism prediction in addition to the video’s text data. Videos with informative content are highly credible and contain information shared by tourists, potentially shedding light on the impact of videos on tourist demand (Ranga et al., 2023). Therefore, the application of online photo and video data in tourism and hospitality forecasting is feasible and deserves further exploration.
Development of Forecasting Techniques Along With Big Data
Traditional Tourism and Hospitality Forecasting Techniques
Time series models, econometric models, and AI-based models have dominated tourism and hotel demand forecasting (D. C. Wu et al., 2017). Time series models generate forecasts by extrapolating historical tourism demand series, such as naïve models, exponential smoothing models, autoregressive moving average (ARMA) models, and others (Burger et al., 2001; C. M. Ramos & Rodrigues, 2014; D. C. Wu et al., 2017). These models are simple and direct, producing relatively accurate predictions (Athanasopoulos et al., 2011). They are therefore often used as benchmarks in tourism and hospitality forecasting.
Econometric approaches have been adopted to explore the relationship between tourism demand and traditional economic variables (Song & Li, 2008; Song & Witt, 2012; D. C. Wu et al., 2017). Widely used options are the ADL model (Shen et al., 2008), error correction models (Song & Witt, 2006), vector autoregression (VAR; Song & Witt, 2006), time-varying parameter models, and spatiotemporal econometric models.
AI-based models possess advantages in terms of capturing nonlinear components (K. Y. Chen & Wang, 2007; Hu & Song, 2020; Law et al., 2019); examples include ANNs, SVR, deep learning, fuzzy system methods, forest trees, and ensemble models. AI-based methods can boost forecasting accuracy but cannot theoretically justify the relationships between tourism demand and other variables (Song & Li, 2008).
Big Data-Based Tourism and Hospitality Forecasting Techniques
In tourism and hospitality forecasting, big data have permeated multiple time series models, econometric models, AI-based models, and other advanced prediction techniques. Many studies have applied ARMA family models (e.g., autoregressive integrated moving average with explanatory variables [ARIMAX]) to predict tourism and hospitality demand using big data (Choi & Varian, 2012; H. Li, Hu & Li, 2020; Önder & Gunter, 2016; Y. Yang et al., 2014), namely by integrating big data variables in ARIMA models to develop forecasts. The ADL model and VAR model are other common econometric options in this regard (Gunter & Önder, 2016; Gunter et al., 2019; X. Huang et al., 2017; S. Li, Chen, et al., 2018). However, it should be mentioned that big data forecasting methods need to pay attention to the following problems: the processing of mixed-frequency data, the identification of nonlinear characteristics, the curse of dimensionality, and the noise problem.
Mixed-frequency forecasting with big data
Compared with economic variables, big data are usually available in real time and for free (D. C. Wu et al., 2017). They are also often generated at a high frequency (e.g., daily or weekly), whereas tourism demand data and other economic determinants tend to be aggregated on a monthly, quarterly, or annual basis. Scholars have typically transformed big data to match the frequency of tourism demand series (Choi & Varian, 2012; S. Kim & Shin, 2016; Rivera, 2016; Wen et al., 2019) during modeling and forecasting. However, this approach often results in the loss of valuable information.
High-frequency information is frequently overlooked in tourism and hospitality forecasting, but there are a few hotel forecasting studies that utilize daily data to capture as much high-frequency information as possible (e.g., L. Huang & Zheng, 2023; L. Pereira & Cerqueira, 2022). With the application of big data, Bangwayo-Skeete and Skeete (2015) innovatively applied the MIDAS model to integrate weekly Google data and forecast low-frequency tourism demand in Caribbean destinations. Their MIDAS-based models displayed superior prediction abilities, as evidenced by lower RMSE and MAPE scores, compared to other forecasting methods. Since then, several studies have used this technique to model tourism demand (Gunter et al., 2019; Havranek & Zeynalov, 2021; H. Liu, Liu et al., 2021; Önder et al., 2019, 2020; Volchek et al., 2019), and Wen et al. (2020) proposed a novel model that combined MIDAS and SARIMA to forecast Hong Kong tourist arrivals from mainland China using big data. Their proposed MIDAS–SARIMA model outperformed traditional MIDAS models as well as benchmarks.
However, most existing studies focus on long- and medium-term tourism and hospitality forecasting, and it is becoming increasingly necessary to extract high-temporal-resolution information in a short period of time. Recently, the United Nations Educational, Scientific, and Cultural Organization (UNESCO) World Heritage Sustainable Tourism Toolkit emphasized the importance of understanding fluctuations in tourist numbers throughout the day, and thus the forecast time granularity should be raised above the daily level to reflect daily changes in tourist volume. To address this issue, V. Ramos et al. (2021) applied WIFI data to conduct high-frequency, short-term forecasting with frequencies fine-tuned to minutes, and Lu and Xie (2023) used Location-based services (LBS) data offering fine time resolution in hours to achieve high-frequency crowd forecasting. However, the MIDAS model has not been applied to high-frequency short-term big data tourism and hospitality forecasting research with frequencies fine-tuned to within days, which is worth further exploration.
AI-based models with big data
AI-based models, which can deftly deal with nonlinear components of the tourism and hospitality system, have also been used for big data tourism and hospitality forecasting (Xie, Qian & Wang, 2021). Jackman and Naitram (2015) proposed Google-based SVR to forecast demand in the Caribbean island of Barbados. They compared their model with the benchmark AR–SVR, verifying the predictive power of web search data. B. Zhang, Huang, et al. (2017) introduced an intelligent model combining an SVR model with the bat algorithm to forecast tourist volume by integrating Baidu search engine data. Their hybrid model effectively captured nonlinear characteristics and enhanced forecasting accuracy. Sun et al. (2019) developed a kernel extreme learning machine model integrating tourist volume series, the Baidu index, and the Google index. Results demonstrated that including web search data improved forecasting performance. However, AI-based models are not always superior to other forecasting models. Volchek et al. (2019) used time series models, econometric models, and ANN models with web search indices to forecast visitation counts to five London museums. No model appeared to consistently outperform others. By combining linear and nonlinear features of tourism-related big data, hybrid models have been confirmed to forecast tourism demand well. Wen et al. (2019) integrated ARIMAX and ANN models to explore a hybrid’s model predictive ability. They took the ARIMAX results in the first stage as input for the ANN model, which can capture linear and nonlinear features. The hybrid model ultimately generated more accurate forecasts than either individual model alone.
Deep learning models and ensemble learning methods with big data
Practical challenges have also emerged as the number of potentially predictive variables increases. The majority of available models struggle to train data containing an excessive number of explanatory factors (Guyon & Elisseeff, 2003). Meanwhile, the performance of deep learning methods rises logarithmically with larger samples (Salamanis et al., 2022; X. Zhu et al., 2016). Approaches such as LSTM have thus been adopted to extend ANN models with more than two nonlinear processing layers to bolster the models’ predictive power and discern nonlinear features (Law et al., 2019; V. Ramos et al., 2021; B. Zhang, Li, Shi, & Law, 2020; B. Zhang et al., 2019). Bi et al. (2020) clearly described LSTM networks and laid a foundation for their use in tourism demand forecasting. Y. Zhang, Li, Muskat, et al. (2020) devised a novel group-pooling-based deep learning model to address the challenge of limited training data and to improve forecasting accuracy: they incorporated the seasonal and trend (STL) decomposition method with dynamic time warping clustering to generate pooled tourism demand data by group. Their effort alleviated the constraint of limited data availability.
Tourism-related big data reflect a bevy of influential factors that may influence tourism demand. An increase in the number of potential features leads sample data to become sparse, eventually resulting in the curse of dimensionality (Law et al., 2019). The presence of many explanatory variables also heightens model complexity; large variance and overfitting can occur as a result (Y. Zhang, Li, Muskat, et al., 2020; Y. Zhang et al., 2021). Ensemble techniques like Bagging and Boosting have been applied in big data tourism and hospitality forecasting to reduce prediction variance (e.g., Ampountolas & Legg, 2021; Antonio et al., 2019). Ensemble learning involves combining multiple basic learning models to make decisions, as the errors of individual learners can be compensated by other learners to achieve better accuracy. The overall forecasting accuracy of ensemble models is often better than that of a single learner, which is sometimes referred to as the swarm intelligence of machine learning (Sagi & Rokach, 2018). Ampountolas and Legg (2021) proposed a segmented machine learning gradient boosting approach using social media data to predict hotel occupancy, which achieved highly precise estimates. Sun et al. (2022) developed a bagging-based multivariate ensemble deep learning technique to forecast tourist arrivals in Beijing from four countries, which solved the overfitting problem and improved forecasting accuracy.
However, these models require hyper-parameter optimization in the training process to balance the bias and variance of the models, in order to improve performance. Traditionally, parameter adjustment methods have been characterized by randomness and uncertainty, including manual parameter adjustment, grid or random search methods, and Bayesian optimization. Nonetheless, the forecasting performance of deep learning and ensemble methods is often unstable, as there is no definite standard for selecting hyper-parameters. Therefore, further discussions on issues related to parameter adjustment of these models are necessary to facilitate their effective application in tourism and hospitality forecasting.
Other advanced forecasting techniques
Given that online big data can refine forecasting performance (X. Li et al., 2017; Pan et al., 2012; X. Yang et al., 2015), researchers must identify which components of tourism-related big data most powerfully improve prediction. Noise constantly creates interference in big data and tourist volume data, which may produce misleading forecasts. Decomposition has thus been introduced into big data tourism and hospitality forecasting to ensure the reliability and validity of predicted data.
Decomposition methods reduce model complexity and boost forecasting accuracy (C. Li, Ge, et al., 2020; Y. Zhang, Li, Muskat, et al., 2020; G. Zhang, Wu, et al., 2017; Y. Zhang et al., 2021). X. Li et al. (2016) proposed a model called composite leading search index (CLSI)–Hilbert–Huang transform (HHT) to deal with the aforementioned noise problem. The authors analyzed the predictive ability of the Baidu search index with de-noising by HHT, demonstrating that the proposed CLSI–HHT model was significantly superior to benchmarks. Tang et al. (2020) likewise developed a novel methodology—bivariate empirical mode decomposition—to extract common factors from series data on tourist volume and Baidu’s search engine to predict tourism demand. X. Li and Law (2020) applied an ensemble empirical mode decomposition-based method that enhanced the performance of empirical mode decomposition by adding white noise to facilitate signal extraction when forecasting tourist arrivals from nine countries to Hong Kong. The proposed method was superior to an autoregressive model with explanatory variables when tackling under-composed search engine data.
Apart from decomposition methods, combination methods can also functionally improve tourism and hospitality forecasting accuracy (G. Li, Wu, Zhou, & Liu, 2019). Importantly, empirical evidence suggests that no single model universally outperforms all others (Song & Li, 2008; D. C. Wu et al., 2017). Qiu, Liu, et al. (2021) made an initial attempt to use simple averaging to combine three forecast models (ARIMAX, exponential smoothing with explanatory variables, and seasonal and trend decomposition using Loess with explanatory variables) in big data demand forecasting. Their forecasting framework was deemed suitable for hotel demand prediction during times of social unrest.
Discussion
The proliferation of information technology has generated various types of big data that are pertinent to research in tourism and hospitality. However, the utilization of big data in tourism and hospitality forecasting is still in its early phase. Through an examination and critique of current research, this study highlights five research questions and trends that require careful consideration, including the lack of theoretical foundation, the rise of high-frequency forecasting research, less attention to unstructured data, the necessity of dynamic data analysis in forecasting, and the construction of a tourism and hospitality demand information system based on cloud computing. Particularly in the realm of theoretical foundations, a substantial portion of forecasting research fails to elucidate the fundamental principles behind utilizing big data for predictions or to clarify why incorporating big data can enhance prediction accuracy. These studies are primarily driven by data, and they only attribute positive results to the inclusion of big data in predictions when the data demonstrates favorable outcomes.
Issues of Theoretical Explanation for the Forecasting Application of Big Data
Owing to the nature of being data-dominated, theoretical underpinnings for leveraging big data in tourism and hospitality forecasting are noticeably absent from the discourse. Mention of the theoretical foundation is limited to only two empirical studies (B. Zhang, Huang et al., 2017; Zhao et al., 2019). As a result, the rationality of applying big data to tourism and hospitality forecasting remains largely unexplored and requires further analysis. Instead, attention is focused on methodology, including different data types, big data analysis methods, and big data forecasting techniques. The question of how big data-driven tourism and hospitality forecasting research can advance theories remains.
In the light of neoclassical economic theory, tourists’ income and tourism prices are two critical factors that affect tourism and hospitality demand (D. C. Wu et al., 2017). Other traditional influencing factors include transportation cost, seasonality factor, and happenstance. Tourism and hospitality forecasting studies typically rely on these data to construct forecasting models. However, with the rapid advances in internet technology, users’ behavior is increasingly influenced by web search data, online ratings, and textual reviews (H. Li, Hu, & Li, 2020). These big data can record and monitor users’ behavior, revealing users’ behavioral tendencies and destination choices in real-time. Traditional economic theory faces difficulties in providing theoretical support for how these data affect tourism and hospitality demand and explain the changing needs of tourists. Recently, big data has emerged as a viable alternative for enhancing forecasting performance. Existing studies have confirmed the predictive power of big data (Bangwayo-Skeete & Skeete, 2015; Khatibi et al., 2020; Pan & Yang, 2017). However, the rationale for using big data in tourism and hospitality forecasting remains unclear. Although big data has been widely applied in this area, most empirical studies rarely discuss the theoretical foundation and economic implications of big data used in tourism and hospitality forecasting (Song et al., 2019). Therefore, it is essential to understand how big data can affect tourism and hospitality demand and why the forecasting accuracy can be improved by incorporating tourism-related big data into forecasting models.
By combing theoretical articles from the fields of psychology, communication, and information processing, this study has summarized and extracted the theoretical perspectives that can be applied to big data tourism and hospitality forecasting. Compared to some classic literature reviews on tourism-related big data, the unique contribution of this study is the introduction of multiple theories from a multidisciplinary perspective to explain the rationality of applying different types of big data to tourism and hospitality forecasting.
The theoretical perspectives introduced in this study include signaling theory, social learning theory, information search behavior theory, emotional contagion theory, and media richness theory. Based on a multidisciplinary integration perspective, we propose a theoretical framework for big data tourism and hospitality forecasting (see Figure 3).
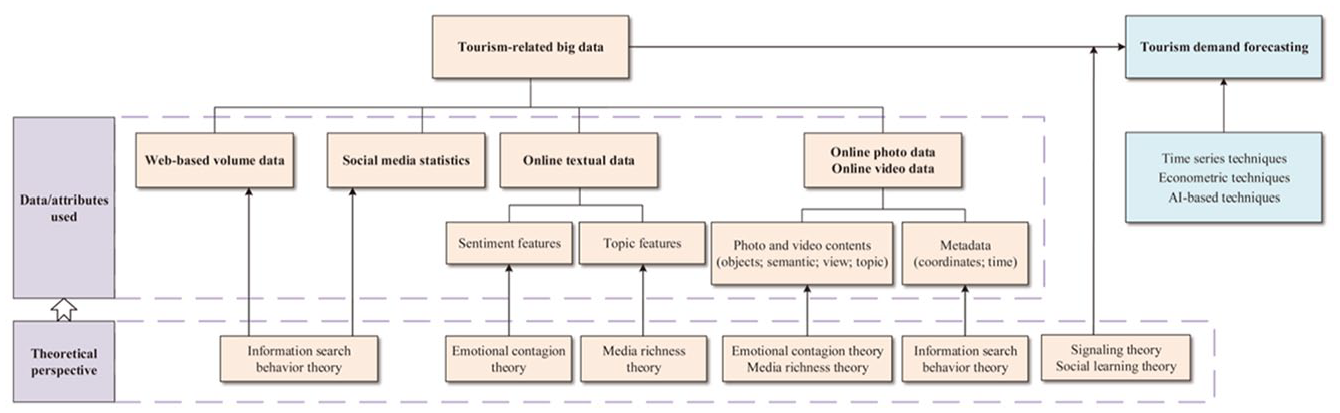
Theoretical Framework of Big Data Tourism Forecasting.
Signaling Theory (Spence, 1978) describes the transmission of signals between two parties when one party has more information than the other (Connelly et al., 2011). Within the tourism and hospitality industry, service providers offer many intangible and perishable products, which can cause information asymmetry about quality between service providers and tourists. Signaling theory is used to explain this mechanism, which identifies three major elements in the process of signal transmission: signaler, signal, and signal receiver (Spence, 1978). The signal receiver is the individual who lacks information and is keen to receive signals to assist in decision-making. In the context of tourism and hospitality, tourists act as signal receivers (Basuroy et al., 2006) and benefit from purchasing goods and services associated with high-quality signals. With the increasing use of information and communication technology, tourists rely on online information, such as tourism-related big data, to mitigate the impact of information asymmetry (Zhao et al., 2019). In accordance with Signaling Theory, tourism-related big data providers act as signalers, where big data serves as signals that tourists want to obtain, influencing their behavioral and decision-making intentions.
Social Learning Theory (Bandura, 1978) is highly valuable in understanding the interactive behaviors of tourists participating in online social platforms. This theory posits that cognition, behavior, and environment are generated through social interaction. Social Learning Theory highlights the importance of observational (vicarious) learning (Bandura, 1977). Observational learning refers to learning by observing the behavior of others, which can impact individual behavior in numerous ways, with both positive and negative consequences (Bandura, 1978; Y. B. Chen et al., 2011). According to Observational Learning Theory, individuals observe and learn the information and behaviors they seek based on psychological motivation, and then apply the learning for their own purposes (Bikhchandani et al., 2021). In the tourism and hospitality industry, tourism motivation empowers potential tourists to gain indirect experiences through online social communication. In order to make informed travel choices, they proactively engage in online activities such as searching, commenting, rating, liking, and others to acquire the desired information.
Drawing upon both Signaling Theory and Social Learning Theory, it can be observed that tourism-related big data has an impact on tourists’ travel decisions and behaviors (Z. Huang & Benyoucef, 2013), which supports the application of big data in the field of tourism and hospitality demand forecasting.
Specifically, information search behavior is a crucial component of the decision-making process for users in the digital era (Fodness & Murray, 1998; Gursoy & McCleary, 2004). According to the EBM model, before making a decision, tourists first identify their own demands, and then employ various online social media platforms to search for relevant information (Teo & Yeong, 2003). Compared to traditional information search methods, an online information search not only saves time and resources for users, but also provides more trustworthy information. Search engines are pivotal tools that users use to search for travel-related information and conduct online transactions (X. Yang et al., 2015). Online social media platforms offer users pertinent statistics, planning assistance, and even trip suggestions from other visitors (Hu & Song, 2020). Web-based information search behavior theory complements tourism and hospitality demand forecasting through the use of web-based volume data and social media statistics (Z. Huang & Benyoucef, 2013). Additionally, the metadata of online photo and video data is also an important data type for tourist information searches.
Emotional contagion theory (Hatfield et al.,1993) asserts that individuals’ positive and negative emotions can be stimulated by reading or observing the experiences of others (Sciara et al., 2021). Kramer et al. (2014) further suggest that emotional contagion can take place even in the absence of face-to-face interaction, such as interactive infections on online social media. Combining this theory with Signal Theory, it can be said that online textual data, photos, and videos transmit emotional signals to potential tourists, and the emotional signals shared by others can influence their potential consumption behavior.
Media richness theory (Daft & Lengel, 1986) believes that information media with high richness are the first to be accepted in the processing of complex decision tasks. With the rise of information technology, consumers no longer rely solely on high-richness information media, such as face-to-face interactions, to make quick decisions. The internet—an information medium with high information richness—has become the preferred channel (Maity et al., 2018). The abundance of information also impacts the tourist experience, such as when booking accommodations (C. Chen & Chang, 2018). Multiple cues are a vital aspect of MRT theory, enabling the reduction of uncertainty and ambiguity (Daft & Lengel, 1986). Drawing on MRT theory, texts, expressions and photos released in online social media are new forms of information richness in the information age, among which tourists pay more attention to rich topic and semantic cues in online tourism-related data.
This study explains the mechanisms behind the application of big data in tourism and hospitality demand forecasting through the integration of theories from multiple fields, resulting in the development of a theoretical framework for big data tourism and hospitality forecasting. Signaling theory and social learning theory support the utilization of big data analysis in tourism and hospitality demand forecasting. Meanwhile, Information Search Behavior Theory, Emotional Contagion Theory, and Media Richness Theory support the forecasting application of five specific tourism-related big data types. The theoretical framework proposed in this study can provide theoretical guidance for the use of big data in tourism and hospitality forecasting research. Future research should strengthen the theoretical connection while carrying out forecasting practice.
Research Trends in High-Frequency Forecasting
In the domain of tourism and hospitality management, previous research has predominantly focused on long- or medium-term predictions of tourism and hospitality demand, aiming to capture the overall trend of tourists’ behavior over time. While these studies are valuable for understanding long-term patterns, they are inadequate for providing high-resolution information necessary for short-term decision-making, such as hourly fluctuations. Recognizing the importance of short-term forecasts, some researchers have conducted studies in this area; however, there remains a notable scarcity of accurate short-term forecasts, particularly ones that can depict intraday fluctuations convincingly (Lu & Xie, 2023; V. Ramos et al., 2021). The increasing adoption and application of 5G networks and diverse tourism apps have generated growing interest in leveraging high-frequency big data for forecasting purposes. A burgeoning area of research focused on high-frequency forecasting has garnered attention, illustrating how such data can be harnessed for tourism demand analysis (L. Huang et al., 2022). Moreover, the UNESCO World Heritage Sustainable Tourism Toolkit has recently stressed the significance of understanding fluctuations in tourist numbers at different times of the day (Lu & Xie, 2023).
In the current tourism and hospitality environment, characterized by high levels of uncertainty, it is essential to extract high-temporal-resolution information within a short period of time to enhance the tourist experience. High-frequency forecasting enables precise predictions as short as a day, providing more detailed information about visitor arrivals to tourist destinations and hotels (Y. Li et al., 2022; V. Ramos et al., 2021). It specifically highlights changes in tourist numbers in the shortest possible time, providing crucial information for short-term decision-making in the tourism and hospitality industry. Indeed, there is still potential to expand the utilization of high-frequency short-term forecasting in tourism and hospitality research. Further research can explore the application of different types of data sources or forecasting models to improve the accuracy of short-term predictions. Furthermore, the integration of short-term forecasting into daily tourism and hospitality management can enhance the industry’s resilience to external shocks and contribute to sustainable tourism and hospitality development.
Application of Unstructured Big Data in Tourism and Hospitality Forecasting
Various types of big data offer innovative ways to advance tourism and hospitality forecasting research. While structured big data is extensively studied, unstructured big data such as text, photos, and videos have received less attention. Recent developments in machine learning techniques have enabled the conversion of such data into numerical variables, enhancing forecasting performance. Further exploration of these forms of data can lead to more accurate and reliable tourism and hospitality predictions.
Online textual data contain a wealth of emotional and thematic information that can enhance the accuracy of tourism and hospitality predictions based on emotion contagion theory and information richness theory. However, there is a lack of forecasting frameworks for the collection, processing, and mining of online text data. The effective extraction of sentiment and topic information from online texts for tourism and hospitality forecasting is an essential area of research for both academics and industry practitioners. To address this gap, researchers have synthesized the progression of text-based forecasting and constructed an application framework for tourism and hospitality forecasting based on online textual data (see Figure 4).
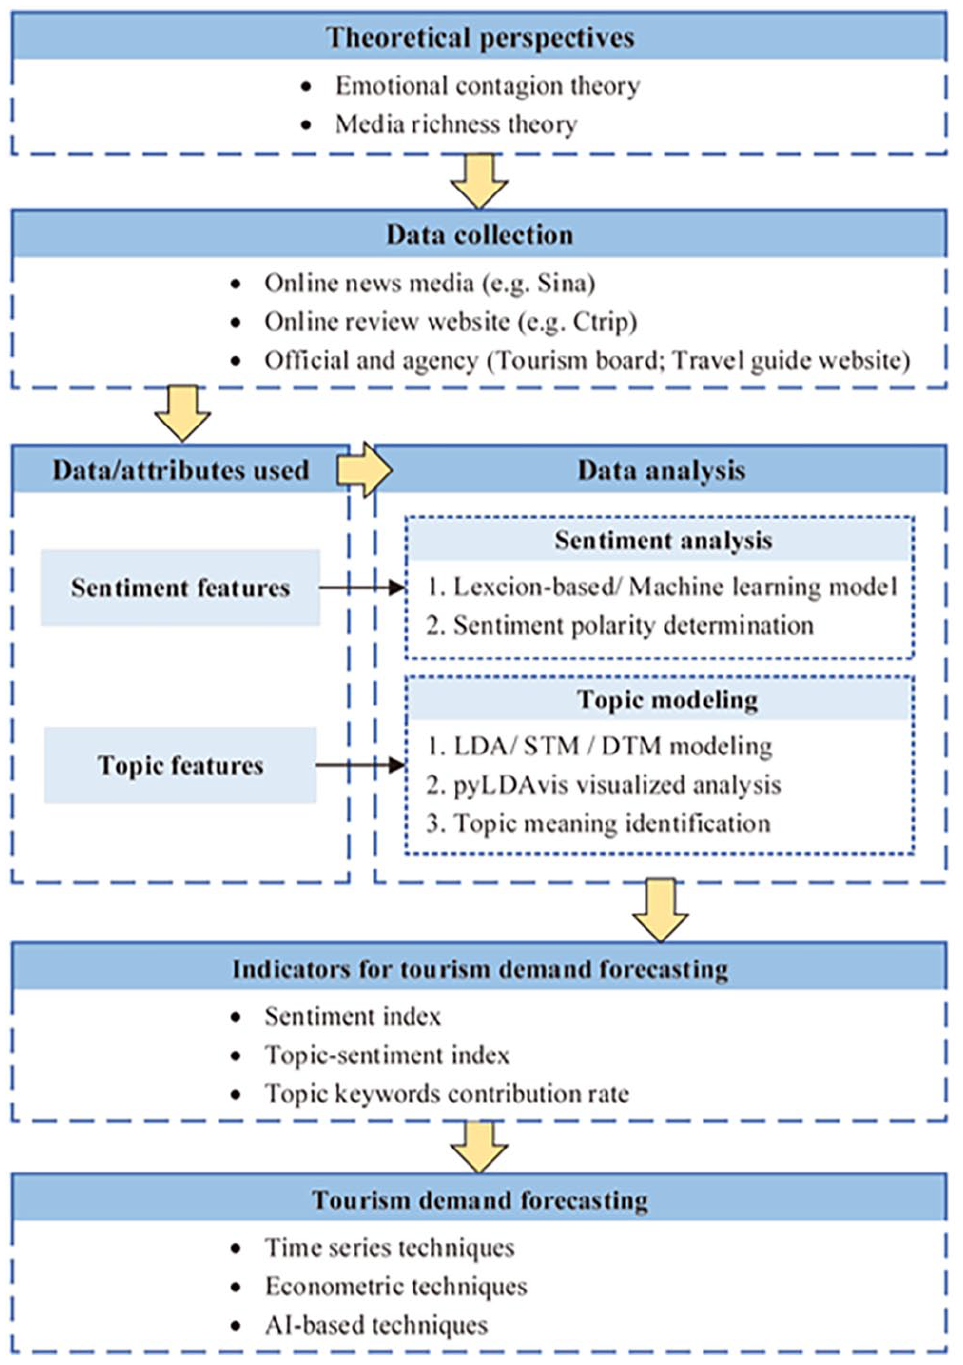
Forecasting Application Framework of Online Textual Data.
As images are delivered directly to the brain, we can process visual information more directly than text information, requiring fewer cognitive resources to process it (C. Li, Kwok, et al., 2021). Scholars have recognized the value of visual information in tourism and hospitality demand analysis (Balomenou & Garrod, 2019). User-generated photo data can serve as explanatory variables for tourism and hospitality demand, particularly in relation to tourist’ spatiotemporal behavior based on such data (W. Chen et al., 2019; Önder et al., 2016). Two types of data/attributes that can be further explored and applied are photo metadata and photo content, as highlighted by C. Li, Kwok et al. (2023). Furthermore, comments and feedback posted on videos can provide valuable insights into how the public reacts to video content (Thelwall, 2018). Videos with informative content that are shared by users can help to identify the impact of video content on users’ demand (Ranga et al., 2023). Hence, exploring the effective use of online photo and video data for tourism and hospitality forecasting poses a promising research avenue. This study synthesized the current application progress of online photo and video data in tourism and hospitality research and constructed the process framework of their application in tourism and hospitality forecasting (see Figure 5).
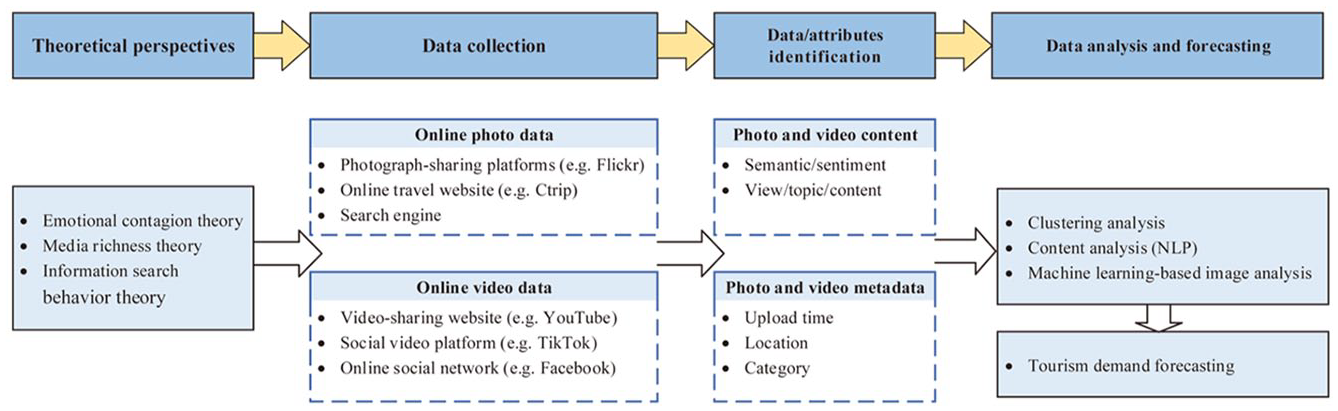
Forecasting Application Process of Online Photo and Video Data.
Dynamic Data Analysis in Big Data Tourism and Hospitality Forecasting
Tourism and hospitality demand is characterized by dynamic changes, where tourists’ attention to online textual, photo, and video data evolves over time in a complex manner. In uncertain and rapidly changing environments, the response time of the tourism and hospitality industry may fall short, ultimately affecting the tourist experience, such as the negative emotions caused by the occurrence of sudden public health events (Y. Yang et al., 2021). Therefore, it is crucial to monitor changes in tourists’ sentiments and topic attention in real-time to enable the industry to take appropriate measures.
Existing research on topic and sentiment analysis of online textual data has not adequately considered temporal dynamics, which makes it challenging to segment and extract information from different time periods of textual data. This is especially relevant given the outbreak of the COVID-19 pandemic in 2020, which triggered significant changes in tourist behavior and demands, resulting in new psychological shadows influencing tourism and hospitality experience requirements (B. Wu, Wang, & Zeng, 2023). Real-time disclosure of textual comments enables the capturing of tourist demand under such dynamic conditions. However, previous text extraction methods have been limited in their ability to capture real-time fluctuations in demand changes (Guo et al., 2017). While these methods could extract sentiment and topic information reflected in all texts during the same period, they were not well suited to capture the inherent volatility and nuance of tourism and hospitality demand (Bi et al., 2019). Dynamic topic model (DTM; Blei & Lafferty, 2006) and dynamic important-performance analysis (DIPA; Bi et al., 2019) are powerful methods that capture time-dependent changes in tourists’ experience elements, enabling the tracking and identification of changes in tourists’ emotions and topic attention over time. By analyzing the dynamic changes in tourists’ sentiment and topic attention, tourism and hospitality practitioners can adjust their marketing strategies in real-time to meet the changing needs of tourists and improve their overall experience. Similarly, dynamic analysis methods should also be applied to extracting content from online photo and video data. By analyzing the temporal changes in the content of online photos and videos, we can gain insights into the evolving preferences and interests of users. This can help tourism and hospitality practitioners to better understand the needs of their target audience and tailor their marketing strategies accordingly. For example, if there is a sudden increase in the number of photos and videos related to outdoor activities, tourism and hospitality practitioners can adjust their marketing strategies to promote outdoor activities and attract more outdoor travel enthusiasts.
Cloud Computing in Tourism and the Hospitality Demand Information System
The implementation of cloud computing and the increasing computing power has made it possible to construct an information system for tourism and hospitality demand analysis and forecasting practices using big data. This system fully utilizes the advantages of big data and captures the interrelations within the tourism and hospitality system (Buhalis & Leung, 2018; D. C. Wu et al., 2017). By automatically obtaining network big data in real-time and providing rich data and information from different dimensions through automated operations, this system helps the tourism and hospitality industry to conduct market monitoring, public opinion analysis, and service quality evaluation anytime and anywhere, achieving the digitization and intelligence of tourism and hospitality management.
On the other hand, constructing a tourism and hospitality information system based on cloud computing is an effective way to integrate tourism and forecasting research with tourism practice (Mariani et al., 2018). By utilizing cloud computing technology, tourism and hospitality practitioners can access and analyze large amounts of data in real time, enabling them to make informed decisions and adjust their strategies accordingly. For example, tourism businesses can use cloud-based analytics tools to monitor social media and online reviews in real time, allowing them to quickly respond to customer feedback and improve their services. This integration of research and practice can help improve the overall efficiency and effectiveness of the tourism and hospitality industry, leading to better experiences for tourists and increased revenue for businesses. Additionally, the use of cloud computing can help reduce costs and increase scalability, making it a cost-effective solution for tourism and hospitality businesses of all sizes.
Concluding Remarks
The proliferation of information technology has generated various forms of big data applicable to tourism and hospitality research. Many studies have demonstrated that incorporating big data into tourism and hospitality forecasting can significantly improve prediction accuracy (Song et al., 2019). This study provides a systematic review of big data-based tourism and hospitality research from a methodological perspective, including the categories of big data, analysis methods, and forecasting techniques.
This study represents a unique effort to address the limitations of current big data tourism and hospitality forecasting research by providing a critical analysis of existing literature and presenting a synthesis of multidisciplinary theories that can be applied to this field. The data-driven nature of this field has led to limited theoretical development in the existing literature. Moreover, this study offers valuable insights into future research trends and directions, highlighting the need for continued exploration and development of big data tourism and hospitality forecasting.
First, the issue of how big data-driven tourism and hospitality forecasting research can facilitate the advancement of theories requires further exploration. Future research can continue to track and incorporate relevant theories from fields such as psychology, communication, and information processing, to uncover the theoretical foundations of tourism and hospitality big data forecasting research and enable ongoing theoretical development.
Second, regarding the frequency conversion of data, researchers should endeavor to develop advanced forecasting models that can handle various data frequencies, especially tourism-related big data at the hourly or minute frequency level (V. Ramos et al., 2021). The MIDAS model has not been extensively applied in big data tourism and hospitality forecasting research with high-frequency data within days, warranting further attention.
Third, in terms of big data types, few studies have investigated how the information contained within textual, photo, and video data can propel tourism and hospitality forecasting. Subsequent research should explore online travel-related reviews. For example, researchers can conduct forecasting based on sentiment analysis or other text mining techniques. Future studies could apply advanced natural language processing techniques, such as Latent Dirichlet Allocation (LDA; Bi et al., 2019) or Dynamic Topic Modeling (Blei & Lafferty, 2006), to transform unstructured data into structured data for further research. Additionally, deep learning sentiment analysis techniques, such as LSTM models, can be implemented to construct a sentiment index for tourism and hospitality forecasting (D. C. Wu, Zhong, et al., 2022). Meanwhile, machine learning methods such as density clustering, hierarchical clustering (Miah et al., 2017; Mou et al., 2020), and machine learning-based image recognition can be utilized to extract visual variables. These methods can help to identify patterns and trends in visual data, such as images and videos, thereby providing valuable insights for tourism and hospitality forecasting and marketing strategies.
Fourth, dynamic methods should be explored given the inherent unpredictability of the real world. Ongoing changes in network users’ information needs can affect the coverage and relevance of these data. A thorough and dynamic keyword selection technique is necessary for dynamic data extraction (Law et al., 2019; X. Li et al., 2017). Advanced forecasting such as scenario forecasting, probability forecasting, interval forecasting, and density forecasting (G. Li, Wu, Zhou, & Liu, 2019; D. C. Wu, Cao, et al., 2021) with big data present another intriguing avenue for exploration. Besides, differing from previous studies that focus on point forecasting, probability forecasting has been gaining popularity, providing comprehensive information to cope with environmental uncertainties (G. Li, Wu, Zhou, & Liu, 2019). Moreover, for the sake of addressing the gradients for big data training, deep learning models also need to be constantly updated (Sun et al., 2022). Developing ensemble techniques for tourism and hospitality forecasting is also a promising direction. However, there is no definitive standard for the selection of hyper-parameters when using AI-based models to enhance forecasting performance. Therefore, more efforts are required to address the problems of randomness and uncertainty in the process of parameter adjustment of AI-based models.
Last but not least, while more diverse data and techniques have been applied to the field of tourism forecasting, there is still ample room for improvement. Scholars also need to have more opportunities for ideological collision and academic exchanges. Recently, the Curated Collection of Annals of Tourism Research announced a tourism forecasting competition aimed at exploring advanced forecasting methodologies and showcasing good practices for practitioners in response to the COVID-19 pandemic (Song & Li, 2021; Song et al., 2022). All three competing teams (Kourentzes et al., 2021; A. Liu, Vici, et al., 2021; Qiu, Wu, et al., 2021) proposed innovative methodological frameworks for scenario forecasting in the context of the ongoing COVID-19 pandemic, providing the tourism industry with excellent practices. The competition was well received and offered a good reference for future research under unexpected crises. Therefore, with the increasing popularity of online big data for tourism forecasting, more competitions involving big data tourism analysis and forecasting should be organized to examine the application abilities of big data in tourism research.
Managerially, by incorporating the insights gained from this study, stakeholders can make more informed decisions and improve their overall performance in the tourism and hospitality industry. Five types of big data are multi-source, high-frequency, and available free of charge (X. Huang et al., 2017). These data can record and monitor users’ behavior, contributing to understand the changing needs of users. Based on high-frequency big data, practitioners can generate accurate forecasts in real time and make operational decisions. Public event organizers can also use these online data to conduct short-term forecasting to support crowd management and more readily respond to public health emergencies. Nonetheless, it is essential to tackle the issues of data privacy, security, and ethical considerations in collecting and utilizing big data in tourism and hospitality management. Ensuring the safekeeping of big data in the tourism and hospitality sector is fundamental for stakeholders to harness it efficiently, and to augment their competitive advantage, ultimately accomplishing their objectives.
There are several limitations to this study. First, the study only utilized Web of Science, Scopus, and Google Scholar to search for literature, which may have led to relevant studies being missed. Future research could expand the database and include other literature types, such as conference papers, to obtain more comprehensive research information. Second, this study mainly relies on keyword-driven and content analysis to review existing studies, and primarily focuses on methodological progression. Future reviews could utilize quantitative bibliometric visualization methods, such as CiteSpace (X. Wu, Shi, & Xiong, 2023), to conduct co-occurrence and co-citation analysis and visualize the distribution of existing big data tourism and hospitality forecasting research. Last but not least, in future research, when delving into the theoretical explanation of big data applications in tourism and hotel forecasting, it is crucial not only to incorporate classical economic theories, but also to encompass some theories deeply rooted in the fields of tourism and hospitality.
Supplemental Material
sj-docx-1-jht-10.1177_10963480231223151 – Supplemental material for Tourism and Hospitality Forecasting With Big Data: A Systematic Review of the Literature
Supplemental material, sj-docx-1-jht-10.1177_10963480231223151 for Tourism and Hospitality Forecasting With Big Data: A Systematic Review of the Literature by Doris Chenguang Wu, Shiteng Zhong, Ji Wu and Haiyan Song in Journal of Hospitality & Tourism Research
Footnotes
Declaration of Conflicting Interests
The authors declared no potential conflicts of interest with respect to the research, authorship, and/or publication of this article.
Funding
The authors disclosed receipt of the following financial support for the research, authorship, and/or publication of this article: This work was supported by the National Natural Science Foundation of China (72374226, 72322020, 72071218), Guangdong Basic and Applied Basic Research Foundation (2020B1515020031, 2023B1515020073), and The Hong Kong Polytechnic University (1-ZE2S).
Supplemental Material
Supplemental material for this article is available online.
Author Biographies
References
Supplementary Material
Please find the following supplemental material available below.
For Open Access articles published under a Creative Commons License, all supplemental material carries the same license as the article it is associated with.
For non-Open Access articles published, all supplemental material carries a non-exclusive license, and permission requests for re-use of supplemental material or any part of supplemental material shall be sent directly to the copyright owner as specified in the copyright notice associated with the article.