



Abstract
Background:
Surgical site infections (SSIs) and complications (SSCs) following open spine surgery result in substantial added healthcare system cost and reduced quality of care. Closed incision negative pressure therapy (ciNPT) is increasingly used as an adjunctive tactic, for postoperative management of high-risk closed incisions. We developed an economic model to evaluate potential savings from SSI and SSC-associated readmission (SSC-AR) reduction against the incremental acquisition cost of the ciNPT system across different patient risk levels.
Methods:
Patient risk parameters were derived from published predictive models for SSI and SSC-AR risk, using data from the Premier Healthcare Database of open spine surgeries. The economic model incorporated published average costs of SSIs ($18,899) and SSC-ARs ($22,698) within 90 days post-discharge in orthopedic surgery and an estimated ciNPT effectiveness rate ranging from 20% to 80% in spine surgery. Primary measure was estimated economic impact of preventing SSIs or SSC-ARs using ciNPT.
Results:
Cost savings were observed in populations with SSI/SSC-AR rates ≥15.0 when ciNPT was universally applied. ciNPT was not cost-effective for rates ≤0.5%. For rates between 1.0% and 15.0%, savings were observed depending on specific patient risk levels.
Conclusions:
Strategic use of ciNPT, guided by patient risk stratification, can provide cost savings for healthcare systems. This model may help surgeons to preoperatively identify spine surgery patients with the highest potential cost benefit from ciNPT.
Keywords
Introduction
Spinal surgery has emerged as one of the highest-volume surgical specialties because of the burgeoning aging population and various technological advancements focused on spinal procedures. 1 Throughout the past several decades, the total number of spinal fusion procedures performed worldwide has continued on an upward trend. 2 Between 2001 and 2010, approximately 3.6 million fusion-based spine procedures were performed in the United States with total charges increasing from $10 billion to $46.8 billion. 3 The number of spinal fusions in the United States increased by 276% from 2002 to 2014, accompanied by rising treatment costs, with infection and hematoma/seroma being the costliest adverse events. 4
Surgical site infections (SSIs) and other surgical site complications (SSCs) following open spine surgery are associated with prolonged hospital stays, unplanned readmissions, increased healthcare costs, reduced quality of care, and impaired functional recovery.5–8 Surgical site infections incur the highest costs in neurosurgery patients. 6 Rates of SSI following open spine surgery reported by individual institutions vary between 0.7% and 15.0%, depending on diagnosis, site, approach, and use of instrumentation.9–13 Surgical site complications including infection, dehiscence, hematoma, seroma, and skin necrosis are among the leading causes of unplanned readmissions following open spine surgery, with an incidence ranging from 2% to 20%, and at an estimated $12 billion annual cost to US Medicare.14–16
Advanced incision management strategies, such as closed incision negative pressure therapy (ciNPT), may benefit high-risk open spine surgery patients because of the high prevalence of comorbidities that impair healing, healing challenges inherent with posterior incisions and spinal instrumentation, and serious morbidity associated with spine SSIs. 17 Application of ciNPT provides a barrier to external contamination, decreases lateral tension of sutured/stapled incisions, helps hold incision edges together, reduces edema, and removes fluids and infectious materials.18–22 Several comparative clinical studies have shown reduction in SSI and dehiscence, with use of ciNPT versus standard surgical dressings over closed spine surgery incisions.23–29
Given the high frequency and cost associated with spine surgery, early consideration of effective interventions is important to mitigate the risk of postoperative SSIs and SSCs; however, mounting pressure to reduce cost requires a cost-effectiveness assessment of each intervention tactic. Despite an increasing volume of clinical studies, there remains a gap in published economic data concerning ciNPT use over closed spine surgery incisions.17,30 There is an urgent need to identify cost-effective uses of ciNPT compared with conventional dressings post open spine surgery. The purpose of this study is to develop an economic model to estimate the cost-effectiveness of ciNPT compared with conventional dressings post-open spine surgery, considering various patient risk stratification levels. The aim of the economic model is to determine when the additional cost of a ciNPT dressing system may be financially justified in at-risk patient populations undergoing open spine surgery, considering the potential cost savings associated with reduced infection or complications.
Methods
Data source and predictive models
A retrospective data analysis approach was employed to construct a risk-based economic model, assessing the potential cost-effectiveness of ciNPT compared with conventional dressings (e.g., hydrocolloid dressings, adhesive strips, film dressings, etc.) in patients undergoing open spine surgery. Within the model, patients were stratified based on their risk of SSI or unplanned SSC-associated readmission (SSC-AR), using both population-level rates and individual patient risk levels embedded within the pertinent population.
Two SSI and SSC-AR risk scoring systems31,32 were used for the stratification of patient risk levels in this present model. The two previously published risk scoring systems were derived from predictive models of SSI and SSC-AR within 90 days of discharge, based on data from the Premier Healthcare Database of records of 157,776 open spine surgeries (approximately 90% involving spinal fusion) between January 2019 and September 2020. Within this dataset, 2,650 surgeries (1.7%) experienced SSI, whereas 3,182 surgeries (2.0%) required unplanned SSC-AR. Both models demonstrated strong predictive accuracy (concordance [C] statistic >70%).31,32 The models generated risk scores for SSI (range: 0–293) and SSC-AR (range: 0–40), with higher scores indicating elevated risk levels. The distribution of SSI/SSC-AR risk across score categories (e.g., sensitivity, specificity), along with the original published risk score data31,32 plus additional data points, was evaluated and integrated into the present cost-effectiveness economic model (Supplementary Tables S1–S2). The published Premier data utilized in this study was de-identified, and this study was determined to be exempt from Institutional Review Board (IRB) review, in accordance with the U.S. Health and Human Services Code of Federal Regulations, title 45 §46.104. 33
Materials
This economic model incorporated list price acquisition costs (2023) for two widely used ciNPT systems in practice:
3M Prevena Peel-and-Place Incision Management System 20 cm (Solventum, Maplewood, MN): $495 per application 3M Prevena Plus Customizable Incision Management System (Solventum) (linear, non-linear, and intersecting incisions up to 90 cm in length): $830 per application
Both systems consist of an integrated polyurethane foam dressing with an interface layer applied over a closed incision, sealed with an adhesive film, and connected via multi-lumen tubing to a portable pump delivering continuous negative pressure at −125 mmHg.17,34
Cost-effectiveness economic modeling
The following cost-effectiveness parameters, extracted from current literature, formed the basis for this model: (1) the estimated mean costs associated with SSI and SSC-AR within 90 days of discharge following open orthopedic surgery, derived from the Premier database, were $18,899 and $22,698, respectively,35,36 and (2) the acquisition cost of the ciNPT system was $495 per patient when using the ciNPT peel-and-place dressing, and $830 per patient when using the ciNPT customizable dressing. 37
The economic impact of ciNPT for each surgical procedure was calculated utilizing ciNPT effectiveness rates from 20% to 80%, based on studies demonstrating reductions in SSI and/or SSC relative to conventional dressings in open spine surgery.23,24,28,29,38 The analysis considered population-based SSI and SSC-AR rates up to 20.0%; results are displayed in tables at nine pre-specified rates: 0.5%, 1.0%, 2.0%, 3.0%, 4.0%, 5.0%, 10.0%, 15.0%, and 20.0%.
Each population was evaluated across different patient risk score categories. It was assumed that there is a similar distribution of SSI or SSC-AR risk across these score categories among populations, or that the percentages of total SSIs or SSC-ARs observed per predicted patient risk level were comparable across these populations. To estimate net financial loss or gain, the savings from reducing the estimated actual SSI or SSC-AR cases through ciNPT were compared against the total acquisition cost of the ciNPT system for each incremental point increase in the risk cutoff score. A flow diagram illustrating this calculation is shown in Supplementary Figure S1. Equations for calculating Savings, Economic Impact, and Economic Impact per Surgical Procedure are the following:
Savings = (Number of Surgeries) * (SSI Incidence Rate) * (Sensitivity Rate) * (Effectiveness Rate) * (Average Cost per SSI Case) Economic Impact = Savings − (Cost of ciNPT per Application) * (Number of Surgeries) * (Implementation Rate) Economic Impact per Surgical Procedure = (Economic Impact)/(Number of Surgeries)
Results
The economic analysis results for implementing ciNPT at acquisition costs of $495 and $830 to mitigate the risk of SSI/SSC-AR are presented in Tables 1–3 and Figures 1–2. Table 1–2 results are based on a 70% effectiveness rate as reported by Mueller et al. 24 Table 3 presents the results for effectiveness rates from 20 to 80%, where a minimum score of 0 signifies cost effectiveness for universal application at the specific population-level SSI/SSC-AR rate. For example if ciNPT were applied to patients with an SSI risk score of 20 or higher among a cohort of 300 individuals exhibiting a 10% SSI rate, it is projected that approximately 19 SSI cases would be averted, resulting in estimated savings of $360,186. This calculation incorporated a sensitivity rate of 90.8% for identifying the proportion of total SSI cases among those with a risk score ≥20 (Supplementary Table S1), an average SSI cost of $18,899, and a 70% effectiveness rate of ciNPT, with rounding errors considered:
Per Surgical Procedure Economic Impact of ciNPT (at 70% Effectiveness Rate) Related to Surgical Site Infections

ciNPT = closed incision negative pressure therapy; SSI = surgical site infection.
Per Surgical Procedure Economic Impact of ciNPT (at 70% Effectiveness Rate) Related to Surgical Site Complication-Associated Readmissions
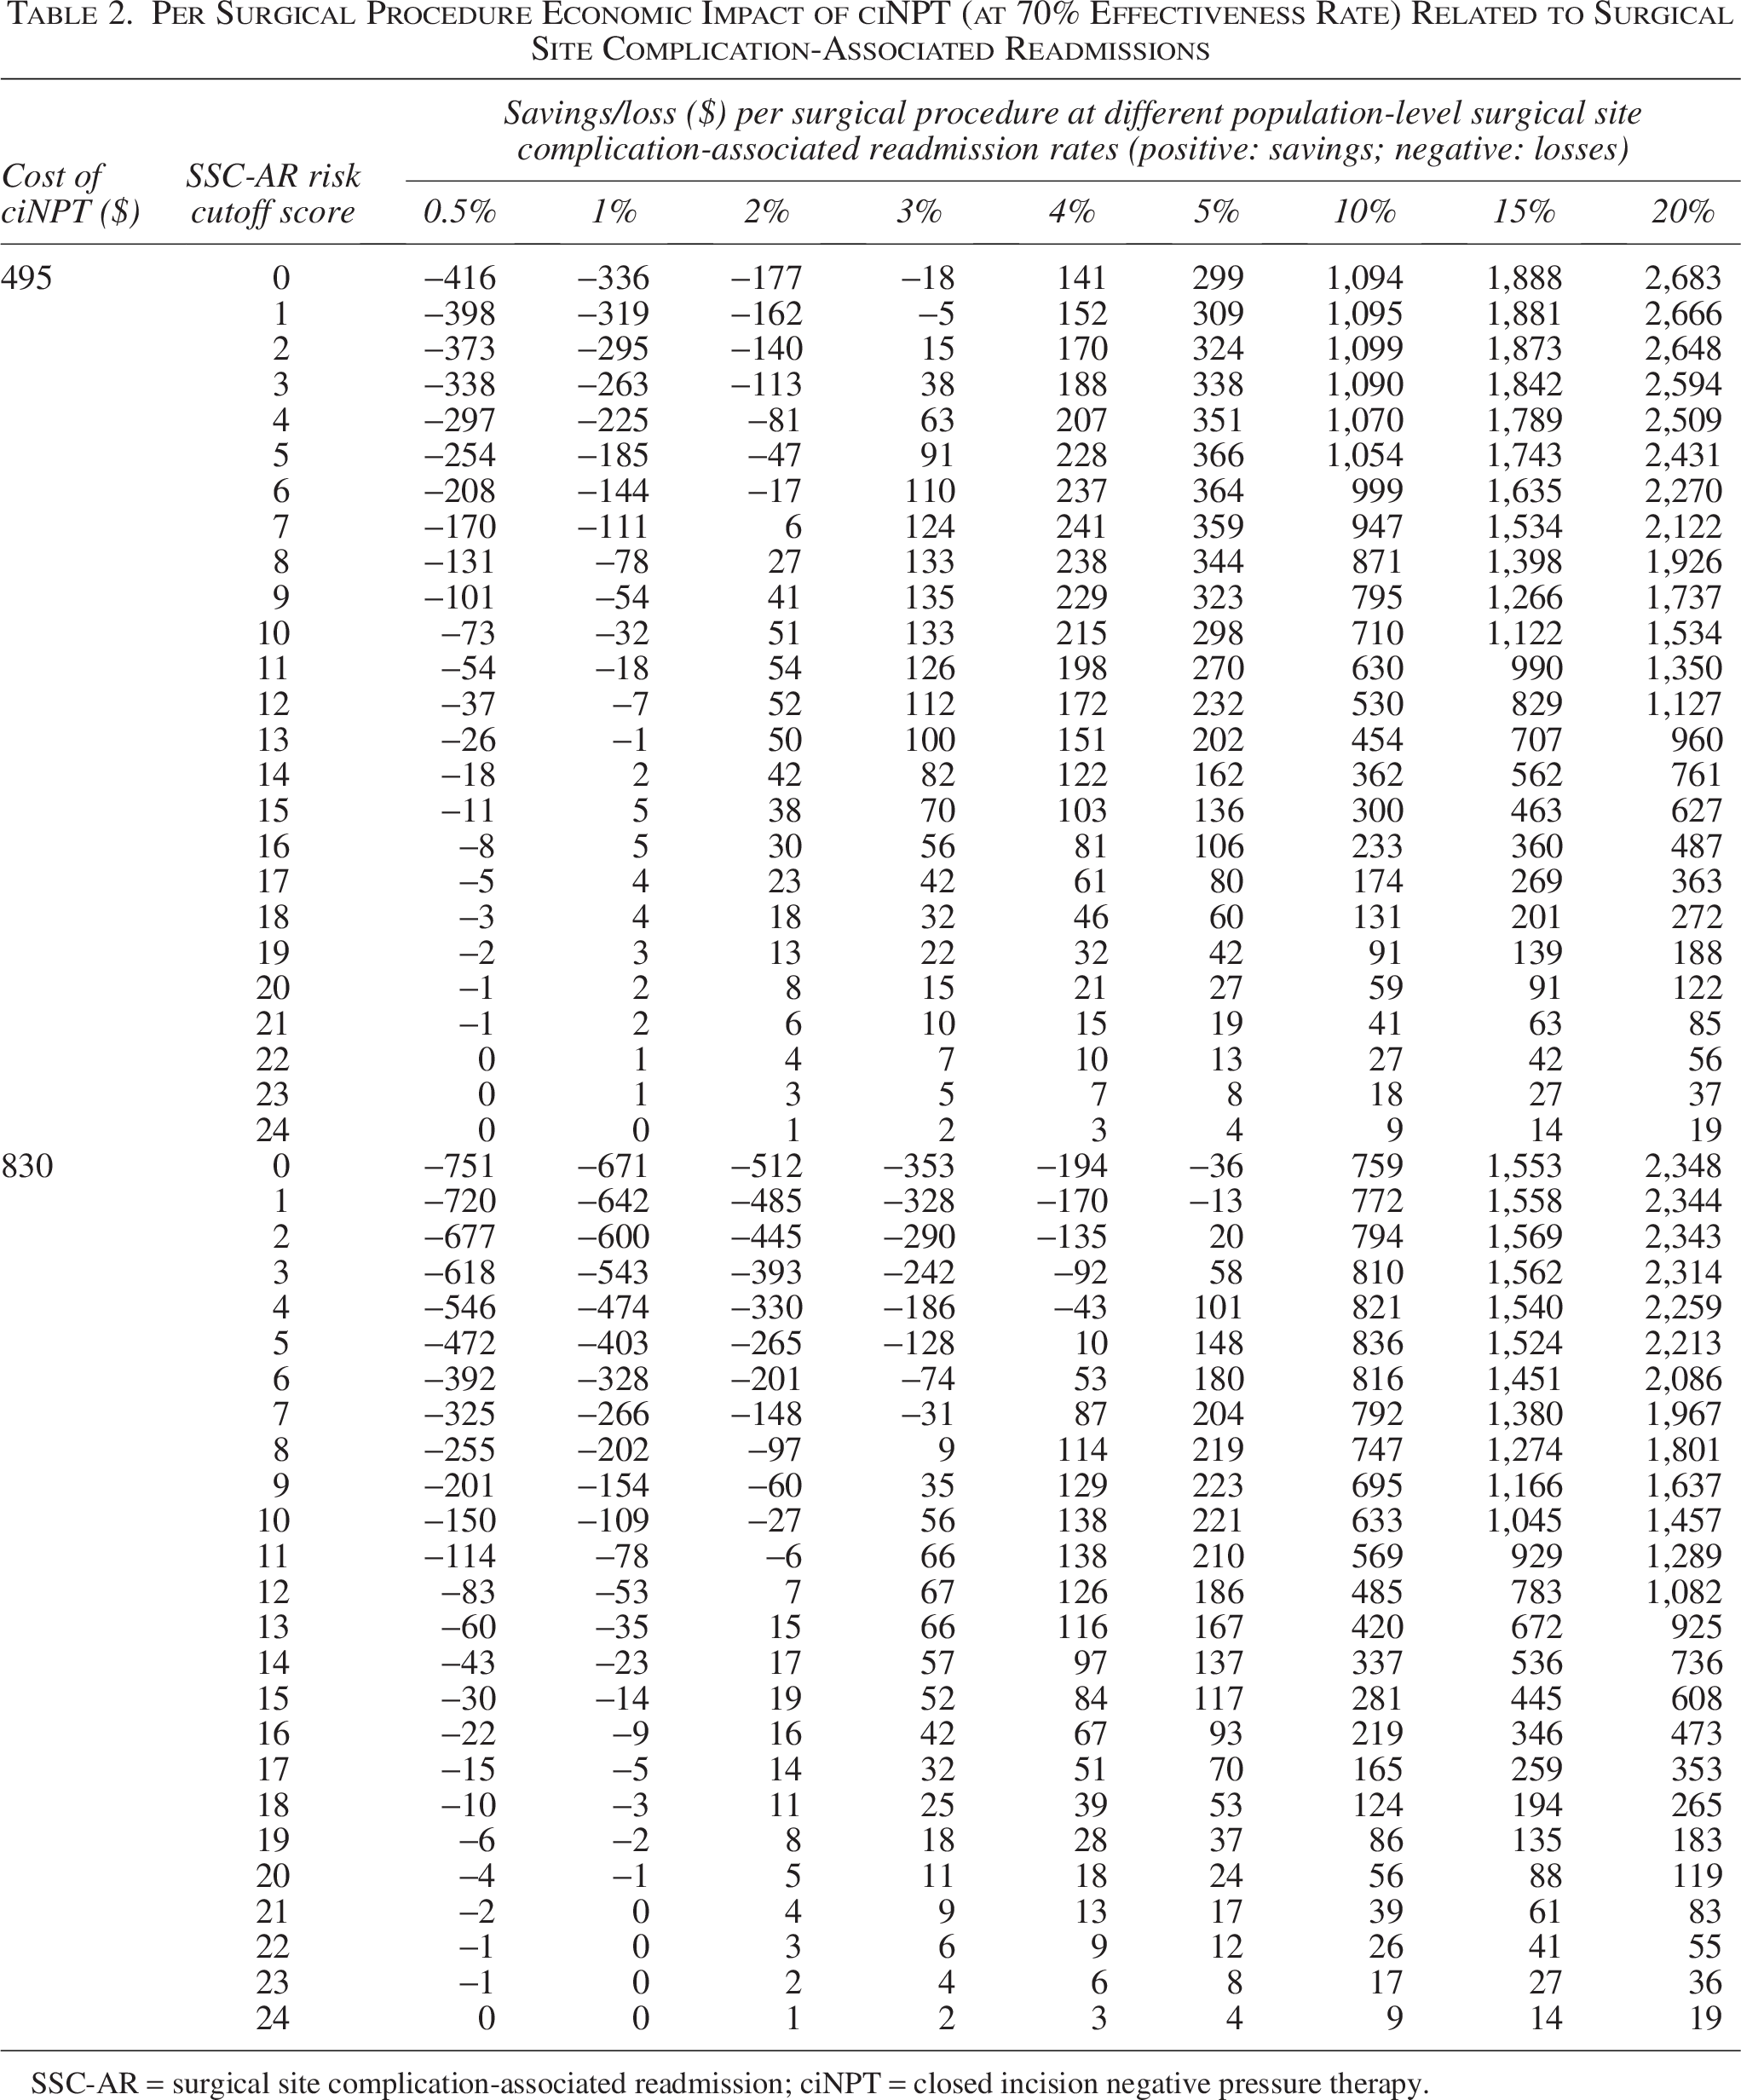
SSC-AR = surgical site complication-associated readmission; ciNPT = closed incision negative pressure therapy.
Minimum Risk Score Cutoff at Different Effectiveness Rates and Population-Level SSI and SSC-AR Rates

SSI = surgical site infection; SSC-AR = surgical site complication-associated readmission; ciNPT = closed incision negative pressure therapy.

Per surgical procedure economic impact of ciNPT (at 70% effectiveness rate) related to surgical site infections. ciNPT = closed incision negative pressure therapy.

Per surgical procedure economic impact of ciNPT (at 70% effectiveness rate) related to surgical site complication-associated readmissions.
Savings [$360,186] = (Number of Surgeries [300]) * (SSI Incidence Rate [10%]) * (Sensitivity Rate [90.8%]) * (Effectiveness Rate [70%]) * (Average Cost per SSI Case [$18,899]).
With each application of the ciNPT system costing $830 and 72.6% of cases having an SSI risk score ≥20 (Supplementary Table S1), the net economic impact totaled $179,461:
Savings [$360,186] − (Cost of ciNPT per Application [$830]) * (Number of Surgeries [300]) * (Implementation Rate [72.6%]), equating to $598 in savings per surgical procedure: (Economic Impact [$179,461])/(Number of Surgeries [300]).
The economic impact per surgical procedure was consistent regardless of the total number of surgeries, underscoring that ciNPT cost-effectiveness hinged primarily on the targeted patient risk, acquisition cost, and effectiveness rate. Predicted patient risk stratifications, indicated by risk cutoff scores of 5, 10, 15, etc., are shown as row labels in Tables 1 and 2, with population-based rates of SSI or SSC-AR listed as column headers. The estimated economic impact of ciNPT, with a 70% effectiveness rate, ranged from a loss of $751 to savings of $2,683 per surgical procedure, depending on the population’s SSI/SSC-AR rate, patient score categories, and the ciNPT system acquisition cost. Economic impact of implementing ciNPT per risk cutoff score and SSI or SSC-AR rate at an effectiveness rate of 20%, 50%, and 80% is shown in Supplementary Tables S3−S5.
For populations with SSI or SSC-AR rates below 1%, the cost-benefit ratio did not favor the use of ciNPT with 70% effectiveness at either acquisition cost level. Conversely, in cases where the SSI/SSC-AR rate exceeded 10%, universal employment of ciNPT for all patients led to cost savings, with a minimum of $493 saved per surgical case, regardless of patient score categories, at both ciNPT acquisition costs (Tables 1 and 2). This model demonstrated a minimum cost-savings of $34 per surgical procedure when the population SSI rate was 4% or higher, by applying the $495 ciNPT at 70% effectiveness rate for all patients regardless of their risk scores. Populations with SSI rates of 1%, 2%, and 3% may benefit economically from the $495 ciNPT if selectively applied to patients with SSI risk scores ≥75, ≥40, and ≥20, respectively. Similarly, populations with SSI rates of 2%, 3%, 4%, and 5% may benefit from using the $830 ciNPT for patients with SSI risk scores ≥60, ≥ 45, ≥30, and ≥25, respectively (Tables 1 and 3, Fig. 1).
Additionally, the model estimated at least $141 in cost savings per surgical procedure for populations with SSC-AR rates of 4% or higher when using the $495 ciNPT for all patients. The model predicted that populations with SSC-AR rates of 1%, 2%, and 3% benefitted from the $495 ciNPT when applied to patients with SSC-AR risk scores ≥14, ≥ 7, and ≥2, respectively. In populations with SSC-AR rates of 2%, 3%, 4%, and 5%, using the $830 ciNPT for patients with SSC-AR risk scores of ≥12, ≥8, ≥5, and ≥2, respectively, resulted in positive returns (Tables 2 and 3, Fig. 2).
Expanding upon the data presented in Tables 1 and 2, a 1% increase in population SSI rate was associated with reduced losses ($132) per surgical procedure when ciNPT at a 70% effectiveness rate was implemented for every patient ($66 for a 0.5% increase) when comparing the columns at SSI Risk Cutoff Score = 0. Similarly, for every 1% increase in SSC-AR rate, the losses per surgical procedure decreased by $159 ($80 for a 0.5% increase) with universal ciNPT application. Positive returns were estimated with $495 ciNPT in patient groups with ≥4% SSI/SSC-AR and $830 ciNPT for groups with ≥10% SSI/SSC-AR. Although specific results for the 6%−9% range were not provided, it is reasonable to extrapolate from the constant increase that patient groups with a rate ≥5.5% SSC-AR and/or ≥6.5% SSI are also likely to experience economic benefits through the universal application of $830 ciNPT.
Summarizing Table 1 and 2 results, Table 3 shows the varying SSI/SSC-AR risk scores at effectiveness rates ranging from 20% to 80%, and the patient risk cutoff scores at which it may be economically beneficial to use ciNPT. Analyzing the overall savings trends of ciNPT at a 70% effectiveness rate in reducing SSI and SSC-AR (Figs. 1 and 2), broader application of ciNPT generated maximum savings when SSI and SSC-AR rates exceeded 5%. For rates between 1% and 5%, patient risk scores were crucial in identifying the optimal balance between patient outcomes and savings. However, for SSC-AR rates below 1%, patient risk scores did not significantly influence the identification of savings, given the limited overall savings potential. Similar findings were demonstrated with effectiveness rates at minimum (20%), mid-point (50%), and maximum (80%) values (Supplementary Tables S3−S5). At effectiveness rates from 20% to 80%, universal use of ciNPT yielded positive returns when SSI/SSC-AR rates were at least 15% (Table 3). Conversely, ciNPT use would not be recommended at the 0.5% SSI/SSC-AR rate. For SSI/SSC-AR rates between 1% and 15%, patient risk scores would identify the appropriate balance between outcomes and savings.
Discussion
Because of the multitude of risk factors involved in complex open spine surgery, it can be challenging for healthcare providers to pinpoint individual patients at “high risk” for complications and interventions. Although prediction tools are available, their predictive accuracy can vary across different risk profiles. This current model provides a clear, evidence-based path to accurately and preoperatively estimate the economic impact of ciNPT based on a predicted risk of complications for any open spine surgery patient across all patient profiles. Knowing population-based risk is crucial, as predictions tend to be less reliable for lower-risk cohorts than for those at higher risk. Calibrating the model with individual risk levels enhances the prediction accuracy of patient risk, despite fluctuations in population risk.
Our economic model is the first to estimate the economic impact of ciNPT in spine surgery by integrating population-level and individualized risk profiles, drawing from predictive algorithms for risk assessment in spine surgery. The model provides actionable insights aimed at cost-effective use of ciNPT balanced with SSI and SSC-AR risk reduction. Incorporating this economic model into clinical practice is intended to facilitate easier identification of high-risk spine surgery patients for whom ciNPT intervention is warranted, with the goal of lowering complications and costs. As surgical complication rates are increasingly linked to quality-of-care metrics, the present model has the potential to advance value-based procurement.
Model results suggest that the use of ciNPT may be associated with cost savings and reduced losses when applied to populations and/or individual patients with high SSI/SSC-AR rates. This is consistent with other investigators who have recommended its selective application in high-risk spine surgery patients, particularly for instrumented operations.25–28 Factors predominantly impacting cost savings or losses associated with ciNPT in this model were (1) the population-level SSI/SSC-AR rate, (2) the selection of patient-level SSI/SSC-AR risk cutoff, and (3) the cost of the ciNPT system.
A literature search revealed two published cost-benefit analyses of ciNPT use on postoperative posterior spinal fusion wounds;25,29 both studies estimated mean cost savings in the ciNPT versus non-ciNPT groups, based on respective SSI reduction rates achieved in each of the studies. Emerging cost-effectiveness analyses of ciNPT use in other surgical subspecialties, conducted within specific patient groups with distinct SSI/SSC rates, demonstrate varying levels of cost-effectiveness of ciNPT across different patient risk profiles, ciNPT effectiveness levels, and acquisition costs.27,30,39–42 Published data regarding the cost-effectiveness of ciNPT in orthopedic surgery align with our cost model. 37 A study by Cooper et al. found that the use of $495 and $830 ciNPT in a patient group undergoing revision total knee arthroplasty with a 14% SSC rate resulted in a 76% reduction in SSC rates and $989 in savings per case compared with standard dressings. 37 According to Table 2, the anticipated savings with the universal use of the $830 ciNPT for patients with 14% SSC-AR rate would fall within the savings range of $759 to $1,553. Importantly, the direct costs calculated in this model do not account for lost productivity, increased trips to the hospital/clinic, and patient suffering associated with infection or other complications that may have been prevented with use of ciNPT.
As predictive analytics are progressively harnessed to combat growing healthcare expenditures and optimize healthcare system value, integrating predictive modeling into economic estimations holds promise. In addition to specific risk assessment tools for spine surgery published in the literature,43,44 generic risk calculators have also been utilized in this field, including the Surgical Site Infection Risk Score, 45 the JSS-SSI Risk Scoring Tool, 46 and the American College of Surgeons-National Surgical Quality Improvement Program risk score. 47 Although there has been extensive discussion on improving the specificity, simplicity, and usability of these tools, their specific roles in informing clinical decisions remain less explored in the literature.48–50
Existing economic analyses of ciNPT25,29,39–42 are mostly limited to static patient groups or subgroups, lacking comprehensive evidence on how the economic impact of ciNPT varies across different patient risk profiles. Our approach combines predictive algorithms with economic modeling, enabling a holistic view of ciNPT’s economic landscape for a wide variety of risk profiles in spine surgery. This comprehensive roadmap can help inform optimal strategies to balance patient outcomes and clinical costs in various clinical scenarios. For instance, with a population SSI rate increase, clinicians may consider lowering the patient risk score threshold for ciNPT interventions. On the basis of our findings, if the population-level SSI rate were to increase from 1% to 3%, the patient cutoff score for qualifying for the $495 ciNPT should be adjusted from 72 to 20 to optimize patient outcomes and cost benefits (Table 3 and Fig. 1).
Our economic model has inherent limitations. SSI/SSC-AR cost estimates for open spine surgery were based on orthopedic surgery data, potentially underestimating savings, as SSI costs are higher in neurosurgery. 6 Conventional dressings were costed at $0 because of their significantly lower cost compared with ciNPT, thus the acquisition cost difference between ciNPT and conventional dressings is a conservative estimate. The risk-based cost-benefit approach assumed a consistent distribution of SSI/SSC-AR cases across predicted risk scores among diverse spine surgery populations. This assumption requires validation with real-world data. Our model also assumed two cost levels ($495 and $830), which may vary across surgical cases and institutions.
Conclusions
Strategic investment in ciNPT post-open spine surgery, guided by precise risk stratification, may yield positive returns for healthcare systems. Our predictive economic model identifies high-risk spinal surgery patients who may benefit clinically and economically from ciNPT. At a 70% effectiveness rate, universal ciNPT implementation is cost-saving for surgical cases with ≥7% SSI and/or SSC-AR risk, and not for <1% risk cases. Among cases with SSI/SSC-AR rates between 1% and 7%, those with sufficiently high-risk profiles would also benefit from ciNPT use. This model could help surgeons preoperatively predict individual patients with the highest potential cost benefit from ciNPT use, thereby optimizing patient care and economic outcomes.
Authors’ Contributions
K.B.M.: Conceptualization (support), formal analysis (support), methodology/model development (support), visualization (support), review and editing (equal), final article approval (equal). Y.H.: Conceptualization (lead), data curation (lead), formal analysis (lead), investigation (lead), methodology/model development (lead), project administration (equal), software (lead), visualization (equal), writing original draft (equal), review and editing (equal), final article approval (equal). K.B.: Project administration (equal), visualization (equal), writing original draft (equal), final article approval (equal). L.P.G.: Conceptualization (support), investigation (support), methodology/model development (support), project administration (equal), supervision (lead), review and editing (equal), final article approval (equal).
Footnotes
Author Disclosure Statement
K.B.M. is a paid consultant for Solventum. Y.H., K.B., and L.P.G. are employees of Solventum.
Funding Information
This research did not receive any specific grant from funding agencies in the public, commercial, or not-for-profit sectors.
Supplemental Material
Supplemental Material
Supplemental Material
Supplemental Material
Supplemental Material
Supplemental Material
References
Supplementary Material
Please find the following supplemental material available below.
For Open Access articles published under a Creative Commons License, all supplemental material carries the same license as the article it is associated with.
For non-Open Access articles published, all supplemental material carries a non-exclusive license, and permission requests for re-use of supplemental material or any part of supplemental material shall be sent directly to the copyright owner as specified in the copyright notice associated with the article.
