
Abstract
Control variables are included in regression analyses to estimate the causal effect of a treatment on an outcome. In this article, we argue that the estimated effect sizes of controls are unlikely to have a causal interpretation themselves, though. This is because even valid controls are possibly endogenous and represent a combination of several different causal mechanisms operating jointly on the outcome, which is hard to interpret theoretically. Therefore, we recommend refraining from interpreting the marginal effects of controls and focusing on the main variables of interest, for which a plausible identification argument can be established. To prevent erroneous managerial or policy implications, coefficients of control variables should be clearly marked as not having a causal interpretation or omitted from regression tables altogether. Moreover, we advise against using control variable estimates for subsequent theory building and meta-analyses.
Multivariate regression is an important tool for empirical research in organization studies, management, and economics. Beyond settings in which regression analysis is used to statistically predict a left-hand side variable given a set of explanatory variables, the main purpose of these methods is to control for confounding influence factors between a treatment and an outcome in order to obtain consistent causal effect estimates. 1 However, in practice, scholars often overstate the role of control variables in regressions. In this article, we argue that, while essential for the identification of causal effects, control variables do not necessarily have a causal interpretation themselves. This is because even valid controls are often correlated with other unobserved factors, which render their marginal effects uninterpretable from a causal inference perspective (Westreich & Greenland, 2013; Keele et al., 2020). Consequently, researchers need to be careful with attaching too much meaning to control variables and should consider to ignore them when interpreting the results of their analyses.
Drawing substantive conclusions from control variable estimates is common, however. Authors frequently make use of formulations such as “control variables have expected signs” or “it is worth noting the coefficients 2 of our control variables”. Below, we present the results of a literature review of papers published in Organization Science and Strategic Management Journal between 2015 and 2020, in which we found that 47% of manuscripts using regression methods also explicitly discussed the estimated effect sizes of controls. This is in line with Carlson & Wu (2012), who identified 48% of papers published in the Academy of Management Journal, Journal of Applied Psychology and Strategic Management Journal in 2007 that interpreted and discussed the effects of controls. Moreover, in our own experience as authors of quantitative research papers, we frequently encountered instances in which reviewers asked us to provide an interpretation of control variable coefficients. The justification that was often given was that, although they were not the main focus of the analysis, controls could still provide valuable information for other researchers in the field who are investigating related research questions.
The methodological literature in organizational research usually highlights that control variables should carry the same importance in an empirical analysis as the main independent variables of interest (Becker, 2005; Spector & Brannick, 2011; Carlson & Wu, 2012; Atinc et al., 2012). To increase rigor and improve the transparency of published research articles, Becker (2005) recommends to report all regression coefficients of control variables as well as their significance levels. Similarly, Spector & Brannick (2011) advocate that controls should be given equal status to the main treatment variable in the analysis. Atinc et al. (2012) consider it to be best practice to provide an ex-ante prediction of the sign of the relationship between the controls and outcome variable based on theory, which should subsequently be checked against the empirical evidence. In a recent paper, Becker et al. (2015) provide a more cautionary recommendation regarding generalizing from control variable estimates if it involves out-of-sample extrapolation, but otherwise consider it to be appropriate. Overall, the general consensus in the organizational literature thus seems to be that interpreting control variable estimates is safe, as it adds to the body of cumulative evidence regarding a particular effect size.
This article builds on the graphical framework to causality (Pearl, 2000; Durand & Vaara, 2009; Hünermund & Bareinboim, 2023). Causal diagrams have already been established as a powerful tool for determining which control variables are relevant to a given regression model (Cinelli et al., 2022; Hünermund et al., 2022). In addition, the approach offers a distinct perspective on the proper interpretation and communication of control variable results, which differs from prior methodological practices found in the organizational and management literature. In the following, we will explicate the view that control variables, while certainly an important ingredient in many causal research designs, do not have the same status as the main variables of interest in an empirical analysis. In particular, we will argue that in many situations valid controls can nonetheless be endogenous. Therefore, interpreting their estimated effect sizes in light of prior theory could lead to potentially misleading conclusions. A valid causal interpretation of control variables rests on strong assumptions and usually requires accounting for all influence factors of the outcome variable under study. Since this is unlikely to be fulfilled in many research contexts, we recommend authors to exercise caution when interpreting control variables and consider omitting estimated coefficients of control variables from regression tables, or relegating them to an appendix. Finally, we discuss what our recommendations imply for the practice of meta-analysis, which has recently gained traction in many fields including organizational research (Aguinis et al., 2010).
Do Researchers Attach Substantive Meaning to Control Variables?
To assess the degree to which researchers interpret control variable estimates in their studies, we conducted a review of all articles published in Organization Science and Strategic Management Journal between January 2015 and December 2020. We chose these two journals because of their high prestige in the management and organization field as well as their reputation for high-quality empirical research. Our sample includes all quantitative articles that employed parametric regression models such as ordinary least squares (OLS), logit, probit, Poisson, etc. This choice was made because effect sizes of control variables can usually not be summarized by a single coefficient (or marginal effect) in non and semiparametric models. The use of such methods is rare in our sample anyway though.
We manually categorized papers according to whether they interpret or draw substantive insights from the coefficients or marginal effect estimates of control variables. Examples of such an interpretation range from “the control variable CEO tenure is positively related to performance” to “the effect sizes of control variables are in line with previous studies.” The latter interpretation is thereby of relevance because authors of future research papers might be tempted to develop a theory based on this seemingly accumulating empirical evidence. The result of our review shows that interpreting control variables was common practice in the analyzed journals during our period of observation. For the Strategic Management Journal, we identified a total of 497 quantitative research articles, of which 233 (47%) proceeded to interpret the effects of control variables. For Organization Science, out of a total of 275 quantitative articles, 131 (47%) provided an interpretation of control variable estimates. Detailed results of the literature review and example quotes demonstrating the different ways in which authors interpret control variable estimates in practice are reported in the supplemental material to this article.
The Causal Interpretation of Control Variables
The relationship between the main explanatory variables and controls in a regression can be complex, therefore it is beneficial to explicitly depict them in a causal diagram (Pearl, 2000). Durand & Vaara (2009) were the first to introduce causal graphs as a tool for management researchers. Cinelli et al. (2022) provide a useful overview of the different functions of control variables in regression analyses, explicitly leveraging the graphical framework. Here, we focus on the causal interpretation and reporting of control variable estimates, which has been a topic of ongoing debate in the organizational literature.
Figure 1a presents a simple model with a treatment variable
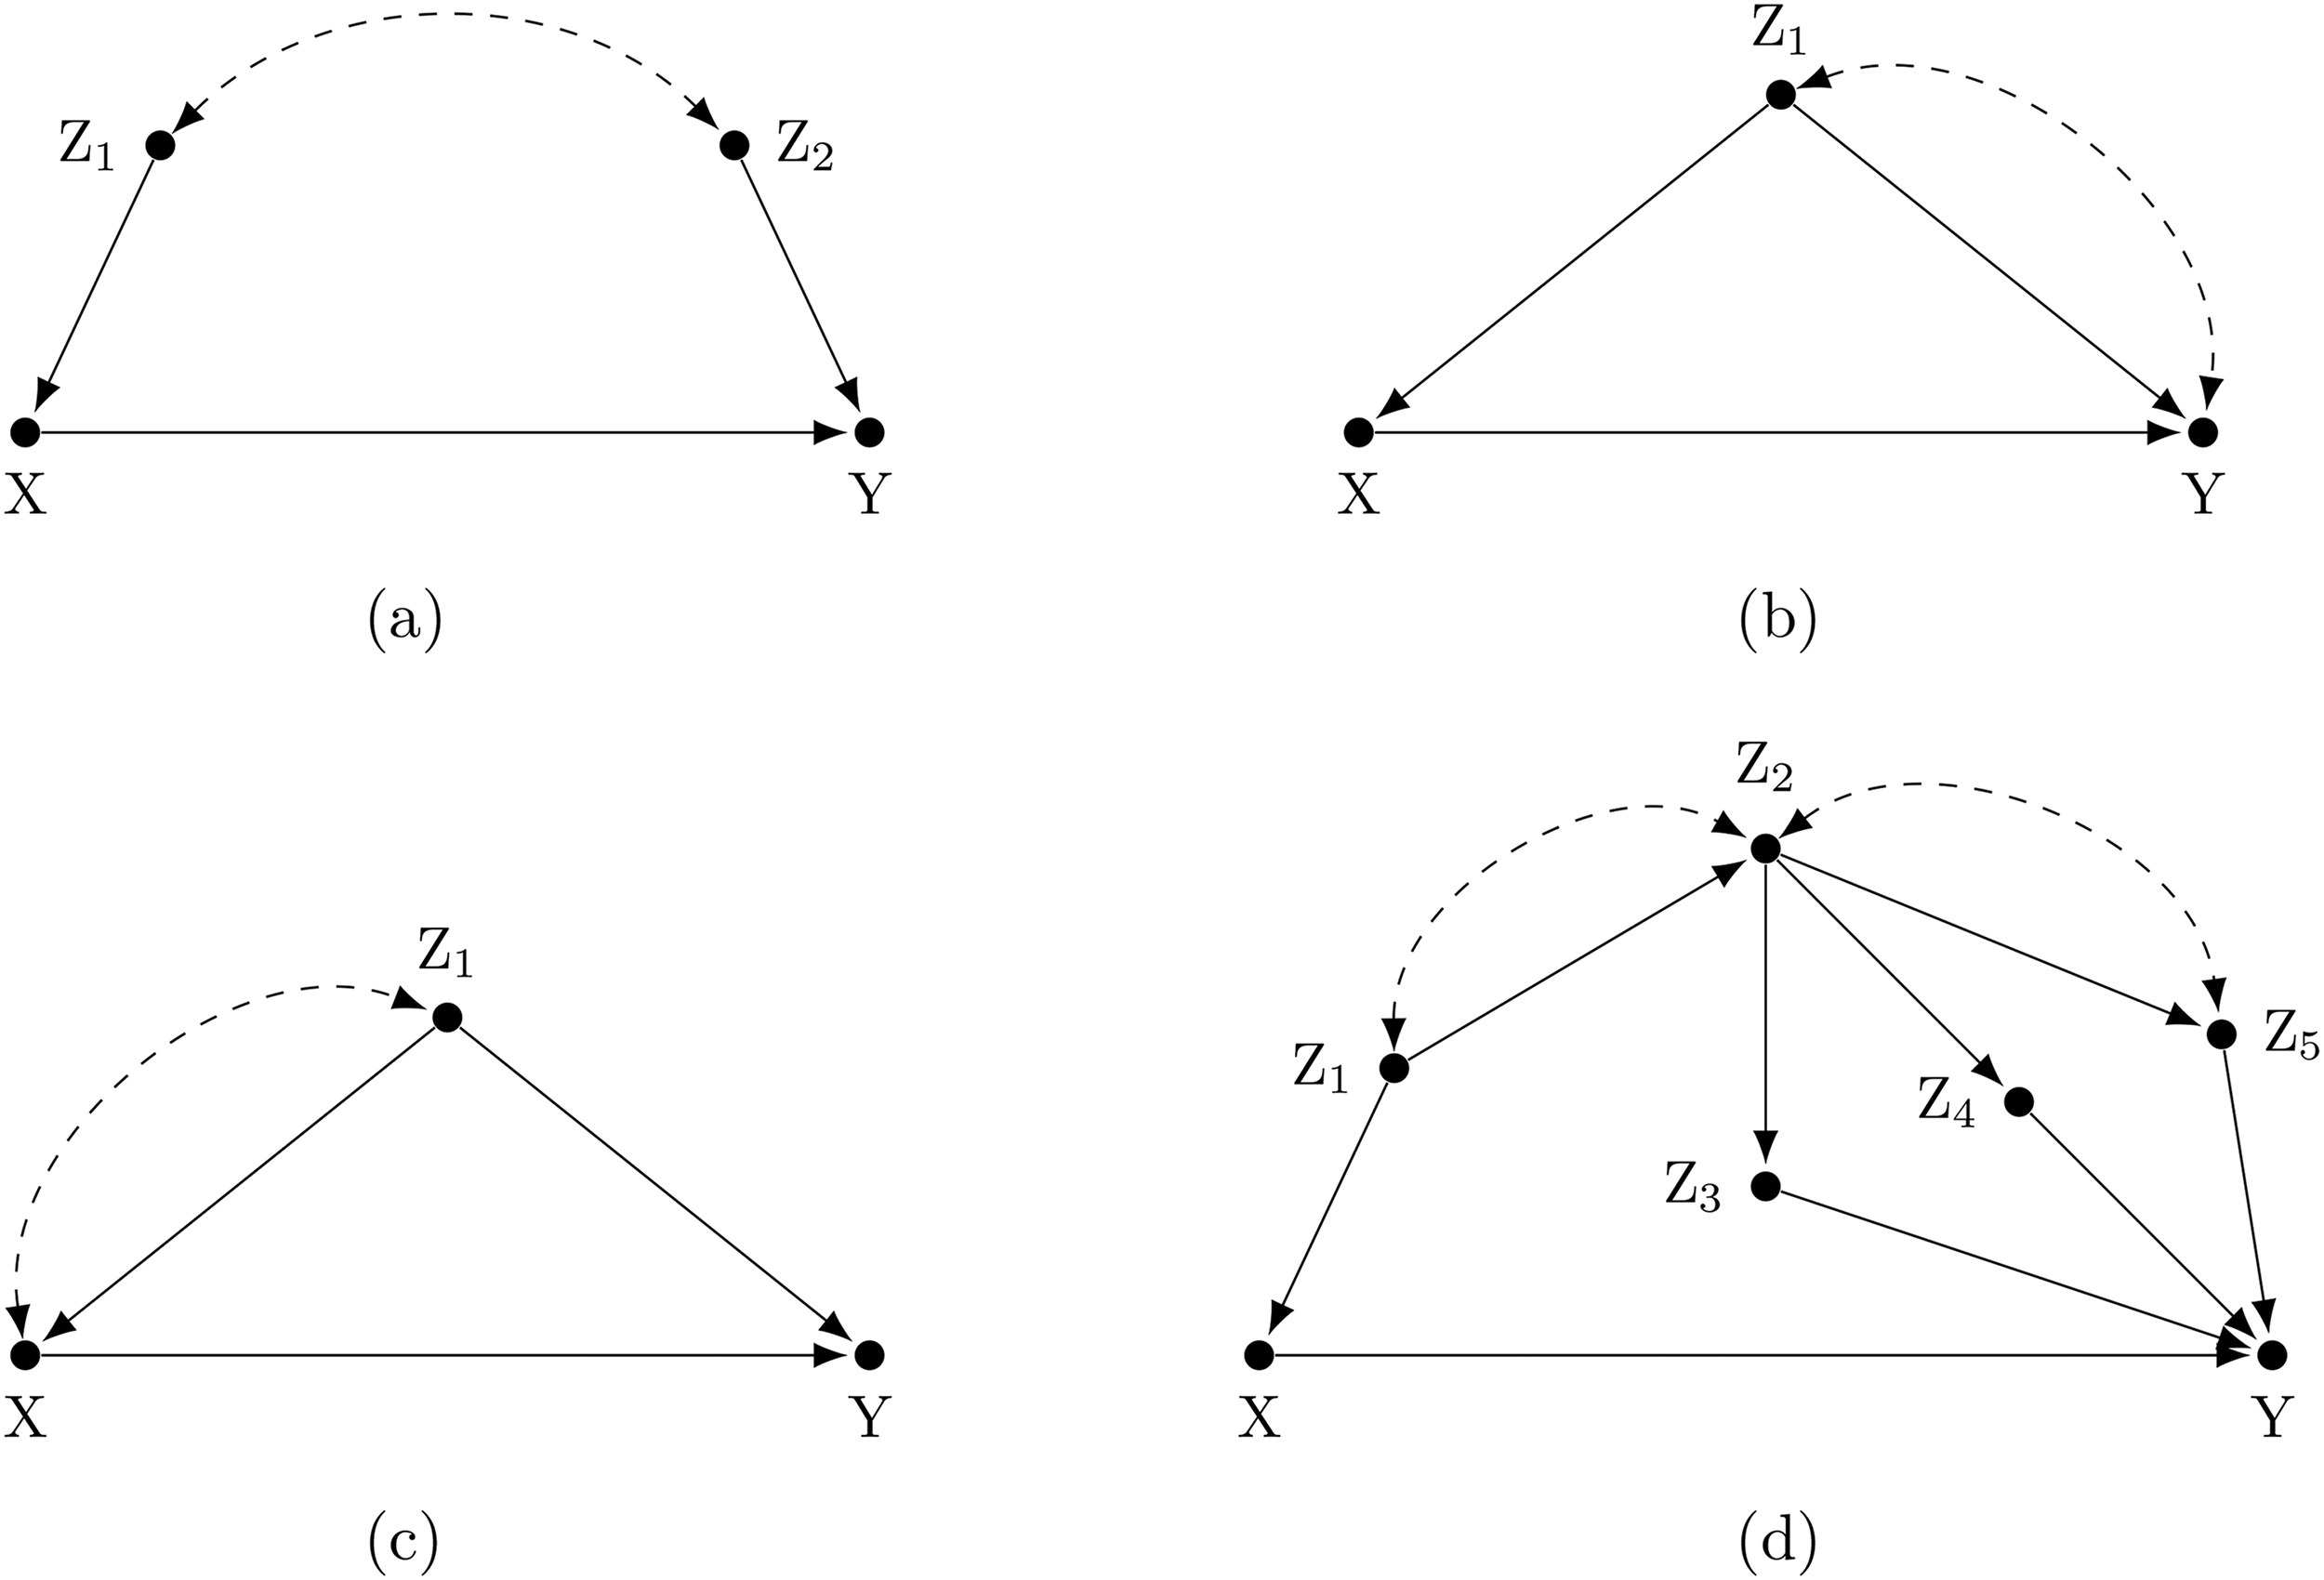
(a–d) Examples of causal diagrams with valid control variable
Backdoor paths are defined as any sequence of arrows connecting the treatment and outcome variable (irrespective of their orientation) that remains if arrows emitted by the treatment are deleted from the graph (Pearl, 2000). Because of the latter requirement, they are easy to spot in the causal diagram. Since all the arrows emitted by
Control variables in a multivariate regression model are invoked to block such backdoor paths and obtain a consistent estimate of the causal effect of
Nevertheless, although controlling for
Ordinary Least Squares (OLS) Regressions With Varying Adjustment Sets.
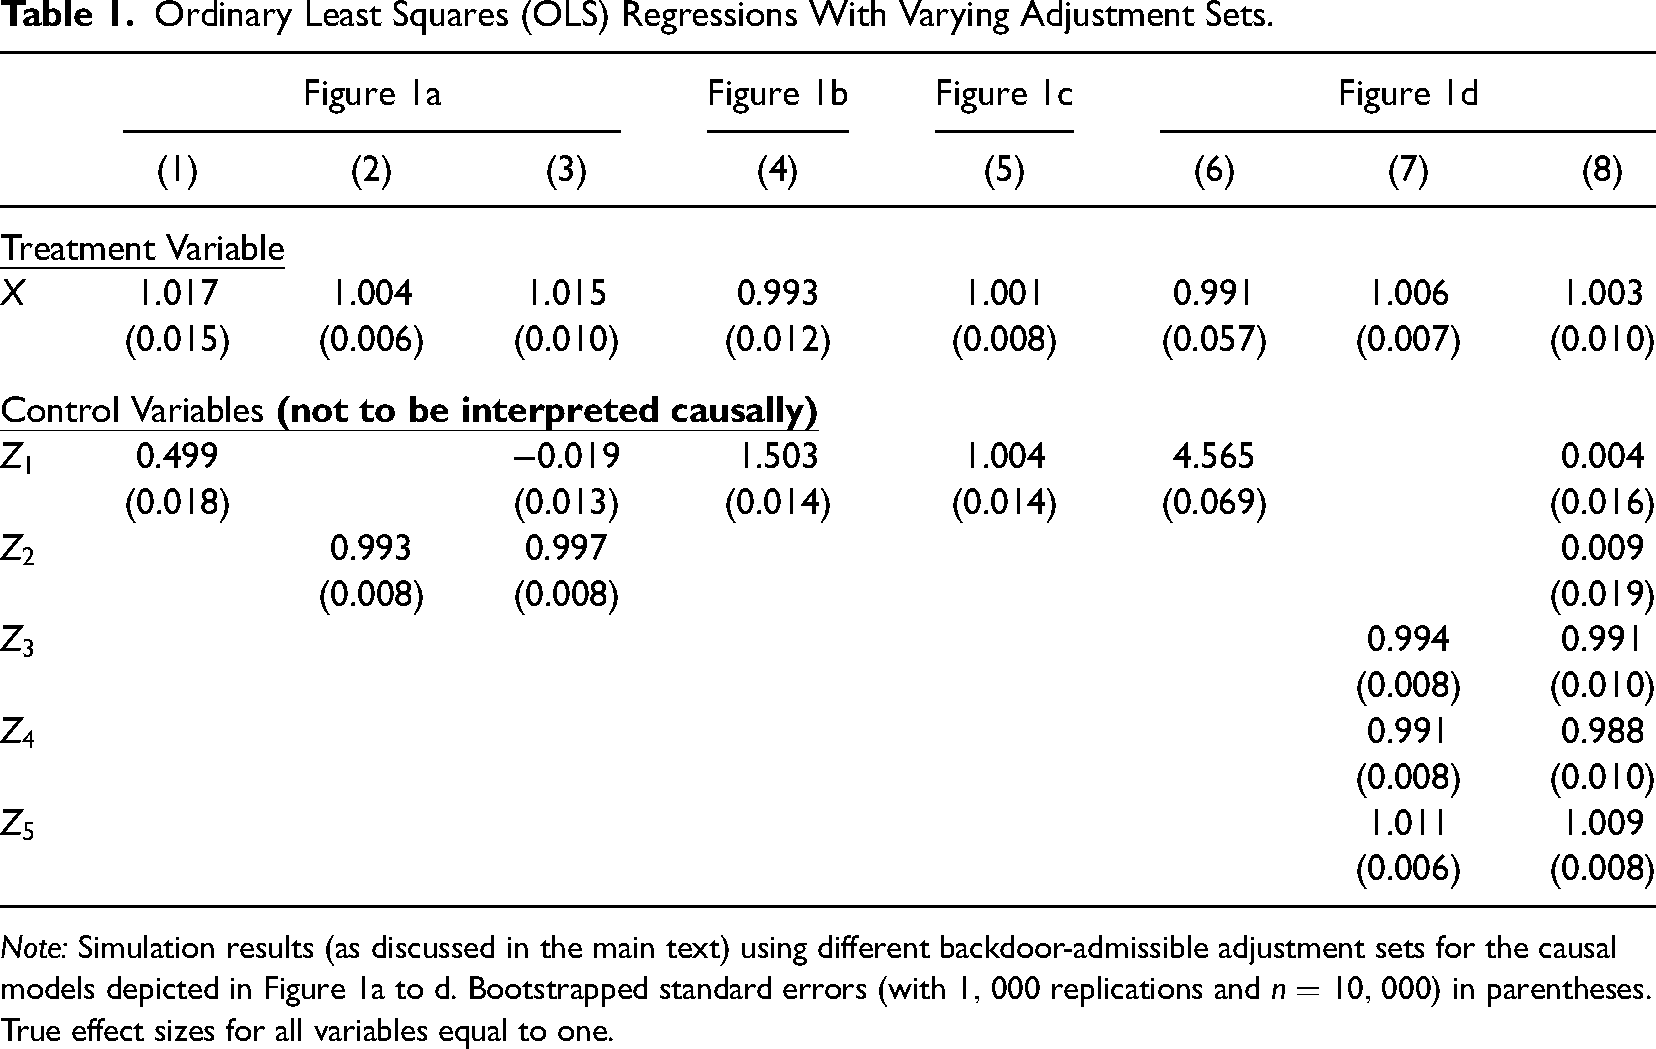
Note: Simulation results (as discussed in the main text) using different backdoor-admissible adjustment sets for the causal models depicted in Figure 1a to d. Bootstrapped standard errors (with
Figure 1b and c highlight under which conditions effect estimates of control variables can be interpreted causally. In Figure 1b, there are two backdoor paths: 
This is different in Figure 1c. Here the two backdoor paths are 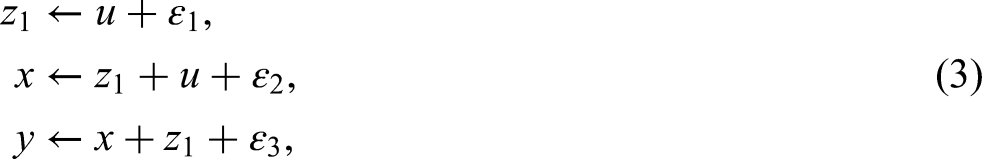
Finally, Figure 1d depicts a more complex setting, with several admissible sets of controls, each sufficient to identify the causal effect of 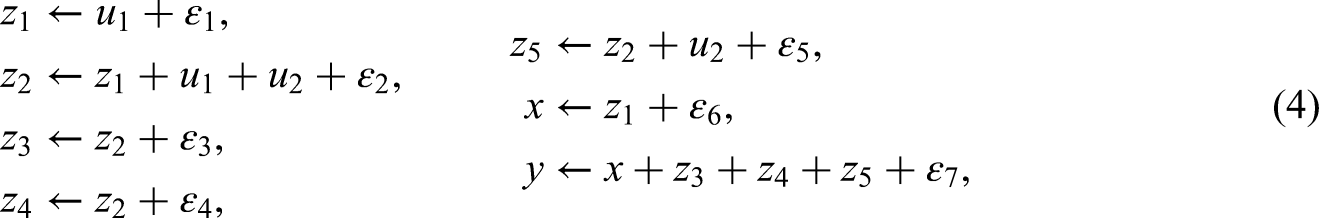
Examples
In the following section, we present practical applications that illustrate our previous theoretical points. To start as simply as possible, we were looking for examples that employ standard regression models instead of more advanced empirical techniques. One challenge in this regard is that papers with simple OLS regressions often refrain from making causal claims and instead resort to alternative formulations to describe effect sizes, such as “association,” “pattern,” or “link” (Hernán, 2018). However, a recent paper by Hoffman & Strezhnev (2023) provides a fitting example. The authors estimate the causal effect of longer travel time on the probability of a default judgement being made in eviction cases as a result of defendants not showing up or being late to court. Using OLS in a sample of more than 200,000 eviction proceedings in the city of Philadelphia between 2005 and 2021, they find that an increase of one hour in estimated travel time raises the likelihood of a default judgement by 3.8%–8.6%. This effect is meaningful because defaults are difficult to reopen and tenants who fail to show up in court cannot benefit from “Civil Gideon” protections offered in major urban areas in the United States.
In their models, Hoffman and Strezhnev control for neighborhood characteristics such as census tract income levels, as well as race and ethnicity. Interestingly, for our discussion, they also control for building characteristics and find a positive and statistically significant effect size of multi-unit apartment buildings (compared to row houses or single family dwelling) on the probability of default judgements. However, as the authors discuss in their paper, this relationship is unlikely to have a causal interpretation, since building characteristics might be correlated with other influence factors such as unfavorable terms in residential leases or the geographical distribution of dwellings within the city. We now turn to an example closer to the organizational research context.
Early Research Exposure and Career Choices
Azoulay et al. (2021) investigate the effect of early career exposure to frontier research on the career trajectory of potential innovators. Their specific empirical setting is the Associate Training Program (ATP) of the National Institutes of Health (NIH) in the United States. The ATP was started in 1953 as a training program for recent MD graduates. Participants were sent to the NIH intramural campus in Bethesda, Maryland, to receive two to three years research training under the supervision of NIH investigators. Since the NIH was originally established within the Marine Hospital Service, participation in the program fulfilled a draftee’s military service obligation. Therefore, applying to the ATP became particularly popular among young physicians during the Vietnam War period (1965–1975).
After a first screening round, applicants were invited to an interview on NIH campus to determine who would eventually be selected to participate in the program. Selection criteria were related to applicants’ prior research activities (which Azoulay et al. measure by their number of pre-ATP publications), their academic achievements (proxied by whether they were elected to the
Figure 2 synthesizes the assumptions leading to the empirical strategy by Azoulay et al. in the form of a causal diagram. Controlling for applicants’ prior research activities, academic achievements, experience and school reputation (the authors incorporate several covariates for each of these dimensions, including medical school and internship hospital fixed effects) is a valid backdoor adjustment set for estimating the causal effect of ATP participation on the choice of pursuing a research career in this graph.
6
The analysis depends crucially on the assumption that the unobserved (latent) variable research potential does not directly affect program participation (ATP Participation
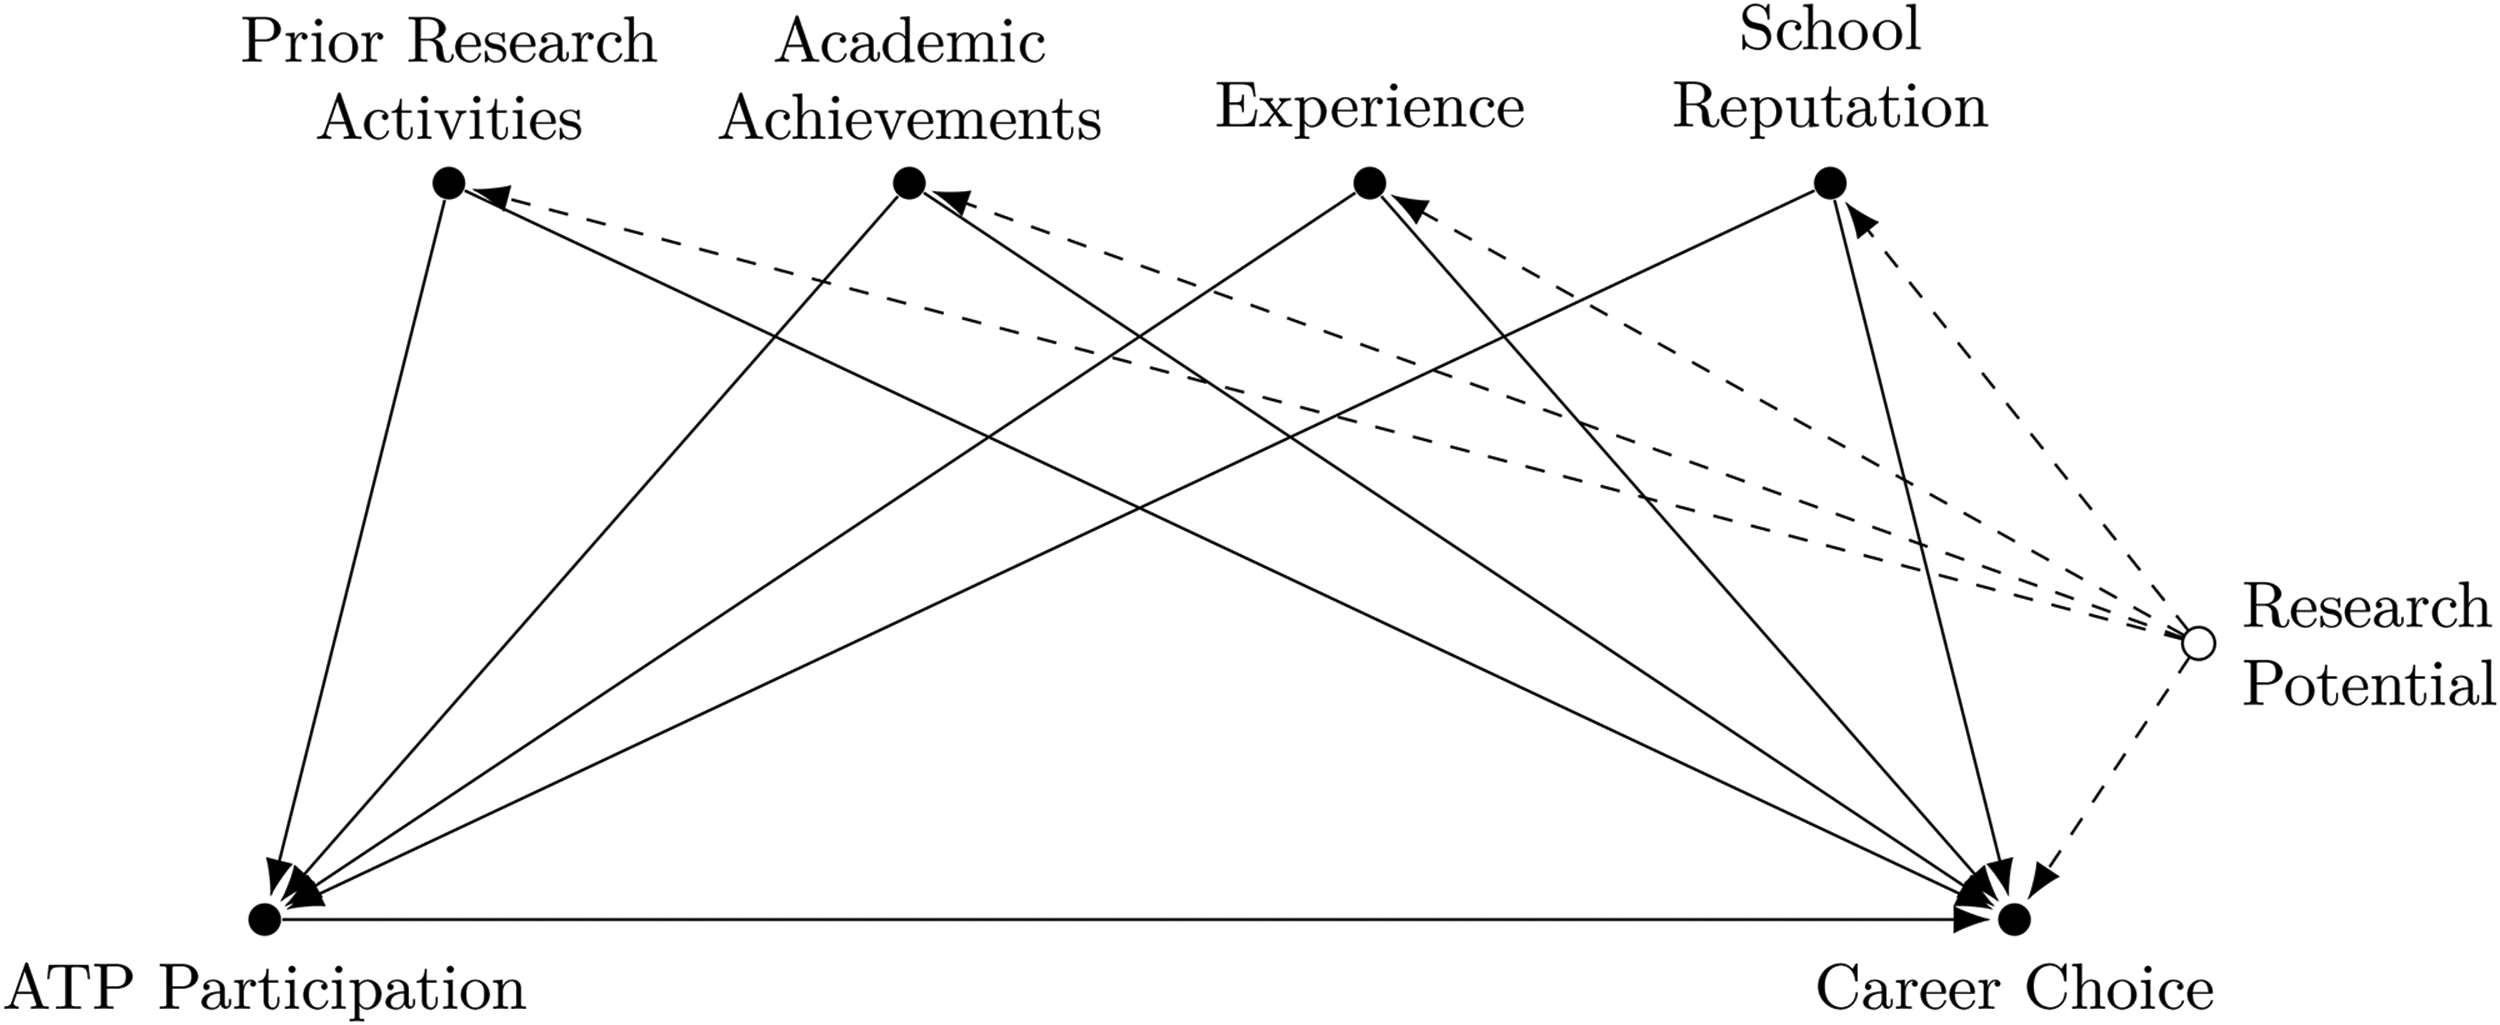
Causal diagram visualizing the empirical strategy by Azoulay et al. (2021).
Azoulay et al. employ an inverse probability weighting estimator (Austin & Stuart, 2015). As such, covariates are only used to estimate the propensity score of receiving treatment and do not appear in an outcome regression. However, in this setting, it would also not be advisable to interpret the effect of control variables such as prior research activities on career choice. The latent node research potential jointly affects an applicant’s prior research activities as well as future career choices. Thus, while prior research activity is a valid control for the effect of ATP participation, it is also endogenous, similar to the situation in Figure 1b. Consequently, even if we were to find a positive correlation between prior research activities and pursuing a research career (which is not reported by Azoulay et al.), it would be premature to conclude that, for example, early publication success during medical school is a significant driver of subsequent career choices, since both of these variables are likely confounded by an applicant’s overall ability. The research design only allows to draw policy conclusions for the treatment variable ATP participation. Researchers should, therefore, be careful not to overinterpret their empirical results, even if that promises to offer interesting additional perspectives on a given research topic.
Analyst Coverage and Innovation
In applied empirical research, it is not uncommon for estimated treatment effects to change significantly when more advanced identification strategies are employed compared to standard OLS regression. For example, Hopp et al. (2020) find that CEO appearance is no longer related to company performance once firm fixed effects are incorporated in the analysis. Using a discrete choice experiment, Mas & Pallais (2017) show that on average workers value flexible work arrangements much less than a simple compensating wage differentials regression would indicate. Furthermore, because of simultaneity bias, policing levels and crime rates are often positively related, while Mello (2019) demonstrates a negative causal effect of policing on crime, exploiting a natural experiment in a difference-and-difference design.
If subsequent research uses the same variables as controls, however, it becomes immediately clear that their estimated regression coefficients should not be interpreted in a causal way. One case in point comes from the literature on analyst coverage and innovation. He & Tian (2013) find a negative relationship between analyst coverage and patenting in a study of U.S. public firms from 1993 to 2005, using difference-and-differences and an instrumental variable approach. It has been theorized that this result arises because external stock market analysts following a firm often exert excessive pressure on executives, which can worsen managerial myopia and impede investment in long-term innovation projects. For these reasons, analyst coverage is used as a control variable in other studies of R&D activities in publicly listed firms. However, since it is not the main variable of interest in these studies, often less stringent identification strategies are employed, possibly leading to unexpected results. For example, Chen et al. (2016) and Huang et al. (2022) consistently find positive effects of analyst coverage in regressions with the natural logarithm of patents as the dependent variable, which seemingly contradicts He & Tian (2013).
Analyst coverage can be a valid control variable even though it is endogenous (if the underlying causal structure, e.g., corresponds to Figure 1b). Nevertheless, interpreting positive regression coefficients as evidence against He & Tian (2013) would be a mistake. To use the analogy of Bayesian updating, control variable estimates from studies such as Chen et al. (2016) and Huang et al. (2022) should not alter the posterior probability of analyst coverage having a negative effect on innovation. Consequently, in another study by Chen et al. (2021), in which analyst coverage is also included as a control variable in a patent count regression, the regression coefficients of the controls are not reported. This is in accordance with the recommendations that we will discuss in the following.
Discussion and Recommendations
Beyond pure prediction tasks, the purpose of regression analysis in organizational research is typically to build and test theories that explain the causal mechanisms underlying a studied phenomenon (Sutton & Staw, 1995). In this article, we argued that attaching substantive meaning to the marginal effects of biased control variables is problematic, however, as researchers could develop false intuitions or draw erroneous managerial and policy conclusions. Therefore, we think it is advisable to not discuss the results obtained for control variables in quantitative papers, unless the researchers can be sure that they have accounted for all relevant influence factors of the outcome in a regression (all-causes regression). Since in many practical settings this is unlikely to be the case, we recommend to treat controls as nuisance parameters, which are included in the analysis for identification purposes (and discussed as such) but their effects are not interpreted (Liang & Zeger, 1995; Meehl, 1971). This corresponds to the way control variables are treated by nonparametric matching estimators (Heckman et al., 1998) and modern machine learning techniques for high-dimensional settings (Chernozhukov et al., 2018; Hünermund et al., 2023). These methods do not report estimation results related to controls, either because there would be simply too many covariates in the analysis (which is the primary use-case for machine learning) or marginal effects of control variables are not returned by the estimation protocol (as in the matching case).
Our recommendations thereby depart from prior literature insofar as control variable should not be promoted to have equal status with the other variables in the study (Spector & Brannick, 2011: p. 297). Research designs based on control variables are employed to estimate the causal effect of a treatment variable on an outcome. As such, the treatment variable cannot be endogenous, otherwise estimates would be biased and other, more suitable research designs (such as instrumental variables, regression discontinuity designs, etc.) should be applied. By contrast, control variables can be endogenous (Frölich, 2008) and, as we argued in the preceding theoretical discussion, will likely be so in practice. 7 Controls should be chosen to close all backdoor paths between a treatment and outcome, based on a theoretical model of the context under study (Bono & McNamara, 2011). As we have demonstrated previously, it is thereby not necessary to include all causal influence factors of the outcome variable in a regression. Our example (Azoulay et al., 2021) illustrates that in many cases it might actually be easier to control the treatment assignment mechanism instead, if institutional knowledge is richer about what determines treatment take-up compared to the potentially long list of variables that affect the outcome. Moreover, in many situations, researchers have the choice between different valid adjustment sets (see Figure 1d), which highlights their auxiliary nature for the analysis.
Since accounting for all influence factors of the outcome might be unrealistic in many contexts and control variables are therefore likely to be endogenous, interpreting their effect sizes in light of theory is potentially dangerous. Authors could infer wrong conclusions for managerial advice and subsequent studies might be inclined to build a theory based on biased empirical results. To avoid this, we therefore recommend to refrain from interpreting control variables in published papers. Moreover, predicting the sign of control variable estimates ex-ante (Atinc et al., 2012) is difficult if endogenous control variables can pick up the effect of a multitude of other influence factors. Therefore, formulations such as “estimates of control variables have expected signs” should be avoided. As a “nudge” to stir the research community away from overinterpreting control variables, we find it appropriate that authors omit their coefficients entirely from regression tables or relegate them to an appendix.
Table 2 (which is an adapted version of Table 1) illustrates such a regression table format, in which check marks are included to indicate which variables were controlled for. This corresponds to the way how estimation results are presented, for example, in papers using nearest neighbor or propensity score matching. We acknowledge that omitting control variable coefficients in regression tables constitutes a tradeoff with respect to transparency. However, we believe that this suggestion is justified by the lower risk of drawing incorrect theoretical inferences from empirical studies. When authors have important reasons for reporting regression coefficients of control variables, the format of Table 1 constitutes a viable compromise, in our view. Compared to the standard format of regression table, Table 1 clearly separates controls from the treatment variable and includes a note that the control variable estimates should not be interpreted causally.
Regression Table Without Control Variable Coefficients Being Reported.
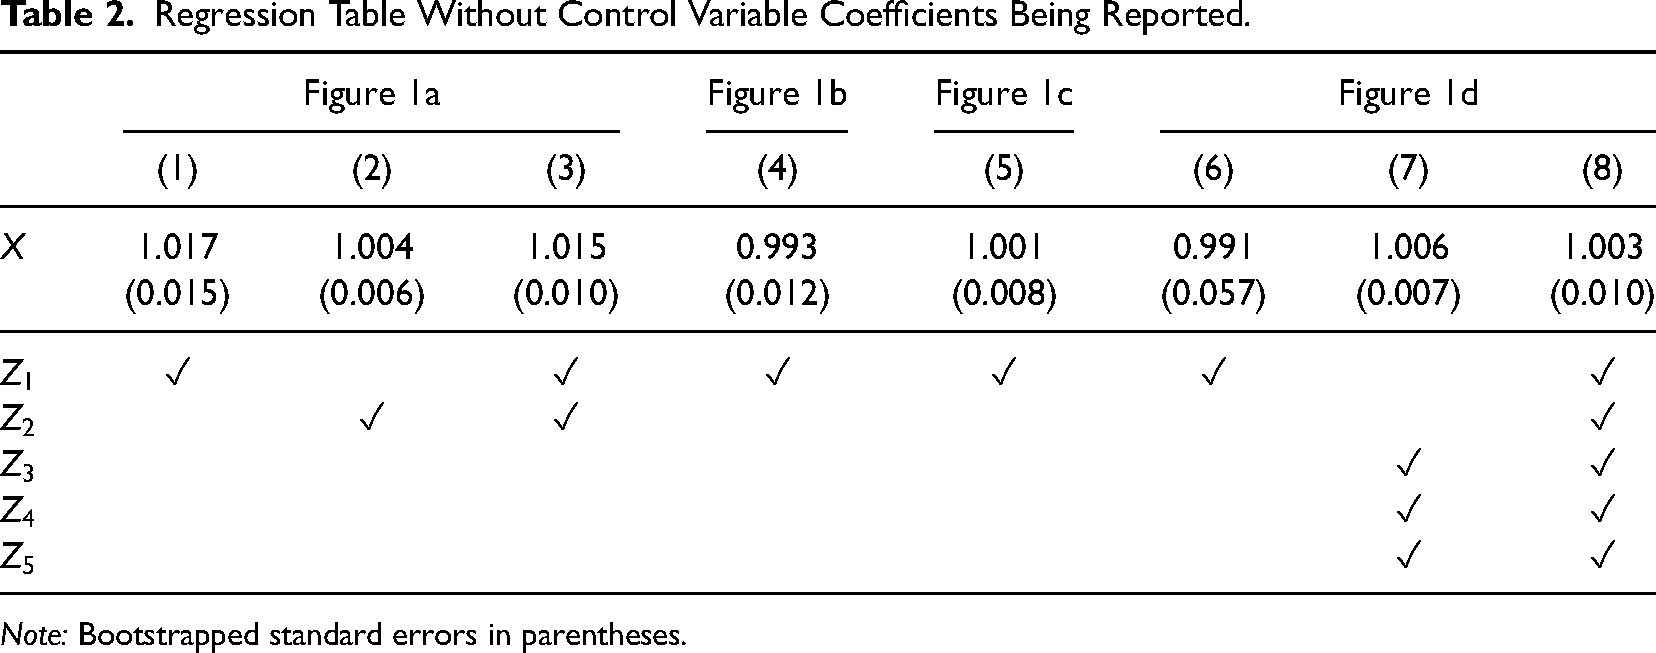
Note: Bootstrapped standard errors in parentheses.
We emphasize that we agree with Becker (2005) in that control variables should be carefully discussed and authors need to justify their validity based on prior theory. However, their estimated coefficients are less relevant. It suffices to discuss the rationale for selecting specific control variables in the empirical section and to clearly indicate their inclusion in the table notes. Since the proper justification of a regression design can only come from theory, we caution against deciding about the inclusion of control variables based on their incremental contribution to the
Our recommendations are in line with Westreich & Greenland (2013) who discuss a similar problem with respect to the interpretation of potentially endogenous controls in epidemiology. Because epidemiological studies usually present the results of multivariate regression analyses right after a table with descriptive statistics of the data, they coined the term table 2 fallacy. Keele et al. (2020) discuss related examples from the field of political science. They emphasize that for estimates of control variables to be given a causal interpretation, their effects need to be themselves causally identified. Since this is only plausible if there are no omitted variables (or the controls are unrelated to the omitted variables), we recommend researchers to focus attention on one causal factor (or a small set) at a time, for which backdoor paths can realistically be enumerated, and treat control variables as nuisance parameters instead.
Finally, we caution against including estimates of potentially biased controls in meta-analyses (Aguinis et al., 2010). Such studies pool the effects of a focal variable on an outcome across several papers. According to Becker (2005), systematic reporting of control variables facilitates cumulative science and knowledge aggregation by significantly increasing the pool of studies from which effect sizes for meta-analyses can be drawn from: Nonreporting of control variable findings hinder any meta-analyses that would have otherwise included the controls. For instance, in a study of the relationship between employee commitment and organizational citizenship behavior, a researcher might control for extraversion and agreeableness but not report the findings for the controls. As a result, later meta-analyses cannot include these findings in the assessment of connections between personality and organizational citizenship behavior. Becker (2005: p. 285)
This recommendation refers to meta-analyses of partial correlations and marginal effects (“meta-regression”), which are increasingly common in organizational research and economics (Stanley & Doucouliagos, 2012). Compared to zero-order correlations, they have the advantage of being able to filter out other potential confounding influence factors in settings when randomized control trials are not feasible. 8 However, the quoted passage fails to mention that control variables (here extraversion and agreeableness) are unlikely to have a causal interpretation themselves and, therefore, add little to the evidence base regarding a certain effect size. As their coefficients may represent a combination of several different causal mechanisms jointly operating on the outcome (here citizenship behavior), they do not provide accurate information about a theoretically meaningful quantity. Moreover, coefficients can vary substantially depending on which admissible adjustment sets are used (e.g., compare columns 6–8 in Table 1). Consequently, meta-analyses should be restricted to the main treatment variable(s), for which a plausible identification argument can be established, which highlights once again the unequal status of treatment and control variables in regression analysis.
To conclude, there is no reason to be worried if the estimated coefficients of control variables do not have expected signs, since they are likely to be biased anyway in practical applications. Instead, researchers should rather focus on interpreting the marginal effects of the main variables of interest in their manuscripts. The estimation results obtained for controls, by contrast, have little substantive meaning and can therefore safely be omitted—or relegated to an appendix. This approach will not only prevent researchers from drawing wrong causal conclusions based on endogenous controls, but will furthermore allow to streamline the discussion sections of quantitative research papers and save on valuable manuscript space.
Supplemental Material
sj-pdf-1-orm-10.1177_10944281231219274 - Supplemental material for On the Nuisance of Control Variables in Causal Regression Analysis
Supplemental material, sj-pdf-1-orm-10.1177_10944281231219274 for On the Nuisance of Control Variables in Causal Regression Analysis by Paul Hünermund and Beyers Louw in Organizational Research Methods
Footnotes
Declaration of Conflicting Interests
The author(s) declared no potential conflicts of interest with respect to the research, authorship, and/or publication of this article.
Funding
The author(s) received no financial support for the research, authorship and/or publication of this article.
Supplemental Material
Supplemental material for this article is available online.
Notes
Author Biographies
References
Supplementary Material
Please find the following supplemental material available below.
For Open Access articles published under a Creative Commons License, all supplemental material carries the same license as the article it is associated with.
For non-Open Access articles published, all supplemental material carries a non-exclusive license, and permission requests for re-use of supplemental material or any part of supplemental material shall be sent directly to the copyright owner as specified in the copyright notice associated with the article.