
Abstract
IR-tree models assume that categorical item responses can best be explained by multiple response processes. In the present article, guidelines are provided for the development and interpretation of IR-tree models. In more detail, the relationship between a tree diagram, the model equations, and the analysis on the basis of pseudo-items is described. Moreover, it is shown that IR-tree models do not allow conclusions about the sequential order of the processes, and that mistakes in the model specification can have serious consequences. Furthermore, multiple-group IR-tree models are presented as a novel extension of IR-tree models to data from heterogeneous units. This allows, for example, to investigate differences across countries or organizations with respect to core parameters of the IR-tree model. Finally, an empirical example on organizational commitment and response styles is presented.
Keywords
Item response tree (IR-tree) models are a class of item response theory (IRT) models that assume that the responses to polytomous items can best be explained by multiple psychological processes (Böckenholt, 2012; Tutz, 1990). Thus, IR-tree models go beyond standard IRT models like the graded response model (GRM) that usually comprise only one process or dimension. Importantly, IR-tree models may contain processes that are not related to the degree of agreement. Therefore, they are well suited to address response styles such as the tendency toward extreme categories (extreme response style, ERS) or toward the midpoint of a scale (midpoint response style, MRS; see also Baumgartner & Steenkamp, 2001).
Even though the idea of modeling multiple processes in categorical data has existed for years (e.g., Maris, 1995; McFadden, 1981; Tutz, 1990), these models didn’t gain much interest in psychology until the seminal publications of Böckenholt (2012) and De Boeck and Partchev (2012). Since then, IR-tree models have attained increasing popularity in psychometrics (e.g., Meiser, Plieninger, & Henninger, 2019; Plieninger & Heck, 2018; Tijmstra, Bolsinova, & Jeon, 2018) as well as in applied fields (e.g., DiTrapani, Jeon, De Boeck, & Partchev, 2016; Lang, Lievens, De Fruyt, Zettler, & Tackett, 2019; Zettler, Lang, Hülsheger, & Hilbig, 2016).
The goal of the present article is twofold. The first goal is to make IR-tree models easily accessible to scholars in organizational psychology and beyond. To this end, guidelines for IR-tree models are presented that elaborate on and highlight important points of the relevant psychometric literature. These will be presented in the first section, followed by a section on caveats and pitfalls to illustrate what can go wrong if one does not adhere to these guidelines. The second goal is to present a new extension of IR-tree models to multiple groups that is applicable to data that are collected from potentially heterogeneous units such as different countries or organizations. The last section puts all this into illustrative practice by means of an application to empirical data on organizational commitment. In summary, the present work will help scholars to review published work on IR-tree models, to apply existing IR-tree models to their own single- or multigroup data, and to develop new IR-tree models for research questions specific to their field. The examples used herein will, without loss of generality, focus on response style modeling, but many other applications are possible as well (see below).
IR-Tree Modeling
As of today, most applications of IR-tree models focus on response styles, and researchers in organizational psychology may make similar use of IR-tree models if they want to control for such response tendencies. Examples of such applications are the study by LaHuis, Blackmore, Bryant-Lees, and Delgado (2019), who investigated factors predicting job performance, or the analysis by Böckenholt (2012), who studied consumer ethics. However, IR-tree models may also be used outside the area of response styles, and examples relevant to organizational psychology include modeling the compromise effect in economic choices (Böckenholt, 2012), and modeling answer changes (Jeon, De Boeck, & van der Linden, 2017) or missing answers (Debeer, Janssen, & De Boeck, 2017; Jeon & De Boeck, 2016). Additional examples for future applications are listed in the section Further IR-Tree Models.
Thus, IR-tree models can be applied in situations where discrete data are suspect to individual differences in more than one latent variable or process. These models may then be used instead of a unidimensional model, and guidelines for IR-tree modeling will be presented in the following. More specifically, the three building blocks of IR-tree models will be presented illustrating how a tree diagram leads to a set of model equations that can be used to define pseudo-items for estimation.
Tree Diagram
IR-tree models have the advantage that tree diagrams can help to both illustrate and develop a model. Such tree diagrams are also used for multinomial processing tree (MPT) models in cognitive psychology (e.g., Riefer & Batchelder, 1988), and IR-tree models are a special case of hierarchical MPT models (Matzke, Dolan, Batchelder, & Wagenmakers, 2015; Plieninger & Heck, 2018). Herein, I will focus on an IR-tree model for items with five response categories k (
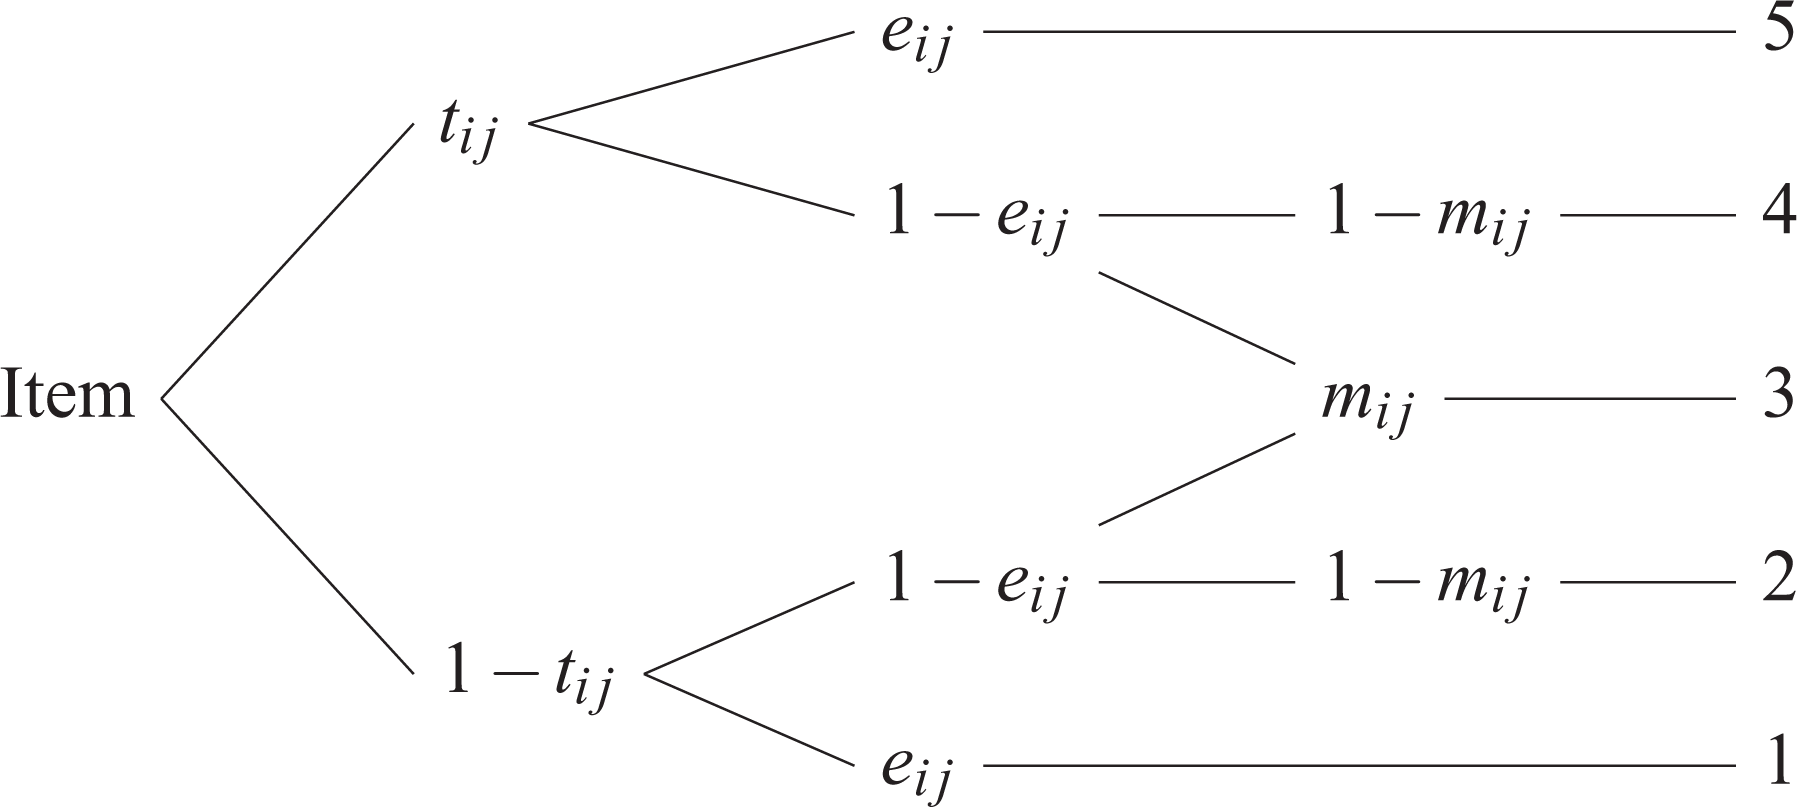
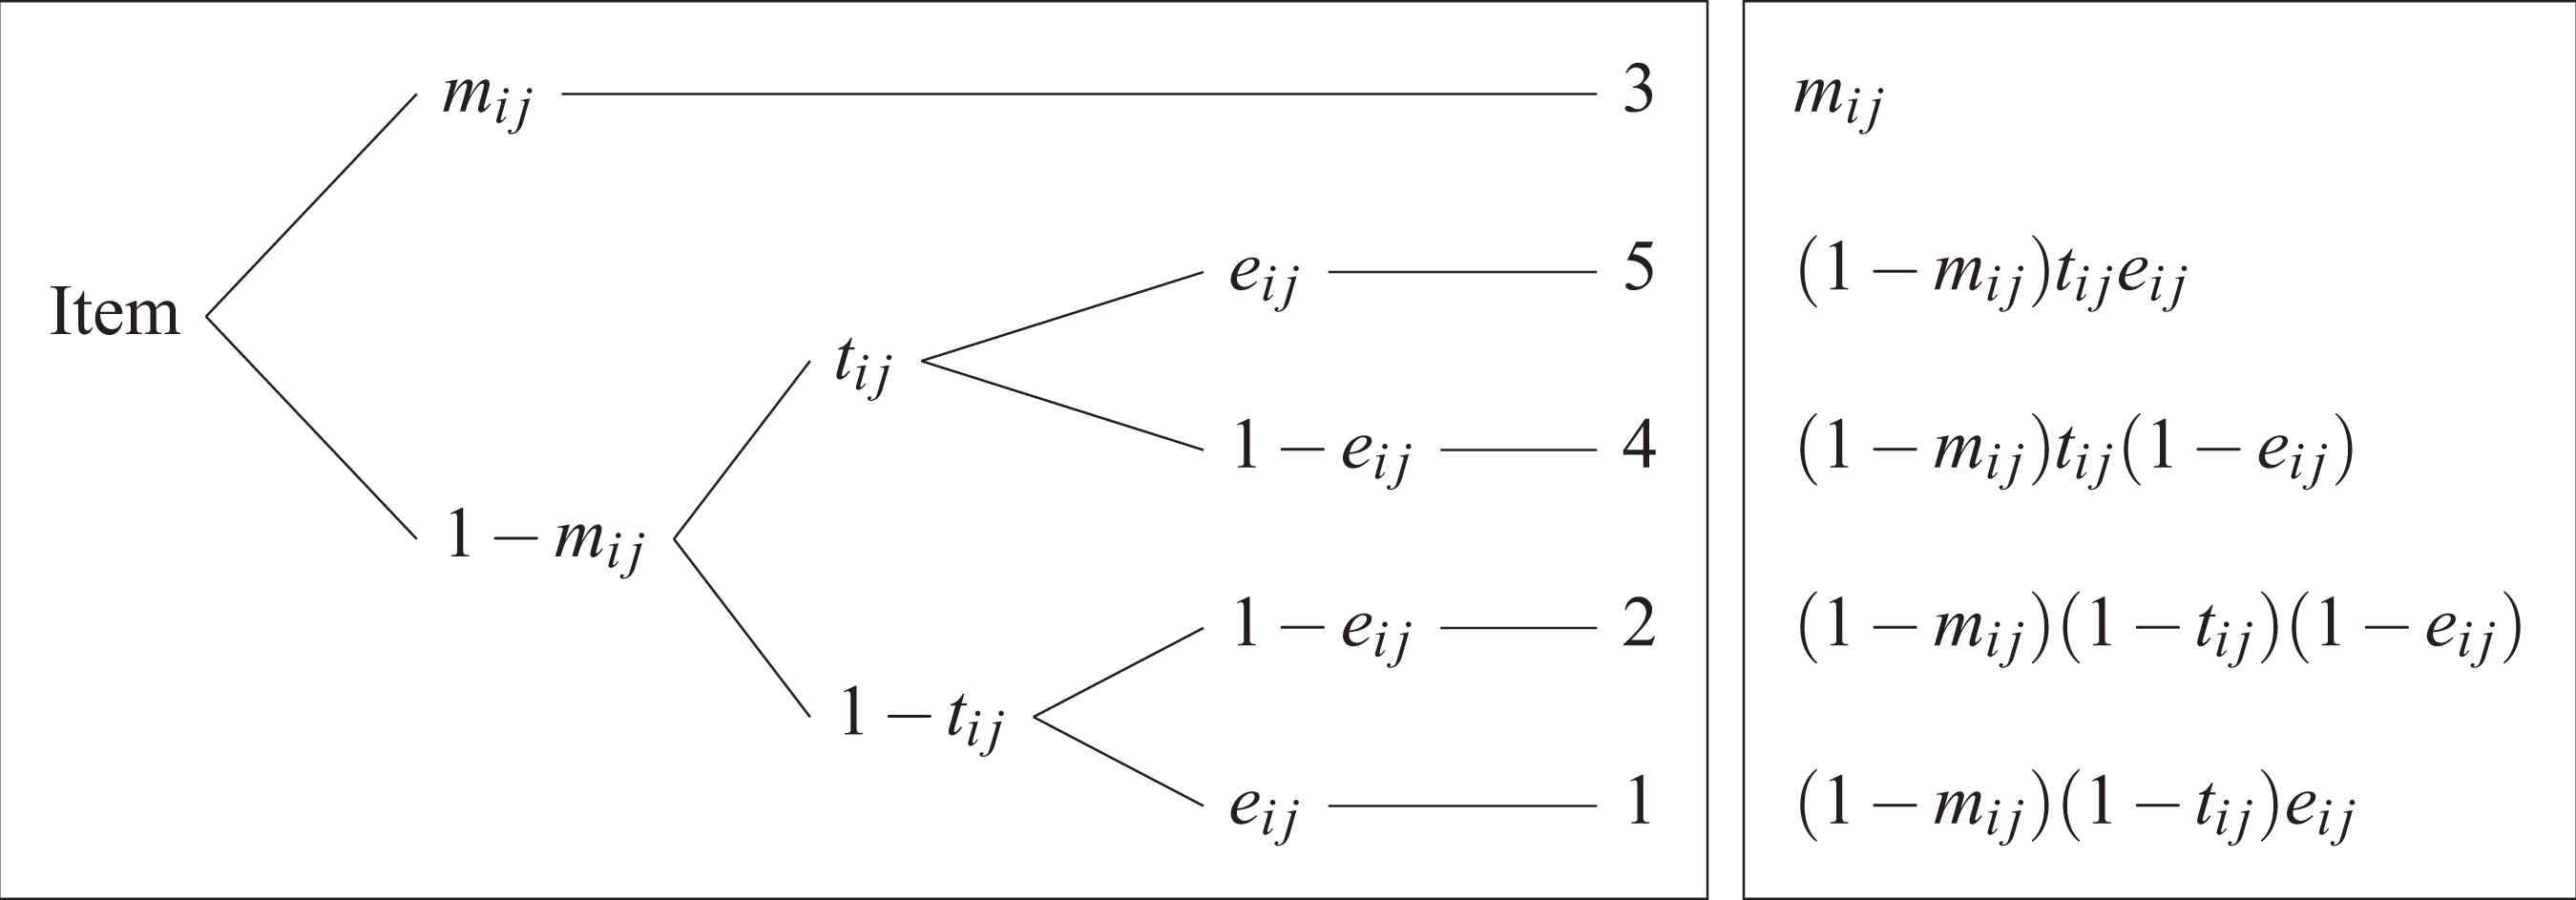
Diagram of the MCN model, an IR-tree model for 5-point items composed of the processes t (target trait), e (extreme response style), and m (midpoint response style).
The model parameters

where


Thus, the probability to agree (i.e.,
In summary, the model assumes that responses to 5-point items can be explained by the target trait as well as the two response styles MRS and ERS. Often, an IR-tree model fits better than a unidimensional alternative, and this is taken as an indication that response styles are present in the data at hand (e.g., Böckenholt, 2012; Khorramdel & von Davier, 2014; Plieninger & Meiser, 2014). The IR-tree model then allows to measure response styles as well as the response-style free target trait.
Model Equations
The model is formally defined by its model equation that is implied by the tree diagram (Böckenholt, 2012; Plieninger & Heck, 2018; Riefer & Batchelder, 1988). Let
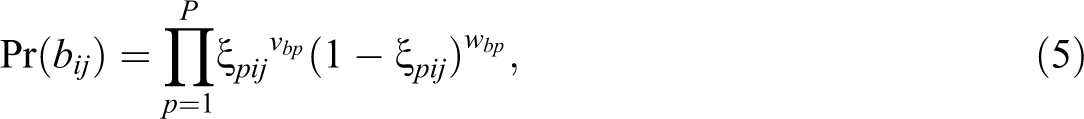
where
If multiple branches b lead to a category k, the respective probabilities of the corresponding branches
For the MCN model, this general formulation implies the five equations given below. For example, the probability for Category 3 is given by adding the probabilities of the two respective branches shown in Figure 1.


These model equations, combined with the reparameterizations specified in Equations 2–4, define the multinomial distribution. They illustrate the model in a condense form and guide the interpretation. Here, for example, 9 shows that the probability to choose Category 3 is governed only by the parameters e and m. This is evident from Figure 1 only on closer inspection: The upper branch leading to Category 3 contains the term t, and the lower branch contains the term
In summary, both the tree diagram and the model equations are helpful means to develop and interpret a model. While the diagram is more illustrative, the equations show more directly the relationship between each category and the parameters involved. Moreover, the model equations define the pseudo-items that are useful for data analysis.
Pseudo-Items
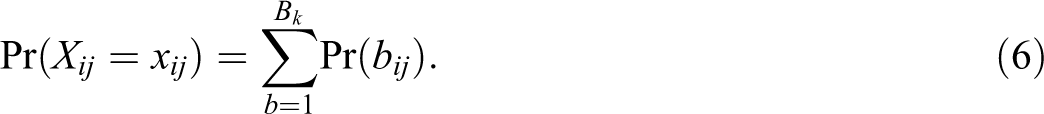
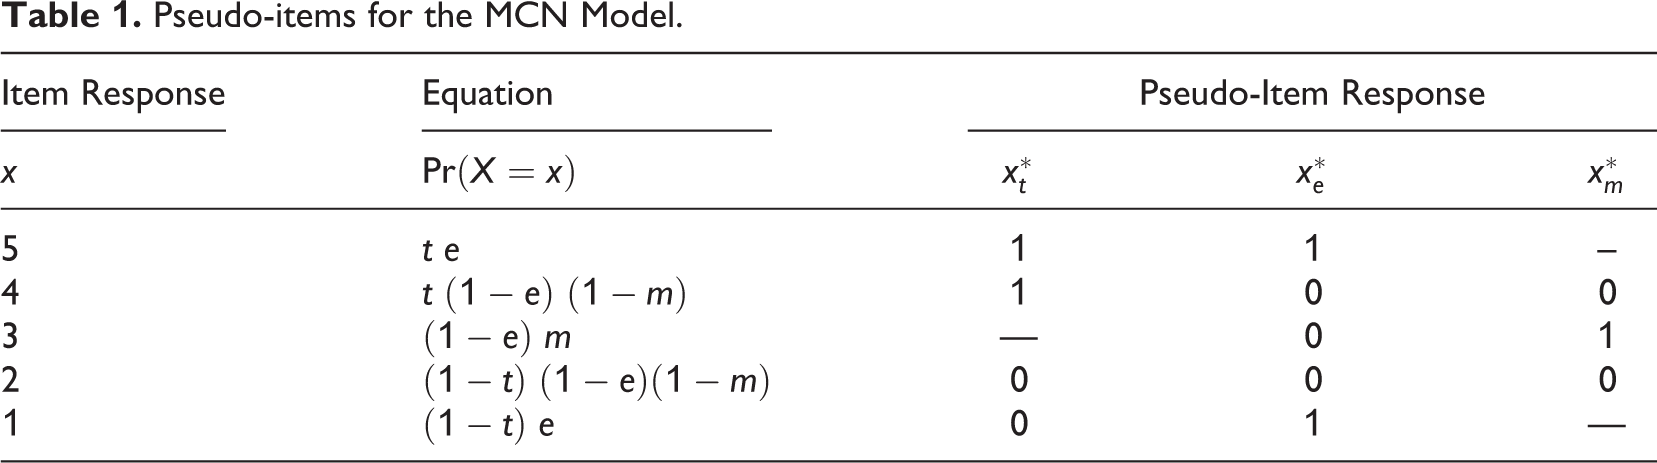
A convenient feature of IR-tree models is that they can be estimated using software such as Mplus or R (e.g., Böckenholt, 2012; De Boeck & Partchev, 2012). To this end, the original data have to be recoded into so-called binary pseudo-responses (or pseudo-items) according to the following set of rules: The original response x is recoded into P pseudo-responses If the model equation pertaining to response x contains parameter If the model equation pertaining to response x contains parameter If the model equation pertaining to response x does neither contain
This is illustrated for a strongly disagree response (i.e.,
Pseudo-items for the MCN Model.
In practice, the recoding procedure is applied to all responses
Further IR-Tree Models
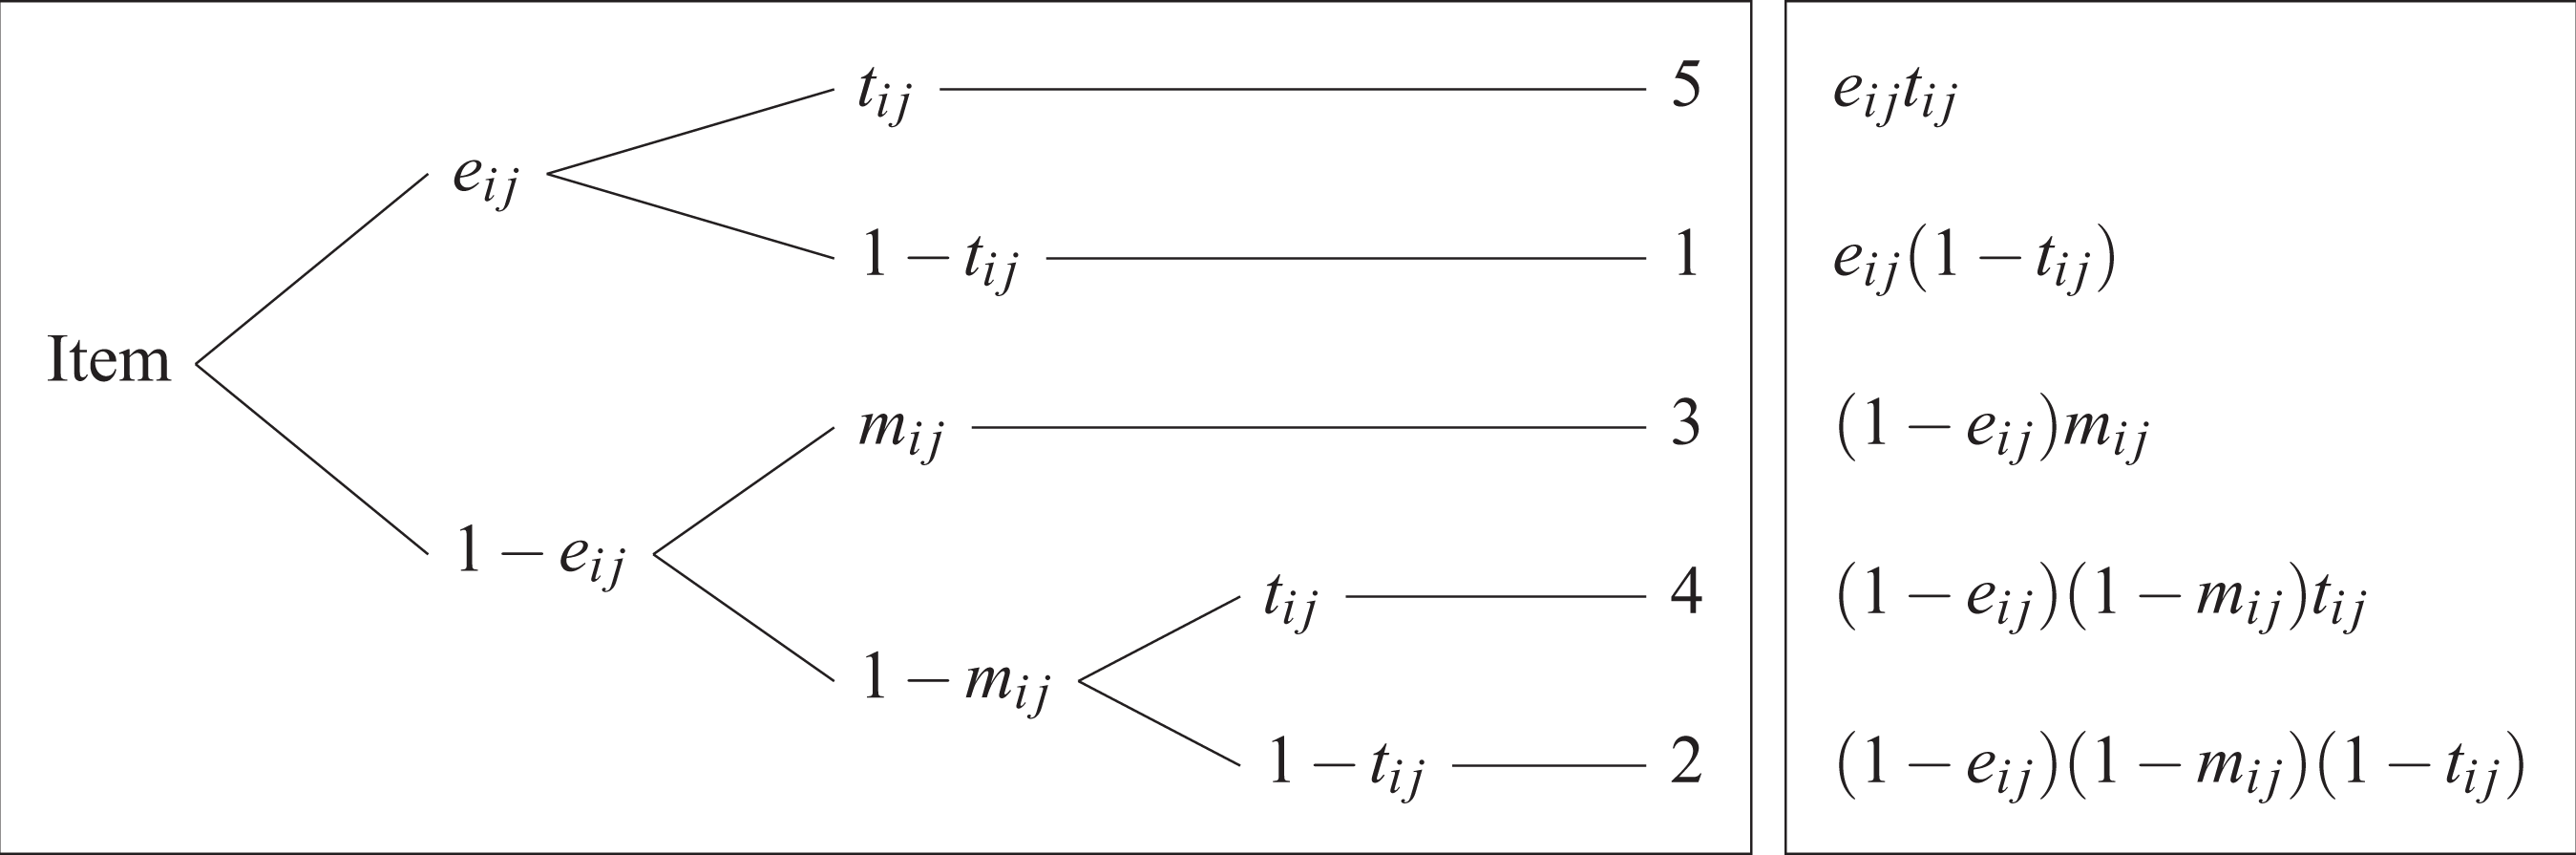
A further, very popular IR-tree model for 5-point items was proposed by Böckenholt (2012). It is shown in Figure 2 and will be called the extremity conditionally on nonmidpoint (ECN) model. The model is composed of the processes t (target trait), e (extreme response style), and m (midpoint response style), and the tree diagram implies the model equations depicted in Figure 2. These equations lead to the following pseudo-items:
The ECN model: The tree diagram is depicted on the left, the model equations on the right.
Apart from that, IR-tree models can be suitable for categorical data outside the area of response style research. Consider the model in Figure 3 that comprises two processes (see also De Boeck & Partchev, 2012; Tutz, 1990). Such a model may be appropriate in cases where one process is only applicable for “positive” outcomes of the other process. For example, process r may correspond to making a choice or not, and process s may differentiate between two different choices B1 and B2. Or, process r may encode whether someone was absent from work, and process s may differentiate between two different reasons for absenteeism. Or, in a situational judgment test (SJT; see also Lievens et al., 2018), process r may encode whether a chosen option was “correct,” and process s may differentiate between different types of correct behavior.
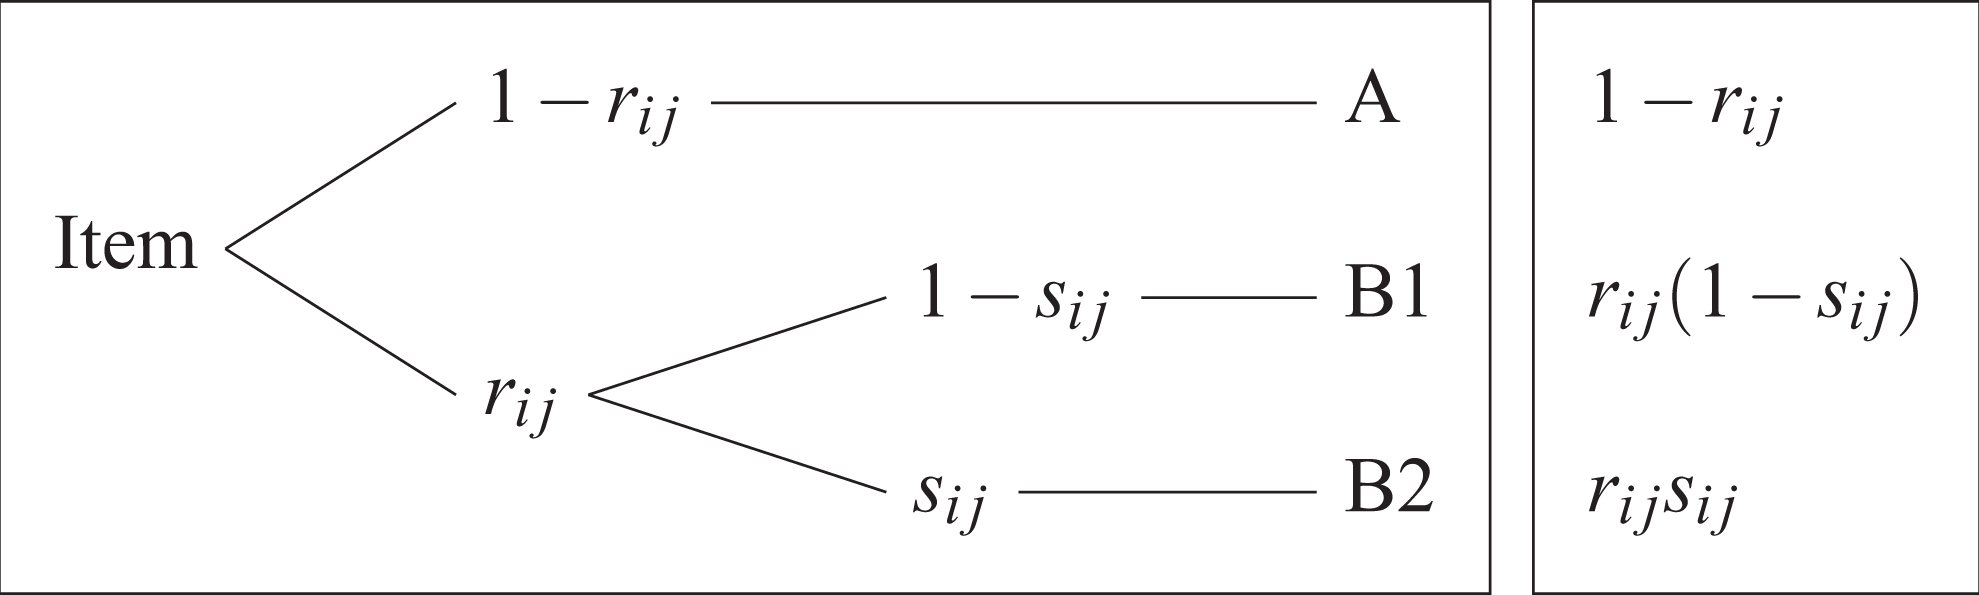
An IR-tree model for items with three outcomes, A, B1, and B2: The tree diagram is depicted on the left, the model equations on the right.
Caveats and Pitfalls of IR-Tree Modeling
The guidelines above describe the steps that are necessary to develop, apply, and interpret an IR-tree model. However, things can go wrong in this process, and two issues that need special attention will be discussed in the following. These caveats together with the guidelines above will help scholars to leverage the full potential of IR-tree models.
Order of Psychological Processes
The first issue concerns the order of the latent processes. Tree diagrams such as the one depicted in Figure 1 are drawn with a specific order of the parameters
Additionally, a set of model equations such as Equations 7
–11 can sometimes be illustrated using different diagrams. For example, the diagram depicted in Figure 4 also represents an IR-tree model. Therein, respondents choose with probability
Alternative diagram of the MCN model shown in the box on the left. Even though the diagram is different from that in Figure 1, the implied model equations shown in the box on the right are identical.
Apart from that, it should be noted that a psychological theory about the order of the processes may be expressed in a tree diagram. The only thing to keep in mind is that it does not work the other way round, that is, the IR-tree model does not provide a formal test of the order. Furthermore, one may argue that some probabilities in an IR-tree model can be expressed as conditional probabilities thus implying some sort of order. For example, in the MCN model (see Figures 1 and 4), the process m does only occur in combination with nonextremity
In summary, IR-tree models allow interpretations and make assumptions about the nature of the psychological processes that are involved, but not about their sequential order. Such interpretations are misleading and must be based on other research designs and statistical models if desired.
Definition of Pseudo-Items
The second issue concerns parameter estimation on the basis of pseudo-items. As explained above, an IR-tree model may be estimated in the form of a multidimensional, binary IRT model after the original items have been recoded into binary pseudo-items. This might lead to the misconception that the pseudo-items can be defined independent of each other. For example, a researcher may want to define the third pseudo-item
Note that the estimation of an improper model may nevertheless converge without problems, because the software “doesn’t know” that an IR-tree model for polytomous data is specified rather than a multidimensional IRT model with three seemingly independent, binary items. Furthermore, it can be shown that improper models lead to biased parameter estimates and severely biased model fit.
Multiple-Group IR-Tree Models
The guidelines and caveats presented above will help to successfully use standard IR-tree models. However, specific research questions sometimes need specific model extensions.
Although many such extensions have already been presented in the literature, all these models are applicable only to data from homogeneous populations—where relevant parameter values hold for all members of that population. However, certain circumstances may lead to violations of this assumptions. For example, levels of the target trait may differ across industries or across measurement occasions. Similarly, countries may differ with respect to variability in extreme response style. Likewise, a researcher may want to investigate whether the item parameters are identical for women and men or across age groups. Ignoring existing group differences may result in misleading conclusions. One way to address such situations are multiple-group models, and these will be presented in the following. Therein, it is assumed that the structure of the tree diagram is the same for all groups, but certain parameters may differ.
Standard IRT models have been extended to multiple-group IRT models, for example, by Bock and Zimowski (1997). Likewise, IR-tree models can be extended to multiple-group IR-tree models by allowing the model parameters to differ between different groups g (

That is, given the tree diagram, which is the same for all groups, the probability of a response of person i in group g to item j depends on his or her latent ability
Furthermore, in the single-group model (
In order to make meaningful comparisons of persons across groups, invariance/equivalence of the item parameters has to be assumed or established. In the IRT literature, this is referred to as the absence of differential item functioning (DIF), while the term strong/scalar invariance is used in factor analysis (for details, see Cheung & Rensvold, 1999; Raju, Laffitte, & Byrne, 2002; Reise, Widaman, & Pugh, 1993; Tay, Meade, & Cao, 2015; Vandenberg & Lance, 2000). In detail, assuming that the item parameters do not differ across groups reduces
Conveniently, multiple-group IR-tree models can be estimated with software for multidimensional, multiple-group IRT models such as Mplus (Muthén & Muthén, 2012) as long as the model does not contain genuine mixtures (see above). An illustrative example will be presented in the next section, and the respective Mplus code is contained in the accompanying research compendium.
In summary, multiple-group IR-tree models are relevant to situations where data were collected in different countries, industries, organizations, or at different points in time, for example. The model class is a straightforward extension of IR-tree models, and thus the guidelines and caveats described above apply to single- and multiple-group models in the same way. Furthermore, multiple-group IR-tree models also build on standard multiple-group models (e.g., Reise et al., 1993; Tay et al., 2015), and thus topics such as DIF or measurement invariance apply to multiple-group IR-tree models as well. Note further that multiple-group models pertain to situations where the groups are known, but models for unknown groups (latent classes) exist as well (e.g., Tijmstra et al., 2018).
Worked Example: Response Styles and Workers’ Commitment Across Countries
In the following, an illustrative example on organizational commitment in different countries will be presented to put the first three sections of the article into practice. In detail, the guidelines for single-group models will be applied, and multiple-group models for different countries will be used to illustrate this new model class.
Method
Sample
Data from the International Social Survey Programme were used, namely, from ISSP 2015—Work Orientations IV (ISSP Research Group, 2017). The data set is composed of respondents from 37 countries, and data from Venezuela (see below) were selected, as were data from ten other countries chosen at random (selected countries were Australia, China, Croatia, Hungary, Latvia, Lithuania, Mexico, New Zealand, Slovenia, and United Kingdom). A random subsample of 500 participants (with complete cases) per country was used herein. Three countries had fewer respondents, and all participants were used in such cases. The final data set comprised 5,311 participants in total.
Measures
Respondents answered three questions about their organizational commitment, for example, “I am proud to be working for my firm or organization,” on a 5-point scale from strongly agree to strongly disagree. The correlations among the three items across all participants where
Results
First, the application of IR-tree models will be illustrated using data from one specific country, namely, Venezuela. Second, multiple-group models will be used to investigate cross-cultural patterns across all 11 countries. All models were estimated using Mplus 7.4 (Muthén & Muthén, 2012).
IR-Tree Model for Data From Venezuela
The data from Venezuela (
The parameter estimates showed the following pattern: Three
With respect to the person parameters, standard deviations of
Furthermore, the correlations among the dimensions were estimated as
In summary, the analyses suggested that response styles were present in the data from Venezuela. Those response styles could be captured by an IR-tree model, which outperformed a standard unidimensional model. Furthermore, the results indicated that the estimates from the unidimensional GRM may be biased by response styles to some extent. This will be discussed further in the following section on data from multiple countries.
Multiple-Group IR-Tree Model for Data From Multiple Countries
A multiple-group model for 11 countries was specified to investigate differences in organizational commitment as well as response styles across countries. The item parameters were set equal across countries—thus assuming strong measurement invariance or no DIF—in order to allow for meaningful comparisons of persons across countries. 1 However, no dispensable restrictions were imposed on the means, variances, and covariances of target trait, ERS, and MRS thus permitting group differences with respect to these parameters.
Again, the IR-tree model (AIC = 66,200, BIC = 66,950) fit better than the GRM (AIC = 67,460, BIC = 67,740). Furthermore, there was considerable heterogeneity of the country-level parameters. In Figure 5, the estimated latent variances and means are shown. More precisely, relative means are shown (i.e., the lowest country mean level was subtracted from all means) to facilitate interpretation. With respect to the target trait, the country level of organizational commitment was lowest in Lithuania and highest in New Zealand, and the variances showed considerable heterogeneity across countries as well. Even larger differences in country mean levels were observed for ERS, with the highest level of ERS observed in Venezuela. Respondents in China or Lithuania, in contrast, showed rather low levels of ERS and seldom used the Categories 1 and 5 (see also the appendix).
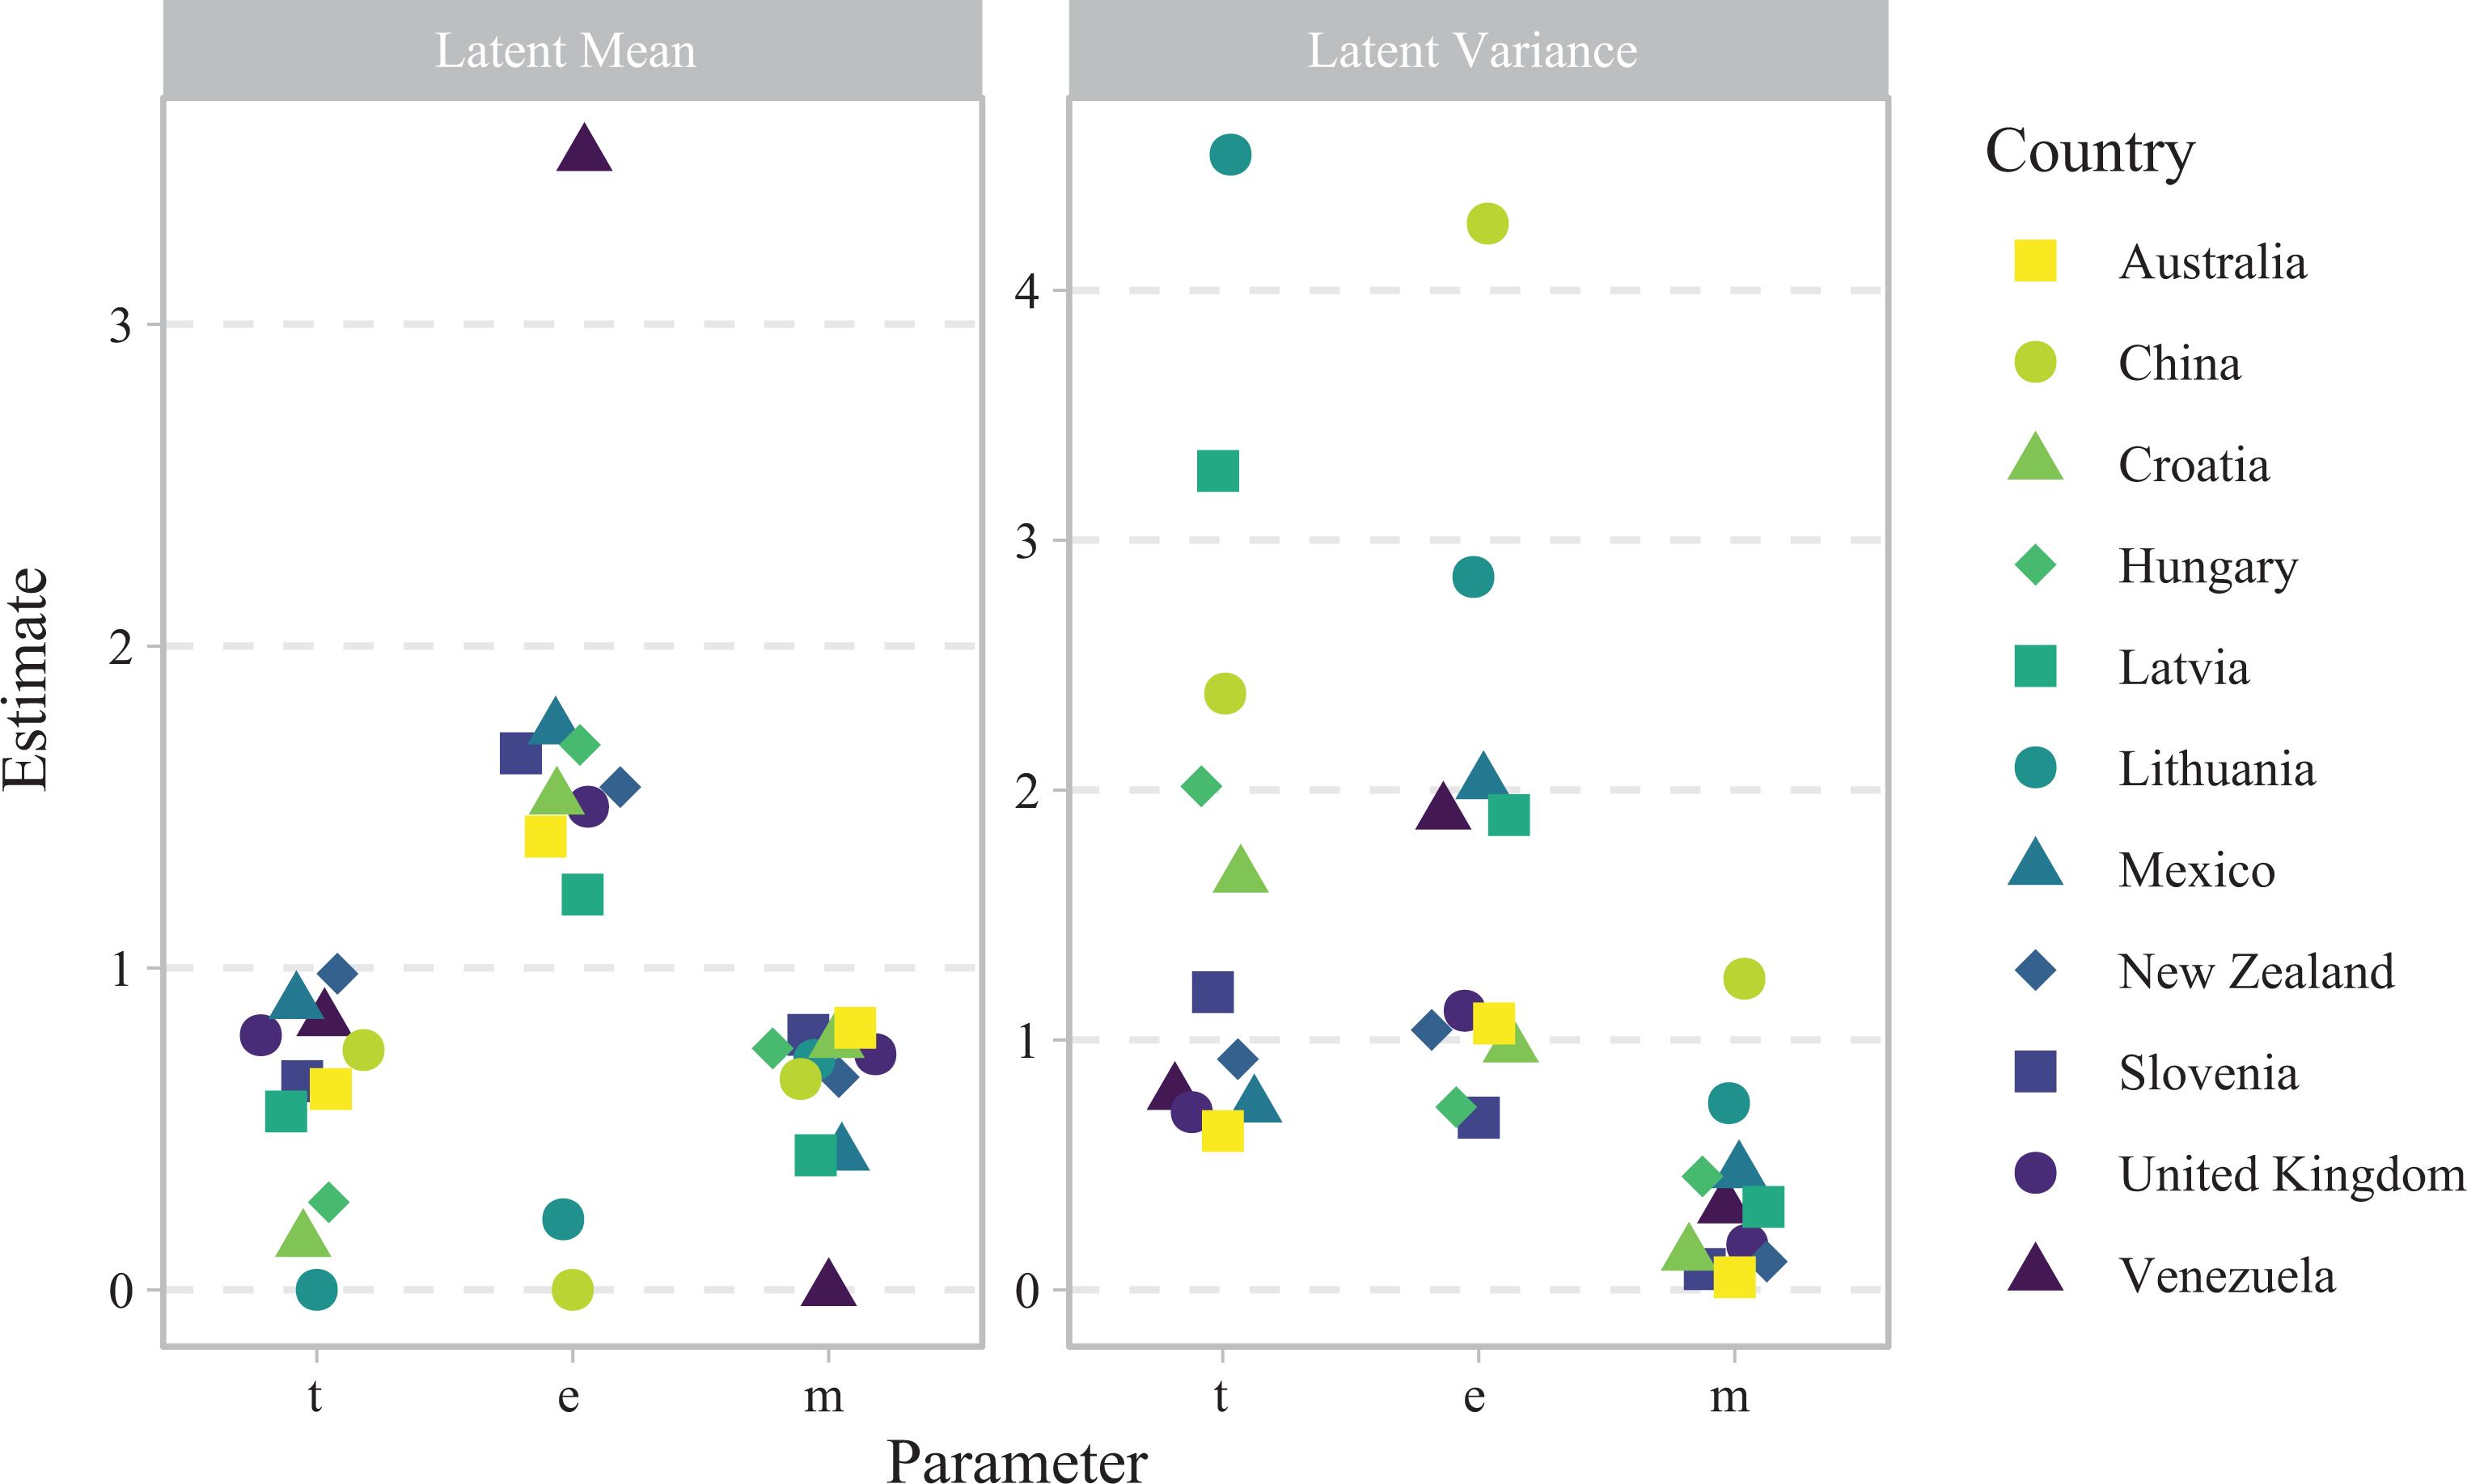
Country-level parameters as estimated from an IR-tree model, namely (relative) latent means and latent variances for the three parameters target trait t, extreme response style e, and midpoint response style.
In order to estimate the impact of response styles on substantive conclusions, the country level means of organizational commitment were compared across the IR-tree model and the GRM. The rank correlation of the means across models was
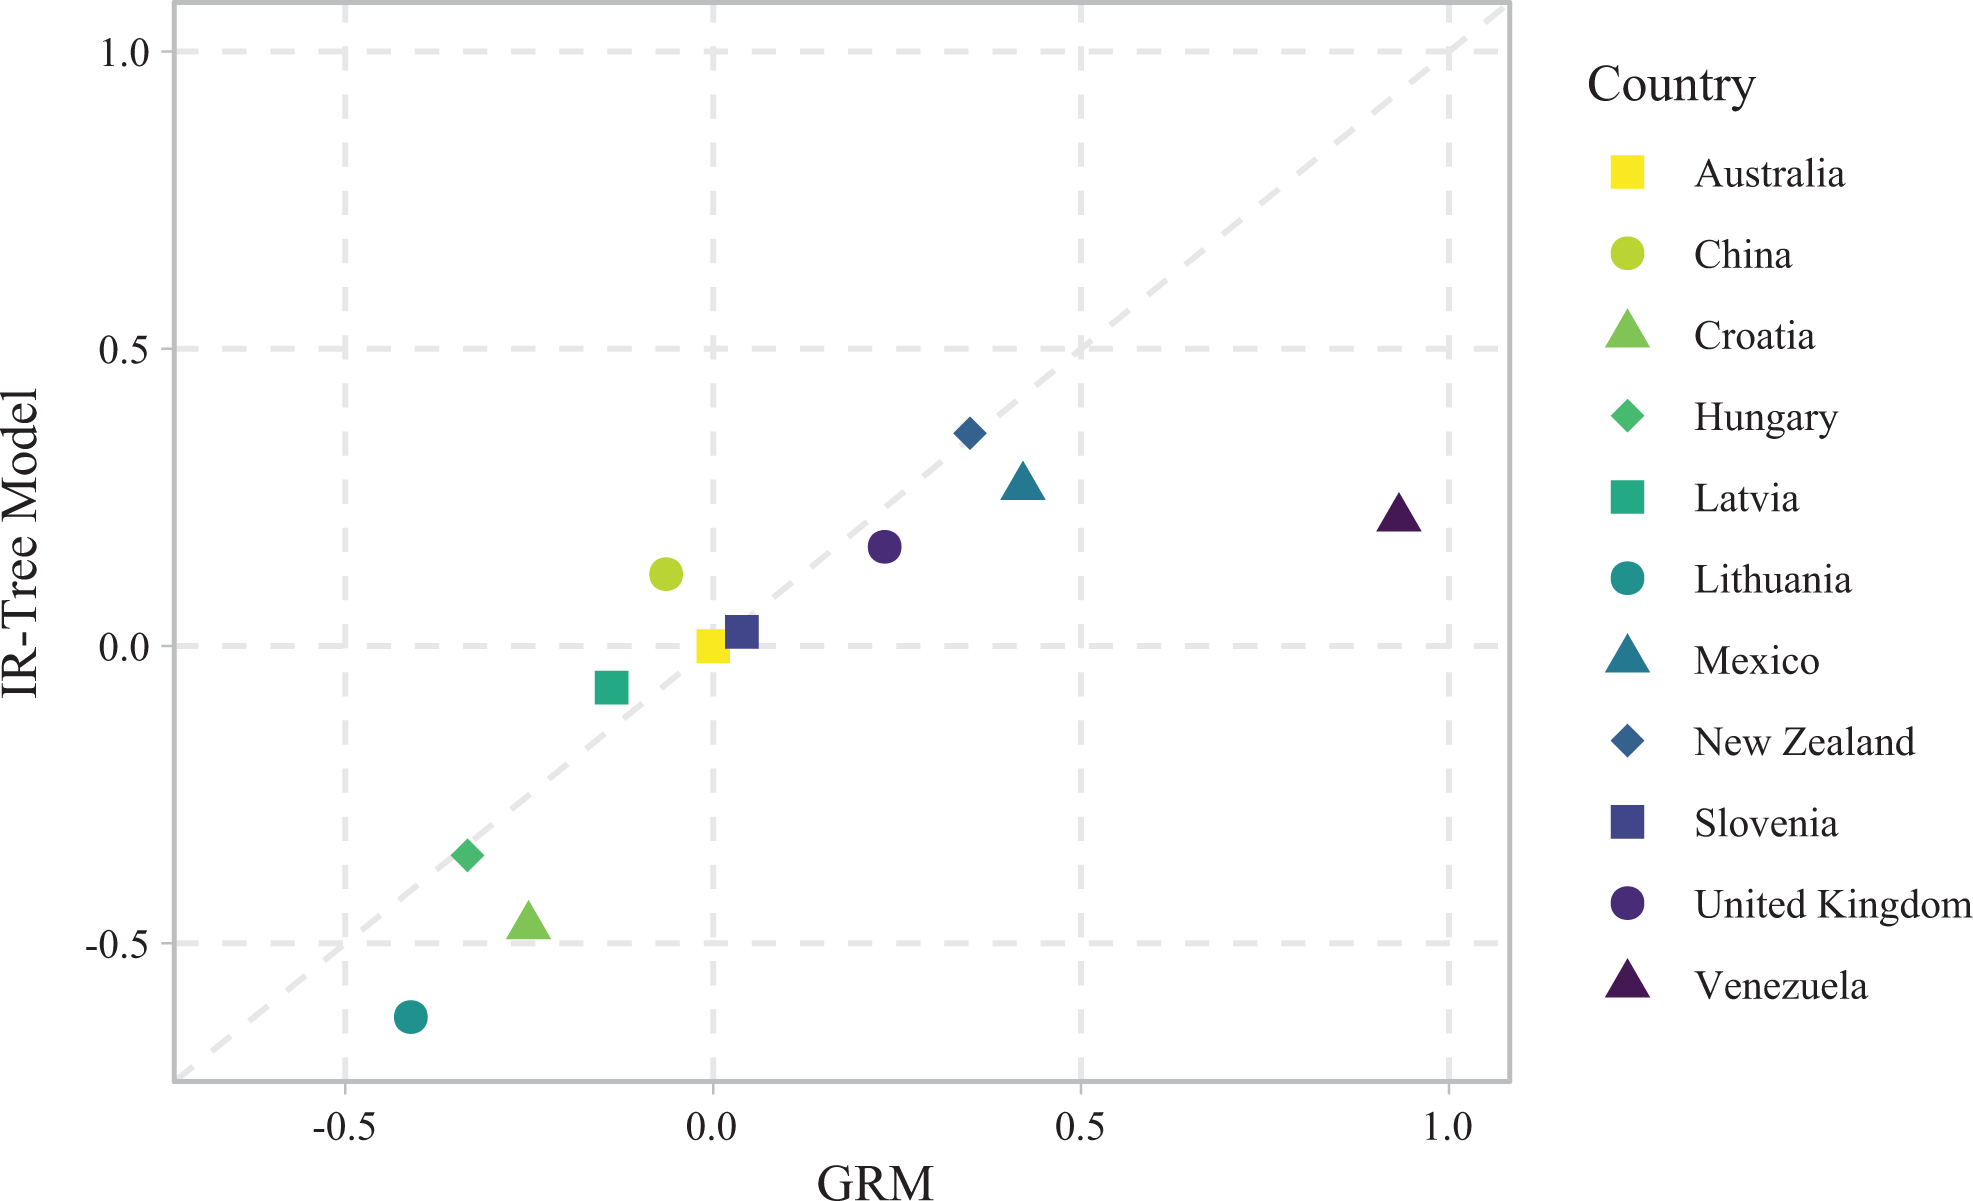
Scatterplot of country level means of organizational commitment estimated from both an IR-tree model and a graded response model (GRM).
Summary
This illustrative example showed that IR-tree models can add value to data analysis in organizational and also cross-cultural psychology. It was demonstrated how the model parameters can be interpreted and how an IR-tree model differs from a standard unidimensional model. The example also indicated that response styles can have an effect on substantive conclusions, but it should also be noted that such effects are rather small under many conditions (e.g., Plieninger, 2017). Herein, notable differences in organizational commitment after controlling for response styles were found for one out of 11 countries. Moreover, it was shown that IR-tree models can easily be extended to multiple-group models. Finally, it should be noted that the examples were handpicked for illustrative purposes. Thus, even though ISSP 2015 is a very large and reliable data set, substantive conclusions should not rely solely on the presented results.
Discussion
The contribution of the present article is twofold. The first contribution is the development of guidelines for scholars in organizational research and beyond for developing, applying, and interpreting IR-tree models. Thus, the article serves as a supplement to earlier psychometric work on IR-tree models (e.g., Böckenholt, 2012; Böckenholt & Meiser, 2017). In more detail, the guidelines described above enable researchers to select an existing or even develop a new IR-tree model—by going from a descriptive tree diagram via a set of model equations to the pseudo-items for estimation. Moreover, the worked example illustrated how parameter estimates and model fit can be interpreted. Furthermore, it was shown that this interpretation should focus on the qualitative differences between the model parameters, but not on their relative order in the tree diagram.
The second contribution is the introduction of the novel class of multiple-group IR-tree models. These are applicable when data were collected in possibly heterogeneous groups such as organizations, countries, experimental conditions, or across different time points. Just like multiple-group IRT models, multiple-group IR-tree models allow one to investigate and establish measurement invariance across groups. Furthermore, groups can be compared with respect to all latent dimensions of the IR-tree model (e.g., target trait, ERS, and MRS). Apart from that, note that multiple-group models are best suited for situations with a few, known groups. Many groups such as dozens of companies may make working with a multiple-group model cumbersome, and multilevel models may be an alternative. Furthermore, if the groups are unknown, a latent-class extension may be required (e.g., Tijmstra et al., 2018).
One potential area for IR-tree models in organizational research is the control of response styles such as ERS and MRS. Response styles and other sources of method variance are receiving more and more attention in many areas (e.g., Baumgartner & Steenkamp, 2001; Kam & Meyer, 2015; Moors, 2012; Podsakoff, MacKenzie, Lee, & Podsakoff, 2003), and IR-tree models have already been successfully applied in this context. For example, Plieninger and Meiser (2014) predicted measures of academic performance using self-report measures that were controlled for response styles using an IR-tree model. Likewise, LaHuis et al. (2019) predicted job performance using variables such as self-reported teamwork or work ethic.
Further promising areas for using IR-tree models are measures that are multidimensional and result in discrete data (e.g., Likert-type scales, choice data, SJTs). For example, scoring SJTs can be difficult (e.g., Bergman, Drasgow, Donovan, Henning, & Juraska, 2006; Zu & Kyllonen, 2018), and IR-tree models might potentially be used to disentangle different dimensions underlying the responses of a forced-choice SJT. Apart from that, research on choices (e.g., consumer choices) often involves alternative options that differ along multiple dimensions; IR-tree models and related accounts (e.g., Böckenholt, 2012; McFadden, 1981) allow to capture this multidimensionality and to analyze all choices in one model. All this illustrates that IR-tree modeling has become a vibrant topic in certain areas (e.g., Khorramdel, Jeon, & Wang, 2019), and organizational researchers may benefit from adding this model class to their toolbox.
In summary, IR-tree models enable us to shed new light on existing research questions, for instance, about the processes involved in questionnaire responding. Furthermore, they also allow to ask novel research questions, for example, about multidimensionality in self-report data. In either case, the present article offers guidance for working with IR-tree models, in both single-group and multiple-group cases.
Footnotes
Appendix
Author Note
Declaration of Conflicting Interests
The author(s) declared no potential conflicts of interest with respect to the research, authorship, and/or publication of this article.
Funding
The author(s) disclosed receipt of the following financial support for the research, authorship, and/or publication of this article: The publication of this article was funded by the University of Mannheim.