
Abstract
The presence of polystyrene plastics in the human testis has raised concerns, yet their biological activity remains poorly characterized. This study aimed to investigate the biological effects and potential regulatory genes of polystyrene nanoplastics on spermatocyte line, GC-2spd(ts). After a 24-h exposure to polystyrene nanoplastics, the results indicated cell membrane disruption, impairment of mitochondrial membrane potential, increased levels of reactive oxygen species (ROS), and induced DNA damage. Furthermore, a comprehensive transcriptomic analysis was conducted, revealing differential gene expression patterns in GC-2spd(ts) cells in response to polystyrene nanoplastics. A total of 134 differentially expressed genes (DEGs) were identified, with 48 genes upregulated and 86 genes downregulated. The Gene Ontology analysis highlighted the involvement of these genes in various spermatogenesis-related biological processes, including acrosome reaction, sperm mitochondrial organization, sperm annulus, and outer acrosomal membrane. Subsequently, the quantification of gene expression through qRT-PCR identified five key genes (NSUN7, SEPTIN4, TRIM36, EQTN, and SYT8) screened from the DEGs. In conclusion, this study provides valuable insights into the biological effects of polystyrene nanoplastics on mouse spermatocytes using comprehensive transcriptomic analysis, contributing to the establishment of a foundation for future investigations into these relevant pathways.
Introduction
Infertility has emerged as a global health issue, affecting 8–12% of couples of reproductive age. Notably, the male factor is responsible for around 50% of these cases. 1 Recent studies have revealed a significant decline in male sperm concentration (51.6%) and total sperm count (62.3%) over the past 50 years, with this trend continuing to rise. 2 Numerous studies have identified reduced semen quality as a leading cause of male infertility, with various factors contributing to this decline, of particular importance are environmental factors. In recent years, research has indicated that exposure to microplastics may contribute to male reproductive toxicity.3–5
Since the 1950s, plastic products have become ubiquitous in our daily lives, valued for their convenience and durability, often boasting high temperature and corrosion resistance. Unfortunately, there is currently no foolproof method for managing plastic waste, as it does not readily degrade in the natural environment but instead breaks down into smaller microplastics through various biological and abiotic processes. Microplastics are plastic fragments and particles with a diameter of less than 5 mm, including micrometer plastics (1 μm–5 mm), submicrometer plastics (100 nm–1 μm), and nanoscale plastics (<100 nm). 6 Based on their raw materials, microplastics mainly consist of polystyrene, polyethylene, polyvinyl chloride, polyamide, polypropylene, and polyethylene terephthalate, among others. These microplastics are more prone to dispersion and can lead to environmental pollution, posing a significant global public health threat.
Studies have shown that microplastic particles can enter the human body through the gastrointestinal and respiratory systems, 7 with traces found in various organs such as the respiratory, 8 digestive, 9 cardiovascular systems, 10 placenta, 11 and feces. 12 Recently, a study detected microplastics in human testes and semen. Six types of microplastics were identified in semen samples, with polyvinyl chloride and polyethylene being the most abundant (25% each), followed by polyamide (17%), polystyrene (13%), polypropylene (13%), and polyethylene terephthalate (7%). In the testis, four types of microplastics were detected, with polystyrene (67.7%) being the most predominant component, followed by polyvinyl chloride (12.9%), polyethylene (12.9%), and polypropylene (6.5%), this study is the first to report the presence of microplastics in human testes and highlights polystyrene as the main component. 13 However, the biological impacts of these microplastics on male reproduction are still not fully understood.
In recent years, several studies have found that polystyrene nanoplastics can be internalized by cells. Lu et al. found that polystyrene nanoplastics can be internalized and aggregated in the cytoplasm of human umbilical vein endothelial cells (HUVEC) and induce cell membrane disruption. 14 Johnston et al. found that primary rat hepatocyte C3A and human hepatocyte cell line HepG2 uptake 20 nm polystyrene nanoplastics into the cells in about 10 min. 15 Further functional studies have shown that polystyrene nanoplastics induce autophagy in mouse monocyte macrophage (RAW264.7) cells 16 and induce oxidative stress, which leads to increased mitochondrial depolarization in Caco 2 cells. 17 Other literature has shown that A549 cells internalize polystyrene nanoplastics in a size and time-dependent manner, and smaller polystyrene nanoplastics are easily taken up through non-specific phagocytosis. Further investigation revealed that polystyrene nanoplastics were able to disrupt gene expression in A549 cells, resulting in inflammatory responses and activation of apoptosis pathways. 18 It has been shown that polystyrene microplastics may have toxic effects on GC-2spd(ts) cells, which are an in vitro model for investigating the molecular mechanisms of spermatogenesis and the biological effects of environmental toxic factors.19–21 Previous studies have demonstrated that polystyrene microplastics (5 μm) and polystyrene nanoplastics (80 nm) can induce apoptosis in GC-2spd(ts) cells via the p53 signaling pathway, 22 and polystyrene microplastics (5 μm) can increase mitochondrial autophagy through the PINK1/Parkin pathway. 23 Polystyrene microplastics (50 nm) can induce autophagy leading to Golgi-associated vesicle disorganization, which subsequently contributes to acrosome defects. 24 These findings suggest that exposure to polystyrene microplastics may have toxic effects on male reproductive cells. However, the specific regulatory genes involved remain unclear.
The aim of this study was to investigate the potential biological functions of spermatogenesis regulated by polystyrene nanoplastics. GC-2spd(ts) cells were exposed to polystyrene nanoplastics for 24 h, resulting in cell membrane damage, disruption of mitochondrial membrane potential, elevated ROS levels, and induced DNA damage. Furthermore, comprehensive transcriptomic sequencing was employed to identify differentially expressed genes that regulated by polystyrene nanoplastics, followed by qRT-PCR to quantify the expression levels of genes that play crucial roles in spermatogenesis. Our findings reveal the effects of polystyrene nanoplastics on the biological functions of germ cells and identify the potential genes that may be regulated by these microplastics.
Materials and Methods
Polystyrene Nanoplastics Preparation and Characterization
Polystyrene nanoplastics (Volume fraction of 2.5%, 10 ml) were purchased from Tianjin Baseline Chemical Technology Research Center, China. In this study, 60 nm polystyrene nanoplastics were suspended in sterilized ddH2O to prepare a solution of 50 μg/ml for later use. A scanning electron microscopy (JSM-IT200, JEOL, Japan) was used to observe the morphology and dispersion of polystyrene nanoplastics. In addition, Zeta potential and hydrodynamic diameter were measured using a dynamic light scattering (DLS) instrument (Zetasizer Nano ZS90, Malvern Instruments Ltd., Malvern, UK).
Cell Culture
Mouse spermatocyte line GC-2spd (ts) cells were obtained from Shanghai Institute of Cell Biology, Chinese Academy of Sciences, and were cultured in DMEM (C11995500BT, Gibco, USA) medium supplemented with 10% fetal bovine serum (FSP500, ExCell Bio, Uruguay), 1% Glutamax (35050061, Gibco,USA), 1% sodium pyruvate 100 mM solution (11360070,Gibco,USA), and 1% penicillin and streptomycin (Invitrogen), and were incubated in a humidified incubator at 37°C with 5% CO2.
Transmission Electron Microscope Observation
Transmission electron microscope (TEM) was used to confirm the location and accumulation of polystyrene nanoplastics within GC-2spd (ts) cells. Briefly, GC-2spd (ts) cells that had been exposed to polystyrene nanoplastics for 24 h were collected and then sequentially fixed, dehydrated, permeabilized, embedded, sectioned, and stained. Finally, the sections were observed by TEM (H7650, HITACHI, Japan).
Cell Viability Assay
Cell viability was determined using CCK-8 assay (C0039, Beyotime, Shanghai, China). In brief, 4 × 10³ GC-2spd (ts) cells were seeded into 96-well plates and cultured overnight, subsequently, cells were exposed to different concentrations of polystyrene nanoplastics (0, 5, 10, and 25 μg/ml) for 24 h, after treatment with polystyrene nanoplastics, CCK-8 reagent was added into each well and incubated for 2 h, followed by measurement of absorbance values at 450 nm using a SpectraMax 190 (Molecular Devices, USA).
Intracellular ROS Production Assays
A reactive oxygen species detection kit (S0033S, Beyotime, Shanghai, China) was used to measure reactive oxygen species (ROS) levels in GC-2spd (ts) cells after polystyrene nanoplastics exposure. Briefly, the cells were incubated with fresh serum-free medium added with 10 μM DCFH-DA solution at 37°C for 20 min, and the cells were then washed with PBS three times to remove unloaded DCFH-DA. The images were observed and photographed by fluorescence microscope, and cell fluorescence was detected at excitation (488 nm) and emission (525 nm) wavelengths by a fluorescence microplate reader (BioTek Synergy H1).
Lactate Dehydrogenase (LDH) Release Assay
The lactate dehydrogenase release assay was used to determine the cytotoxicity of polystyrene nanoplastics. Briefly, GC-2spd (ts) cells were exposed to different concentrations of polystyrene nanoplastics for 24 h. Subsequently, the cell culture medium was collected and mixed with the reaction mixture (C0016, Beyotime, Shanghai, China), then 30 min incubation at room temperature, absorbance was measured at 490 nm using a SpectraMax 190 (Molecular Devices, USA).
Detection of Mitochondrial Membrane Potential
The mitochondrial membrane potential was measured using the JC-1 probe (C2006, Beyotime, Shanghai, China) following the manufacturer’s protocol. Briefly, after GC-2spd (ts) cells were exposed to polystyrene nanoplastics for 24 h, the cells were washed twice with PBS buffer and incubated with JC-1 probe for 20 min at 37°C in the dark. Then the cells were rinsed with JC-1 staining buffer twice. JC-1 monomer was monitored with excitation at 514 nm and emission at 529 nm as well as JC-1 aggregates with excitation at 585 nm and emission at 590 nm using a confocal microscope (Nikon A1 +, Japan). The ratio of mitochondrial aggregates to the monomer form of JC-1 was analyzed with Image J software.
Protein Extraction and Western Blot
The cells were lysed in RIPA buffer with freshly added PMSF (P0013 C and ST505, Beyotime, Shanghai, China) for 30 min on ice. Then the lysates were centrifuged at 12,000 rpm, 4°C for 10 min, the supernatants were collected, and concentrations were measured by a BCA protein assay kit (P0011, Beyotime, Shanghai, China). Equal amounts of proteins were separated by SDS-PAGE electrophoresis, and then the proteins were transferred to PVDF membrane (IPVH00010, Merck Millipore), followed by blocking the membrane in TBST supplemented with 5% skimmed milk powder at room temperature for 1 h and incubated with primary antibody overnight at 4°C. After washing three times with TBST for 10 min each time, the membranes were incubated with secondary antibody labeled with horseradish peroxidase for 1 h at room temperature, then washed three times with TBST for 10 min each time. Finally, the immunoblots were visualized by an ECL system and imaged with ChemiDoc Touch System (Bio-Rad). The protein levels were analyzed by western blot and normalized by probing the same blots using a GAPDH antibody. The primary antibodies used in this study were as follows: γH2A.X (diluted 1:1000, sc-517348, Santa Cruz), GRIM19 (diluted 1:1000, sc-365978, Santa Cruz), SDHA (diluted 1:1000, ab14715, Abcam), UQCRC2 (diluted 1:1000, ab14745, Abcam), MTCO1(diluted 1:1000, ab14705, Abcam), and GAPDH (diluted 1:5000, HRP-60004, Proteintech Group).
RNA Extraction and Quantitative RT-PCR
Total RNA was extracted from cells by RNAiso Plus Reagent (9109, TaKaRa, Japan) according to the manufacturer’s instructions. RNA concentration and purity were determined using NanoDrop 2000 and agarose gel electrophoresis. RNA samples with an OD260/OD280 ratio within the range of 1.8 to 2.0. The integrity of these samples was further validated by the presence of three distinct bands on the agarose gel, with the 28 S rRNA band exhibiting an intensity approximately twice that of the 18 S rRNA band. Subsequently, reverse transcription of mRNA to cDNA was conducted with the cDNA Synthesis SuperMix for qPCR kit (Yeasen, China). The mRNA levels were quantified by qRT-PCR using the SYBR Green method on CFX96™ Real-Time PCR system (Bio-Rad, USA). GAPDH was used as an internal control. The sequences of primers used are shown in Supplemental materials.
Bioinformatic Analysis of Transcriptomic Sequencing Data
The transcriptomic sequencing and analysis were performed by OE Biotech Co., Ltd. (Shanghai, China). Total RNA was extracted using RNAiso Plus reagent (9109, Takara, Japan) according to the method provided by the manufacturer. RNA purity and quantification were assessed by NanoDrop 2000 (Thermo Fisher Scientific, USA). RNA integrity was evaluated using an Agilent 2100 Bioanalyzer (Agilent Technologies, Santa Clara, CA, USA). The library was then constructed using the VAHTS Universal V6 RNA-seq Library Preparation Kit according to the manufacturer’s instructions and sequenced on llumina Novaseq 6000 platform. Raw reads of fastq format were first processed using fastp 1 and the low quality reads were removed to obtain the clean reads, then the clean reads were mapped to the reference Mus musculus genome using HISAT2. FPKM3 of each gene was measured and the read counts of each gene were obtained by HTSeq-count4. Differential expression analysis was performed using the DESeq2. Q value < 0.05 and fold change > 2 or fold change < 0.5 was set as the threshold for significantly differential expression gene (DEGs). Hierarchical cluster analysis of DEGs was performed using R (v 3.2.0) to demonstrate the expression pattern of genes in different groups and samples. Gene Ontology (GO) enrichment analysis of DEGs was performed using R based on the hypergeometric distribution. GO Level 1 comprises three main categories: biological process, cellular component, and molecular function, GO Level 2 analysis based on the criteria of a fold change >2 and a q-value < 0.05. Raw sequencing data have been uploaded to the SRA database (Accession number: PRJNA579238).
Statistical Analysis
The GraphPad Prism 9.0 software was used for data analysis and graphing. Student's t-test determined the statistical differences among two independent groups. The statistical significance was determined by *P < 0.05, **P < 0.01, ***P < 0.001, the experimental data were expressed as mean ± standard deviation (S.D.).
Results
Characterization of Polystyrene Nanoplastics
Polystyrene nanoplastics (2.5% w/v, 10 ml) were obtained from the Tianjin Baseline ChromTech Research Centre (Cat:6-1-0006, Tianjin, China). The shape of polystyrene nanoplastics was determined using scanning electron microscopy, which revealed that they were uniformly spherical (Figure 1A). The dispersion properties of polystyrene nanoplastics were characterized by evaluating the zeta potential and hydrodynamic diameter using a dynamic light scattering (DLS) instrument. The result indicated that the average hydrodynamic diameter of polystyrene nanoplastics was 75.9 nm (Figure 1B), and the zeta potentials were below −30 mV at various concentrations (Figure 1C). Characterization of polystyrene nanoplastics. (A) Representative image of polystyrene nanoplastics, taken by scanning electron microscopy. (B) Hydrodynamic diameter of polystyrene nanoplastics. (C) Zeta potentials of polystyrene nanoplastics.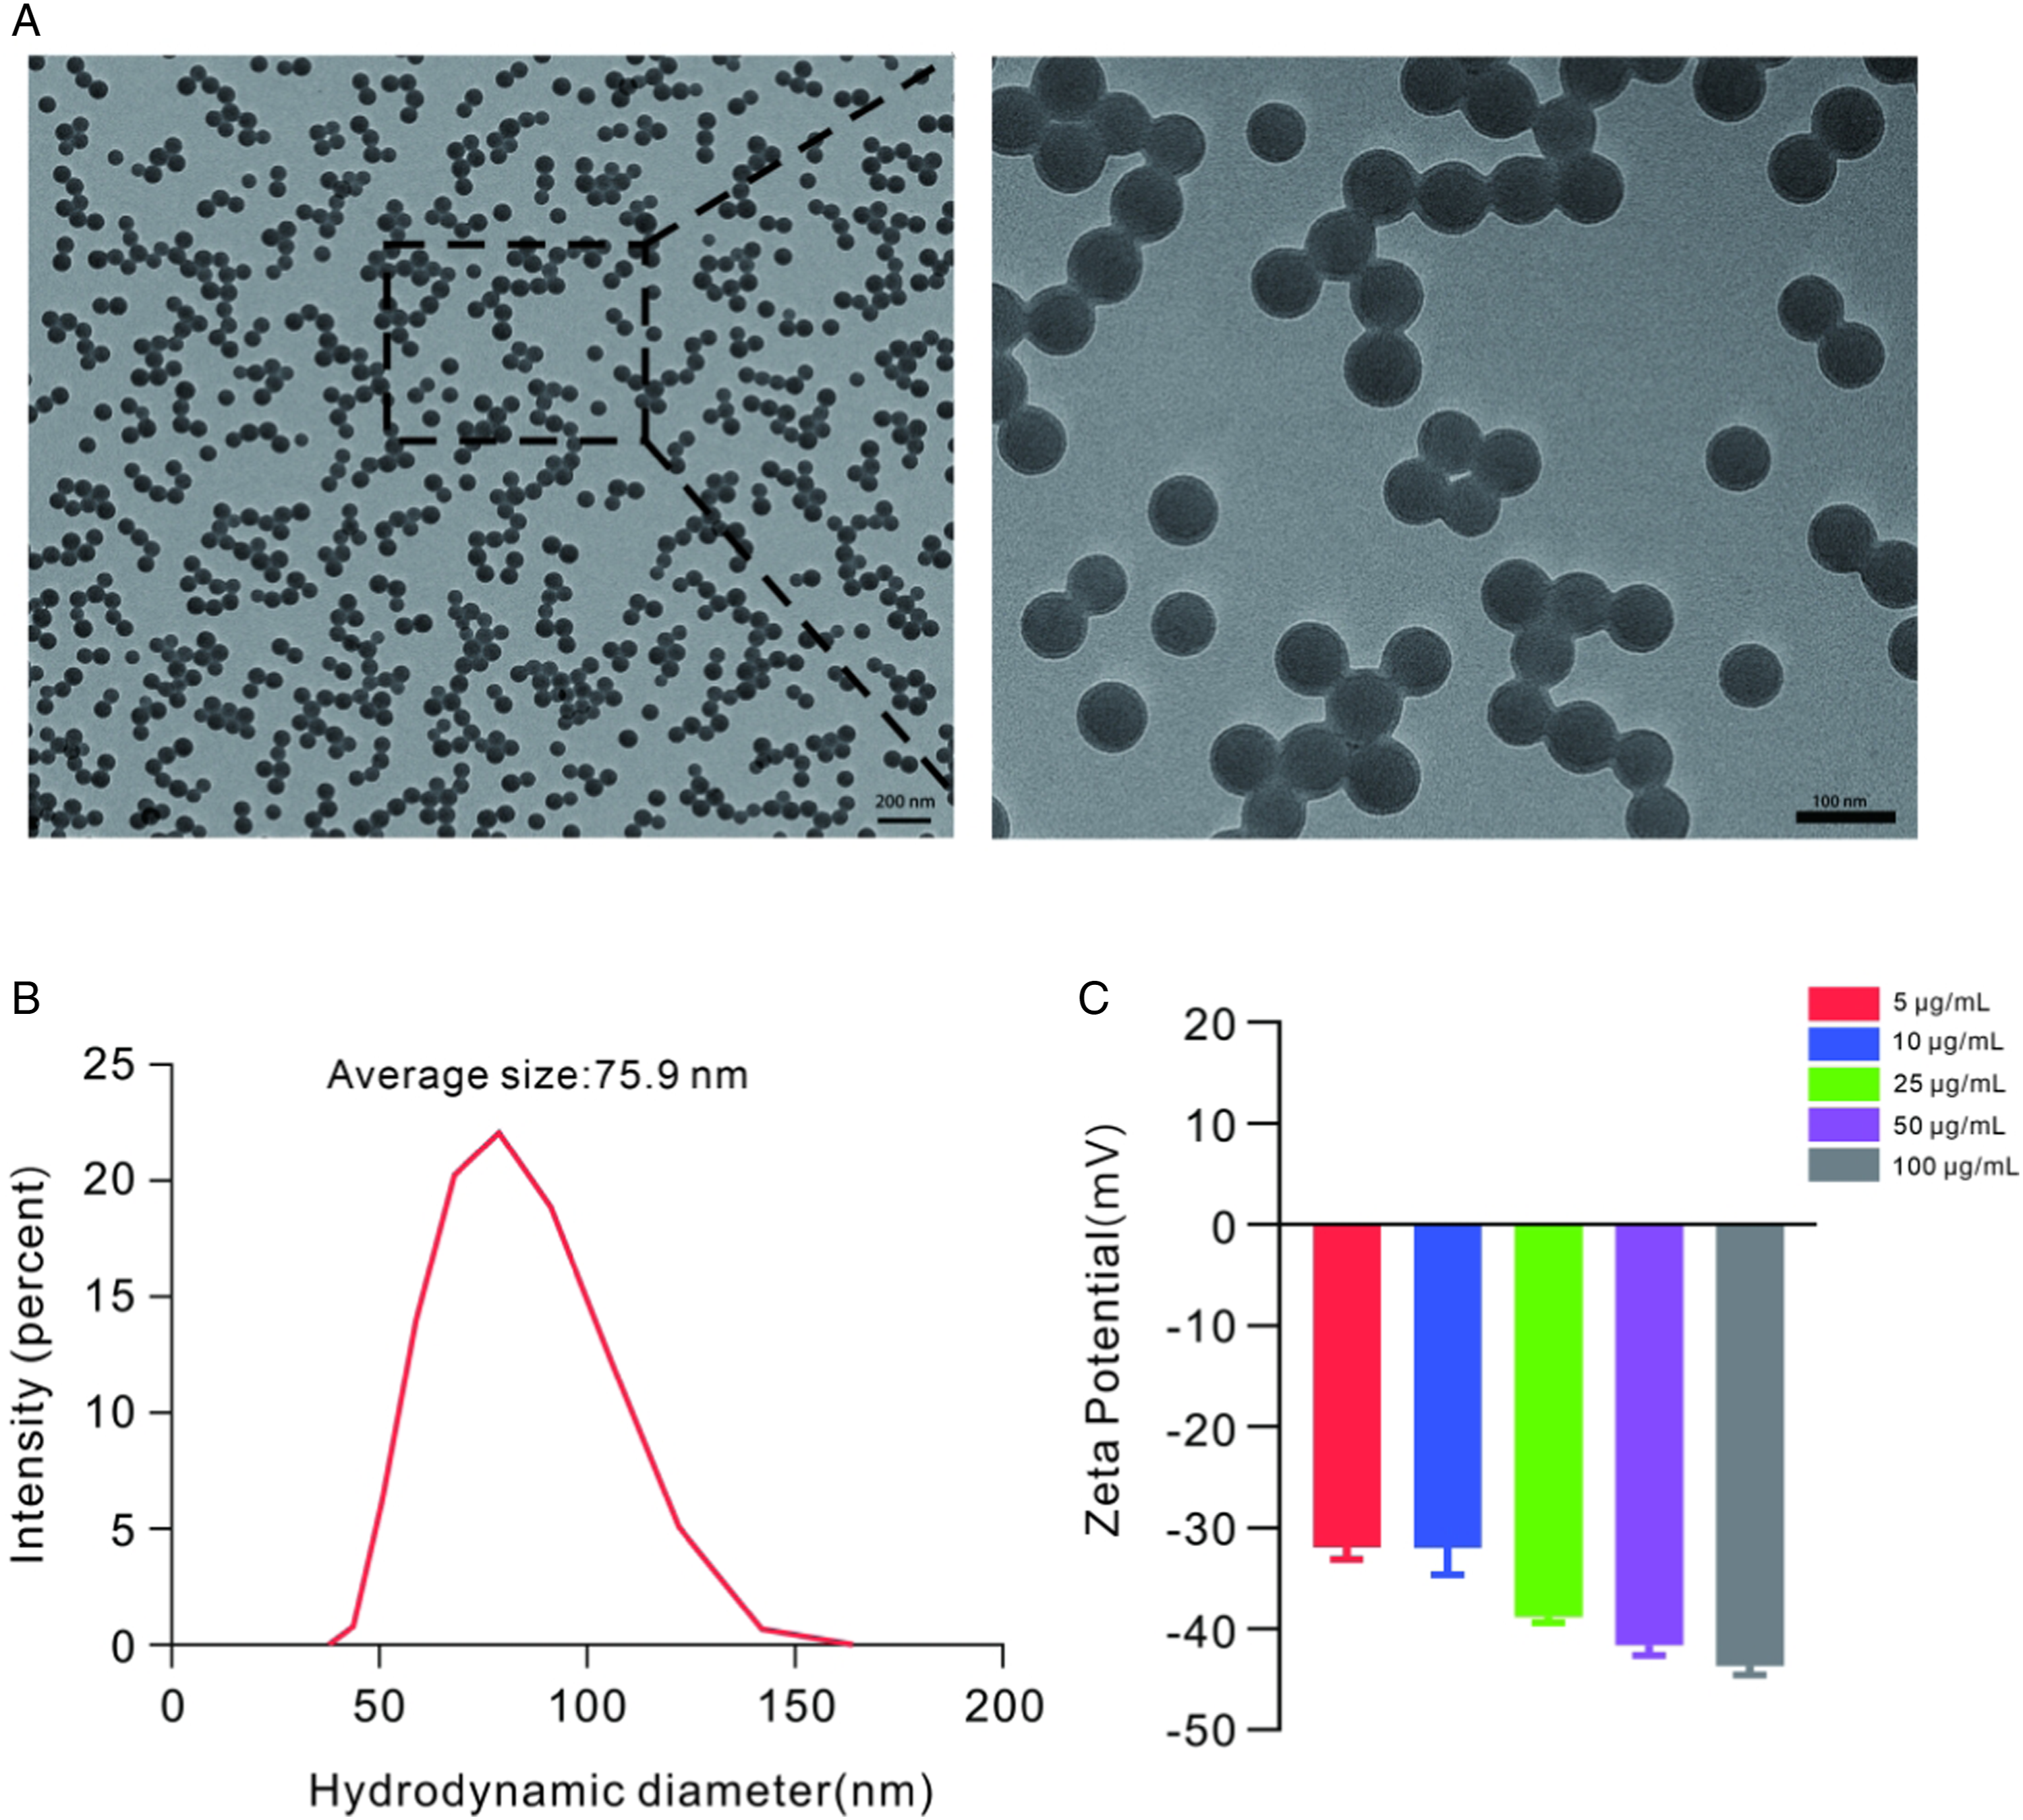
Polystyrene Nanoplastics Induced Cell Membrane Damage in GC-2spd(ts) Cells
After exposing GC-2spd(ts) cells to polystyrene nanoplastics for 24 h, transmission electron microscopy (TEM) was used to determine the location of internalization. The results showed that polystyrene nanoplastics were aggregated in the cytoplasm rather than the nucleus of GC-2spd(ts) cells, as indicated by the red boxes in Figure 2A. To further investigate the effects of polystyrene nanoplastics on the biological functions of GC-2spd(ts) cells, cell viability was assessed using the CCK8 assay. GC-2spd(ts) cells were exposed to polystyrene nanoplastics at concentrations of 0 μg/ml, 5 μg/ml, 10 μg/ml, and 25 μg/ml for 24 h. As shown in Figure 2B, there were no significant differences observed between the groups, including the highest concentration group of 25 μg/ml. LDH activity, an indicator of cell membrane damage, was assessed. The result indicated that LDH activity in the cell culture supernatants was significantly upregulated in response to 10 μg/ml and 25 μg/ml of polystyrene nanoplastics (Figure 2C). In summary, these findings suggest that polystyrene nanoplastics can be internalized by GC-2spd(ts) cells, aggregate in the cytoplasm, and induce cell membrane damage. The cytotoxicity of polystyrene nanoplastics. (A) Representative electron micrographs of polystyrene nanoplastics in the cytoplasm detected by TEM. The red box represented polystyrene nanoplastics aggregated in the cytoplasm. (B) The cell viability was measured by CCK8 assay. (C)The levels of LDH in cell supernatants after exposure to polystyrene nanoplastics were measured. The data are shown as mean ± SD. ***P < 0.001.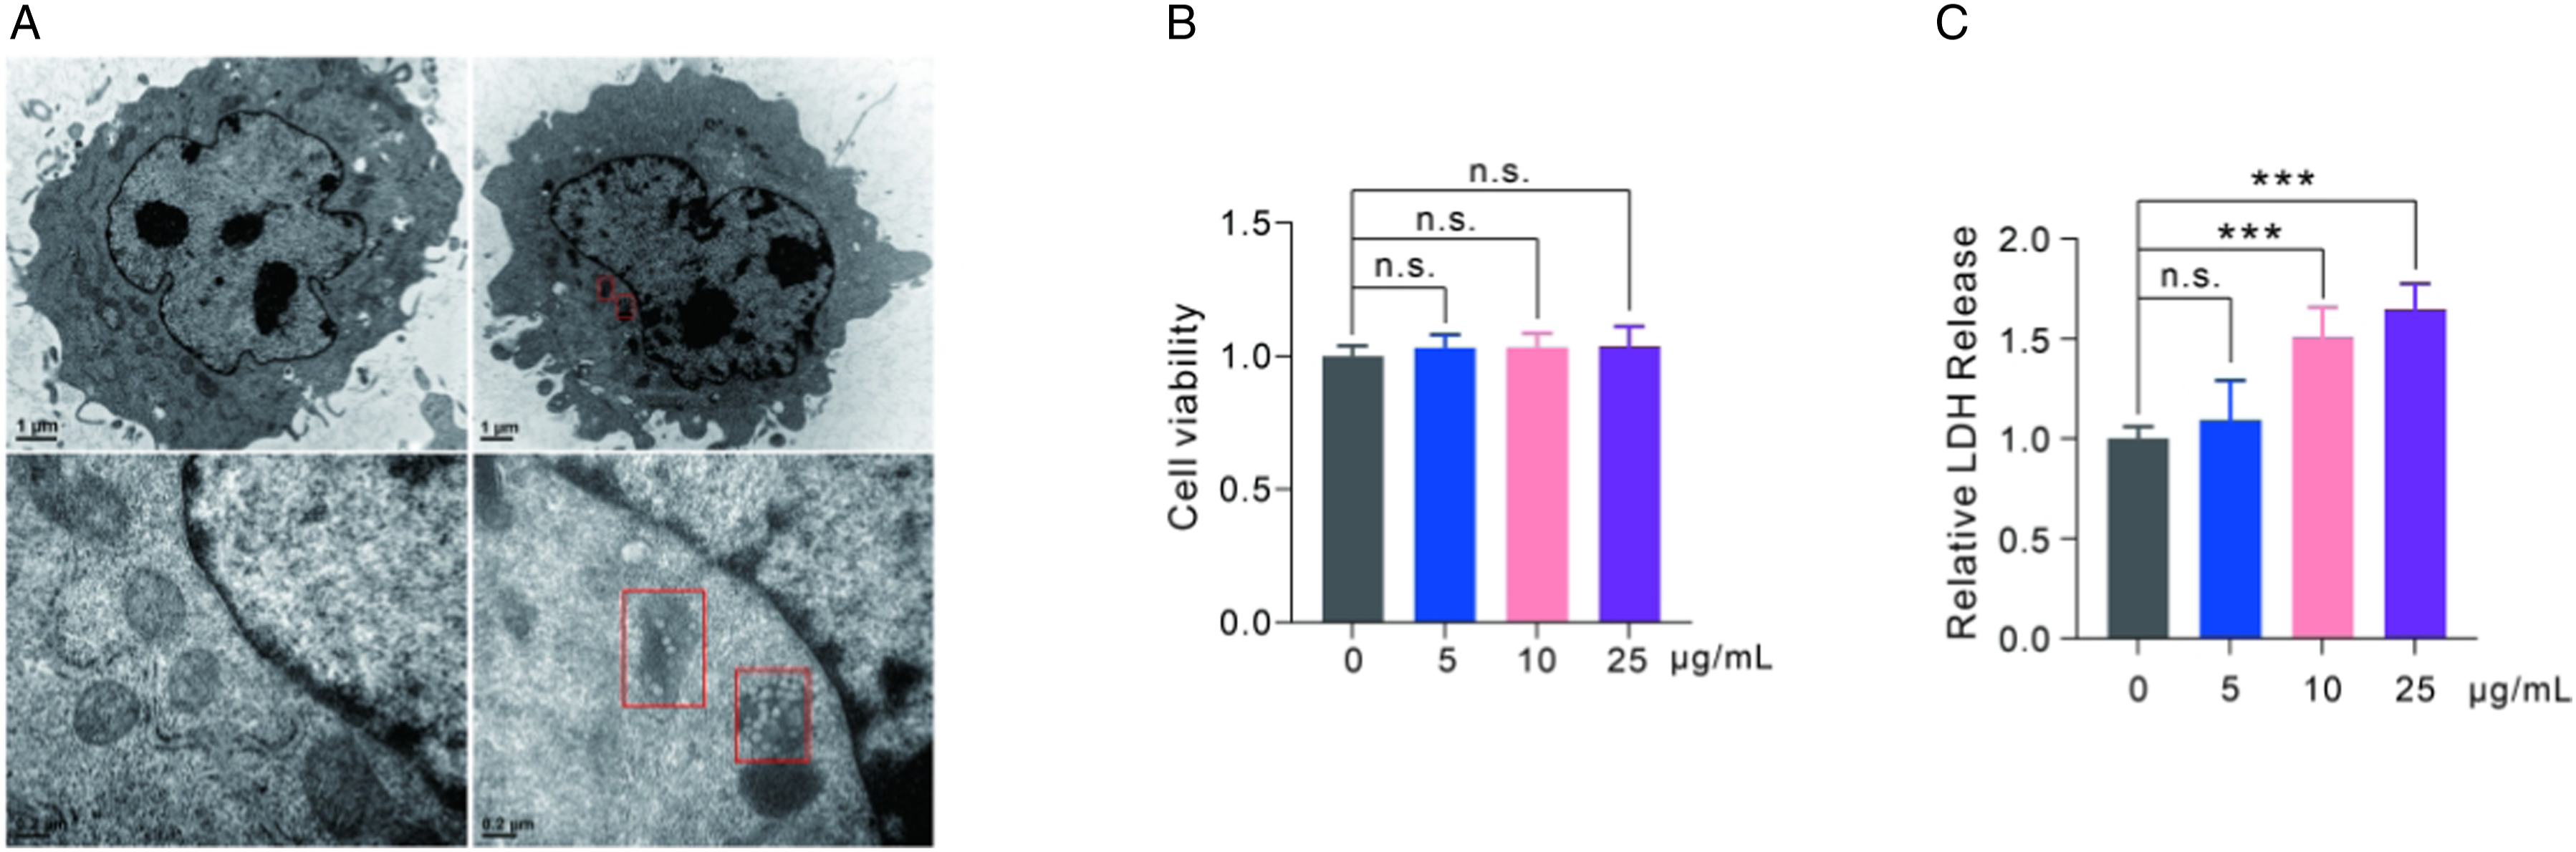
Polystyrene Nanoplastics Impairment of Mitochondrial Membrane Potential
Mitochondrial membrane potential is a crucial indicator of mitochondrial respiratory state, which can be monitored using the JC-1 probe. JC-1 exhibits different fluorescence depending on the mitochondrial membrane potential. In the presence of a high potential, JC-1 forms polymers (J-aggregates) in the mitochondrial matrix, leading to red fluorescence. Conversely, in the presence of a low potential, JC-1 remains a monomer and exhibits green fluorescence. Therefore, changes in fluorescence color provide a convenient method for detecting alterations in mitochondrial membrane potential. The ratio of red to green fluorescence is commonly employed as an indicator of mitochondrial depolarization. When GC-2spd(ts) cells were exposed to polystyrene nanoplastics at concentrations of 10 and 25 μg/ml for 24 h, there was a significant decrease in the ratio of red to green fluorescence, which suggested that polystyrene nanoplastics could induce mitochondrial membrane potential dissipation (Figures 3(a) and (b)). Polystyrene nanoplastics mediate mitochondrial membrane potential. (A) Representative fluorescence images of mitochondrial membrane potential of GC-2spd(ts) cells by JC-1 staining. (B) Quantitative analysis of JC-1 aggregate/monomer.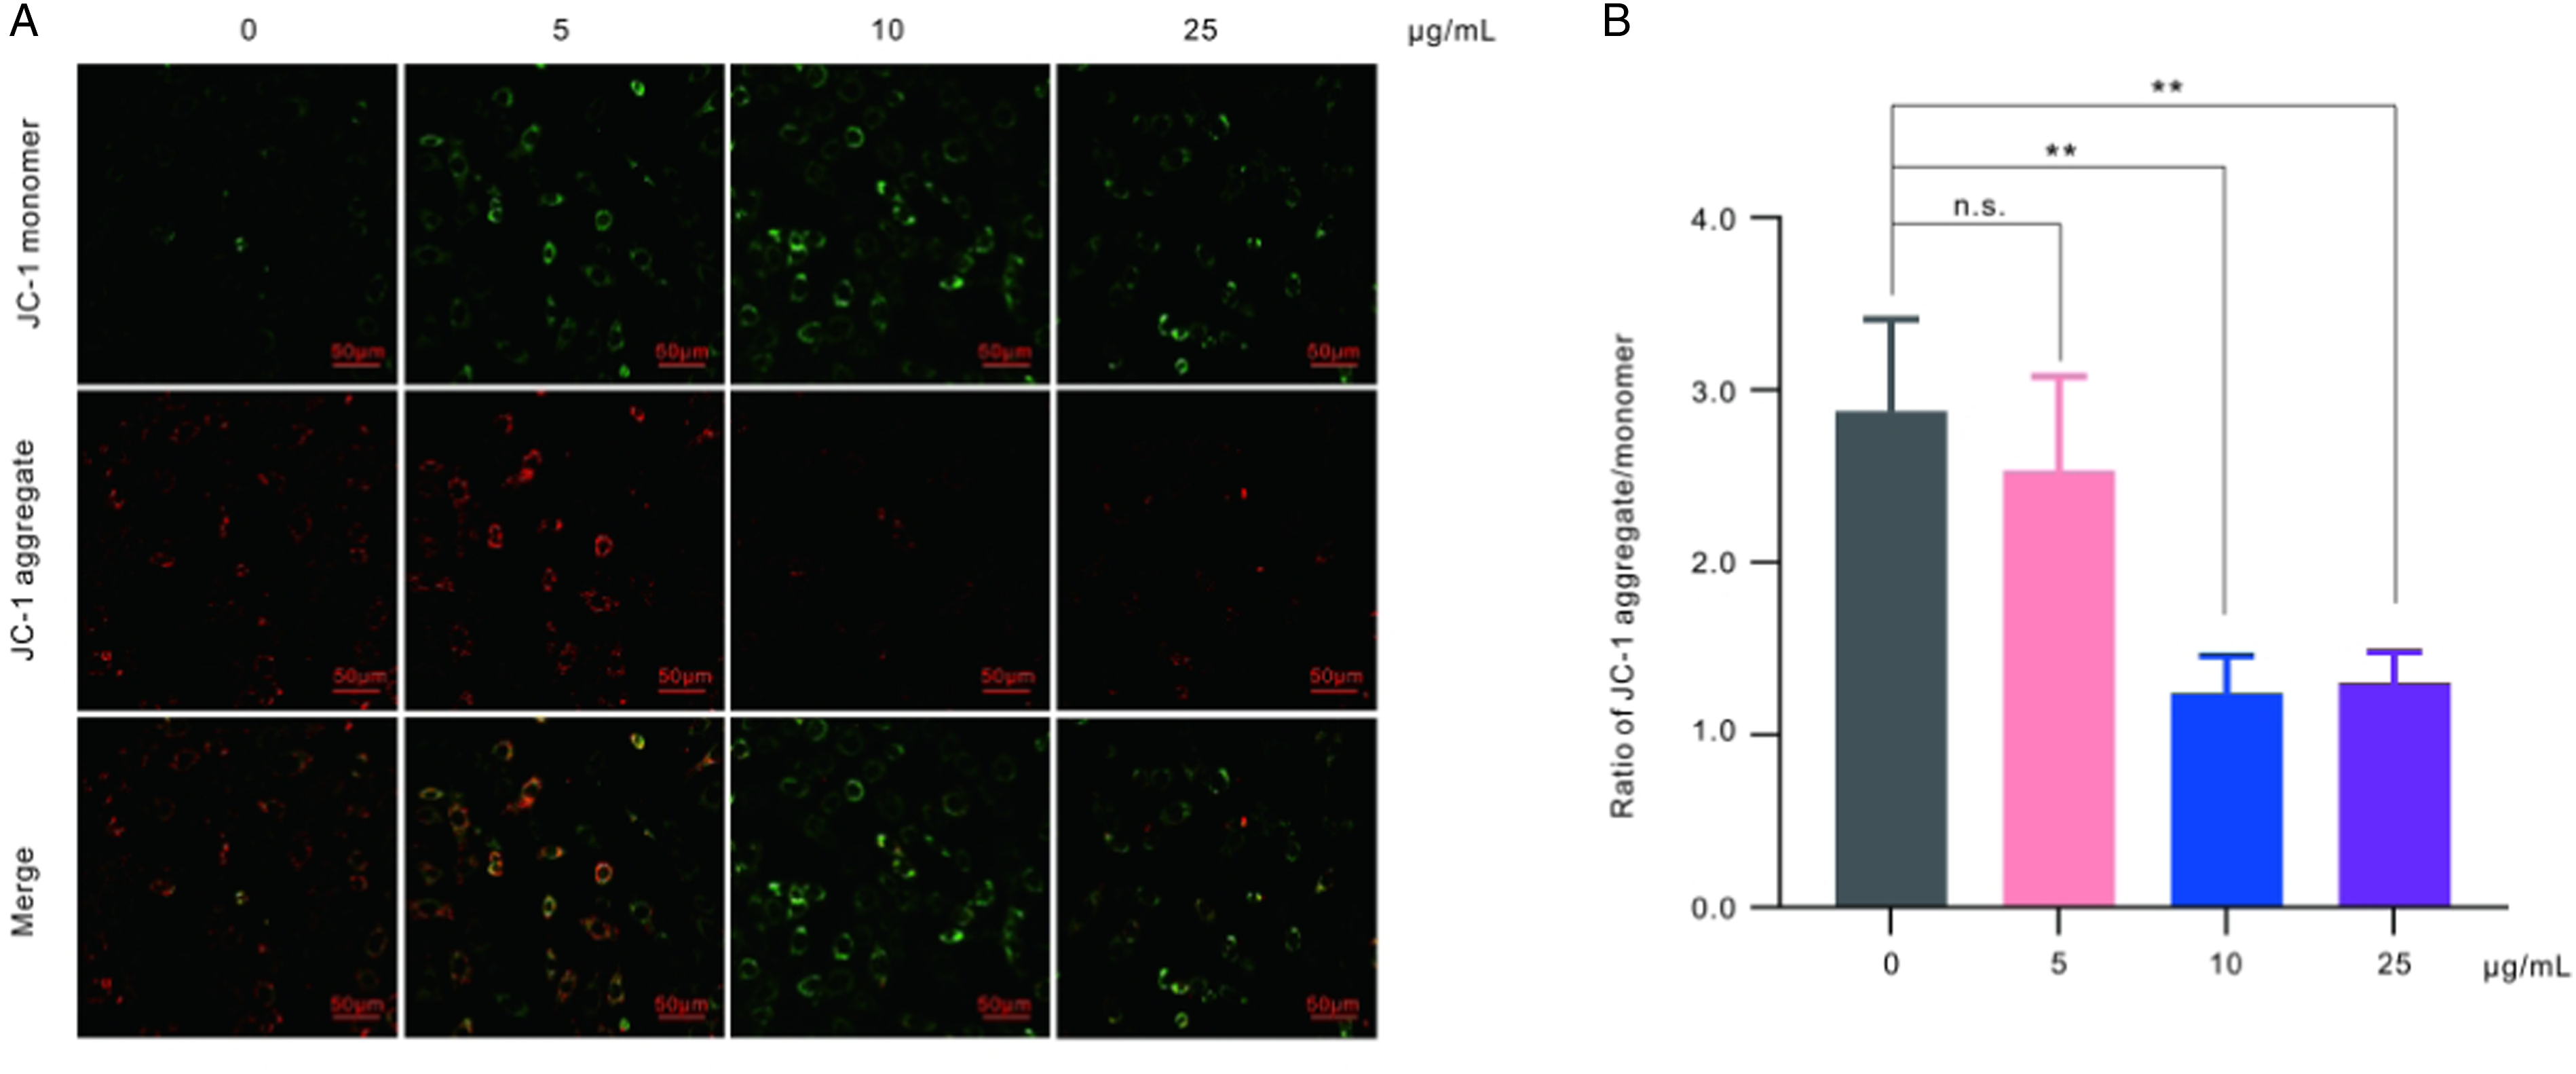
Polystyrene Nanoplastics Induced Upregulation of Mitochondrial Respiratory Chain Complex Protein Expression
Mitochondria play a crucial role in various important cellular functions. One of the key functions is the oxidative phosphorylation (OXPHOS) system, which acts as a central hub for cellular metabolism and greatly influences energy production in eukaryotic cells. The respiratory chain is a fundamental component that supports the functioning of the OXPHOS system. In order to further investigate the potential effect of polystyrene nanoplastics on mitochondrial oxidative phosphorylation, we analyzed the expression levels of respiratory chain complex subunits in GC-2spd(ts) cells after a 24-h exposure to polystyrene nanoplastics. Figure 4 demonstrates a significant increase in the protein levels of GRIM19, UQCRC2 and SDHA at each concentration of polystyrene nanoplastics, while MT-CO1 was only upregulated after exposure to 25 μg/ml polystyrene nanoplastics. In summary, these findings showed an increase in protein expression levels of UQCRC2, GRIM19, SDHA and MT-CO1, which may be attributed to the compensatory effect resulting from the short-term exposure of polystyrene nanoplastics to GC-2spd(ts) cells. Western blot analysis of the expression levels of oxidative respiratory chain complex-related proteins (A) Representative image of proteins expression level. (B–E) Quantitative analysis of relative protein expression levels. GAPDH as an internal reference. The data are shown as mean ± SD. *P < 0.05, **P < 0.01, ***P < 0.001.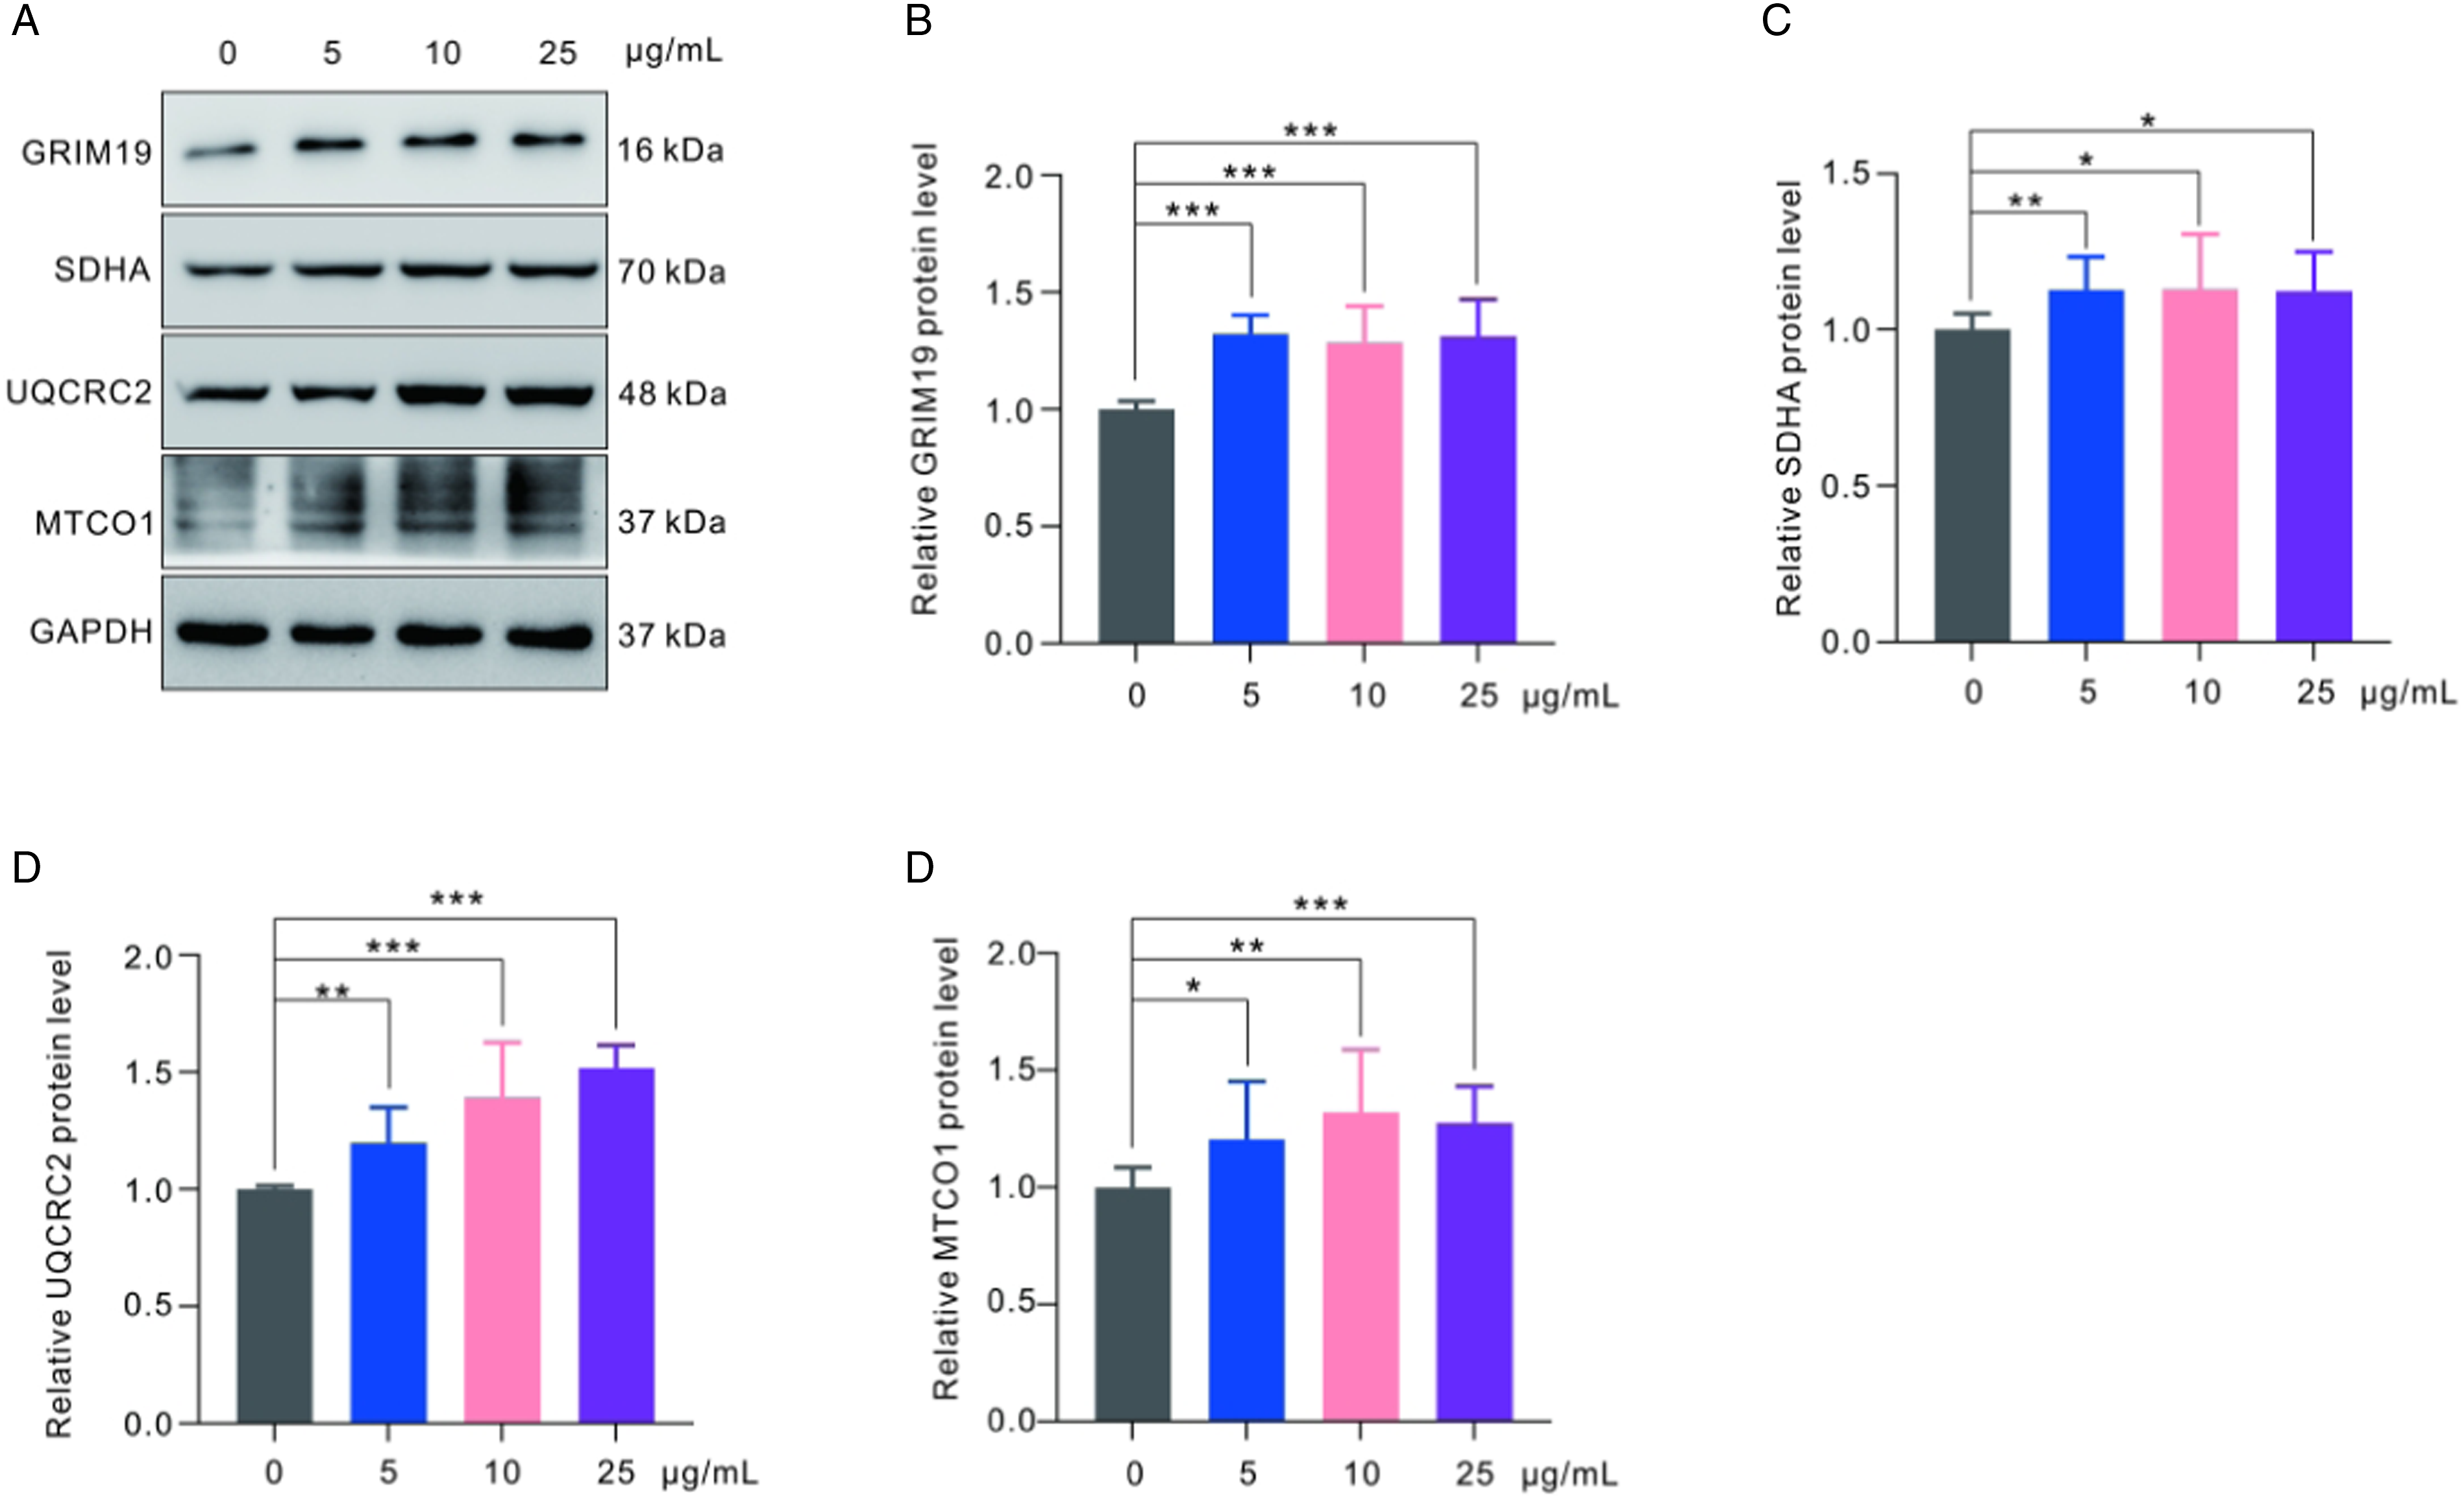
Polystyrene Nanoplastics Triggered Oxidative Stress and DNA Damage in GC-2spd(ts) Cells
The previous results have already demonstrated that polystyrene nanoplastics can modulate the subunit proteins of the mitochondrial respiratory chain complex. To further investigate whether polystyrene nanoplastics trigger oxidative stress and DNA damage, we determined the levels of ROS and γH2A.X in GC-2spd(ts) cells after exposure to polystyrene nanoplastics for 24 h. The results indicated that there was no significant alteration in intracellular ROS generation after a 24-h exposure to polystyrene nanoplastics at a concentration of 5 μg/ml. However, a significant increase in ROS levels was observed when the concentrations of polystyrene nanoplastics were increased to 10 μg/ml and 25 μg/ml. These findings were determined through quantitative analysis of photographic data and direct measurement using a fluorescent microplate reader (Figures 5(a)–(c)). High levels of ROS are known to cause DNA damage; therefore it was important to determine if polystyrene nanoplastics induced such damage. γH2A.X is a reliable biomarker that can indicate the extent of DNA damage.
25
Photographic quantitative analysis demonstrated a significant increase in the level of γH2A.X following exposure to 10 μg/ml and 25 μg/ml polystyrene nanoplastics. Additionally, Western blot assay confirmed a significant increase in the expression level of γH2A.X at each concentration (5 μg/ml, 10 μg/ml, and 25 μg/ml) of polystyrene nanoplastics (Figure 5(d)–(g)). These findings suggest that polystyrene nanoplastics have the ability to enhance intracellular ROS levels in GC-2spd(ts) cells, consequently leading to DNA damage. Polystyrene nanoplastics induce ROS and DNA damage in GC-2spd(ts) cells. (A) Representative fluorescence images of ROS levels of GC-2spd(ts) cells by DCFH-DA. (B) Quantitative analysis of ROS-induced fluorescence intensity. (C)The ROS levels were measured by a fluorescence microplate reader after exposure of GC-2spd(ts) cells to polystyrene nanoplastics. (D) Representative fluorescence images of γH2A.X induced by polystyrene nanoplastics. (E) Quantitative analysis of fluorescence intensity of γH2A.X. DAPI as an internal reference. (F) Western blot analysis of the expression levels of γH2A.X. (F) Quantitative analysis of γH2A.X expression levels. GAPDH as an internal reference. The data are shown as mean ± SD. *P < 0.05, **P < 0.01, ***P < 0.001.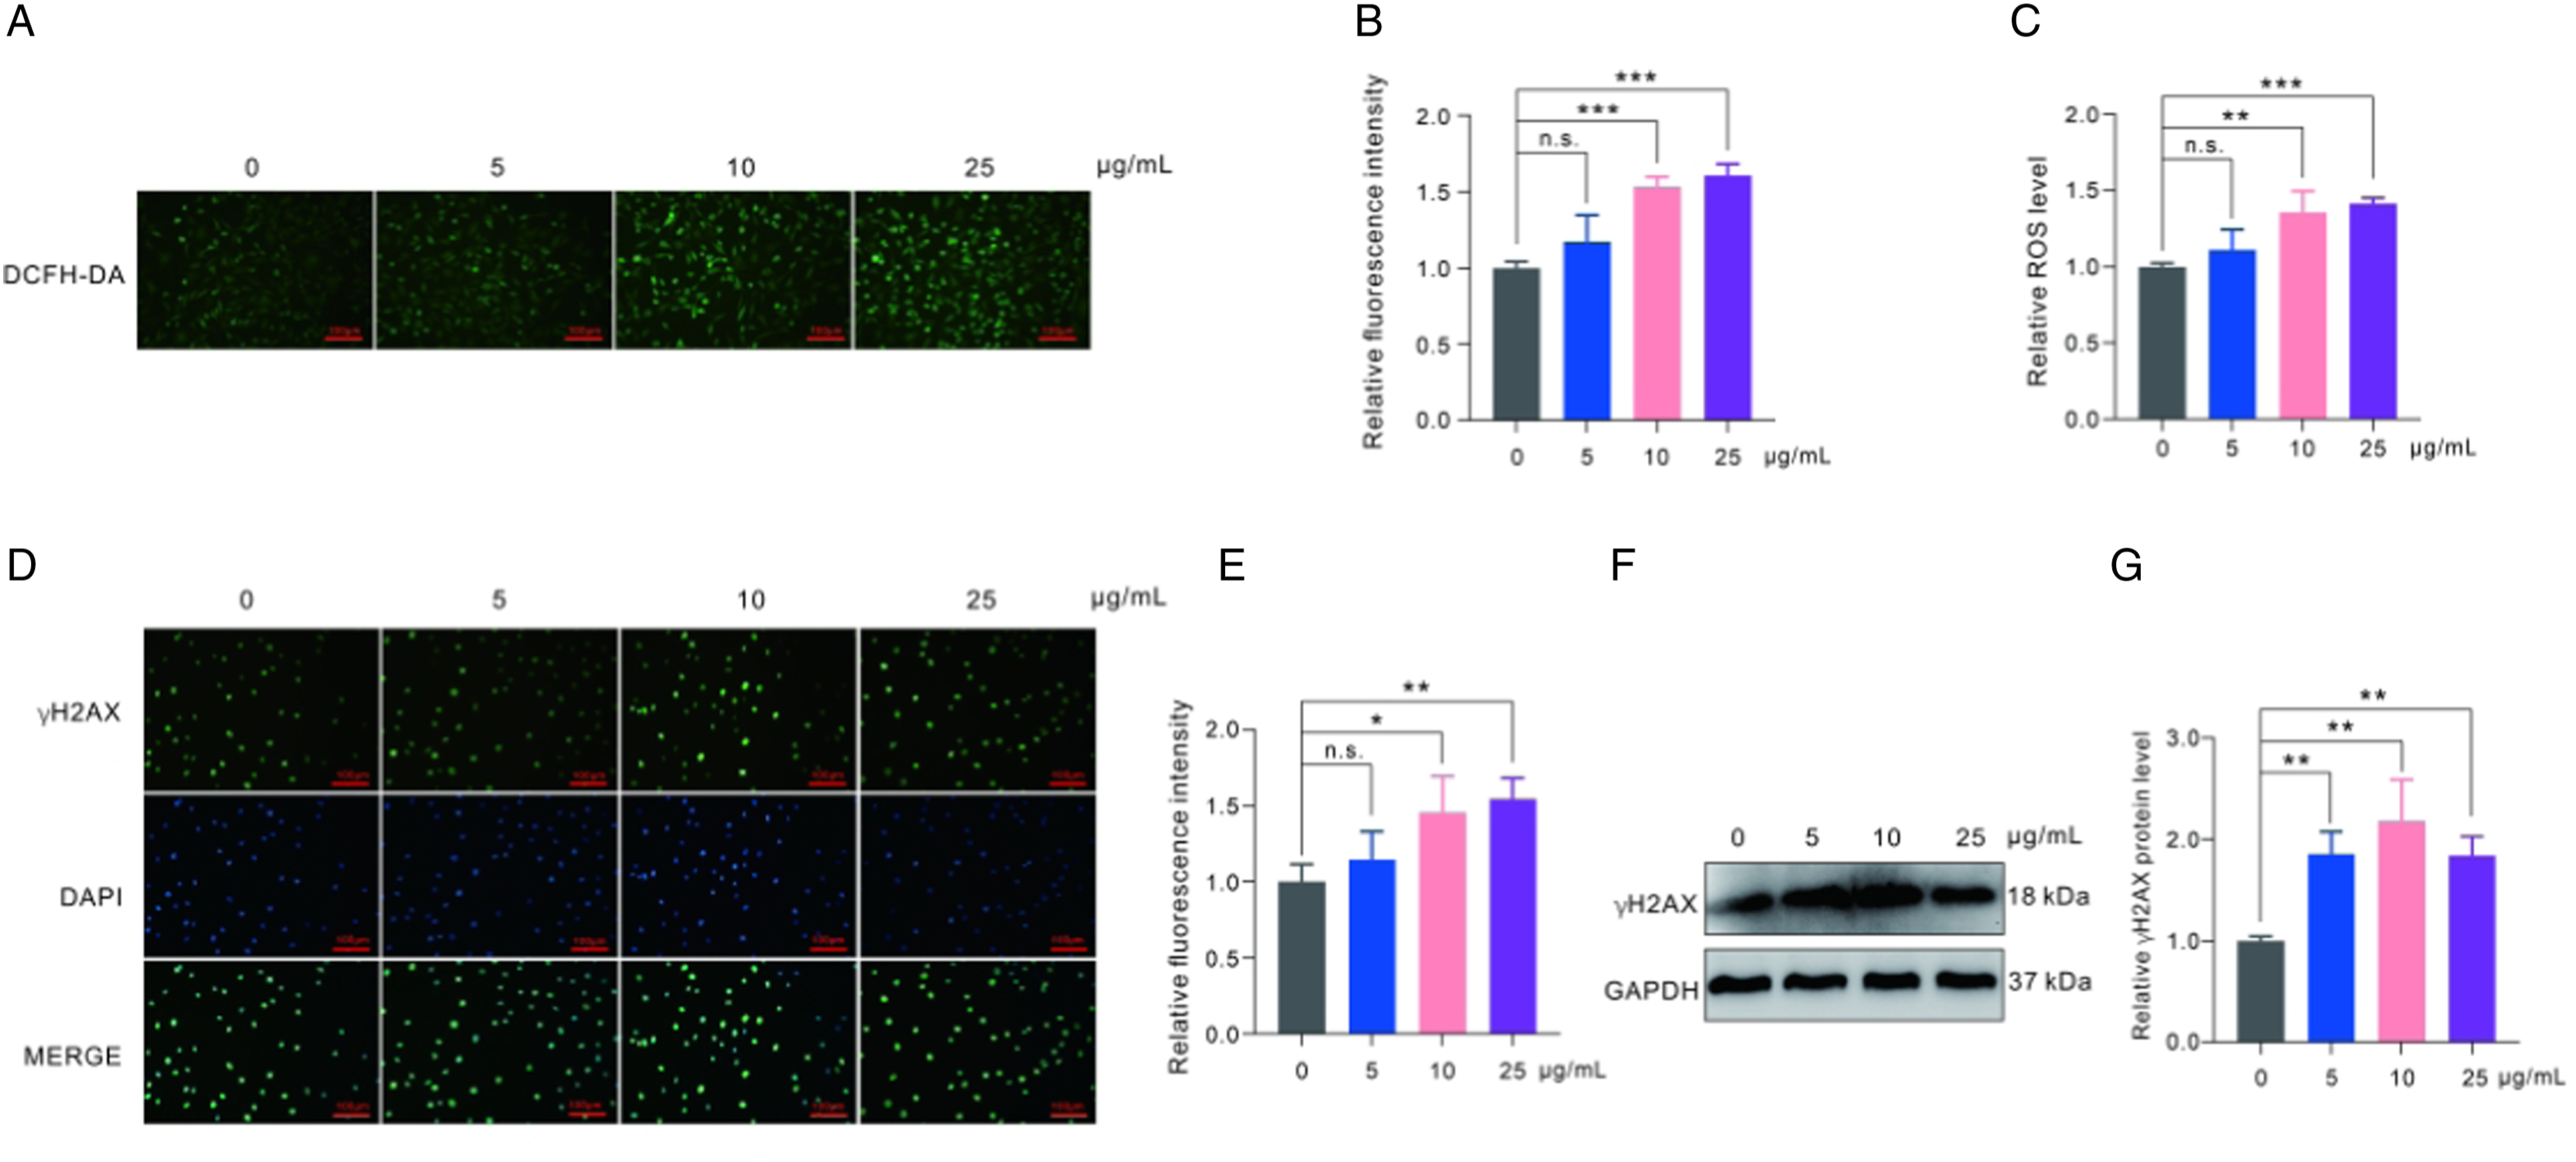
Gene Ontology Analysis of Differential Expressed Genes
To further investigate whether polystyrene nanoplastics affect gene expression levels, transcriptomic analysis was performed after exposing GC-2spd(ts) cells to 25 μg/ml polystyrene nanoplastics for 24 h. The analysis revealed no significant difference in the distribution and characteristics of gene transcription levels between the control group and the polystyrene nanoplastics group (Figure 6A). The volcano plot provided a summary of the number of differentially expressed genes (DEGs) in the polystyrene nanoplastics/control (Figure 6B). The P-value <0.05 and foldchange >2 or foldchange<0.5 were further set as thresholds for significantly differentially expressed genes (DEGs); 134 DEGs were identified, including 48 upregulated genes and 86 downregulated genes (Figure 6C, Supplemental Table 1). To better understand the biological function of these DEGs, Gene Ontology (GO) term enrichment analysis was performed at three development stages. Multiple genes involved in the “biological process” were significantly enriched in terms associated with “biological regulation,” “cellular process,” “metabolic process,” “reproduction,” “reproductive process,” and others. Furthermore, in the “cellular component” category, these DEGs predominantly participated in “cell,” “cell part,” “organelle,” and others. Additionally, in terms of “molecular function,” these DEGs showed a high enrichment in “binding,” “catalytic activity,” “molecular transducer activity,” and others (Figure 6D, Supplemental table 2). Differential expressed genes analysis and GO analysis of transcriptomic in GC-2spd(ts) after exposure of polystyrene nanoplastics (PS-NPs). (A) Boxplot for Fragments per Kilobase of transcript per Million mapped reads (FPKM) values. (B) Volcano plot of differential expressed genes (DEGs). (C) The histogram of number of DEGs. (D) GO classification analysis of DEGs.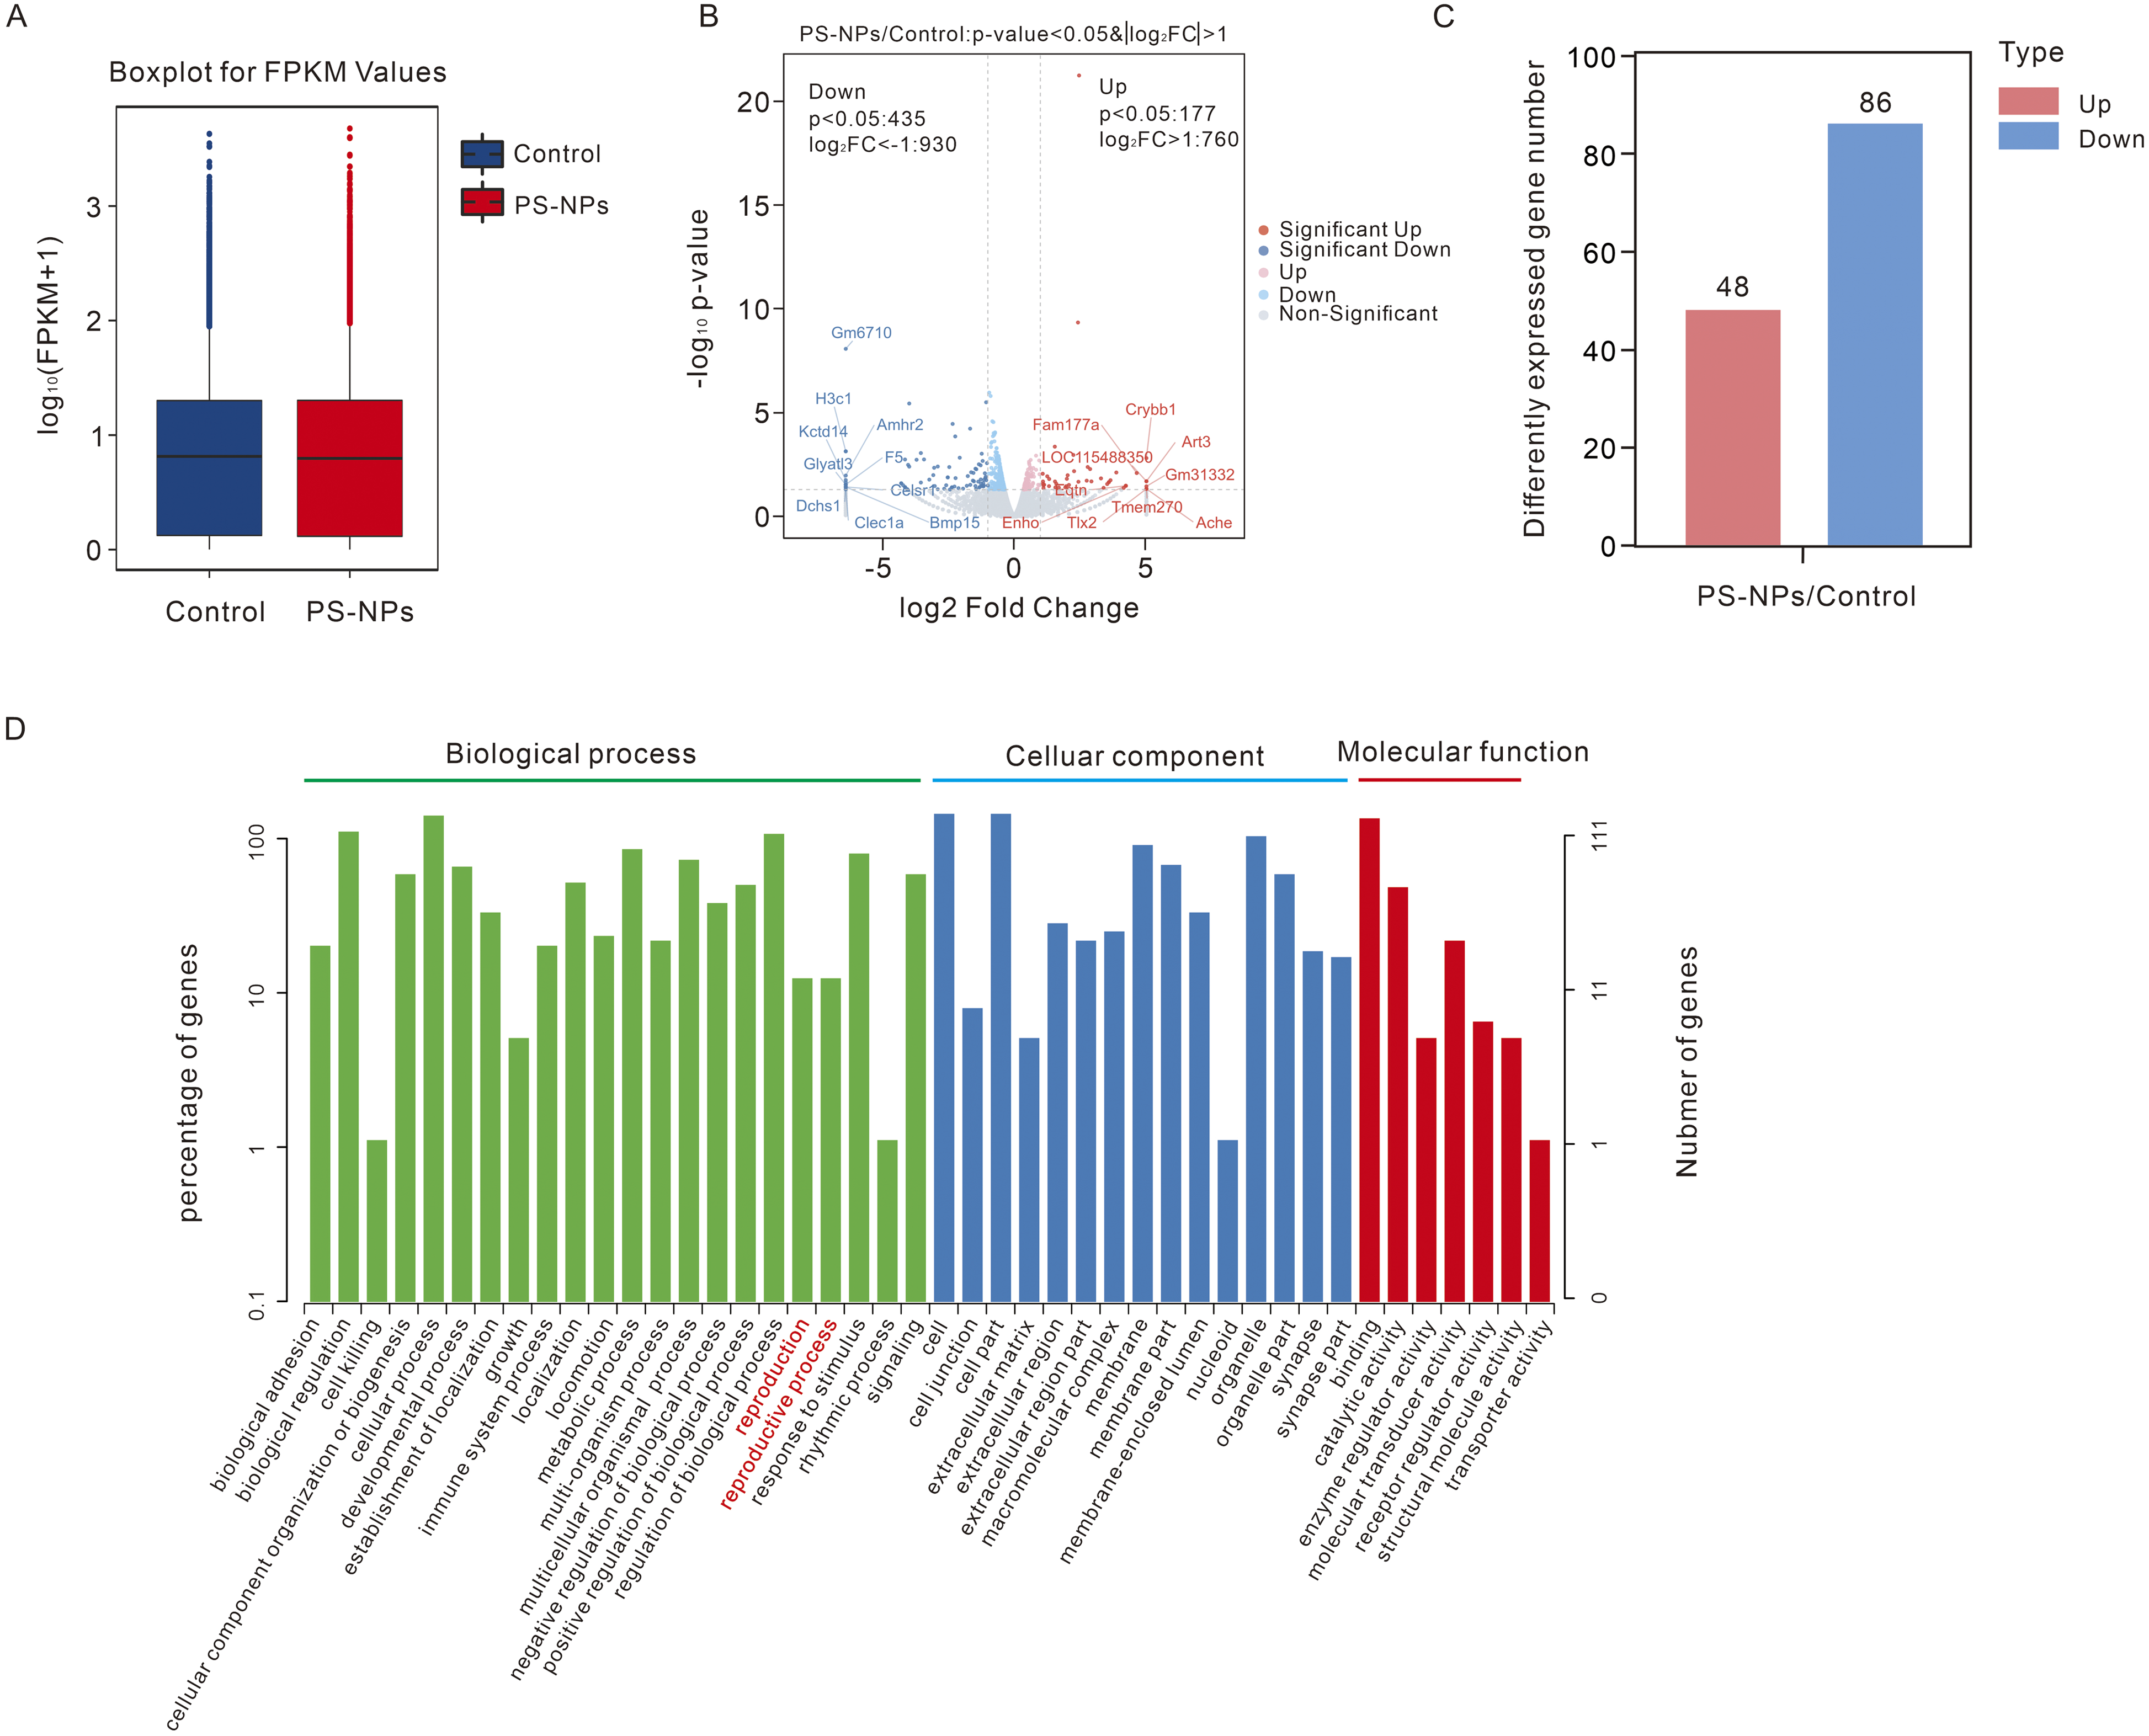
qRT-PCR Validation of Genes Related to Spermatogenesis by GO Analysis
To identify potential regulatory genes of polystyrene nanoplastics, the top 30 GO terms were screened with the criteria that 10 terms with the high to low enrichment are shown according to the corresponding -log10P-value in the three GO classifications (biological process, cellular component and molecular function). A significant number of the top 30 terms were found to be associated with spermatogenesis. These terms include acrosome reaction, sperm mitochondrial organization, sperm annulus, and outer acrosomal membrane (Figure 7A, Supplemental Table 3). Additionally, the DEGs NSUN7, SEPTIN4, TRIM36, EQTN, and SYT8, as shown in Figure 7B, were analyzed using transcriptomic data. The result revealed that NSUN7, SEPTIN4, and TRIM36 were downregulated, while EQTN and SYT8 were upregulated after exposing GC-2spd(ts) cells to polystyrene nanoplastics. To validate the RNA-seq results, we examined the relative transcript levels of these five DEGs using qRT-PCR. The results showed a significant decrease in NSUN7 expression levels after exposure to a concentration of 25 μg/ml of polystyrene nanoplastics. Similarly, SEPTIN4 and TRIM36 mRNA levels were significantly decreased at all concentrations. However, the level of EQTN exhibited a significant increase after exposure to concentrations of 5 μg/ml and 25 μg/ml of polystyrene nanoplastics. The expression level of SYT8 was slightly decreased at a concentration of 10 μg/ml but significantly increased at 25 μg/ml (Figure 7C). Screening and validation of spermatogenesis related genes. (A) Top 30 GO terms analysis. (B) The chord diagram analysis of spermatogenesis related genes. (C) Validation of transcriptomic data by qRT-PCR.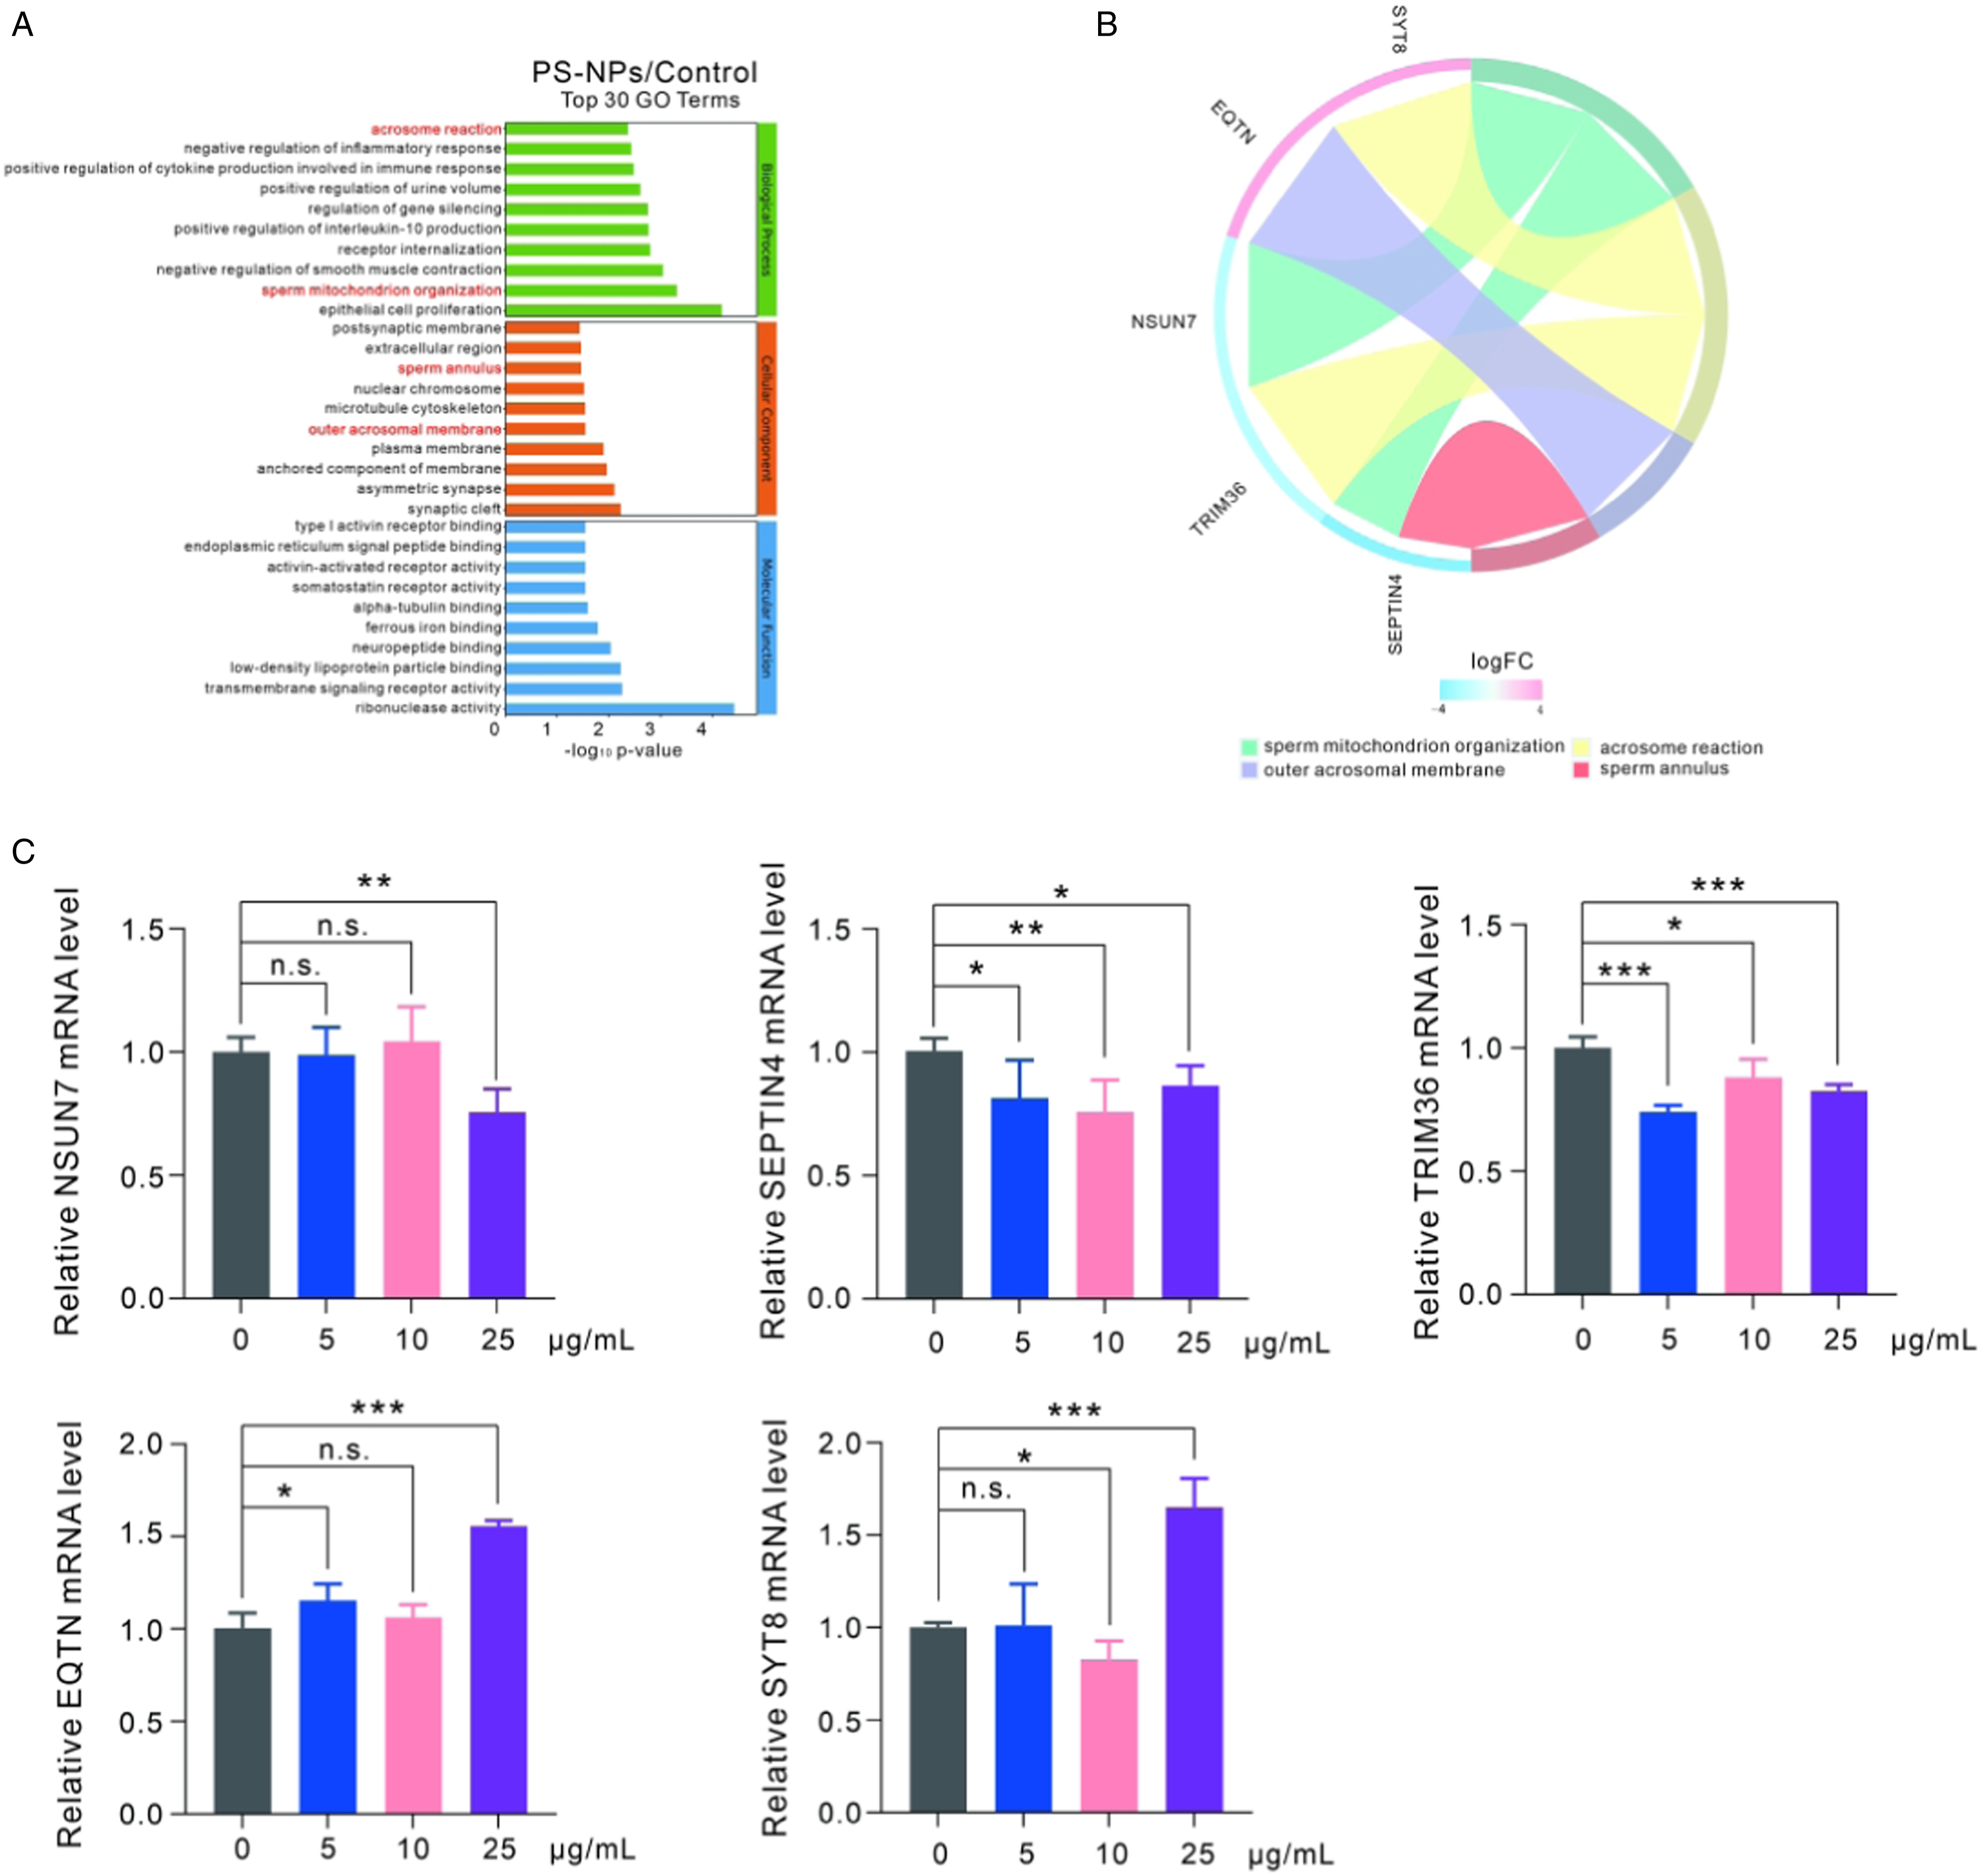
Discussion
In recent years, the adverse effects of environmental pollutants on reproductive health have garnered significant social attention. The impact of polystyrene microplastics exposure on endocrine disruption has been explored, particularly on reproductive toxicity, hormone levels, sperm quality, apoptosis, etc. However, the specific regulatory genes associated with polystyrene microplastics remain poorly understood. In present study, our goal was to elucidate the biological functions and potential genes of germ cells that are regulated by polystyrene microplastics through cellular function assays and transcriptomic analysis.
In this study, GC-2spd(ts) cells were exposed to polystyrene nanoplastics for 24 h, the results revealed that polystyrene nanoplastics could be internalized in the cells, predominantly accumulating in the cytoplasm, leading to a significant increase in LDH levels in the medium. Lu et al. previously demonstrated that the exposure of human umbilical vein endothelial cells with 25 μg/ml of 100 nm polystyrene nanoplastics for 24 h also resulted in a significant increase in LDH levels in the culture medium. 14 These findings suggested that polystyrene nanoplastics may induce cell membrane damage, although further studies are required to elucidate whether this is the mechanism through which polystyrene nanoplastics enter cells. Several studies have demonstrated that exposure to polystyrene microplastics can lead to mitochondrial damage. For instance, Li et al. reported that exposure to polystyrene nanoplastics for 24 h induced mitochondrial damage in HepG2 cells, including morphological changes, decreased adenosine triphosphate (ATP) production and the loss of mitochondrial membrane potentials. 26 Our study further revealed that exposure to polystyrene nanoplastics resulted in a reduction of mitochondrial membrane potential in GC-2spd(ts) cells and altered the expression levels of proteins related to the respiratory chain complex. Mitochondria play a crucial role in oxygen consumption and ROS production, with respiratory chain complexes I and III being major sources of ROS. 27 The GRIM19 gene encodes a subunit of the mitochondrial membrane respiratory chain NADH dehydrogenase (complex I), facilitating electron transfer from NADH to the respiratory chain. 28 UQCRC2, an essential subunit of complex III, is responsible for electron transfer within the respiratory chain. 29 Our results showed a significant increase in the expression levels of GRIM19 and UQCRC2 in GC-2spd(ts) cells exposed to polystyrene nanoplastics for 24 h. This may be due to the compensatory effect of polystyrene nanoplastics causing damage to the mitochondrial respiratory chain complex for a short period of time. Subsequent analysis demonstrated a significant rise in ROS levels following cells exposure to polystyrene nanoplastics, indicating a potential for mitochondrial respiratory chain impairment. Researchers have illustrated that heightened ROS levels can lead to DNA damage, affecting spermatogenesis and contributing to compromised reproductive function.30,31 γH2A.X is essential for recruiting DNA repair proteins and serves as a marker for DNA damage.32,33 Following exposure to polystyrene nanoplastics, there was a significant rise in γH2A.X expression levels in GC-2spd(ts) cells, indicating that polystyrene nanoplastics can induce DNA damage, which is likely caused by increased ROS production.
Many factors can negatively affect gene transcriptomics, including DNA damage. 34 This study systematically analyzed the differential expression levels of transcriptomics in GC-2 spd(ts) following exposure to polystyrene nanoplastics, the results revealed 48 upregulated genes and 86 downregulated genes. Through TOP30 analysis, five genes related to the spermatogenesis process were identified. Spermatogenesis involves the proliferation and differentiation of spermatogonia, meiosis of pre-spermatogonia, and morphological changes of spermatozoa as they mature. 35 The NSUN7 gene, located on human chromosome 4, encodes the putative methyltransferase NSUN7 protein, has a role in mitochondrial rRNA processing for sperm motility. 36 Mutations in this gene can lead to impaired motility and male infertility. Transversion mutations in exon 7 of the NSUN7 gene have been linked to low sperm motility, serving as a marker for asthenospermic men. 37 This study found that exposure to 25 μg/ml polystyrene nanoplastics for 24 h significantly downregulated the NSUN7 gene in the GC-2spd(ts) cell line. SEPTIN4 (SEPT4) is a crucial member of the polymerized GTP-binding protein family, playing essential roles in various cellular processes such as membrane compartmentalization, vesicle trafficking, mitosis, and cytoskeletal remodeling. 38 Studies have shown that SEPTIN4 is particularly important for sperm morphology and viability, with its absence potentially linked to conditions like asthenozoospermia and asthenoteratozoospermia.39,40 Our research indicated a significant decrease in SEPTIN4 gene expression levels following exposure to different concentrations of polystyrene nanoplastics. This finding suggests a regulatory effect of polystyrene nanoplastics on SEPTIN4 gene expression that could contribute to abnormalities in sperm morphology. The role of the acrosome in the structure of spermatozoa should not be overlooked. TRIM36, a microtubule-associated E3 ubiquitin ligase, also known as Haprin, functions in cytoskeletal organization and has been implicated in the regulation of spermatogenesis and early embryonic development. 41 Initially identified for its abundance in the testis, TRIM36 is predominantly found in elongated spermatids, at later stages of germ cell development, and specifically in the sperm acrosome region, where it functions in the acrosome reaction. 42 This study demonstrated a significant decrease in TRIM36 gene expression levels after exposure to polystyrene nanoplastics, indicating that polystyrene nanoplastics may affect the normal development of sperm acrosome by downregulating the expression of the TRIM36 gene. EQTN, a membrane protein, is specifically localized at the acrosomal membrane from the round spermatid to mature sperm stages. While not essential for acrosome biogenesis, it plays a crucial role in the acrosome reaction by facilitating the fusion of the outer acrosomal membrane with the sperm plasma membrane, likely through an interaction with the SNARE complex. 43 Results from the present study indicated a significant upregulation of EQTN expression levels following exposure to 5 μg/ml and 25 μg/ml polystyrene nanoplastics. However, further research is needed to determine if polystyrene nanoplastics can modulate their biological functions by regulating the expression of EQTN. SYT8 is found in mature spermatozoa, specifically in the acrosomal crescent region, where it plays a role in spermatid membrane fusion and the acrosomal reaction. 44 It is also a potential regulator of the Ca2+ sensors involved in mammalian spermatozoa acrosomal exocytosis. 45 In the present study, the result indicated that exposure to 25 μg/ml polystyrene nanoplastics led to a significant upregulation of the SYT8 gene in GC-2spd(ts) after 24 h, suggesting that it is highly probable that polystyrene nanoplastics contribute to acrosomal reaction by regulating SYT8 gene expression. In this study, we confirmed that five genes related to spermatogenesis (NSUN7, SEPTIN4, TRIM36, EQTN, and SYT8) are regulatory genes of polystyrene nanoplastics using qRT-PCR. Transcriptomic analysis revealed that exposure of cells to polystyrene nanoplastics led to differential expression of 134 genes. While we did not further validate the remaining 129 genes in this study, it is probable that they also play a role in mediating spermatogenesis and regulating germ cell functions through other signaling pathways, warranting further investigation in future research.
Conclusions
This study showed that a significant rise in LDH levels in the GC-2spd(ts) cells culture medium after polystyrene nanoplastics exposure, indicating potential damage to cell membranes. Electron microscopy revealed the internalization of polystyrene nanoplastics by cells, with accumulation in the cytoplasm. This internalization caused changes in mitochondrial membrane potential and altered the expression levels of respiratory chain complex-related proteins (GRIM19, UQCRC2, SDHA, and MT-CO1), resulting in a substantial increase in ROS levels, leading to DNA damage in the cell nucleus. Transcriptomic analysis showed differential expression levels of genes upon polystyrene nanoplastics exposure, with 48 genes upregulated and 86 genes downregulated. It was further confirmed by qRT-PCR that five genes (NSUN7, SEPTIN4, TRIM36, EQTN and SYT8) related to spermatogenesis. In summary, this study provides preliminary insights into the biological effects of polystyrene nanoplastics on germ cells, indicating a potential disruption of spermatogenesis. Additionally, transcriptomic analysis revealed genes potentially regulated by polystyrene nanoplastics, thereby providing a foundation for further research into these relevant pathways.
Supplemental Material
Supplemental Material - Exploring the Biological Effects of Polystyrene Nanoplastics on Spermatogenesis: Insights From Transcriptomic Analysis in Mouse Spermatocytes
Supplemental Material for Exploring the Biological Effects of Polystyrene Nanoplastics on Spermatogenesis: Insights From Transcriptomic Analysis in Mouse Spermatocytes by Ying Jiang, Kexuan He, Qianyi Shen, Can Yang, Xin Huang, Junjie Fan, Miaomiao Du, Jianrong Wu, Huajuan Ruan, Jun Yang, and Yeting Hong in International Journal of Toxicology
Footnotes
Author Contributions
Ying Jiang contributed to design, contributed to acquisition and analysis, drafted manuscript, and critically revised manuscript; Kexuan He contributed to acquisition and analysis, drafted manuscript, and critically revised manuscript; Qianyi Shen, Can Yang, Xin Huang, Junjie Fan, Jianrong Wu, and Huajuan Ruan contributed to analysis and critically revised manuscript; Miaomiao Du contributed to conception and critically revised manuscript; Jun Yang contributed to conception, drafted manuscript, and critically revised manuscript; Yeting Hong contributed to conception and design, contributed to acquisition, analysis, and interpretation, drafted manuscript, and critically revised manuscript. All authors gave final approval and agree to be accountable for all aspects of work ensuring integrity and accuracy.
Declaration of Conflicting Interests
The author(s) declared no potential conflicts of interest with respect to the research, authorship, and/or publication of this article.
Funding
The author(s) disclosed receipt of the following financial support for the research, authorship, and/or publication of this article: This study was funded by grants from the National Natural Science Foundation of China (No. 81801513).
Supplemental Material
Supplemental material for this article is available online.
References
Supplementary Material
Please find the following supplemental material available below.
For Open Access articles published under a Creative Commons License, all supplemental material carries the same license as the article it is associated with.
For non-Open Access articles published, all supplemental material carries a non-exclusive license, and permission requests for re-use of supplemental material or any part of supplemental material shall be sent directly to the copyright owner as specified in the copyright notice associated with the article.