
Abstract
The long-term effect of fluoridated water consumption during development on the velocity of nerve impulse conduction in the sciatic nerve of rats was assessed. Thirty male Wistar rats, 21 days old, were randomly assigned to five groups. Three groups were given fluoridated water ad libitum (as the only source) at different concentrations (10, 100, and 150 ppm), designated as groups F10, F100, and F150, respectively. The study included a control group (C) that received fluoridated water at the maximum level established by the World Health Organization (1.5 ppm of fluorides) and another group that received deionized water (DW). The animals were treated until they reached 90 days of age. Electrophysiological recordings were performed on the rats’ sciatic nerves to determine nerve conduction velocity, and blood plasma was extracted for fluoride concentration analysis. The study found that the F150 group had a lower nerve impulse conduction velocity in the sciatic nerve compared to the C group (P = 0.0015). Additionally, there was a negative correlation between the concentration of fluorides in plasma and the nerve conduction velocity (r = −0.5132, P = 0.0037). These findings indicate that chronic consumption of high concentrations of fluoride leads to a decrease in nerve conduction velocity. This, in conjunction with potential alterations in the central nervous system, may explain the deficits in learning and memory tests that have been documented in numerous studies evaluating individuals exposed to fluoride consumption. These results provide valuable information for understanding the effects and action mechanisms of fluoride in exposed individuals.
Introduction
Fluorine is the 13th most common element found in the earth’s crust, and it is only present in its ionic state known as fluoride (F-).1,2 F- is commonly used in dental sanitation products due to its bactericidal action, and it has been shown to have beneficial effects in the prevention and treatment of dental caries, as well as providing enamel with greater resistance.3,4 Water and food fluoridation programs have been implemented in various regions of the world for this reason. 5
The World Health Organization (WHO) has set a maximum permissible level of 1.5 ppm F- in water for human consumption. 6 This is due to epidemiological studies that have shown chronic consumption of high concentrations of this element can cause harmful effects on health, such as dental and skeletal fluorosis.7–9 Experimental studies have reported that exposure to it produces alterations in various bodily systems, including the liver,10,11 kidneys, 12 digestive system,13,14 immune system, 11 reproductive system11,12 and nervous system. 15 Similarly, a substantial body of research has identified a significant correlation between IQ and cognitive functions such as learning and memory, and serum fluoride concentration in children residing in regions endemic for fluorosis. 16
Approximately 25 countries worldwide have endemic fluorosis, meaning that high concentrations of F- are naturally present in the water (up to 63 mg/L).17,18 Despite the implementation of water purification processes, the element remains present in the water supply. This results in the population residing in these areas being exposed to chronic fluoride poisoning, the most overt manifestation of which is in the form of alterations to the teeth, ranging from whitish to brownish discoloration depending on the severity (dental fluorosis). 19
F- can cross the blood–brain barrier. 4 Chronic intoxication by F- has been reported to cause toxic effects in brain structures such as the hippocampus (mice exposed to 50 and 100 mg/L NaF for 60 days), 20 frontal cortex (rats exposed to 100 ppm F- for 10 weeks; rats exposed to 100 and 500 ppm NaF for 3 months),21,22 and cerebellum (rats exposed to 12 mg/kg F- daily for 2 months; mice exposed to 50 mg/L NaF).23,24 According to previous studies, F- induces oxidative stress in nerve cells and the release of pro-inflammatory factors 15 (rats exposed to 60 and 120 ppm F- for 10 weeks; rats exposed to 100 mg/L NaF for 3 weeks).25,26 Additionally, some authors report changes in neurotransmitter release15,27 caused by F- (4 and 6 mM for 24 hours in Neuro 2A cells; 50 and 100 mg/L F- for 90 days in mice).28,29 However, no literature was found on the impact of fluoride consumption on nerve conduction velocity at the time of this study. In light of the evidence indicating that chronic fluoride consumption induces oxidative stress and proinflammatory factor release in the nervous system, it is imperative to investigate the impact of such exposure on the integrity of nerve pathways and the efficiency of neuronal communication. Furthermore, alterations in neurotransmitter release have the potential to modify synapses and signal transmission, which could impact the speed of response of the nervous system and, in turn, affect the proper performance of cognitive, motor, and sensory functions. Therefore, the objective of this research was to study the effect of chronic exposure to fluoride during development on nerve conduction velocity in the sciatic nerve.
Materials and Methods
Animals and Treatment
Thirty male Wistar rats, aged 21 days and weighing 36.15 ± 6.8 g, were randomly assigned to one of five study groups based on their level of F- exposure. The rats were obtained from the Centro de Investigación Biomédica de Michoacán, Instituto Mexicano del Seguro Social (IMSS).
For this study, exposure doses of F10, F100, and F150 were used, which correspond to 10, 100, and 150 ppm of fluoride, respectively. These concentrations were selected because rats require concentrations up to 10 to 20 times higher to achieve plasma levels similar to those found in humans.19,30–32 The F- concentrations used allow us to reach the plasma concentrations in human populations living in areas with endemic fluorosis where up to 17.7 ppm have been reported in groundwater. 33 The control group (C) was given 1.5 ppm of F-, which is the maximum permissible level established by the WHO, 6 considering the aforementioned this concentration is equivalent in the rats to the dose typically found in bottled water in Mexico. 34 Additionally, a group that received the treatment vehicle, deionized water (DW), was included.
Fluoridated water was prepared with deionized water and sodium fluoride (NaF) (Meyer Chemistry®) and given to the subjects as the only source of drinking water (free access) until the end of the treatment. The total duration of exposure was 10 weeks.
During the experiment, the animals were maintained under standard vivarium conditions (temperature 22°C–26°C, relative humidity 40%–70%, light/dark cycles of 12 h) and were given commercial balanced diets for laboratory rodents ad libitum (Nutricubos, Agribrands Purina México S.A. de C.V.; protein 23%–fat 3%–fiber 6%–ash 7%–calcium 1%–phosphorus 0.6%–nitrogen-free extract 55%). The body weight of the animals was measured at the beginning of the treatment and once a week. Weaning weight and final weight one day before euthanasia were used to determine total weight gain.
F- intake through water was calculated by recording consumption once a week. To do this, the amount of water administered in the drinker of each cage was weighed and the amount remaining 24 hours later was subtracted from the initial amount. The result was then divided by the sum of the weights in kg recorded that week for the animals in the cage to obtain the mg of F- consumed per kg of body weight per day (mg/kg bw).
At the end of treatment (90 days of age), electrophysiological recording and blood collection for plasma were performed. The animals were then euthanized by decapitation under anesthesia.
All animals were cared for in strict accordance with the Guide for the Care and Use of Laboratory Animals, 35 and the experimental design was approved by the Comité Local de Investigación en Salud 1602 Registro CONBIOETICA 16 CEI 002 2017033 (Approval no. R-2020-1602-002) on February 21, 2020.
Determination of Nerve Conduction Velocity in the Sciatic Nerve
Surgical exposure of the sciatic nerve
The rats were anesthetized via intraperitoneal (i.p.) injection with sodium pentobarbital (50 mg/kg) and kept on a heating pad to maintain body temperature. The anesthesia was monitored and maintained by a veterinary physician throughout the electrophysiological recording period, which lasted approximately 30 to 40 min per rat. Prior to the commencement of the experiment, each rat was positioned in dorsal recumbency, with both upper extremities and the right hind limb slightly extended. The hind limb on the left was subsequently placed in a crossed position over the right hind limb.
The entire posterior aspect of the left thigh was shaved, commencing at the pelvic bone and extending to the patella, the area was disinfected, and an incision was made in the skin in the first anterior third of the gluteal muscle. After exposing the muscle, a meticulous blunt dissection was carried out until the left sciatic nerve was visible.
Electrophysiological recordings
To stimulate the nerve, a monopolar needle electrode was placed near its exit from the pelvis, while the reference electrode was placed on the opposite side. Two electrodes were attached to a support and placed around the nerve before it bifurcated for recording. The ground electrode was subcutaneously placed in the right axillary region.
Stimulation was performed using a Grass Instruments S88 dual output square pulse device. Recordings were obtained with the Grass PolyVIEW system and the DataWave SciWorks data acquisition system, both provided by the Laboratory of Experimental Neurophysiology of the Michoacán Biomedical Research Center of the Mexican Social Security Institute (IMSS) in Morelia, Michoacán.
The current for supramaximal stimulation was determined by gradually increasing short-duration stimuli (0.1 ms) from 0.1 to 0.1 mA until the amplitude of the last two potentials remained constant. Subsequently, a 10-pulse stimulation train at supramaximal intensity was applied to each subject (six rats per group). The stimulation train was recorded with the aforementioned equipment for subsequent analysis.
The recordings were processed using MatLab software version 10 to determine the latency between the two recording electrodes. The nerve conduction velocity (NCV) was calculated by dividing the distance between the first and second recording electrodes (in meters) by the latency (in seconds). 36
Determination of F- Levels in Plasma
Immediately following the conclusion of electrophysiological recordings, the rats were maintained under anesthesia to facilitate the acquisition of plasma via intracardiac puncture. Anesthesia was monitored throughout the procedure by a veterinary physician, and a second dose of anesthetic (as previously described) was administered when necessary.
The concentration of F- in plasma was determined using the ion-selective electrode method. Equal parts of rat plasma and TISAB II solution were mixed. An ion-selective electrode (model 9609BNWP, Thermo Scientific™) coupled to a multiparameter pH and ISE meter (model A324, Orión Star™) was used for the reading. The F- concentration was expressed in parts per million (ppm). Each sample was read in triplicate at a constant temperature of 23°C ± 3°C with constant agitation.
Statistical Analysis
The obtained data underwent a normality test using the Shapiro-Wilk test. Data that met the normality assumption were analyzed using one-way ANOVA, and the multiple comparison Tukey test was used as a post hoc test. Additionally, the Pearson correlation test was used to determine the correlation between the results. Results were considered significant when P ≤ 0.05.
The data are presented as mean (M) ± standard error of the mean (SEM). GraphPad Prism software version 9.5.0 was used to conduct all statistical tests.
Results
The daily consumption of F- from water in the study groups was 0.23 ± 0.03, 0, 2.34 ± 0.58, 19.37 ± 4.19, and 28.47 ± 6.09 mg/kg BW for C, DW, F10, F100, and F150, respectively based on the water consumption of rats.
The animals treated with F- showed a lower total weight gain in a dose-dependent manner (Figure 1). This effect was statistically significant in groups F100 and F150 compared to groups C (P = 0.0457; P = 0.001). Additionally, the F150 group had a significantly lower weight compared to the DW group (P = 0.0285). Total weight gain results. Data represent the M ± SEM of six animals per group. ANOVA F = 2.035, P = 0.0018. The upper lines indicate the groups in which statistically significant differences were identified. *P < 0.05, **P < 0.01.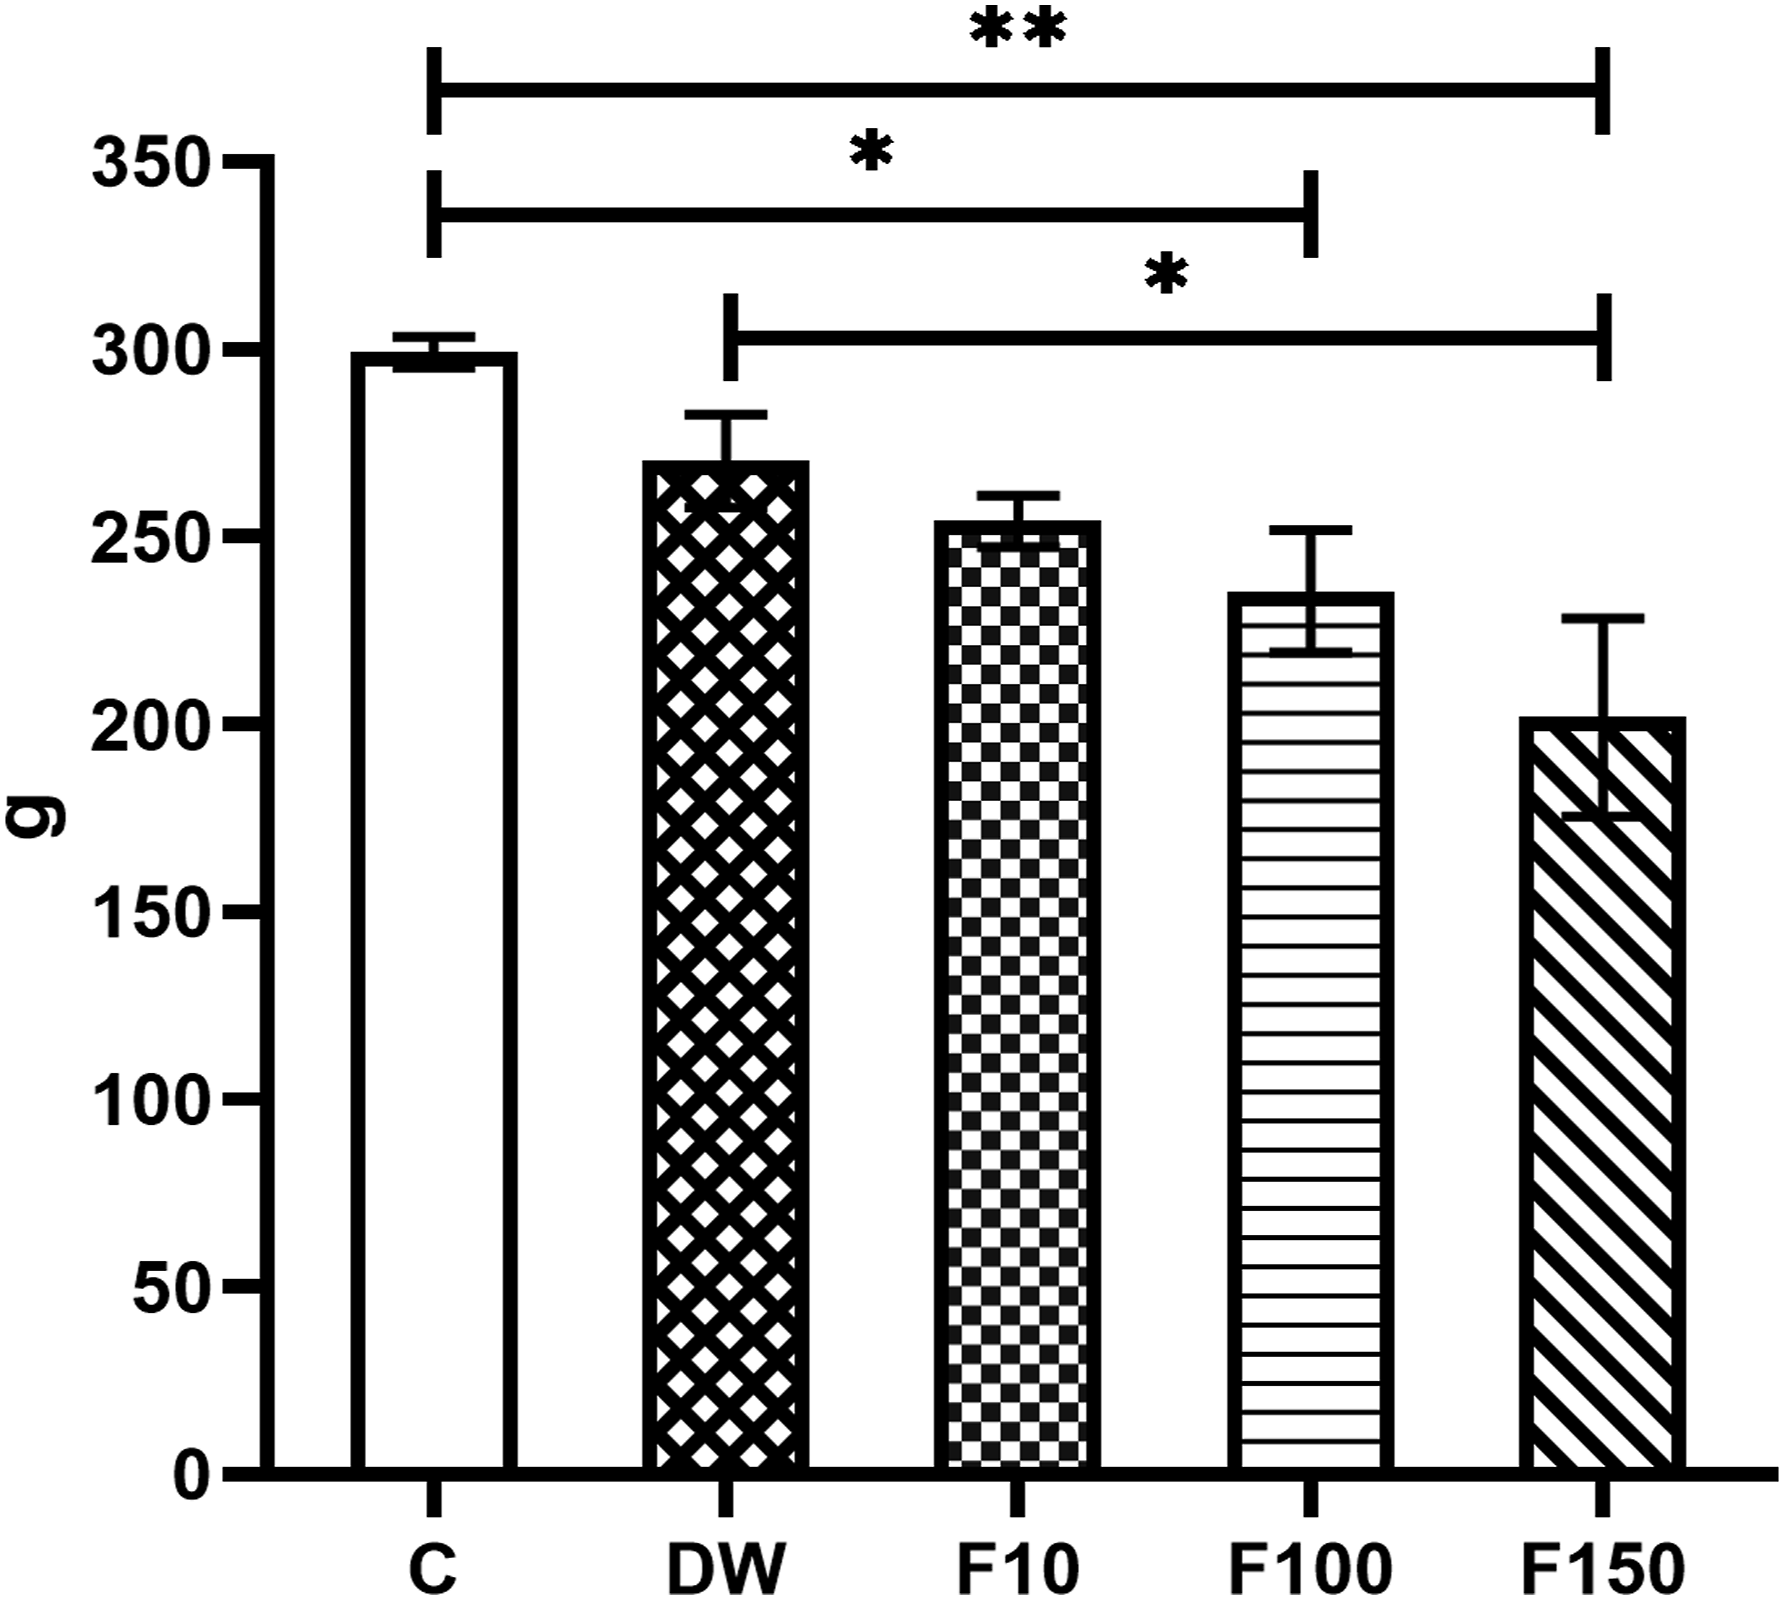
Determination of F- Levels in Plasma
In the F100 and F150 groups, a significant increase was registered in the concentration of fluoride in the plasma of the subjects compared to the C (P < 0.0001; P < 0.0001) and DW groups (P = 0.0002; P < 0.0001) Similarly, the F100 group showed a significantly higher concentration of F- in plasma compared to the F10 group (P = 0.0013), while the F150 group presented significantly higher plasma F- levels compared to the F10 and F100 groups (P < 0.0001) (Figure 2). A positive correlation (r = 0.92, P < 0.001) was found between the concentration of fluoride in the drinking water and its concentration in plasma. Results of the concentration of F- in plasma. Data represent the M ± SEM of six animals per group. ANOVA F = 3.089. The upper lines indicate the groups in which statistically significant differences were identified. *P < 0.05, **P < 0.01, ***P < 0.001.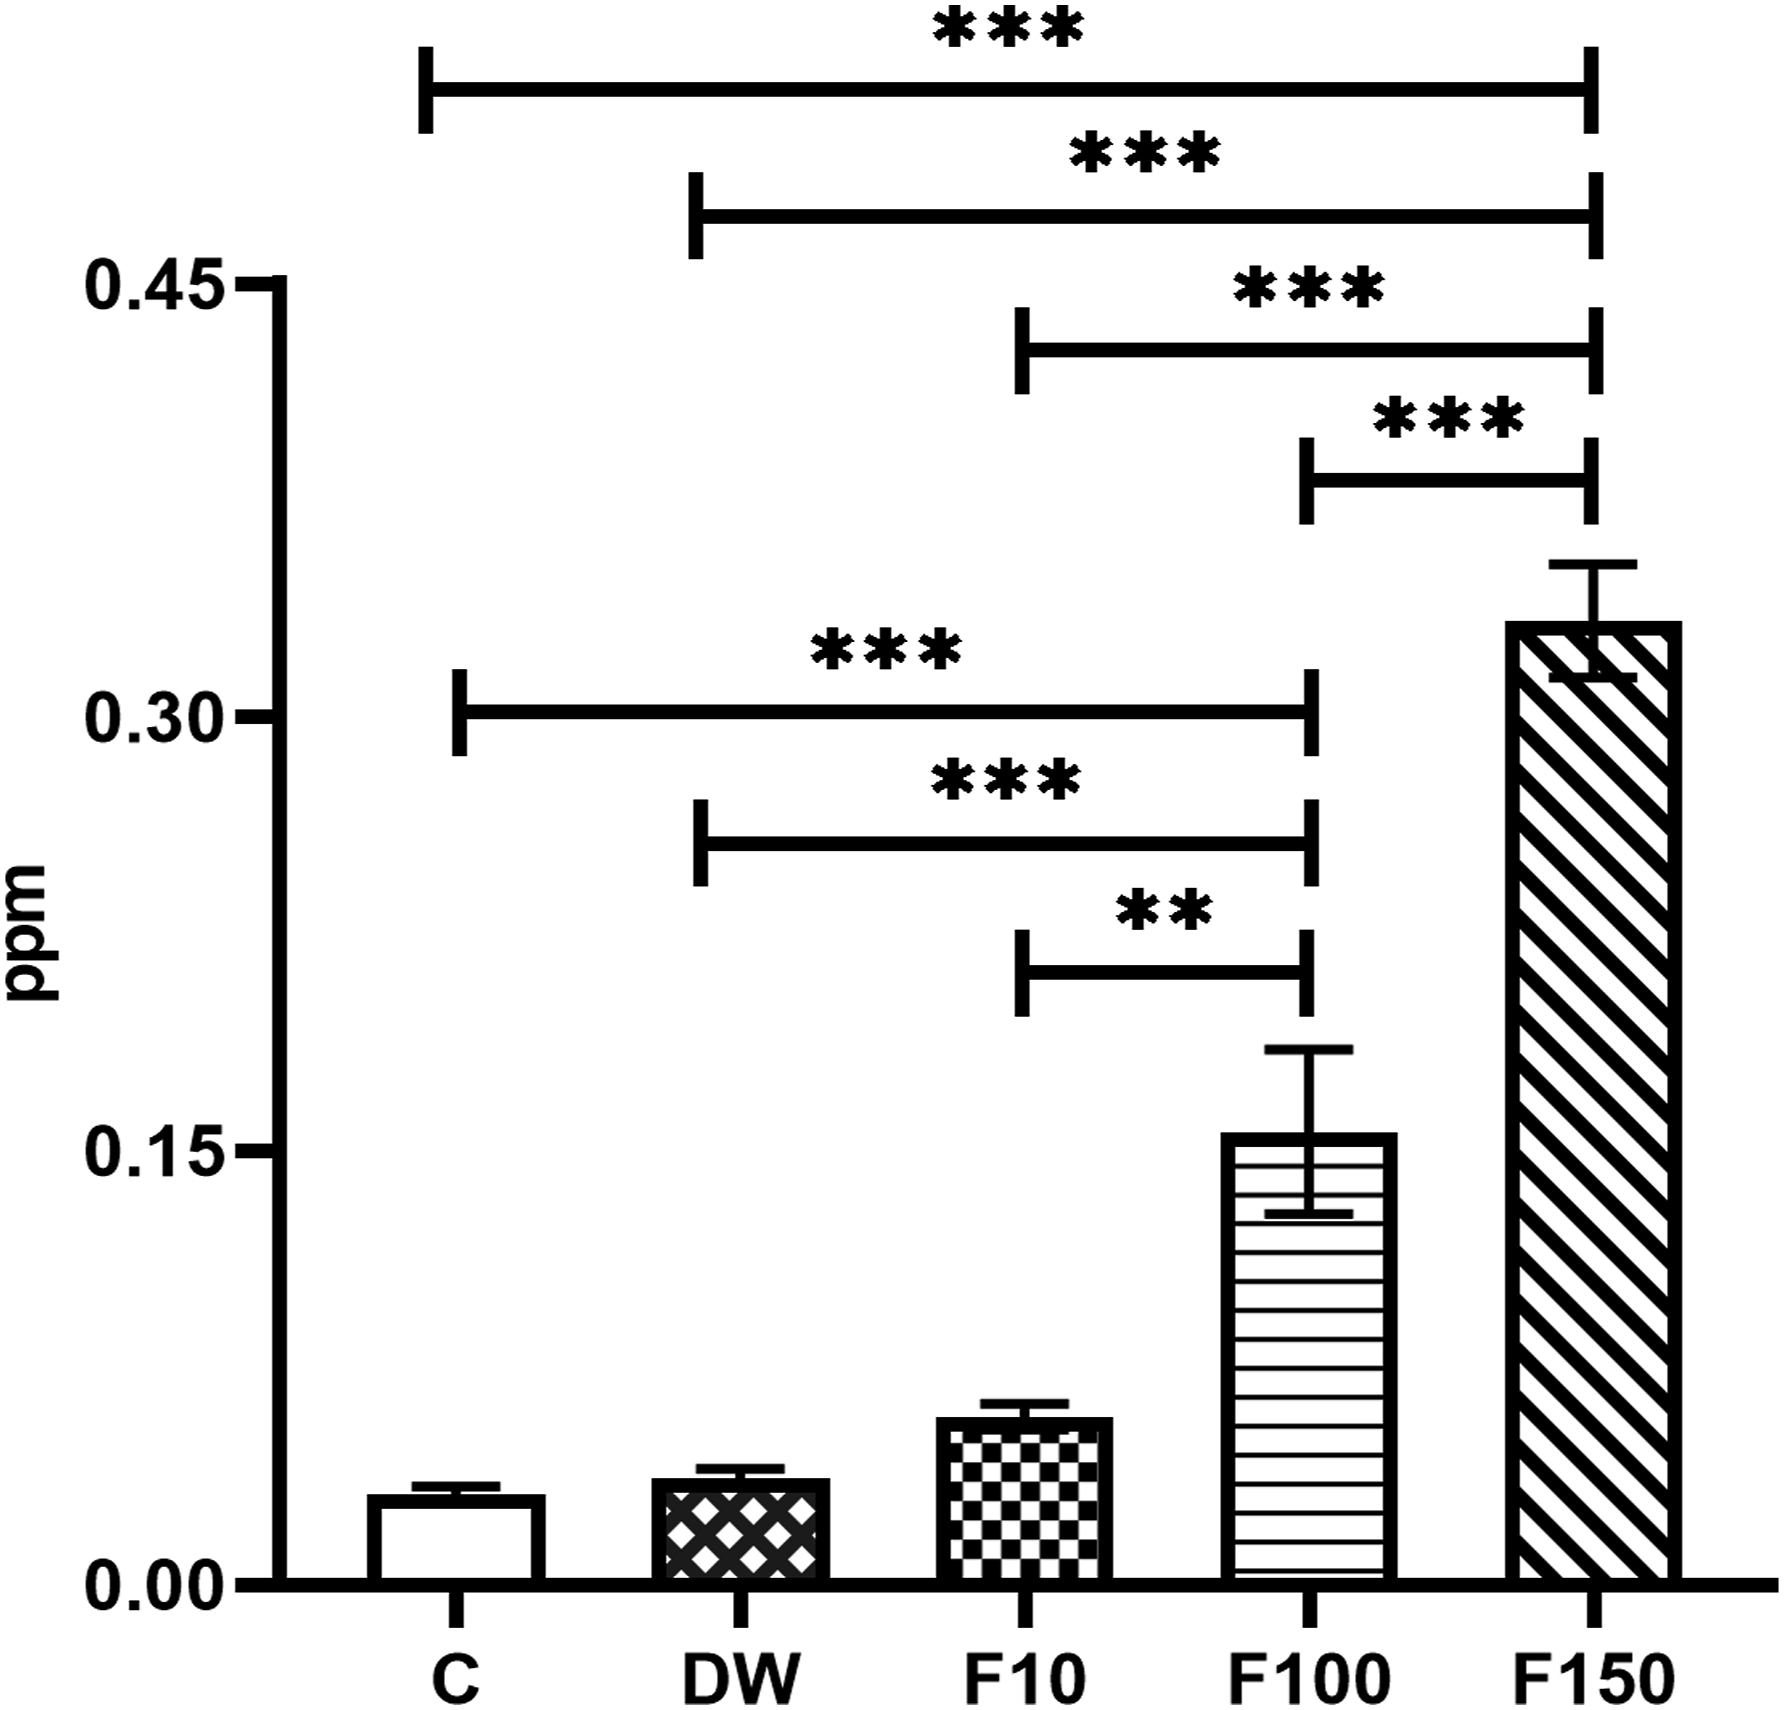
Nerve Conduction Velocity in the Sciatic Nerve
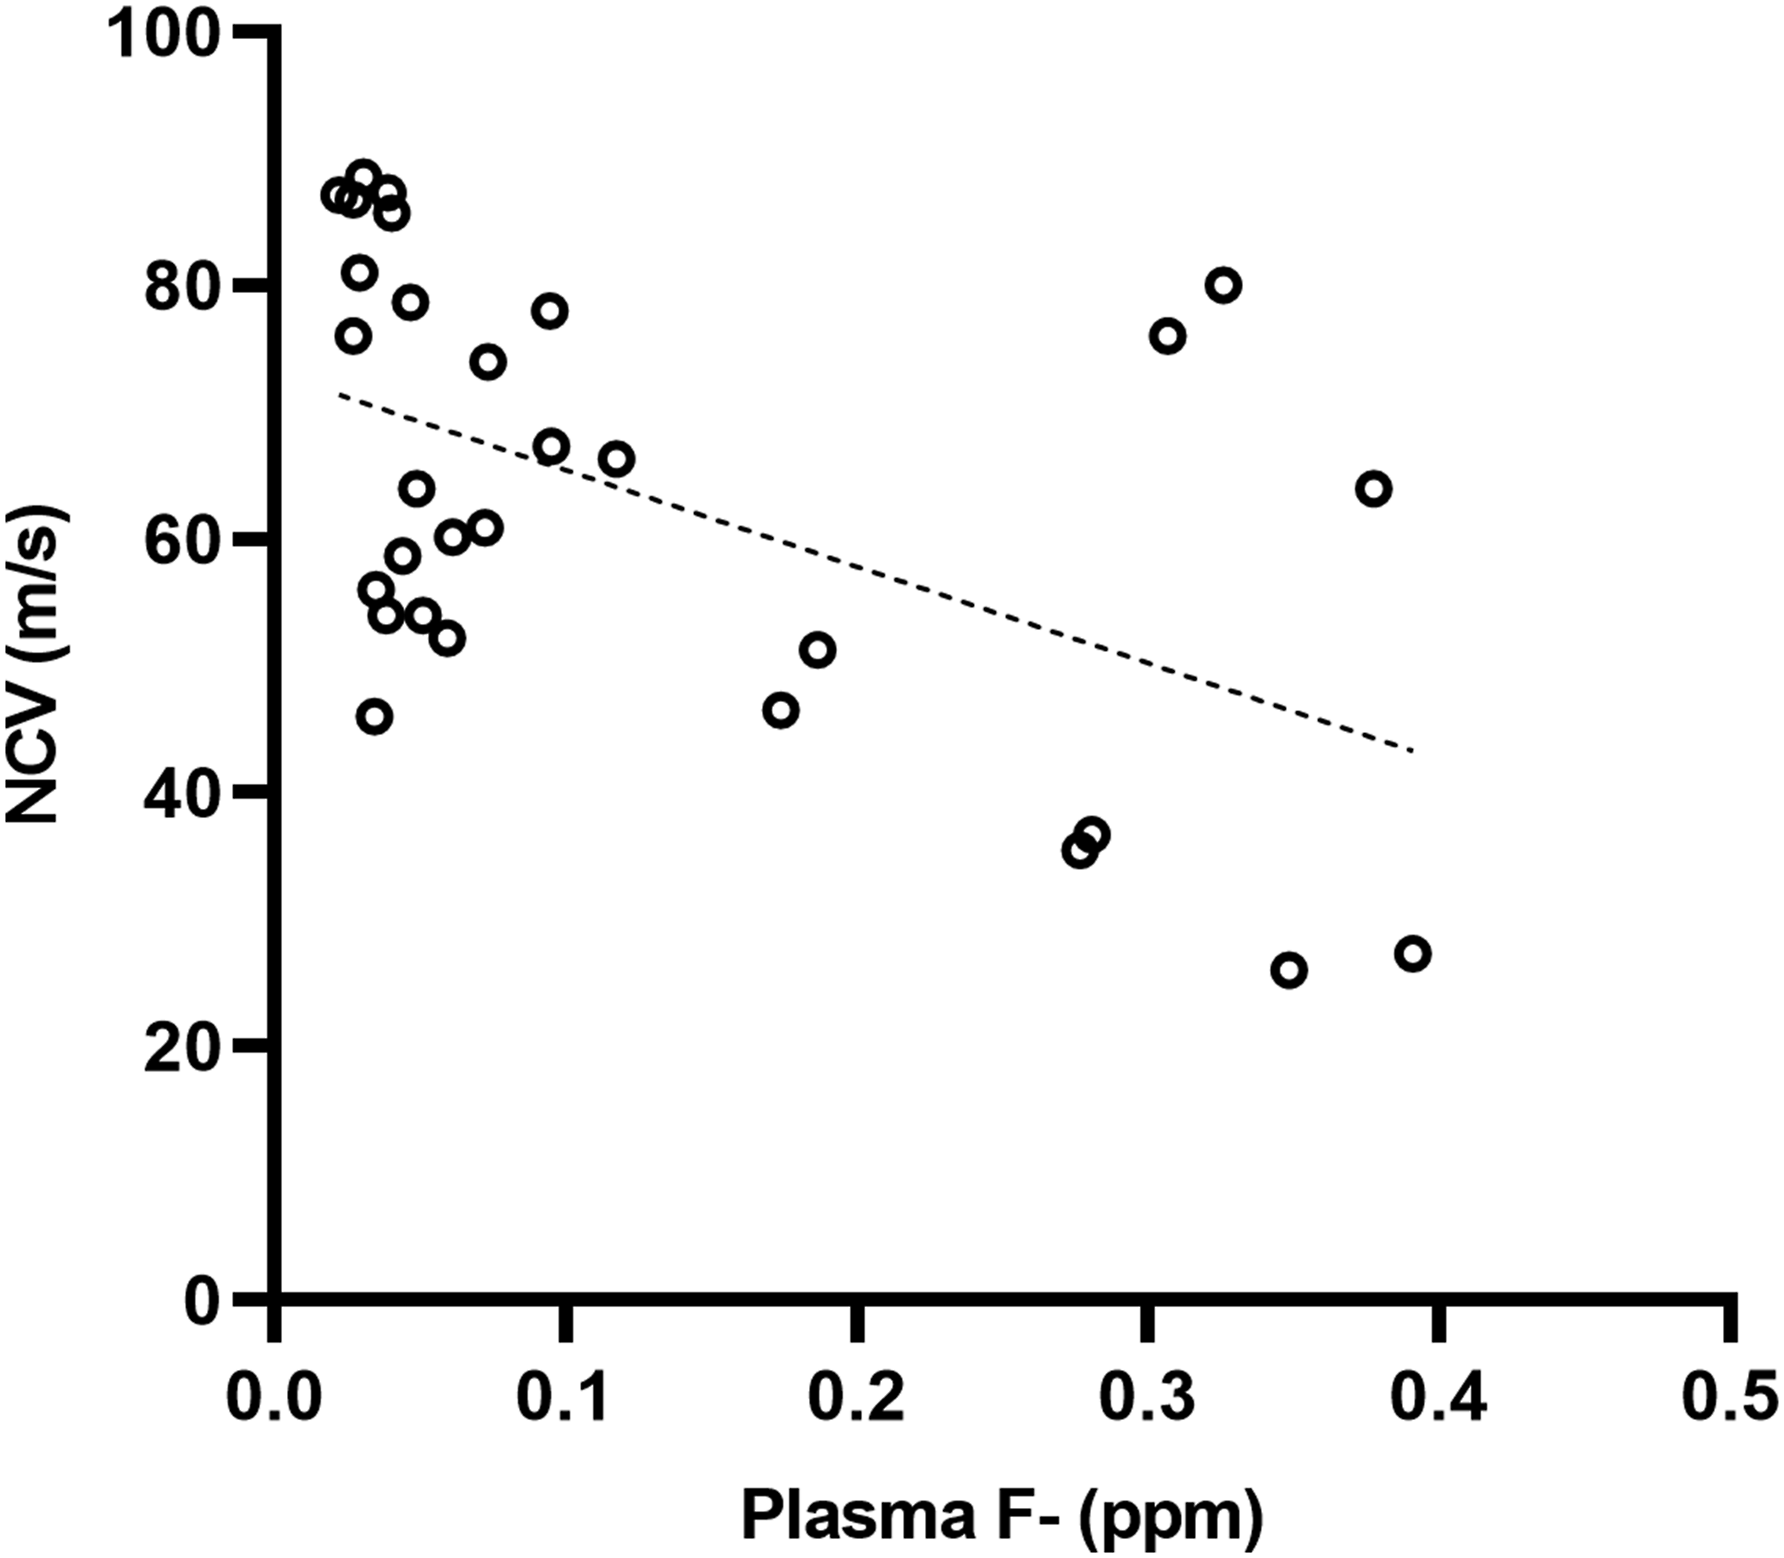
Group F150 exhibited a significantly lower NCV in comparison to group C (P = 0.0015) as shown in Figure 3. Additionally, there was a negative correlation (r = −0.5132, P = 0.0037) with the concentration of F- in plasma, as illustrated in Figure 4. Results of the NCV of the sciatic nerve. Data represent the M ± SEM of six animals per group. ANOVA F = 5.057, P = 0.0038. The upper lines indicate the groups in which statistically significant differences were identified. **P < 0.01 compared to C. Correlation between the concentration of F- in plasma and the NCV of the sciatic nerve of the subjects.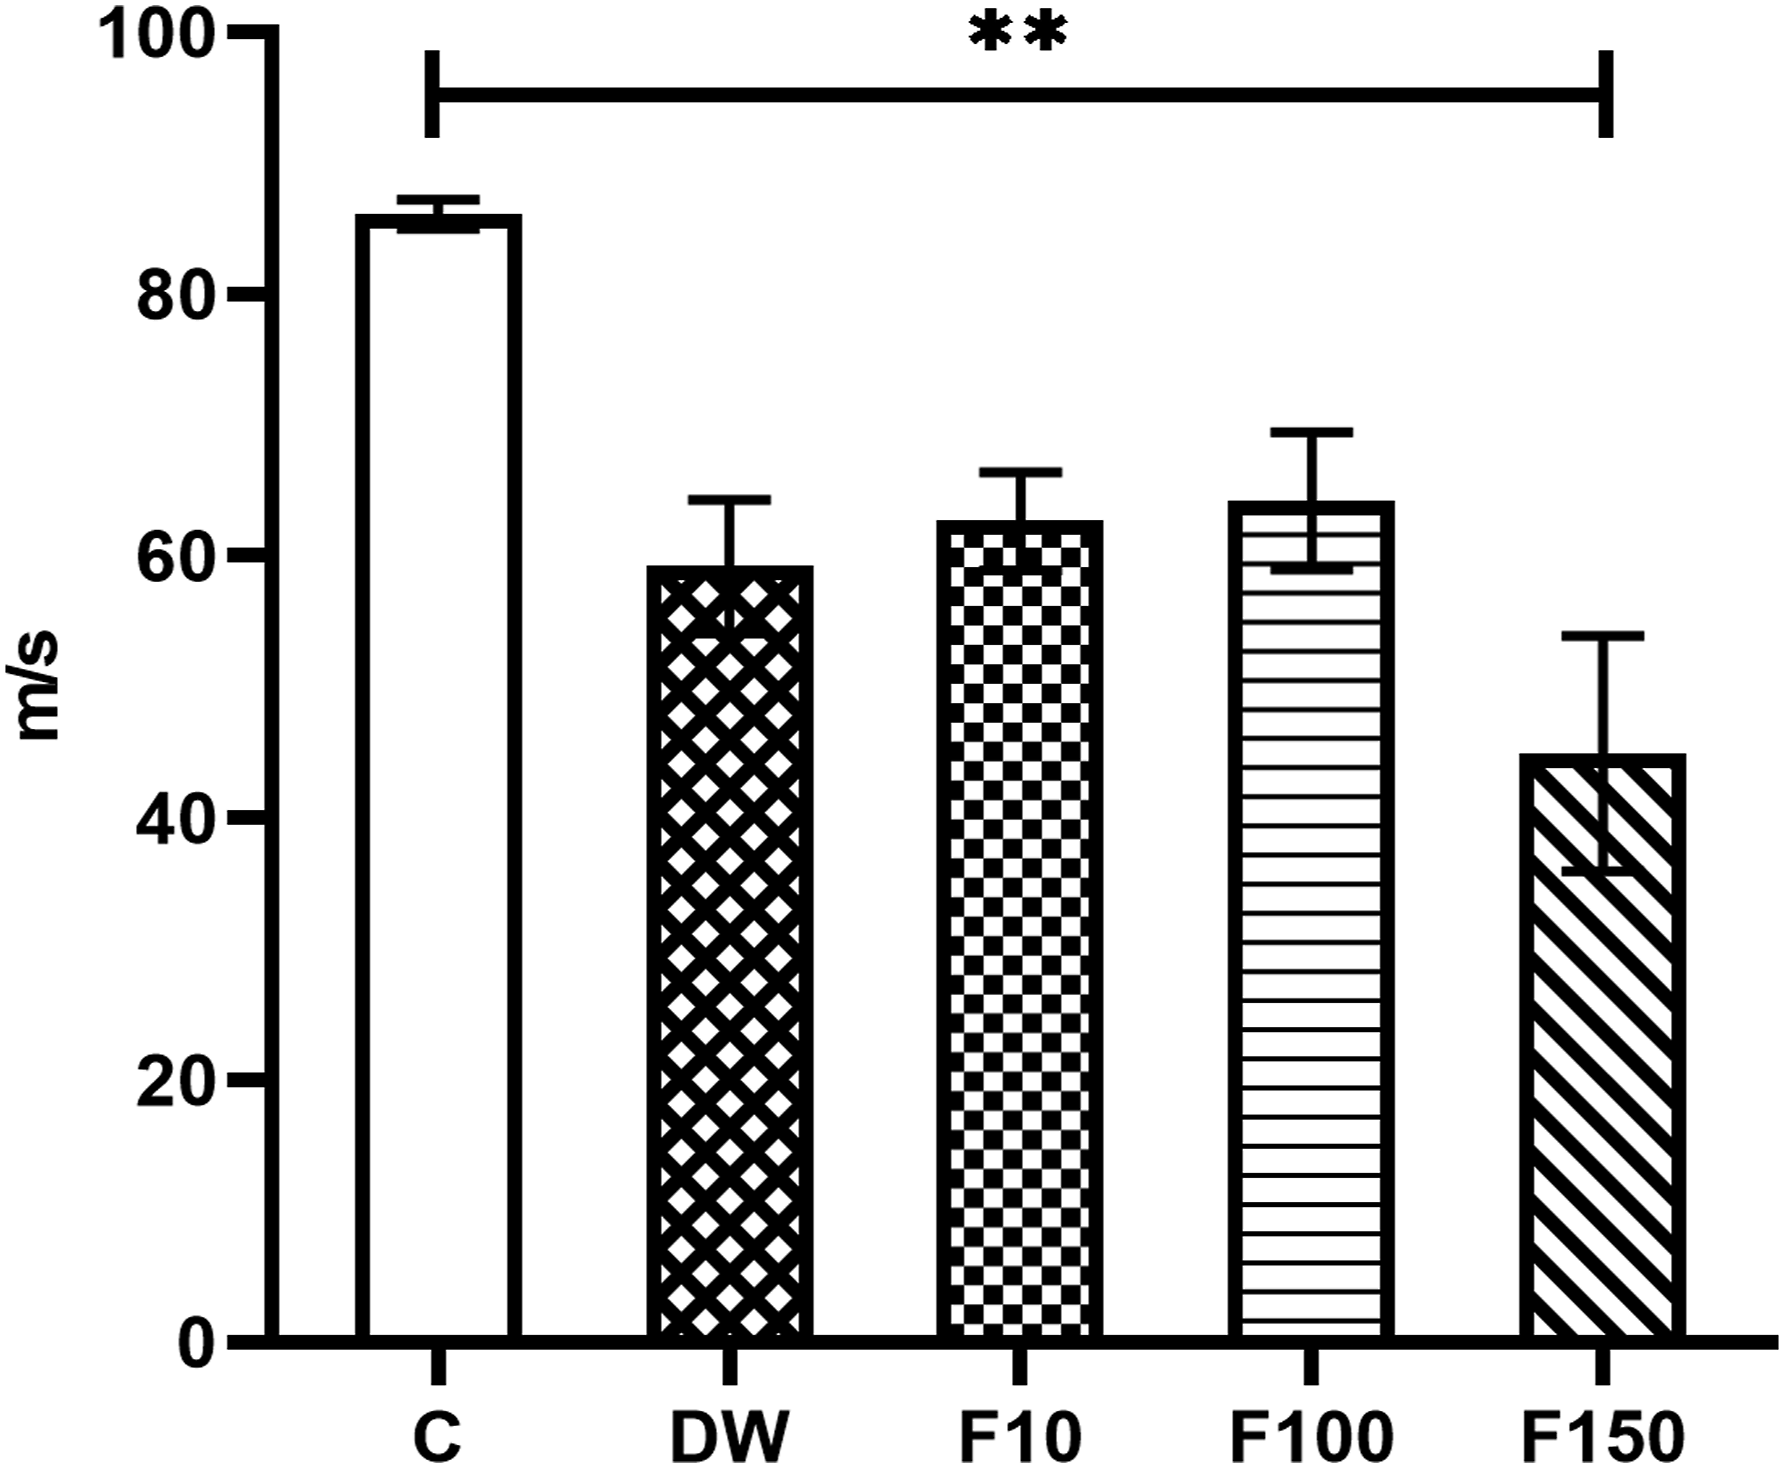
Discussion
In this study, we observed an increase in plasma F- concentration in exposed rats, which was directly related to the concentration of F- administered in the drinking water (0.06 ± 0.01 ppm, 0.16 ± 0.07 ppm, and 0.33 ± 0.01 ppm, for 10, 100, and 150 ppm, respectively). This finding is consistent with previous studies that evaluated the plasma F- concentration in rats exposed to different concentrations for at least 6 weeks.37–39
In studies conducted in the resident population of endemic fluorosis areas of China with drinking water fluoride levels of 1.1–2.0 ppm, 2.15–2.96 ppm, and 3.10–5.69 ppm, the recorded plasma fluoride concentrations were 0.19 ± 0.06 ppm, 0.22 ± 0.04 ppm, and 0.25 ± 0.04 ppm, respectively. 32 In a separate study conducted in Pakistan, where the fluoride concentration in water is 9.76 ppm, the mean plasma fluoride concentration of the inhabitants was found to be 0.61 ppm. 31 This evidence corroborates the observation that rodents require significantly elevated fluoride levels compared to humans to reach comparable fluoride accumulation in plasma.19,30 Conversely, it suggests that plasma fluoride levels are directly correlated with the level of fluoride exposure in humans and rats alike.
The pharmacokinetics of F- in the body has been extensively studied. It is well known that the highest percentage of ingested F- is absorbed through the gastrointestinal tract and deposited in calcified tissues. Only a minimal proportion of consumed F- can be detected in plasma, and this is directly connected to the concentration of F- ingested, both in humans and rats. F- is widely distributed in the body, including the nervous system. 40
According to Lihong et al., 8 the toxic dose of F- in humans is 5 mg/kg/day. The F- doses used in this experiment for F10, F100, and F150 are equivalent to 0.38, 3.14, and 4.61 mg/kg/day in humans, respectively, as described by Nair and Jacob. 41 On the other hand, a control group was included, which received deionized water as drinking water. This is a common practice in studies evaluating the toxic effects of F-.14,42–44 In this study, it was observed that the animals that consumed deionized water exhibited a lower NCV compared to the control group. However, this finding was not statistically significant. Similarly, the WHO Guidelines for drinking-water quality 45 state that there is insufficient evidence to demonstrate the long-term harmful or beneficial effects of consuming water with low mineral content. Therefore, they do not recommend it. It has been suggested that the consumption of such water may have adverse health effects, but further studies are needed to confirm this. In this study, all groups consumed deionized water as it was used as a vehicle for F-. Therefore, the differences found in the analyzed parameters correspond to the different doses of F- ingested by the rats.
The methodology utilized in this study to stimulate and record the response directly at the nerve level enabled the attainment of higher conduction velocity values than those typically achieved when percutaneous nerve stimulation is employed, with the recorded response occurring in the muscle, a common practice in studies of NCV.46–48 This indicates that a better recording is obtained by performing the measurement directly on the nerve rather than on the muscular response. This eliminates any delay that could occur in the transmission of the stimulus at the neuromuscular junction. In addition, up to the time this study was carried out, there were no reported studies that evaluate the effect of F- chronic consumption on NCV at the central or peripheral level, so these findings are new in the area and contribute to the knowledge of the functional phenomena associated with the organism’s response to the presence of F-.
The NCV results in the different study groups were generally similar to the normal values reported in the literature, 49 except for the F150 group. Studies have reported a significant decrease in NCV in models of diabetes 47 and in patients with demyelinating pathologies such as multiple sclerosis50,51 and Guillain-Barré syndrome. 52 Therefore, the decrease in NCV may be related to alterations in the myelin sheath.
Chronic consumption of F- has been reported to have adverse effects on myelin, both centrally and peripherally. A study conducted on mice revealed that exposure to 50 and 100 mg/L NaF for 60 days resulted in a reduction of proteolipid protein (PLP) expression in the hippocampus. Additionally, the 100 mg/L NaF dose led to an increase in myelin-associated glycoprotein (MAG), contributing to the demyelination of nerve fibers. 20 Additionally, other authors have reported that F- causes degenerative changes to the myelin sheath of the spinal cord in rats following the administration of NaF (at a dose of 12 mg/kg/day) over a 4-week period. 53 Similar effects have also been observed in the sciatic nerve after the consumption of 20 ppm NaF over a period of 60 days. 54
Based on the results of this study, further studies are required to establish the mechanism by which F- causes a decrease in nerve conduction velocity in the sciatic nerve and whether this also occurs in the central nervous system. This study broadens the understanding of F- neurotoxicity and may help explain the deficits observed in the performance of behavioral tests in other studies analyzing the adverse effects of F- on the nervous system.
Conclusion
Chronic consumption of water with high concentrations of F- caused a significant decrease in nerve impulse conduction velocity in the sciatic nerve of rats exposed from the early stages of development and is correlated with plasma fluoride concentration.
Footnotes
Acknowledgments
The authors acknowledge the Centro de Investigación Biomédica de Michoacán, Instituto Mexicano del Seguro Social, the Centro Universitario de los Lagos of the Universidad de Guadalajara for the facilities and support received to accomplish this project, and the Consejo Nacional de Humanidades, Ciencias y Tecnologías (CONAHCYT) for the scholarship granted with support number 14364.
Author Contributions
F.M.E.S. contributed to conception and design, contributed to acquisition, analysis, and interpretation, and drafted the manuscript. M.A.L.V. and M.E.O.C. contributed to design and acquisition and critically revised the manuscript. L.V.J. contributed to conception and design, analysis and interpretation. P.T.V.G. contributed to acquisition. M.I.P.V. contributed to conception and design, contributed to acquisition, analysis and interpretation, and critically revised the manuscript. All authors gave final approval and agree to be accountable for all aspects of work ensuring integrity and accuracy.
Declaration of Conflicting Interests
The author(s) declared no potential conflicts of interest with respect to the research, authorship, and/or publication of this article.
Funding
The author(s) received no financial support for the research, authorship, and/or publication of this article.
Ethical Statement
ORCID iDs
Data Availability Statement
The datasets generated during and/or analyzed during the current study are available from the corresponding author on reasonable request.