
Abstract
Sodium taurocholate cotransporting polypeptide (NTCP), which is highly expressed in the sinusoidal membrane of hepatocytes, maintains bile acid homeostasis and participates in the hepatic disposition of a variety of endogenous substances as well as xenobiotics. Manifested by the involvement of organic anion-transporting polypeptides 1B1 and 1B3 (OATP1B1 and OATP1B3) in the hepatic uptake of statin drugs, sinusoidal membrane transporters play an important role in the pharmacokinetics and pharmacodynamics of these agents. It has been speculated that NTCP may function as an alternative pathway for statin hepatic uptake, complementary to OATP1B1 and OATP1B3. In the current study, we produced stable NTCP-expressing human embryonic kidney 293 (HEK293) cells and developed a fluorescence-based assay using flow cytometry for measuring NTCP transport with chenodeoxycholyl-(Nε-7-nitrobenz-2-oxa-1,3-diazole)-lysine (CDCA-NBD) as the substrate. NTCP-mediated CDCA-NBD transport was time-dependent and exhibited typical Michaelis–Menten kinetics, with a K m of 6.12 µM. Compounds known to interact with NTCP, including chenodeoxycholic acid and taurocholic acid, displayed concentration-dependent inhibition of NTCP-mediated CDCA-NBD transport. We report here a systematic evaluation of the interaction between statins and the NTCP transporter. Utilizing this system, several statins were either found to inhibit NTCP-dependent transport or act as substrates. We find a good correlation between the reported lipophilicity of statins and their ability to inhibit NTCP. The objective was to develop a higher-throughput system to evaluate potential inhibitors such as the statins. The in vitro assays using CDCA-NBD as fluorescent substrate are convenient, rapid, and have utility in screening drug candidates for potential drug–NTCP interactions.
Introduction
There is an ever-increasing appreciation for the roles of transporters in the disposition of therapeutic agents, especially when multiple agents compete for a common transporter. Transporters of the solute carrier (SLC) superfamily, such as organic anion-transporting polypeptides (OATP) 1B1 (SLCO1B1) and OATP1B3 (SLCO1B3), have drawn a great deal of attention concerning their important role in transporting drugs used in the treatment of hyperlipidemia. Among the most widely used are the β-hydroxy β-methylglutaryl-CoA-reductase inhibitor drugs or statins. 1,2 For uptake into the liver from the plasma, which is the site of action and an important excretion route via bile, statins depend largely on transporter-mediated mechanisms, some of which are shared with endogenous compounds. Statins may cause some toxicity in the liver as the use of statins has been shown to inhibit the uptake of conjugated and unconjugated bilirubin into hepatocytes. 3,4 Drug toxicity can take many forms, including drug–drug interactions (DDIs) at the transporter level, and DDIs involving statins have been reported. 5 It is therefore important to fully understand the mechanisms by which these widely used agents enter the target organ.
The sodium taurocholate cotransporting polypeptide NTCP (SLC10A1) belongs to the solute carrier family 10 (SLC10), which is also referred to as sodium-dependent bile acid transporter family, consisting of 7 members (SLC10A1 to SLC10A7). Highly expressed on the sinusoidal (basolateral) membrane of hepatocytes, NTCP (SLC10A1) is one of the major bile acid transporters required for maintaining bile acid homeostasis under physiological and pathophysiological conditions. 6 NTCP physiologically accounts for most sodium-dependent bile acid transport from hepatic sinusoidal membrane into hepatocytes for secretion into the bile. 7 In the intestine, bile acids are efficiently reabsorbed into the blood circulation by the apical sodium-dependent bile acid transporter (ASBT; SLC10A2), which is highly expressed at the apical brush-border membrane of enterocytes. In addition to bile acids, NTCP also transports steroid hormones, drug-conjugated bile salts, and xenobiotics. The majority of well-characterized substrates of NTCP share a steroid scaffold, which is part of a structural requirement of 2 hydrophobes and a single hydrogen bond donor, 8 and there have been many drugs shown to interact with NTCP. 9 Although statins are nonsteroidal compounds, they do have some structural similarity with steroids and possess most of those structural features reported for NTCP substrates. Therefore, NTCP may serve as an alternative pathway for statins to enter the hepatocytes in addition to OATP-mediated uptake. Approximately one-third of rosuvastatin uptake was shown to occur via NTCP, 10 and pitavastatin in acid form was also shown to be actively taken up into NTCP-expressing oocytes of Xenopus laevis. 11 A study including several statins reported that NTCP interacted with rosuvastatin, pravastatin, pitavastatin, and atorvastatin, but not with fluvastatin or simvastatin in an NTCP overexpressing oocyte system. 12 Greupink et al 13 noted the inhibitory effects of statins on NTCP-mediated [3H]-taurocholic acid (TCA) uptake and rank-ordered the relative interaction potencies of the various statins from a chemical perspective. Furthermore, their investigation of fluvastatin and simvastatin uptake (the free carboxy acid form) by NTCP showed that fluvastatin but not simvastatin was transported into NTCP-CHO cells. To our knowledge, no report has performed a systemic screen in human cells and in particular addressed the potential interactions of lovastatin with NTCP. Therefore, it is still unclear if statins as a class are NTCP substrates or inhibitors. A better test system would not only facilitate our understanding of statin uptake by NTCP but also unveil potential NTCP-mediated DDIs which may so far have been underestimated.
In addition to transporting small molecules, NTCP has also been identified as a hepatitis B virus (HBV) entry receptor, 14 and it was estimated that there are ∼240 million chronic HBV carriers worldwide and ∼620 thousand HBV-associated deaths annually. 14,15 Current anti-HBV treatments are limited to interferon-based protein drugs and nucleos(t)ide analogs inhibiting viral reverse transcriptase; however, emergence of drug-resistant viruses highlights the urgent need of new anti-HBV agents targeting different phases of the viral life cycle. Identification of HBV entry receptor opens the door for novel anti-HBV strategies; in general, the viral entry process is an attractive target for the development of antiviral agents. For instance, inhibition of NTCP with cyclosporine A (CsA) and its analogs demonstrated effectiveness in preventing HBV infection in cultured hepatocytes. 16 In addition, a large-scale screen found 5 additional drugs that inhibited NTCP transport and also blocked HBV infection in vitro. 17
Given the roles of NTCP in maintenance of bile acid homeostasis, transport of important therapeutic agents such as statins, and cellular penetration by HBV, it is of great value to develop convenient assay systems for screening drug–NTCP interactions and surveying NTCP activity. While there are other systems available to test NTCP function, most are not based on stably transfected human cells nor have been well characterized. The current study involved the development of a rapid in vitro fluorescent assay using NTCP stably transfected into human embryonic kidney 293 cells (NTCP-HEK293) and flow cytometry for screening NTCP inhibition and possible DDIs involving agents such as statins.
Materials and Methods
Chemicals
[3H]-Taurocholic acid was purchased from American Radiolabeled Chemicals. Chenodeoxycholyl-(Nε-7-nitrobenz-2-oxa-1,3-diazole)-lysine (CDCA-NBD-L) was obtained from PharmAgra Labs. Cholyl-
Cell Culture and Microscopy
The HEK293 cells were stably transfected with expression plasmid containing full-length NTCP cDNA (NTCP-HEK293 cells) or empty vector (mock-transfected cells) as described previously.
18
The NTCP-HEK293 and mock-transfected cells were cultured in DMEM supplemented with 10% FBS and 1%
Quantitative Real-Time PCR
Quantitative real-time polymerase chain reaction (qPCR) was performed using the LightCycler 480 system (Roche Diagnostics). Total RNA was isolated from mature cells using RNeasy Mini Kit (Qiagen) according to the manufacturer protocol. Synthesis of complementary DNA (cDNA) was carried out from 1 µg of total RNA using QuantiTect RT kit (Qiagen) for reverse transcription-polymerase chain reaction (PCR) with random hexamer primers according to the manufacturer protocol. The NTCP primers and probe were designed using the Universal Probe Library (Roche). The qPCR analysis was performed in 20 µL of reaction mixture containing 10 ng cDNA, LightCycler 480 probes master kit with 0.1 μM probe, and 0.5 μM primers. The PCR reaction was run at 95 °C for 10 minutes, followed by 45 amplification cycles of 95 °C for 10 seconds, 60 °C for 15 seconds, and 72 °C for 1 second. Amplification curves were analyzed using LightCycler 480 Basic Software (version 1.2) which produced threshold cycle time (CT) values at which fluorescence is higher than a defined threshold level. Relative gene expression levels of the target genes were normalized to the expression level of the housekeeping gene β-actin using the formula:

Immunoblotting
The HEK cells were lysed with Pierce RIPA buffer (ThermoFisher Scientific) following the manufacturer protocol. Lysate was cleared via 500 × g centrifugation for 10 minutes at 4 °C. Membrane fractions were isolated from cleared lysate by 12,000 × g centrifugation for 60 minutes at 4 °C. Membranes were resuspended in phosphate-buffered saline (PBS), pH 7.4, and protein concentrations were quantified by Bradford assay (Bio-Rad) supplemented with 0.1% sodium dodecyl sulfate (SDS) to solubilize membranes. Membrane fractions (30 µg protein per lane) were separated by SDS-polyacrylamide gel electrophoresis (4%-20%) and then transferred to Immobilon polyvinylidene difluoride membranes (Bio-Rad). FLAG-tagged NTCP was detected with a rabbit anti-FLAG antibody diluted at 1:2,000, and detection was performed using Peroxidase-conjugated Goat Anti-Rabbit (AbCam) diluted 1: 5,000. Detection was by chemiluminescence with Super Signal West Pico substrate (Pierce).
Immunophenotyping
Control and butyrate-treated cells were harvested in trypsin, washed, and counted. Cells were resuspended in DMEM + 3% bovine serum albumin to 4 million cells/mL and aliquoted into 2 samples. One sample received primary antibody (rabbit anti-FLAG) for 1 hour followed by secondary antibody (antirabbit-fluorescein isothiocyanate conjugate, Sigma Aldrich) for 1 hour. The second sample only received secondary antibody for 1 hour. Cells were diluted in 1 mL cold PBS and centrifuged after primary and secondary antibody incubations. Cells were resuspended in 250 µL of filtered PBS for analysis on Accuri C6 collecting 20,000 events at a slow flow rate. Data were corrected for background signal from the secondary antibody.
[3H]TCA Uptake Assays
Uptake assay buffer was HBSS supplemented with 10 mM HEPES and 15 mM
Fluorescent Compound Uptake Assays and Sample Analyses by Flow Cytometry
All dosing solutions were made in HBSSg, pH 7.4. Cells were washed with Ca2+/Mg2+-free DPBS containing 0.25 mM EDTA and dissociated with trypsin. Cells were resuspended to 1 × 10 7 cells/mL in HBSSg at pH 7.4. Cells were warmed to 37 °C and added to an equal volume of prewarmed fluorescent compound dosing solution and incubated for the indicated period of time with shaking. Cells were quickly diluted into cold PBS and immediately analyzed on an Accuri C6 cytometer (BD Bioscience); 8 to 10 thousand events were recorded in channel 1 and the mean cellular fluorescence was reported. For the determination of transporter-specific uptake, the contribution by vector-control cells was subtracted from the total uptake in NTCP-HEK293. For fluorescent compound screening assay, cell suspension was incubated with 7-nitrobenz-2-oxa-1,3-diazole (NBD)-labeled chenodeoxycholate (CDCA-NBD; 0.25 μM), CLF (0.5 μM), or FMTX (0.5 μM) for 10 minutes. For the time-dependent CDCA-NBD uptake assay, the cell suspension was incubated with a solution containing 0.25 μM CDCA-NBD for a specified time period (2-60 minutes). For concentration-dependent CDCA-NBD uptake assay, the cell suspension was incubated with CDCA-NBD at concentrations ranging from 0.1 to 20 µM for 2 minutes. For CDCA-NBD inhibition studies, cells were first preincubated with test compounds for 10 minutes; subsequently, cells were incubated with 0.25 μM CDCA-NBD in the presence of test compounds for an additional 10 minutes.
Statin Uptake Assays and Sample Analyses by LC-MS/MS
Medium was gently aspirated off without disturbing the cells. The dosing solution containing 5 μM statins was prepared in HBSSg, pH 7.4. Dosing solution was added to the cells and they were incubated for 2, 5, 10, or 20 minutes at 37 °C in an atmosphere containing humidified 95:5 air/CO2. Uptake was terminated by 2 washes with ice-cold HBSSg and cells were lysed with ice-cold ACN on ice. Cell lysate was analyzed by Liquid Chromatography-Mass Spectrometry (LC-MS). In all cases, each determination was performed in triplicate. For protein analysis, cells were lysed with RIPA buffer and protein concentrations were determined by BCA protein assay following the manufacturer protocol.
Samples were diluted with ACN: HBSS pH7.4 (50:50 vol/vol) as follows: receiver samples were diluted 4-fold; donor samples were diluted 20-fold. The high-performance liquid chromatography equipment consisted of a Perkin-Elmer series 200 autosampler and a Perkin-Elmer series 200 micro pumps. Chromatography was performed at ambient temperature using a 50 mm × 2.0 mm id 4 µm Phenomenex Synergi Polar-RP analytical column. The mobile phases consisted of 0.2% formic acid (aqueous phase) and 90:10 ACN: H2O (organic phase). Typical gradients started at 10% aqueous phase, changed linearly to 95% organic phase over 3.0 minutes, held at 95% organic phase for 1.0 minutes, then returned back to 10% aqueous phase in 0.2 minutes, and re-equilibrated at 10% aqueous phase for 0.8 minutes. The flow rate was 300 µL/min and the injection volume was 5 µL. Mass spectrometry analyses were performed on a Sciex API 4000 triple quadruple mass spectrometer equipped with a TurboIonSpray interface in the positive ESI mode (Applied Biosystems MDS). The multiple reaction monitoring transitions and instrument settings were optimized for each compound. Equipment operation, data acquisition, and data integration were performed using Analyst version 1.4.2 software (Applied Biosystems).
Uptake was calculated using the following equations:


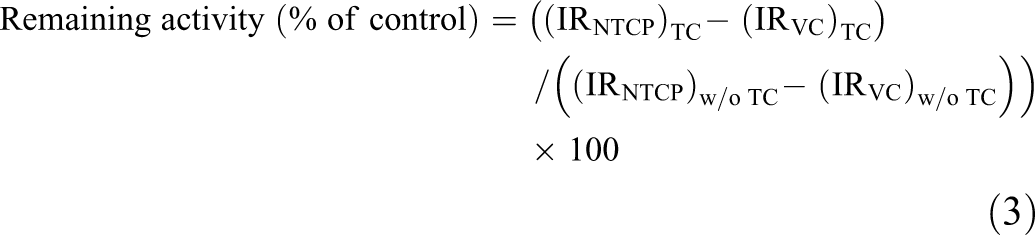
Where Q s is the amount of substrate in the cell, P s is the amount of protein, TC is the abbreviation of test compound, and VC is the abbreviation of the vector control cell.
Data Analyses
The NTCP-mediated net uptake was obtained by subtracting uptake in mock-transfected cells from that in NTCP-HEK293 cells. Michaelis–Menten nonlinear curve fitting was carried out to obtain the estimated Michaelis constant K m using GraphPad Prism software (GraphPad Software Inc). For inhibition studies, the percentage of uptake inhibition was calculated from control experiments in the absence of test compounds (100% of control). The half maximal inhibitory concentration (IC50) values for inhibition of NTCP-mediated CDCA-NBD uptake were calculated by fitting the data to a sigmoid dose–response regression curve using GraphPad Prism software. All data unless otherwise indicated are presented as means ± standard deviation (SD) of triplicate measurements.
Z’ Factors 19 were calculated by:

Where the means and SD of signals from the NTCP-expressing cells (max) are compared to that of mock-transfected (min) cells.
Results
Expression and Activity of NTCP in NTCP-HEK293 Cells
Many transporter assay systems are based on cells or cell products that overexpress the transporter of interest in a background devoid of competing transport routes. In contrast to most other NTCP-expression systems, we have transfected a human-derived cell line with high level expression to obtain stable cells suitable for high-throughput uptake assays of NTCP substrates or inhibitors. Expression of NTCP messenger RNA (mRNA) in NTCP-HEK293 and mock-transfected cells was first evaluated by qPCR analysis. The target gene expression was normalized to the housekeeping gene β-actin using the 2−ΔΔCT method. Relative mRNA expression of NTCP in NTCP-HEK293 cells was found to be 146-fold higher than that of human hepatocytes (Figure 1A). Endogenous NTCP mRNA expression in the mock-transfected cells was not detectable. We found that the presence of a FLAG-tag on NTCP could be used to track protein levels by either flow cytometry (Figure 1B) or by immunoblotting (Figure 2H). The availability of the epitope tag on the surface of cells supports most topological models of NTCP; we also found the site of the tag to be trypsin sensitive, which confirms its extracellular orientation (Figure 1B).
The NTCP functional activity in NTCP-HEK293 cells was then examined using [3H]TCA, a well-characterized substrate of NTCP. As shown in Figure 1C, [3H]TCA uptake in NTCP-HEK293 cells was 21-fold higher than that in the mock-transfected cells.
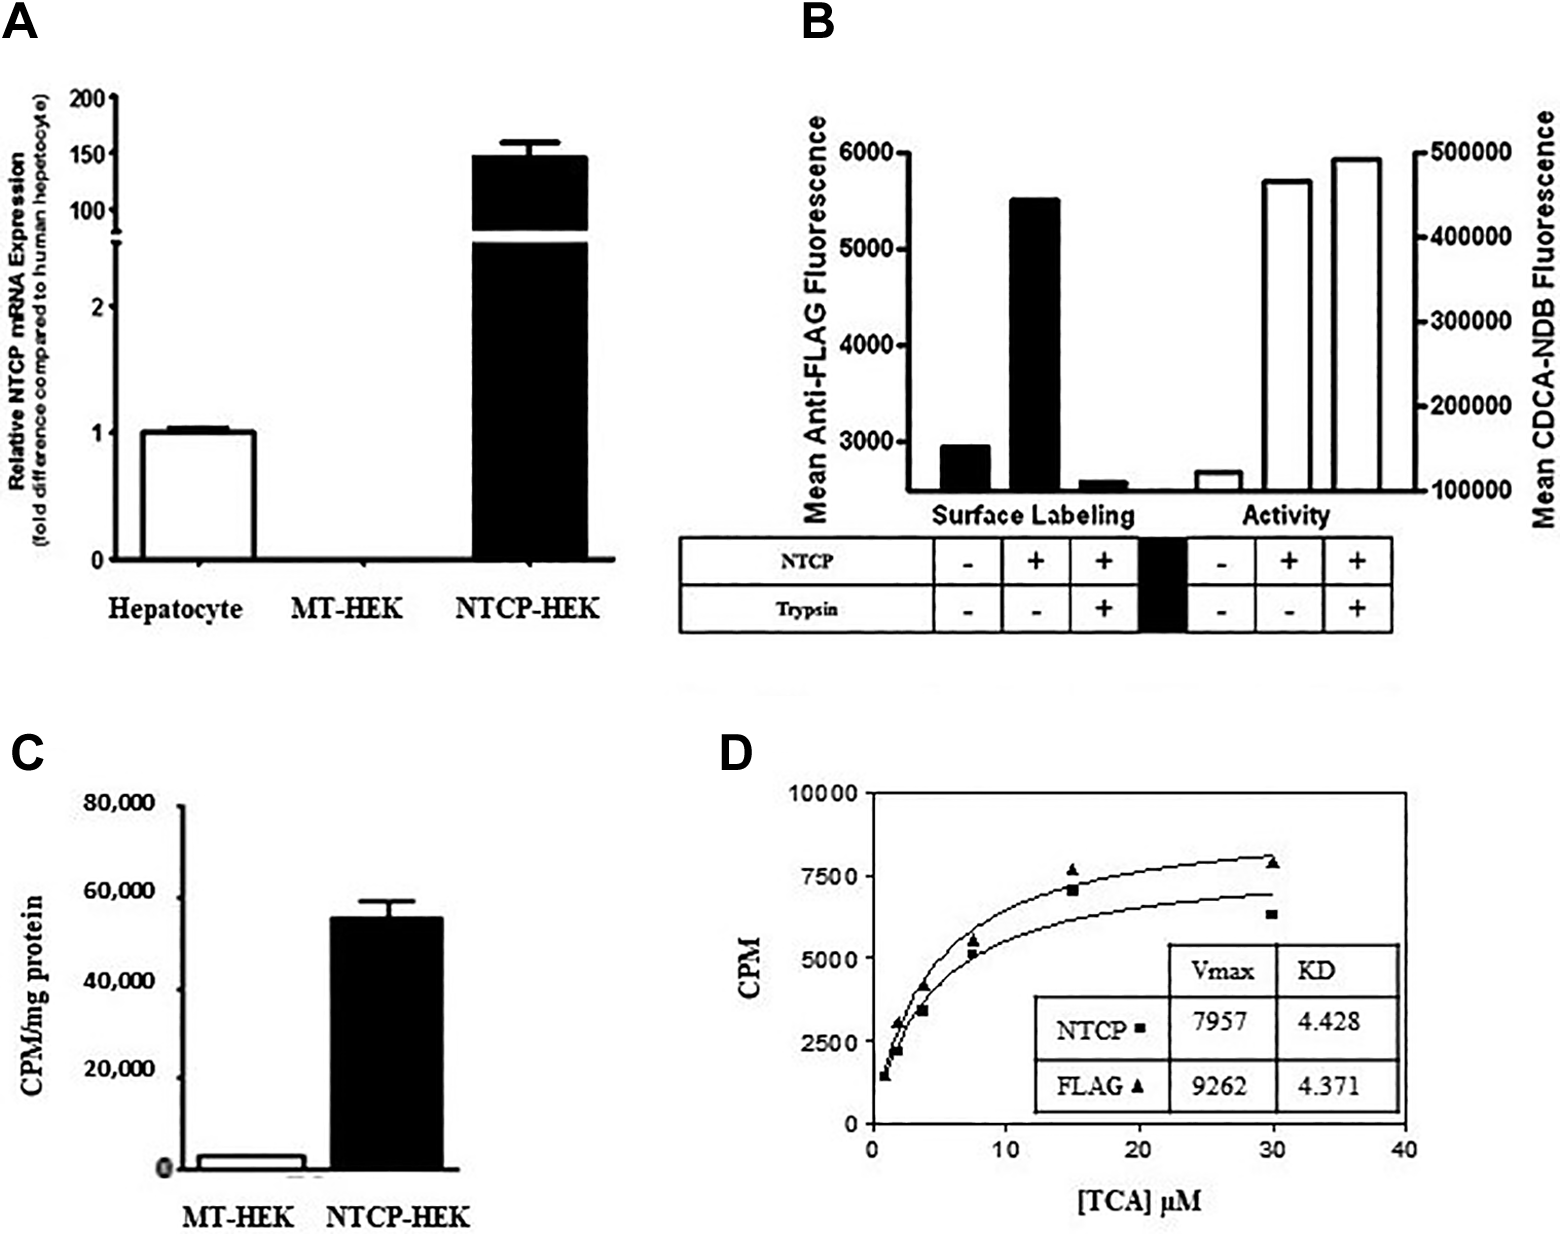
Characteristics of NTCP-HEK293 cells. A, Expression of human NTCP in NTCP-HEK293 and the mock-transfected cells by qPCR. 2−ΔΔCt is the difference between tested samples and hepatocyte, which is defined as 1.00. B, Detection of NTCP-FLAG on surface of HEK cells and uptake of CDCA-NBD by flow cytometry. Cells were treated with buffer or trypsin and then probed for NTCP-FLAG expression by indirect immunofluorescence or for transporter activity by fluorescent CDCA-NBD uptake. C, Uptake of [3H]-TCA (10 µM) by NTCP-HEK. Each point represents the mean ± SD; n = 3. D, Kinetics of [3H]-TCA uptake by NTCP-HEK or NTCP-FLAG-HEK. Uptake corrected for nonspecific association with mock-transfected cells. CDCA-NBD indicates 7-nitrobenz-2-oxa-1,3-diazole-labeled chenodeoxycholate; HEK293, human embryonic kidney 293; NTCP, sodium taurocholate cotransporting polypeptide; qPCR, quantitative real-time polymerase chain reaction; SD, standard deviation; TCA, [3H]-taurocholic acid.
The kinetics of either native or FLAG-tagged NTCP revealed a transport K m of approximately 4.4 µM (Figure 1D), which is on the lower end of reported values, which range from 5 to 84 µM for human NTCP. 20 V max is approximately 400 pmol/min/mg protein for the 2 samples. Collectively, these results confirm high level functional expression of human NTCP in HEK293 cells.
NTCP-Mediated CDCA-NBD Transport
The use of fluorescent substrates for transporters has many advantages, and their utility has been well-documented. While fluorescent probe substrates have been reported for NTCP, they do not compare well with the prototypical substrate TCA (gam, others). To evaluate other potential fluorescent substrates for NTCP, uptake assays were conducted on 3 commercially available fluorescent compounds which are known to be substrates of related bile acid transporters. Cholyl lysyl-fluorescein is a possible substrate of bile salt export pump, 21 OATPs 7, and even NTCP. 6 Fluorescein methotrexate has been reported as a substrate of several OATPs, 21 and uptake of CDCA-NBD by OATP1B1 and OATP1B3 has been described in detail. 22 Cellular accumulation of each of these potential probe substrates was monitored by flow cytometry as part of a simplified protocol (Figure 2A). Histograms of the mock-transfected and NTCP-expressing cells are shown in Figure 2B for CDCA-NBD. This was the only one of the 3 compounds tested to show substantial uptake, with a ratio of 7.3:1 for NTCP-HEK293 cells to the mock-transfected cells (Figure 2C). Subsequent studies focused on the use of CDCA-NBD. Intracellular accumulation of CDCA-NBD was observed by fluorescence microscopy of NTCP-HEK293 cells, while absent in the mock-transfected cells (Figure 2D inset).
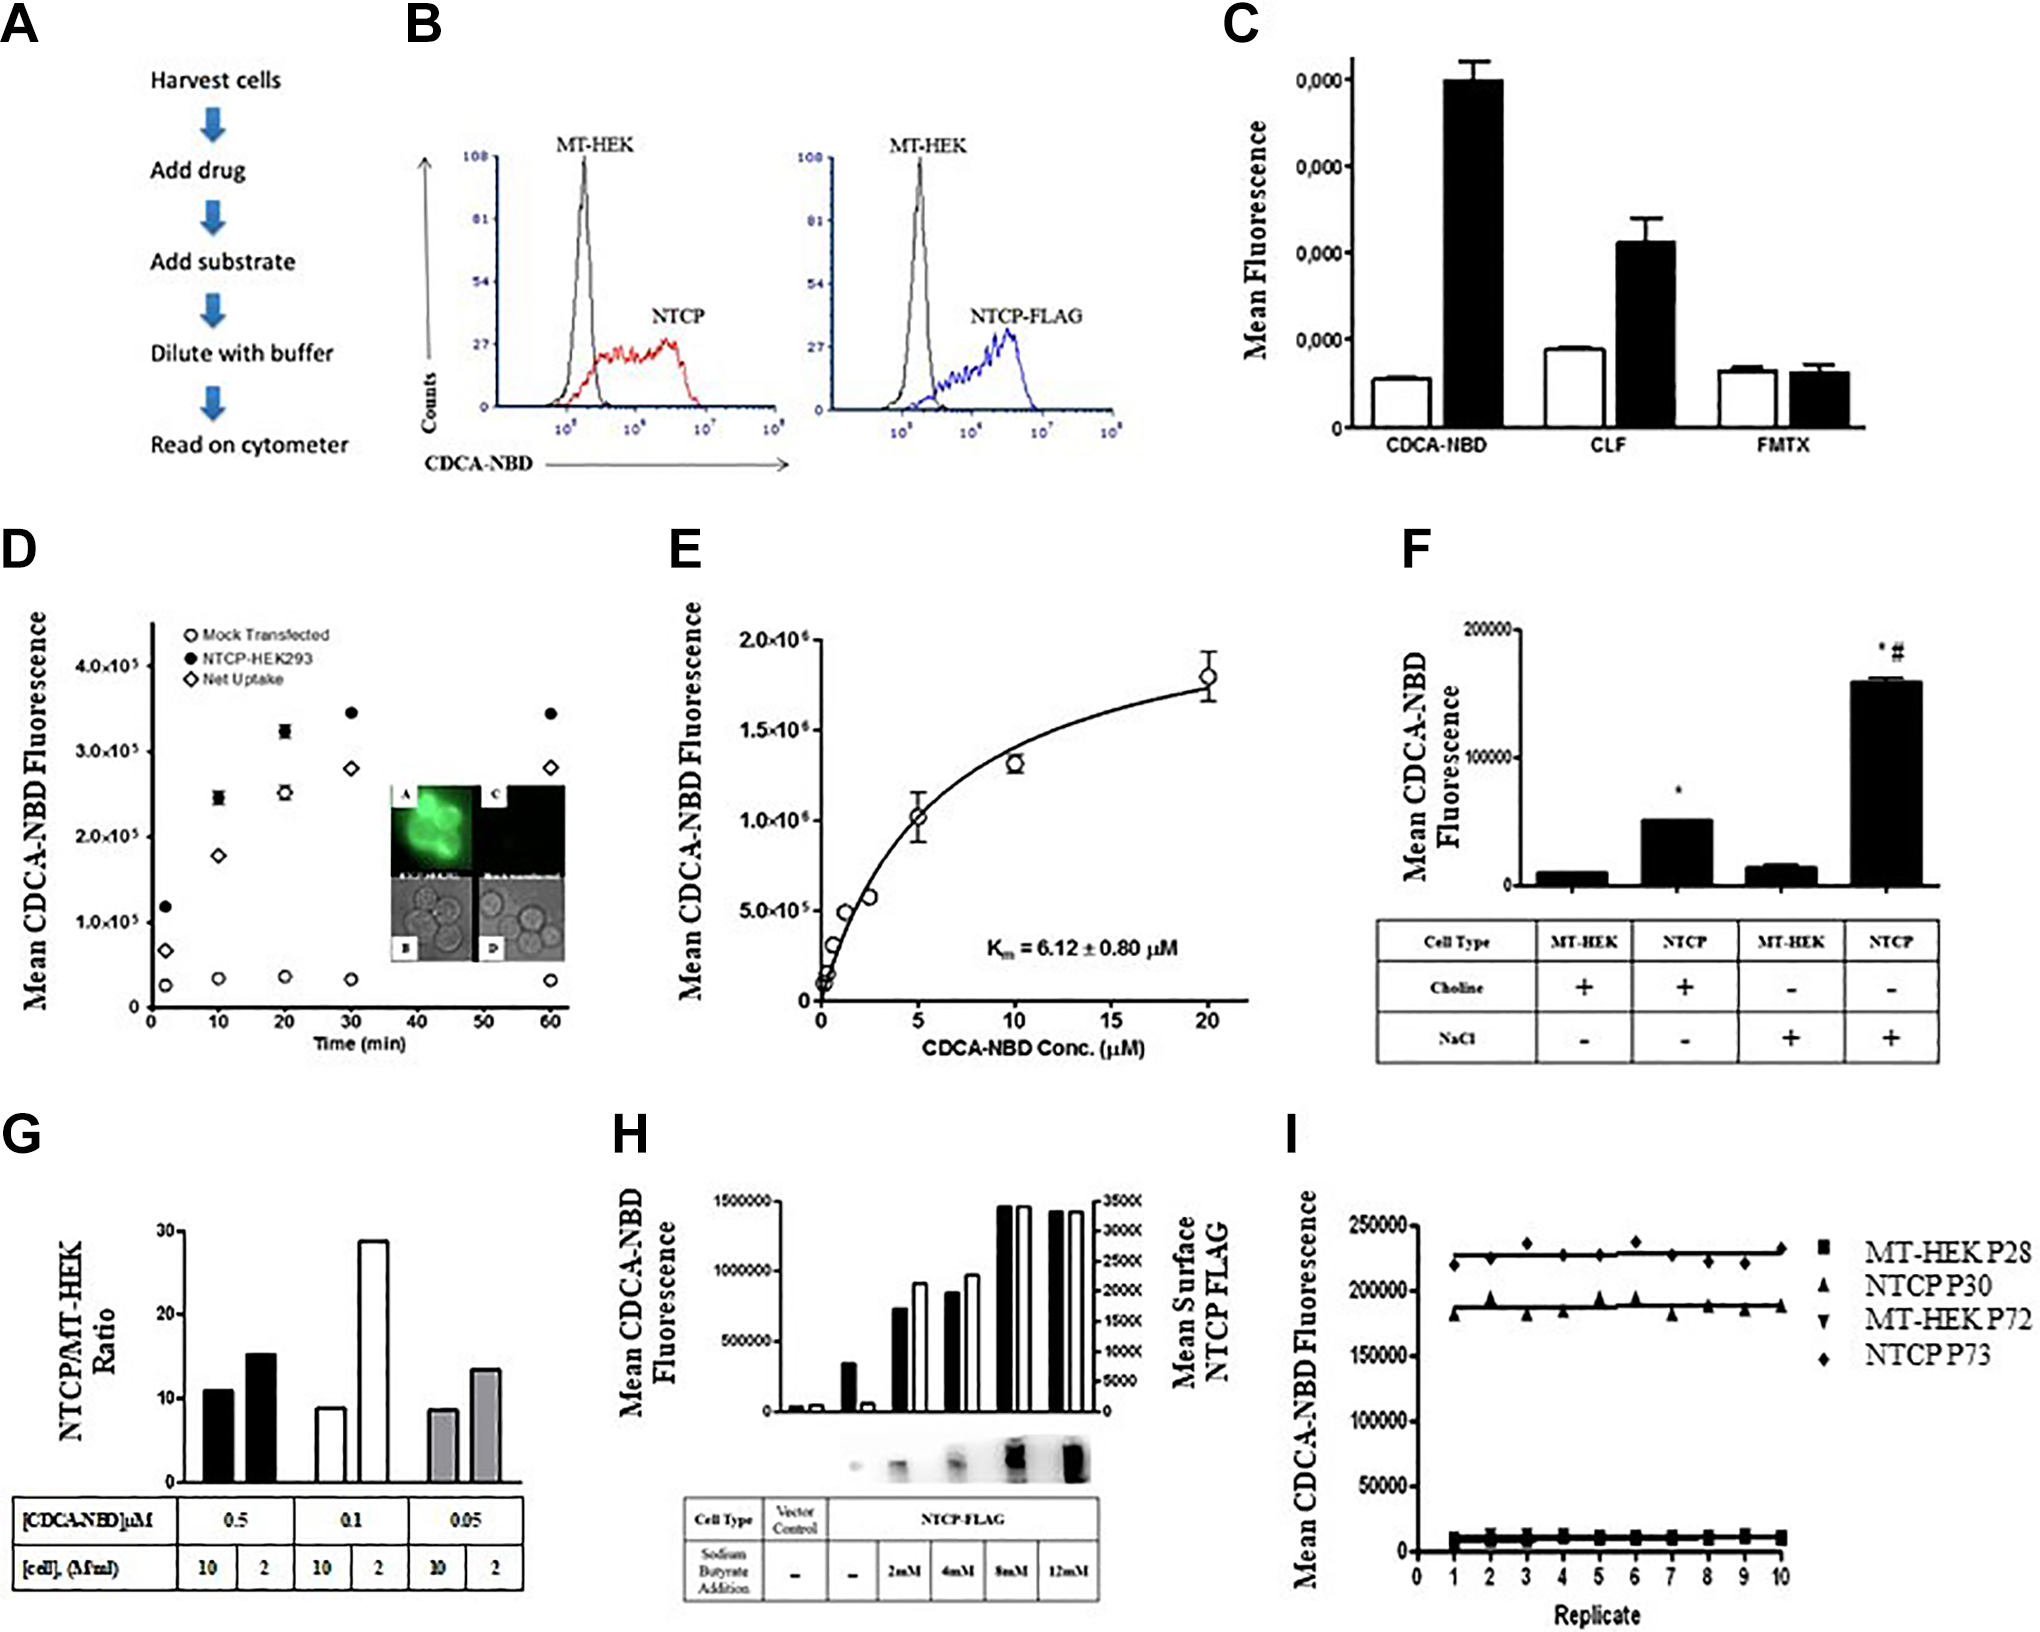
Characterization of CDCA-NBD uptake by NTCP-HEK cells. A, Flow chart for rapid assay for uptake of fluorescent substrates using flow cytometry. B, Histograms of mock-transfected or NTCP or NTCP-FLAG HEK cells exposed to CDCA-NBD. C, Uptake of CDCA-NBD, CLF, or FMTX by Mock Transfected-Human Embryonic Kidney Cells (MT-HEK) (white bars) or NTCP-HEK (black bars) using flow cytometry. Each point represents the mean ± SD; n = 3. D, Time-dependent uptake of CDCA-NBD into mock-transfected or NTCP-HEK cells. Net uptake (open diamonds) of 1 µM CDCA-NBD was determined at 37 °C by subtracting the uptake in the mock-transfected cells from the uptake in NTCP-HEK cells. Each point represents the mean ± SD; n = 3. Inset D, Visualization of CDCA-NBD cellular accumulation by fluorescence microscopy (A and C) in the mock-transfected cells (C and D) and NTCP-HEK cells (A and B) following a 15-minute exposure to 0.5 µM CDCA-NBD. All images had the same exposure time. E, Concentration-dependent uptake of CDCA-NBD by NTCP-HEK. Uptake of increasing concentrations of CDCA-NBD was measured at 37 °C for 2 minutes. Net uptake was calculated by subtracting the uptake in the mock-transfected cells from the uptake in NTCP-transfected HEK293 cells. Each point represents the mean ± SD; n = 3. The values were fitted to the Michaelis–Menten equation using nonlinear regression analysis. The fit of the kinetic data is shown as a solid line. F, Effect of sodium replacement on uptake. Cells were washed and then incubated in buffer with isotonic sodium chloride or choline chloride prior to uptake of CDCA-NBD. G, Effect of cell density on signal-to-noise ratio. Uptake of CDCA-NBD at 3 concentrations was measured at 2 different cell densities. H, Effect of sodium butyrate (2-12 mM for 24 hours) on expression and activity of NTCP in HEK293 cells. Expression was evaluated by binding of anti-FLAG antibody and flow cytometry (black bars) or immunoblotting (inset). Activity was determined by uptake of CDCA-NBD using flow cytometry (white bars). I, Determination of Z’ factor for CDCA-NBD uptake in NTCP-HEK cells at early or late passage. Assay data from 10 replicates of the mock-transfected and NTCP-HEK293 cells. The mean of each data set is indicated by the solid horizontal line. The broken lines represent 3 SDs from the mean. The calculated Z’ factors were 0.91. CDCA-NBD indicates 7-nitrobenz-2-oxa-1,3-diazole-labeled chenodeoxycholate; CLF, cholyl-
We next characterized the kinetics and inhibitor sensitivity of CDCA-NBD as a potential NTCP substrate. Total and vector-corrected uptake both increased over time up until approximately 30 minutes (Figure 2D) Next, the relationship between substrate concentration and initial transport rate was investigated by measuring concentration-dependent uptake at 2 minutes. NTCP-mediated CDCA-NBD uptake was saturable with increasing concentrations of CDCA-NBD (Figure 2E). Nonlinear regression analysis estimated the K m for NTCP to be 6.12 ± 0.80 μM, which was close to what had been determined using TCA as the substrate (Figure 1D). NTCP transports sodium along with its substrate at a reported stoichiometry of 2:1. 23 We found that replacing sodium with choline in the buffer significantly decreased uptake (Figure 2F) and these results were the same as what we observed using TCA as the substrate (data not shown). The presence of the DYKDDDDK (FLAG) sequence did not influence uptake (Figure 1D and 2B). This has been shown previously, where several different tags were used individually to demonstrate that NTCP forms homodimers. 24 If the tag was removed by trypsinization, there was no loss in transport activity (Figure 1B). While trying to optimize the signal-to-noise ratio, it was found that by changing either the cell density or the substrate concentration we could change the sensitivity of the measurements (uptake ratio ranging from 8 to almost 30; Figure 2G). Another documented 25 way to increase the signal is to increase protein expression using the histone deacetylase inhibitor sodium butyrate. As shown in Figure 2H, treatment with butyrate increases both total (immunoblot) and surface (cytometry) expression of the protein, with a corresponding increase in uptake of CDCA-NBD. This was concentration-dependent (Figure 2I) and time-dependent (data not shown).
Suitability of test systems such as this for screening substrates or inhibitors is often assessed by determining the Z’ factor, a simple statistical parameter used to evaluate and compare bioassays. 19 Ten replicates of NTCP uptake assays in NTCP-HEK293 and mock-transfected cells were conducted, and the calculated Z’ factor was >0.9 (Figure 2I). This was true for both low passage and high passage NTCP-HEK293 cells, confirming the stability of the line. Such a Z’ factor value reflects that the separation between the positive control (uptake in NTCP-transfected cells) and negative control (uptake in mock-transfected cells) was large and that the variation in each group was low, indicating that the assay is suitable for measuring the activity of NTCP via the NTCP-mediated transport of CDCA-NBD.
Inhibition of NTCP-Mediated CDCA-NBD Transport
To demonstrate the utility of CDCA-NBD as a substrate in a fluorescence-based inhibition assay for NTCP, CDCA-NBD uptake was performed in the presence of a series of well-known NTCP substrates/inhibitors. The results reflected their documented inhibitory potency against NTCP. For example, CsA and rifampicin were potent inhibitors, along with the parent of the substrate, CDCA. The inhibitory effects of CDCA, rifampicin, E3S, TCA, and bosentan on CDCA-NBD uptake in NTCP-HEK293 cells were investigated at multiple concentrations (0-2,400 µM). These compounds inhibited CDCA-NBD uptake in a concentration-dependent manner (Figure 3A), with IC50 values of 34.2 µM for CDCA, 104 µM for rifampicin, 403 µM for E3S, 428 µM for TCA, and 754 µM for bosentan. The graph represents 3 inhibitors that show strong (rifampicin), moderate (E3S), and weak (bosentan) inhibition of NTCP-mediated uptake. Sensitivity to these prototypical inhibitors confirms the utility of this test system for screening.
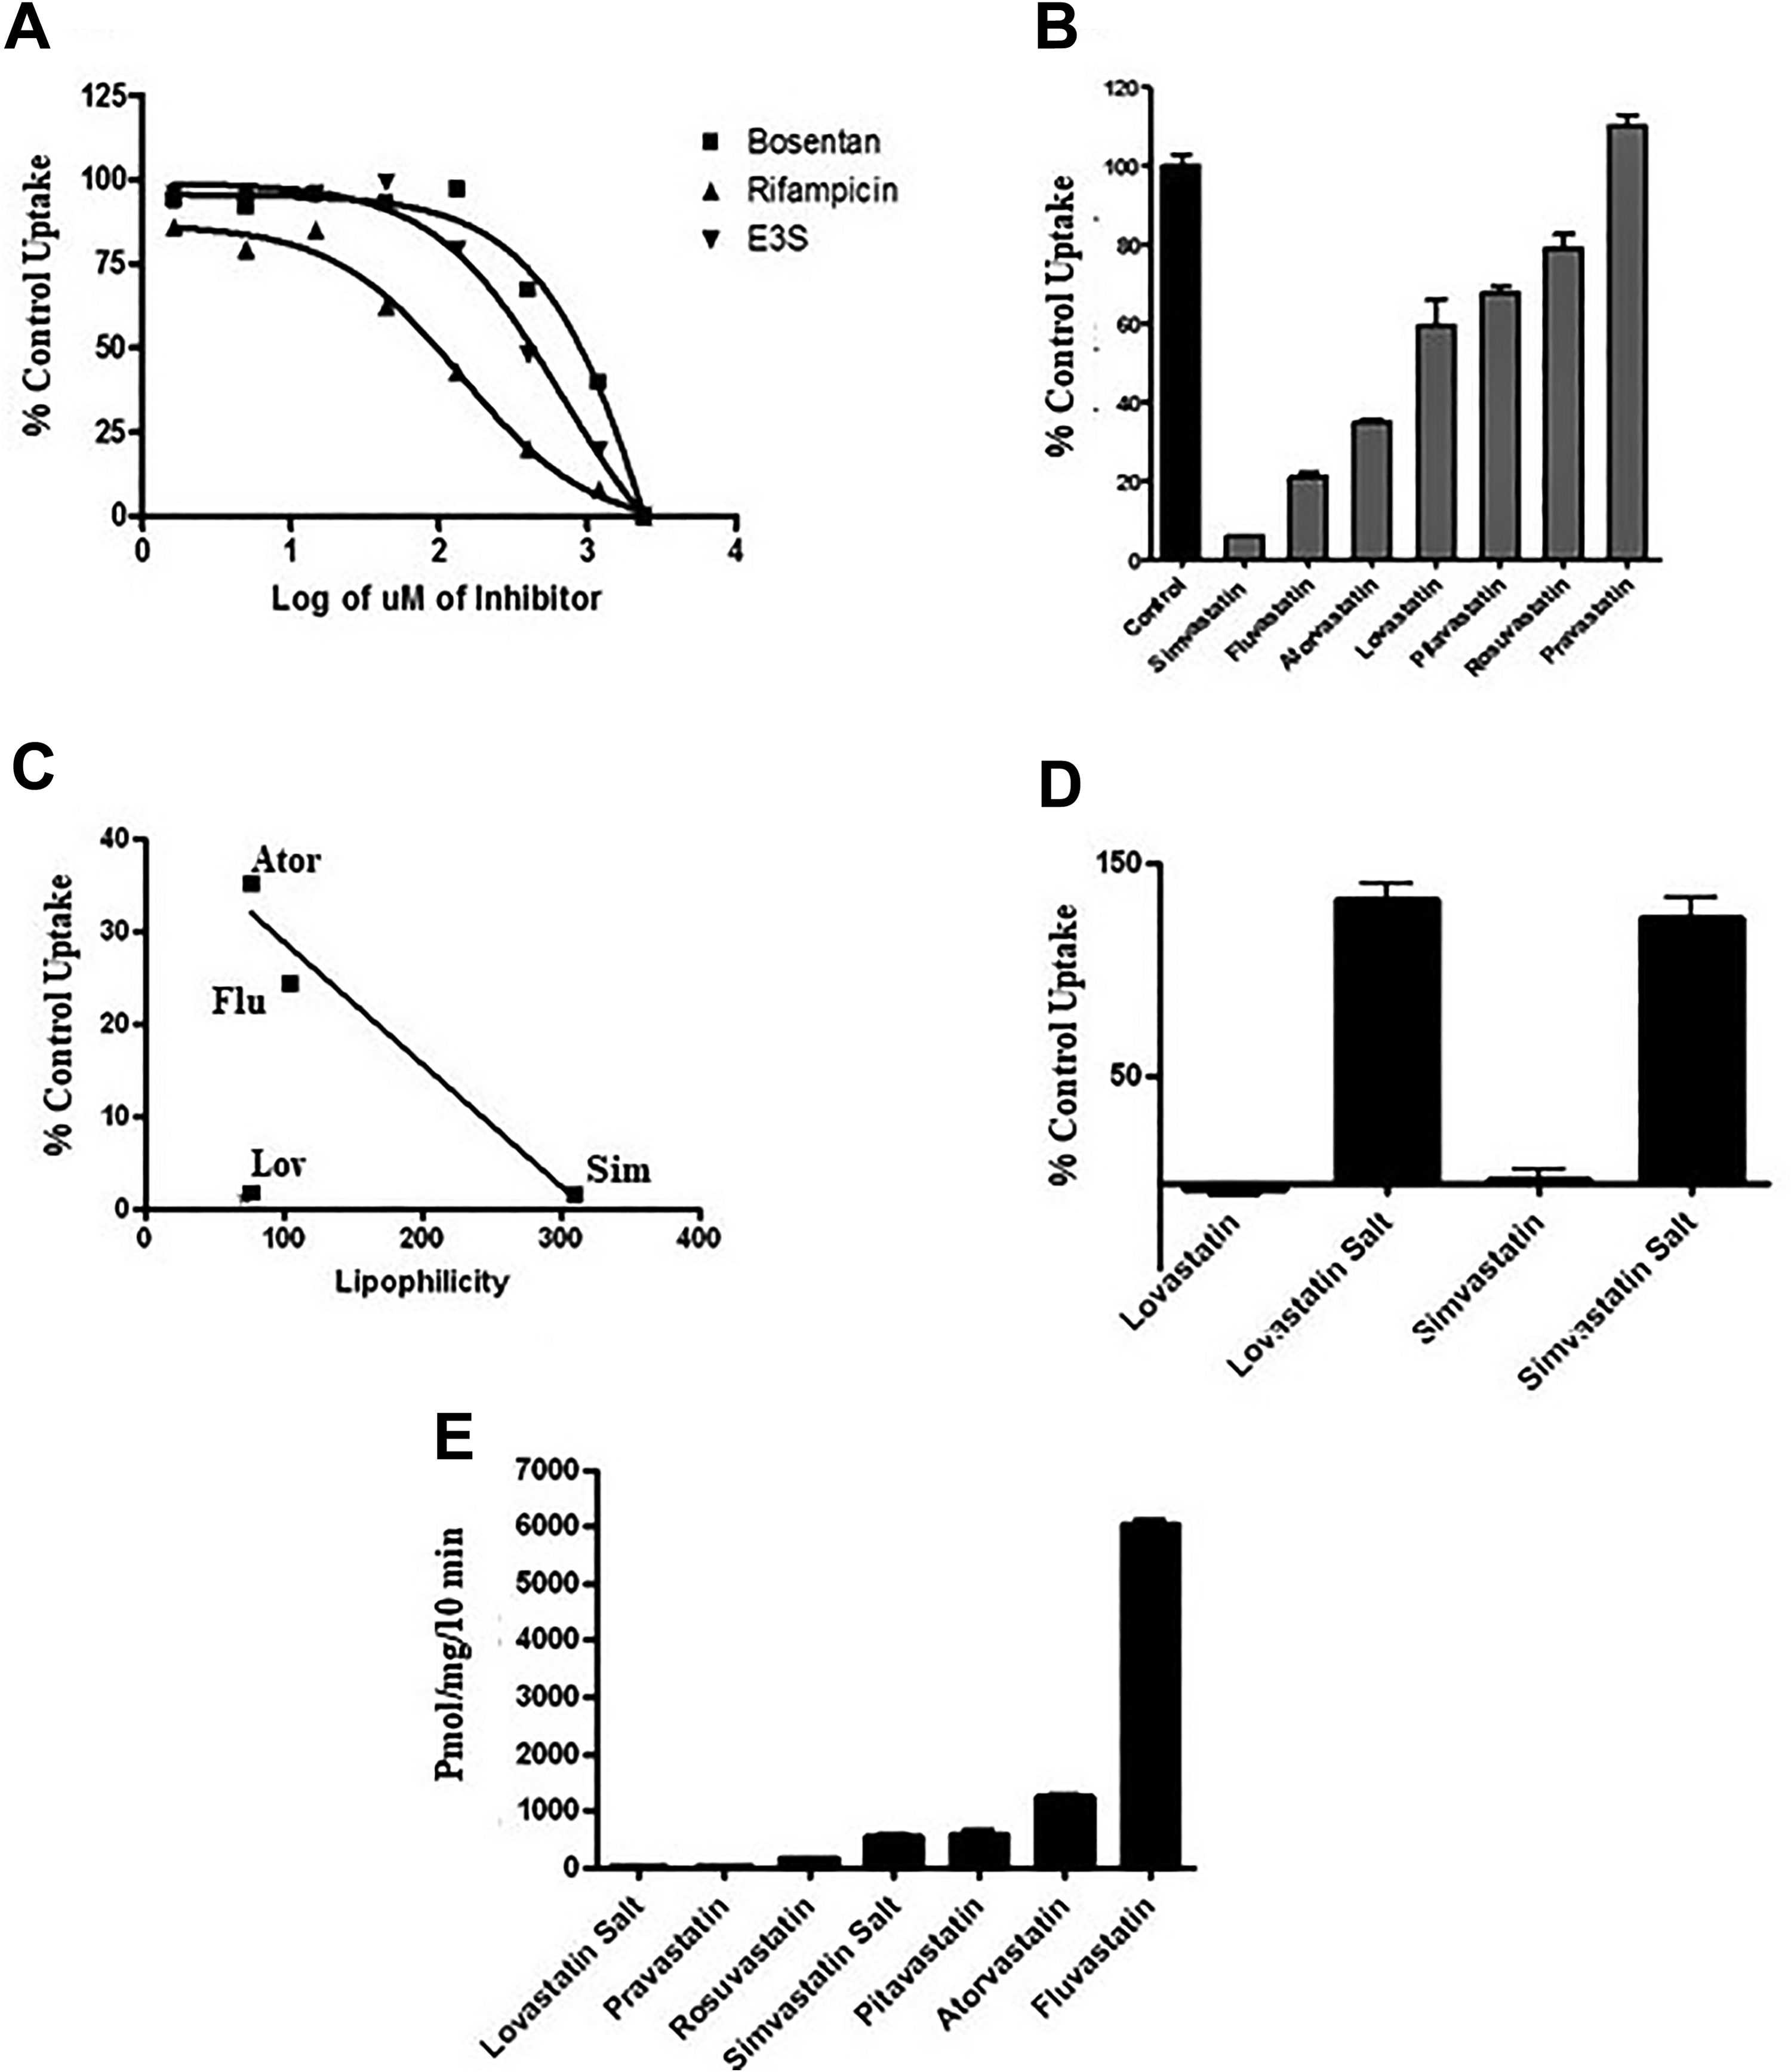
A, Effect of drugs on CDCA-NBD uptake. Cells were preincubated with the indicated concentration of inhibitors for 10 minutes and then dosed with CDCA-NBD at 0.25 µM in the presence and absence of indicated compounds at various concentrations for 10 minutes. Net NTCP uptake was calculated by subtracting uptake into the mock-transfected cells from uptake into NTCP-HEK cells. Each point represents the mean ± SD; n = 3. B, Inhibition of NTCP-mediated CDCA-NBD uptake by statins (400 µM). Uptake of CDCA-NBD was determined as for (A) and normalized to untreated cells. C, Effect of charge on inhibition of NTCP by statins. Cells were incubated with either the lactone or salt of the free acid of the statin and uptake evaluated as in (A). D, Relationship between statin polarity and inhibition of CDCA-NBD uptake by NTCP-HEK cells. Reported values for lipophilicity of 4 statins are shown versus their inhibitory effect on NTCP. E, Statin accumulation in NTCP-HEK cells. Uptake of each statin was determined by LC/MS after a 10-minute incubation period and normalized to mock-transfected cells. CDCA-NBD indicates 7-nitrobenz-2-oxa-1,3-diazole-labeled chenodeoxycholate; HEK, human embryonic kidney; NTCP, sodium taurocholate cotransporting polypeptide; SD, standard deviation.
We also tested the effects on CDCA-NBD transport of several statin drugs, including simvastatin, fluvastatin, atorvastatin, lovastatin, pitavastatin, rosuvastatin, and pravastatin (Figure 3B). Since all pharmacologically active statins are carboxylic acids, which means that at physiological pH (7.4) they are deprotonated and mainly exist as organic anions, 26 only acid form statins were selected for this initial drug interaction assay with NTCP. Among the statins tested, simvastatin was the most potent, showing 94% inhibition at 400 µM, followed by fluvastatin and atorvastatin with inhibition of 79% and 65%, respectively. Lovastatin, pitavastatin, and rosuvastatin were less potent, with <50% inhibition, while pravastatin had no inhibitory effect on CDCA-NBD uptake; 4 of these statins are known to be lipophilic, and those 4 were the most potent inhibitors of uptake. If we plot the reported lipophilicity index of these 4 compounds 27 against inhibition of NTCP transport, we find a direct correlation for all but lovastatin (Figure 3D). For lovastatin and simvastatin, we also compared the lactone form and the acid (sodium salt) and found that the nonionized lactone form was a much stronger inhibitor of uptake by NTCP (Figure 3C).
Some statins are known to be substrates as well as inhibitors of NTCP. We next wanted to determine the extent of NTCP-mediated uptake of some of these statins using our expression system. Intracellular accumulation was determined by LC/MS detection and found to generally correlate with degree of inhibition of CDCA-NBD uptake (Figure 3E). Fluvastatin had by far the greatest uptake during the 10-minute accumulation period and was also one of the most potent inhibitors of our fluorescent probe substrate. Pravastatin does not appear to interact much with NTCP as either a substrate or inhibitor. Lovastatin was also a poor substrate with an uptake less than 5% of that of fluvastatin but had an intermediate level of inhibitory activity relative to the other statins.
Discussion
One of the more insidious forms of drug toxicity occurs when drug pharmacokinetics are altered following competition for uptake into physiologic compartments. Detecting such DDIs is now an important component of the drug development process, and many in vitro systems have been developed to help detect these interactions. Given the importance of transporters such as NTCP in maintaining the enterohepatic circulation of bile acids and its potential involvement in the hepatic disposition of drugs such as statins, it is essential to assess potential NTCP-mediated DDIs using in vitro test systems early in drug development. Fluorescence-based assays are preferred for higher-throughput screening because they make it possible to measure the concentration of fluorescent probe substrates by a variety of methods including flow/image cytometry or with fluorescence microplate readers. Examples of models that have been employed for investigating DDIs include cells either transiently or stably transfected with OATP1B1 and OATP1B3, 22,28 -31 in which the uptake of fluorescence substrates is monitored. Flow cytometry permits an analysis of the entire population of cells at the single cell level. Many models of cytometers are now equipped with samplers for unattended use, which makes this format more amenable to screening many samples. We have demonstrated here a rapid procedure for screening the interaction of compounds with NTCP using cytometer-based detection in the absence of filtration or centrifugation.
To establish an in vitro screening system for NTCP activity, we generated NTCP-HEK293 cells with significantly higher expression of NTCP mRNA, protein, and functional NTCP compared to the mock-transfected cells. The HEK293 cells lack expression of either NTCP or the OATP transporters (reference 32 and unpublished). Biochemical characterization of the transporter in these transfected cells showed stable and robust expression and that levels could be both controlled and monitored. Greater consistency over time is a significant advantage of using such stably transfected cells. While we did not routinely enhance expression with the use of sodium butyrate, we demonstrated that we could control expression levels if needed. Topology of the transporter was confirmed by both FLAG tag accessibility to antibody labeling and its trypsin sensitivity. We then verified its transport activity using a well-known NTCP substrate, TCA, which exhibited a K m for uptake similar to what has been reported for other systems. Most other in vitro assay systems for the expression of human NTCP employ nonhuman cells), 33 where the uptake kinetics were different from that for hepatocytes. This may be due in part to differences in membrane composition. While a few others have also used human cells, ours is the first report of the use of native NTCP stably transfected into human cells with a cytometer-based screening system for fluorescent substrates. Human HepG2 cells have been used to express a Green Fluorescence Protein (GFP) fusion construct of NTCP and then assayed with TCA as the probe substrate. 33 Other studies using HEK293 cells relied on transient transfection with NTCP, yielding a transport K m of 24 µM for TCA. 34 The HEK293 cells lack any endogenous NTCP or OATPs, so identical transporter-free cells are available as controls. Our stable human-based system has high affinity and demonstrates one of the lowest K m values reported for TCA as well as for a fluorescent substrate.
In our search for a fluorescent substrate, we wanted a compound that was readily available, had high fluorescence quantum yield, and had high affinity for NTCP. Hepatic uptake of the unconjugated bile acid, CDCA, was initially reported to be primarily mediated by a sodium-independent process, 35 which subsequently was suggested to involve both OATP1B1 and OATP1B3. 22 There are some reports that CDCA underwent transcellular transport across Sodium Taurocholate Cotransporting Polypeptide-Madin-Darby Canine Kideney cells (NTCP-MDCK) and Sodium Taurocholate Cotransporting Polypeptide-Lily Laboratories Cells Porcine Kidney (NTCP-LLC-PK1) monolayers, 36 -40 although others reported no uptake using CHO cells expressing NTCP. 25 These studies were done using LC/MS for detection of CDCA. Addition of a fluorescent moiety can significantly change the properties of a molecular probe, as it changes the size and physicochemical properties compared to the parent compound.
Due to its relatively small size, NBD is widely used to label a variety of cellular probes. Its fluorescence quantum yield is also higher than that of fluorescein. This is not the first use of CDCA-NBD as a fluorescent probe substrate, as its uptake by cells expressing either OATP1B1 and OATP1B3 has been well-documented. 22,30,31 A similar compound, CDC-NBD-L, was reported by Weinman et al to be a substrate of the enteric bile acid transporter ASBT, which is related to NTCP as another member of the SLC10 family. 41 An NBD-taurocholate derivative was shown to be taken up by NTCP but was not further characterized. 42 Because of the overlapping substrate specificity of NTCP and the OATPs, we thought it worthwhile to evaluate CDCA-NBD as a potential probe substrate of NTCP, which could then be used in a high-throughput fluorescence-based assay for prediction of NTCP-mediated DDIs. Even though CDCA-NBD is not specific for NTCP, in a system such as the one described herein, where only one of these transporters is expressed, it can still be used effectively to screen for inhibitors of the transporter of interest.
CDCA-NBD uptake into NTCP-HEK293 was robust and time-dependent. Consistent with the involvement of NTCP, at a dosing concentration of 0.25 µM, the net cellular accumulation of CDCA-NBD in NTCP-HEK cells increased throughout the 60-minute incubation period while the background cellular accumulation of CDCA-NBD in the mock-transfected cells remained low. Furthermore, CDCA-NBD uptake showed saturable kinetics with an estimated K m of 6.12 µM. This is comparable to what we found (Figure 1D) or what has been reported as the K m for taurocholate for NTCP expressed in Xenopus oocytes (6 µM) 43 or transfected HeLa cells (7.9 µM). 44 The robust NTCP-mediated transport of CDCA-NBD as evidenced by the high signal-to-noise ratio (approximately 10:1) that we found could be further increased by changing either the cell density or substrate concentration. The calculated Z’ factor in excess of 0.9 confirmed the suitability of the assay system with broad dynamic range and narrow variability even after dozens of cell passages in culture. This value is higher than that reported for fluorescent substrates for OATP1B1 (0.79) and OATP1B3 (0.86). 29 Others reported values of 0.8 for OATP1B1, 0.7 for OATP1B3, and 0.8 for NTCP. 45 The high signal strength provides an excellent dynamic range relative to control, a characteristic that would facilitate the detection of the inhibitory effect of test compounds and calculation of their corresponding IC50 values.
The initial screening of CDCA-NBD uptake in the presence of other compounds revealed various degrees of inhibition by several known NTCP substrates/inhibitors. The corresponding inhibition curves and the determined IC50 values of selected compounds (CDCA, rifampicin, E3S, TCA, and bosentan) illustrate that the measurement of CDCA-NBD uptake is, qualitatively and quantitatively, suitable for investigating inhibition of NTCP. Among non-statin compounds, CsA was the most potent inhibitor of CDCA-NBD uptake, with an IC50 value of approximately 10 µM (Figure 3A), while bosentan was the weakest inhibitor, with an IC50 of 754 μM. The value for bosentan was much higher than reported for NTCP expressed in CHO cells (35 µM). 46 The widespread IC50 values attest to the ability of the system to discriminate between “strong” and “weak” inhibitors of NTCP. Unlabeled CDCA reduced the uptake of labeled NBD-CDCA with an IC50 of 34 μM, which suggests that adding the NBD moiety changes its interaction with NTCP. This is similar to what was observed when CDCA-NBD was used as a substrate for OATP 1B1 or 1B3, where the IC50 for CDCA was approximately 10-fold higher than the K m for CDCA-NBD. 22
Statin use is widespread in the United States for those older than 40 years, and up to 60% of patients may suffer from side effects such as muscle soreness and weakness. 47 While hepatic uptake via OATPs has been documented, 48 there is evidence that NTCP can also be a route of hepatic uptake. Uptake of rosuvastatin by NTCP was identified in HeLa cells, rat hepatocytes, and human hepatocytes transiently transfected with NTCP and in cells stably transfected with NTCP. 10,49 We confirmed rosuvastatin was a substrate (Figure 3E) but there were several other statins that had even greater uptake mediated by NTCP. Uptake of lovastatin was highest followed by much lower accumulation of atorvastatin, pitavastatin, and simvastatin.
The utility of our test system to detect statin–NTCP interactions was further demonstrated by screening the inhibitory potential of 7 acid forms of statin drugs. Inhibition of NTCP-mediated CDCA-NBD transport ranged from 94% to no inhibition; with an inhibitory potency rank order of simvastatin > fluvastatin > atorvastatin > lovastatin > pitavastatin > rosuvastatin > pravastatin. The potency rank order obtained in the current study is consistent with the inhibitory effects of 5 statins on TCA uptake in a recent study with CHO cells stably transfected with the gene encoding human NTCP. 13 The IC50 values obtained from the CHO cell system ranged from 30 μM for simvastatin to 2,500 μM for pravastatin. Based on these results, the authors speculated that statins with higher lipophilicity are better inhibitors of TCA uptake because lipophilicity favors target-ligand complex formation by displacing water molecules away from hydrophobic surfaces within the binding pocket of NTCP. Our data (Figure 3C) largely support that conclusion with one exception, which is lovastatin. Lovastatin was also unique in that it was not significantly taken up by NTCP although it showed intermediate potency among the statins as an inhibitor of CDCA-NBD uptake. CDCA is one of the less polar natural substrates of NTCP so may better reflect interactions with other less hydrophilic substrates or inhibitors. One of the most potent inhibitors of NTCP is the hydrophobic chemical CsA, which is well-documented in multiple DDIs. Lipophilicity has also been shown to be a major feature of agents that inhibit OATP. 48 However, in the current study, lovastatin (logD 7.0 = 1.51), 50 which has comparable lipophilicity and similar chemical structure as simvastatin (logD 7.0 = 1.88), 50 demonstrated marginal inhibition compared to simvastatin. Therefore, in addition to lipophilicity, other physicochemical properties of the compound or cellular mechanism(s) may influence drug interactions with NTCP. Nevertheless, the similarity in the rank order of NTCP inhibition potency by statin drugs between CDCA-NBD uptake in NTCP-HEK293, in the current study, and TCA uptake in NTCP-CHO cells, in the previous study, 13 indicates that CDCA-NBD and TCA are transported by NTCP in a similar fashion. The fact that CDCA-NBD uptake was inhibited by TCA furthers supports the conclusion that both CDCA-NBD and TCA are substrates of NTCP; thus, CDCA-NBD appears to be a good model substrate to study the NTCP-mediated hepatic uptake of bile acids and xenobiotics.
In conclusion, we have established an in vitro assay system consisting of CDCA-NBD as a fluorescent probe substrate of NTCP and stably transfected NTCP-HEK293 cells for the screening of drug interactions with NTCP. The utility of this assay was illustrated by the inhibitory effect of several well-known substrates/inhibitors on NTCP-mediated CDCA-NBD uptake into NTCP-HEK293 cells. Specifically, for 7 acid form statins, the rank order of CDCA-NBD uptake inhibition is consistent with the previously reported rank order of NTCP-mediated TCA transport inhibition. 51 The assay described here using a cell line stably expressing human NTCP to study drug interactions with NTCP constitutes a valuable and convenient in vitro tool for identifying compounds that are substrates or inhibitors of NTCP and for assessing their potential to either interfere with the sinusoidal uptake of bile acids or to participate in NTCP-mediated DDIs.
Footnotes
Author Contributions
Ying Wang contributed to design, acquisition, analysis, and interpretation; drafted the manuscript; and critically revised the manuscript; Matthew Wilkerson contributed to acquisition, analysis, and interpretation and critically revised the manuscript; Jibin Li contributed to acquisition, analysis, and interpretation and critically revised the manuscript; Wei Zhang contributed to conception and critically revised the manuscript; Albert Owens contributed to conception and critically revised the manuscript; Stephen Wright contributed to design, acquisition, analysis, and interpretation; drafted the manuscript; and critically revised the manuscript; Ismael Hidalgo contributed to conception and critically revised the manuscript. All authors gave final approval and agree to be accountable for all aspects of work ensuring integrity and accuracy.
Declaration of Conflicting Interests
The author(s) declared the following potential conflicts of interest with respect to the research, authorship, and/or publication of this article: S. Wright and M. Wilkerson are consultants for Absorption Systems; all other authors are employees of Absorption Systems.
Funding
The author(s) disclosed receipt of the following financial support for the research, authorship, and/or publication of this article: This work is funded by Absorption Systems.