
Abstract
Novel urinary protein biomarkers have recently been identified and qualified in rats for the early detection of renal injury in drug development studies. However, there seems to be no standardized normalization method for analyzing these urinary biomarkers, as some users normalize with urinary creatinine (uCr), urine volume (uVol), or leave biomarker un-normalized. More recently, urinary cystatin C is also emerging as a urinary biomarker normalizer, given some of its characteristics as a glomerular filtration marker. The purpose of this study was to identify an optimal drug-induced kidney injury biomarker normalization method that can be adopted more uniformly in the field. To this end, we compared the variability of uVol, urinary cystatin C, and Cr in healthy rats; we evaluated the sensitivity of the renal biomarkers to renal injury after normalization with uVol, uCr, and cystatin C in rats with cisplatin-induced renal injury. We showed that, over time, uCr was less variable than urinary cystatin C and uVol. When the renal biomarkers were normalized with the 3 normalizing end points, the biomarkers showed (1) least variability following normalization with Cr in healthy animals and (2) poor sensitivity when normalized with urinary cystatin C in animals with renal injury. Overall, the results suggested that uCr is better than urinary cystatin C and uVol for normalizing renal biomarkers in rats under controlled preclinical conditions. To our knowledge, this is the first report that compared the variability of uVol, cystatin C, and Cr in the context of renal biomarkers’ normalization.
Introduction
Glomerular filtration (GF) markers are characterized by substances that are freely filtered by the glomeruli, have no effects on the glomerular filtration rate (GFR), and are not reabsorbed or secreted in the tubule. They could be endogenous (creatinine [Cr]) or exogenous (inulin), not bound to plasma proteins, and could be positive or neutral charge. Their molecular weights are usually less than ∼20 kD. For renal clearance measurements, inulin, an exogenous filtration marker, remains the gold standard; iothalamate, iohexol, ethylenediaminetetraacetic acid, and diethylenetriaminepentaacetic acid, often chelated to radioisotopes for ease of detection, are commonly used alternative exogenous filtration markers. 1,2 However, the difficulty associated with using the exogenous markers has led to the utility of endogenous filtration markers.
Creatinine is the most common GF endogenous marker. This is because Cr is a 0.13 kD end product of muscle catabolism and usually produced at a fairly constant rate by the body. 3 –5 It is nonprotein bound and freely filtered and excreted in urine. However, it is also secreted from the renal tubules, which is one of the characteristics not desirable for a GF marker. The blood concentration of a perfect GF marker should only be affected by the GFR. There are, however, several non-GFR factors that can affect serum Cr (sCr) concentration. These include, muscle mass, diet, age, sex, and race, as Cr has been shown to be lower in elderly persons, women, and Caucasians. 4,6 This has led to a wide range of GFR for a given sCr concentration. That said, the ease of measurement, low cost, and widespread availability of sCr assays have made it a more attractive alternative to the cumbersome exogenous GF markers for GFR measurement.
Given the lack of sensitivity of traditional renal biomarkers—blood urea nitrogen and Cr—in preclinical safety studies, the Predictive Safety Testing Consortium (PSTC) Nephrotoxicity Working Group has recently identified novel urinary biomarkers in preclinical animal species for the early detection of renal injury.
7
–13
Most of these urinary biomarkers (total protein [uTP], albumin, kidney injury molecule-1 [KIM-1], osteopontin [OPN], neutrophil gelatinase-associated lipocalin [NGAL], N-acetyl-β-
Cystatin C is a 13.3 kD nonglycosylated basic protein made by all nucleated cells and is freely filtered by the glomeruli. Notably, CysC is not affected by muscle mass or diet and thus may correlate better with measured GFR than Cr. It is also believed to be less affected by age, sex, and race than Cr. Given these qualities, serum CysC (sCysC) is gaining popularity as either an alternative endogenous GF marker or as a supplement to sCr for GFR estimation. However, just like Cr is secreted by the renal tubules, a property considered not desirable for a GF marker, most of the filtered CysC is also reabsorbed at the renal tubules, and catabolized in the proximal tubule, a characteristic that is also considered undesirable for a perfect GF marker. In humans, smoking, inflammation, adiposity, thyroid diseases, certain malignant neoplasms, and glucocorticoids are all non-GFR factors that can also alter sCysC concentration. 4,5 Despite all these reasons, sCysC is still mostly thought to have a constant serum concentration.
The purpose of this study was to see whether the degree of variability associated with endogenous GF markers in humans would be observed in preclinical animal species under controlled conditions and to identify an optimal drug-induced kidney injury biomarker normalization method that can be adopted more uniformly in the field.
As such, we compared the variability of uVol, uCr, and urinary CysC (uCysC) and determine which of these end points would be better for renal biomarker normalization in preclinical animal species, with rats as the index animal species, given the fact these novel biomarkers have only been officially qualified for use in rats. 14 The results showed that, over time, uCr was less variable than uCysC and uVol in healthy animals. When the renal biomarkers were normalized with uVol, uCr, and uCysC, the biomarkers showed less variability when normalized with uCr in healthy animals, relative to uVol and uCysC. Moreover, following normalization with all the 3 normalizing end points in animals with cisplatin-induced renal injury, sensitivity of renal biomarkers was lower when normalized with uCysC, relative to normalization with uVol, uCr, or when left un-normalized.
Overall, the results suggested that uCr is better than uCysC and uVol for normalizing renal biomarkers in rats under controlled preclinical conditions. These results fill a significant gap in the field and will help ensure an optimal drug-induced kidney injury biomarker normalization procedure can be adopted more uniformly in the field.
Materials and Methods
Animal Selection
The PSTC database was searched for all renal biomarker studies performed in rats by all member pharmaceutical companies. The inclusion criteria were (1) studies with both males and females, (2) studies with ≥8 renal biomarkers, (3) studies with uCysC and plasma CysC (pCysC), (4) studies with uCr and plasma Cr (pCr), (5) studies with ≥4 time points for urine biomarkers, (6) studies with ≥2 time points for blood CysC and Cr, and (7) studies with histopathologic observation of renal tubular injury. Based on these search criteria, we found a study in which 30 male and 30 female Han Wistar rats were dosed with 2.5 mg cisplatin dissolved in 0.9% physiological saline (intraperitoneal, IP), along with 14 male and 15 female Han Wistar control rats that were dosed with 0.9% physiological saline (IP). The complete methodology for this study has been previously published. 15
Using the above criteria, we also selected 20 Sprague Dawley male control rats from another study to know whether the results obtained were independent of the rat strain.
Urine and Blood Samples Collection
Urine and blood samples were collected as previously described. 15 Briefly, urine samples were taken by meta-bowl collection overnight with ad libitum access to water and food. Urine samples were cooled with ice water during meta-bowl collection, and resultant volumes were measured at the end of sample collection. Urine samples for the Han Wistar rats were collected on predose days 7 and 3 and postdose days 3, 5, 8, 15, and 22; those of the Sprague Dawley rats were collected on predose day 3 and postdose days 2, 5, 11, 18, 25, 32, and 39. Blood samples were collected on postdose days 5, 8, and 22 for the Han Wistar rats. One milliliter was taken from the tail vein into a lithium heparin tube.
Urine Novel Biomarker Measurements
A detailed methodology for this study was previously reported. 15 Briefly, a novel biomarker analysis was performed on 2 different multiplex assay plates using a multiplex ECL-based Meso Scale Discovery (MSD) Sector Imager 6000 instrument (MSD, Gaithersburg, Maryland) according to the manufacturer’s instructions. Urine samples were diluted 10-fold in mouse/rat serum cytokine assay diluent (supplied with the kit) prior to analysis; samples and calibrators were mixed with albumin tracer before addition (50 mL/well) to the plate. The precoated assay plates were incubated with 150 mL of 0.5% blocking solution (as supplied with the kit) for 1 hour while being shaken. Twenty-five milliliters of diluent and samples/calibrator were then dispensed into each well. Plates were further incubated for 2 hours at room temperature while being shaken vigorously prior to the addition of detection antibody (25 mL/well).
Plates were then incubated for an additional 2 hours while being shaken. Between the steps, the plates were washed 3 times with phosphate buffer serum–0.05% Tween. Finally, a reading buffer was added (150 mL/well) and the plates were read within 5 minutes. For all data analyses, duplicate sample values with a coefficient of variation (CV) value greater than 15% were rejected; any standard curve values with recovery outside the range of 80% to 120% were omitted from the curve fit process. Internal quality control (QC) material was generated using standard curve material (2 points) chosen to be on the linear part of the curve; within- and between-plate precision was calculated. Test plates were subsequently accepted if QC material values fell within +2 standard deviation (SD) of their calculated mean.
The biomarkers analyzed were urinary albumin (or microalbumin), CysC, clusterin, KIM-1, NGAL, OPN, renal papillary antigen 1 (RPA-1), and B2M.
uCr and uTP Measurements
As previously reported, 15 uCr and uTP were analyzed using a Roche modular P analyzer (Roche Diagnostics, West Surrey, UK) according to the manufacturer’s instructions. Creatinine concentrations were determined using the Jaffe reaction method. The uTP kit was measured using a colorimetric method (Sigma Aldrich, Gillingham, Dorset, United Kingdom).
pCysC Measurement
As previously described, 15 pCysC was measured using a turbidimetric method (DakoCytomation/Alere, Stockport, United Kingdom) on the Roche modular P analyzer according to the manufacturer’s directions.
pCr Measurement
As previously described, 15 pCr was measured on the Roche modular P analyzer (Roche Diagnostics) using assay kits supplied by Roche Diagnostics and followed standard methods. Creatinine concentrations were determined using a Jaffe reaction method.
Normalization Method
For normalization of the biomarkers with uCr, the individual biomarker concentration in ng/mL was simply divided by the respective Cr concentration (mmol/L) with the final normalized result measured in μg/mmol. For example, a KIM-1 0.88 (ng/mL)/Cr 4.36 mmol/L = 0.20 mg/mmol of normalized KIM-1. For normalization of the TP (mg/L) with Cr (mmol/L), the same process was followed, but with a final normalized result measured in mg/mmol.
To normalize the urinary biomarkers with uCysC, the individual biomarker concentration in ng/mL were simply divided by the respective CysC (ng/mL), with the final normalized result having no unit of measurement. For normalization of the TP (mg/L) with CysC (ng/mL), the same process was followed, but with a final normalized result measured in μg/ng.
To normalize the biomarkers with uVol, the individual values of each end point were multiplied by the uVol at the time of collection in order to obtain the total amount excreted.
Histopathology
Histopathological examination was performed as reported by Pinches et al, 16 on days 5, 8, and 22. For the purpose of this study, renal tubular degeneration and necrosis were graded as none to minimal, mild to moderate, and marked, representing grade 0 to 1, grade 2 to 3, and grade 4 renal tubular degeneration and necrosis, respectively.
Biomarker Variability Analyses
We quantified the amount of variability in Cr, CysC, uVol, and their respective normalized biomarkers for control rats using metrics based on the CV. We used the CV as a basis for our variability calculations due to the fact that the scale and units of the values for uCr, uCysC, uVol, and the normalized biomarkers were not the same, and so using the CV allows for us to compare standardized (or unitless) measures of variability across the measurements. This is critically important given that our objective was to make direct comparisons between uVol, uCr, and uCysC variability. Given that the data were collected in time for different populations, we also decided to quantify the total variability by decomposing it into a between-day variability and between-rats variability component. Thus, for uVol, Cr, CysC, and the normalized biomarkers, we calculate the following:
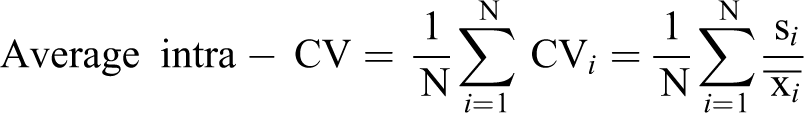
and
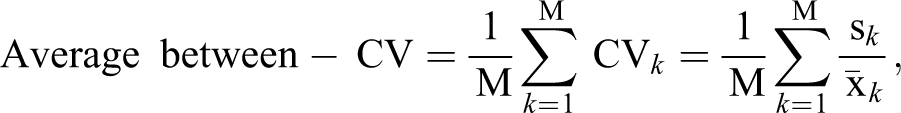
where
We compared the variability and sensitivity of the normalized biomarkers in the dosed rats by calculating the average fold change from baseline for each normalized biomarker by averaging over the individual fold changes from baseline for each rat. A fold change was calculated as the postdose value divided by the baseline value where baseline was defined as the time point 3 days predose. Thus, 5 subsequent postdose time points were used to quantify the fold change from baseline for each normalized marker.
All statistical analyses and figures were generated in the statistical computing language R. 17
Results
uCr Appeared Less Variable Relative to uVol and uCysC in Healthy Animals
Three normalization end points were evaluated in rats. To identify which of the 3 end points—uVol, uCysC, and uCr—has less variability, we quantified the average CV of these end points within (average between-day CV) and between (average between-rats CV) individual animals over time. In both sexes, the results showed that uCr had lower average between-day CV and between-rats CV relative to both uVol and uCysC “within” and “between” individual animals over time (Tables 1 and 2). Moreover, when uCr was normalized by uVol, uCr appeared much less variable than when analyzed without normalization. Furthermore, uCr appeared slightly less variable in males than female rats. Overall, the results suggested that uCr was less variable and will be more suited for biomarker normalization than uCysC or uVol in healthy rats.
Variability of Urine Volume, Creatinine, and Cystatin C in Han Wistar Healthy/Normal Male Rats, From Day 3 to Day 22.a
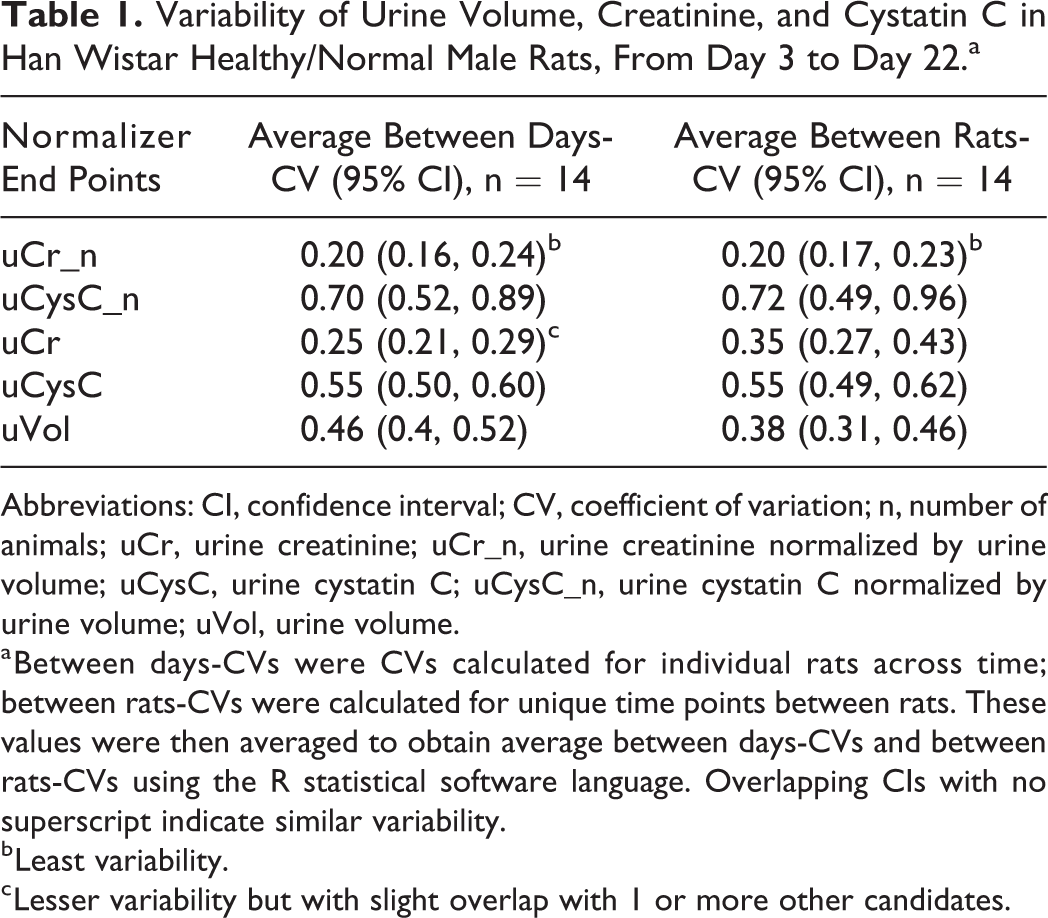
Abbreviations: CI, confidence interval; CV, coefficient of variation; n, number of animals; uCr, urine creatinine; uCr_n, urine creatinine normalized by urine volume; uCysC, urine cystatin C; uCysC_n, urine cystatin C normalized by urine volume; uVol, urine volume.
a Between days-CVs were CVs calculated for individual rats across time; between rats-CVs were calculated for unique time points between rats. These values were then averaged to obtain average between days-CVs and between rats-CVs using the R statistical software language. Overlapping CIs with no superscript indicate similar variability.
b Least variability.
c Lesser variability but with slight overlap with 1 or more other candidates.
Variability of Urine Volume, Creatinine, and Cystatin C in Han Wistar Healthy/Normal Female Rats, From Day 3 to Day 22.a
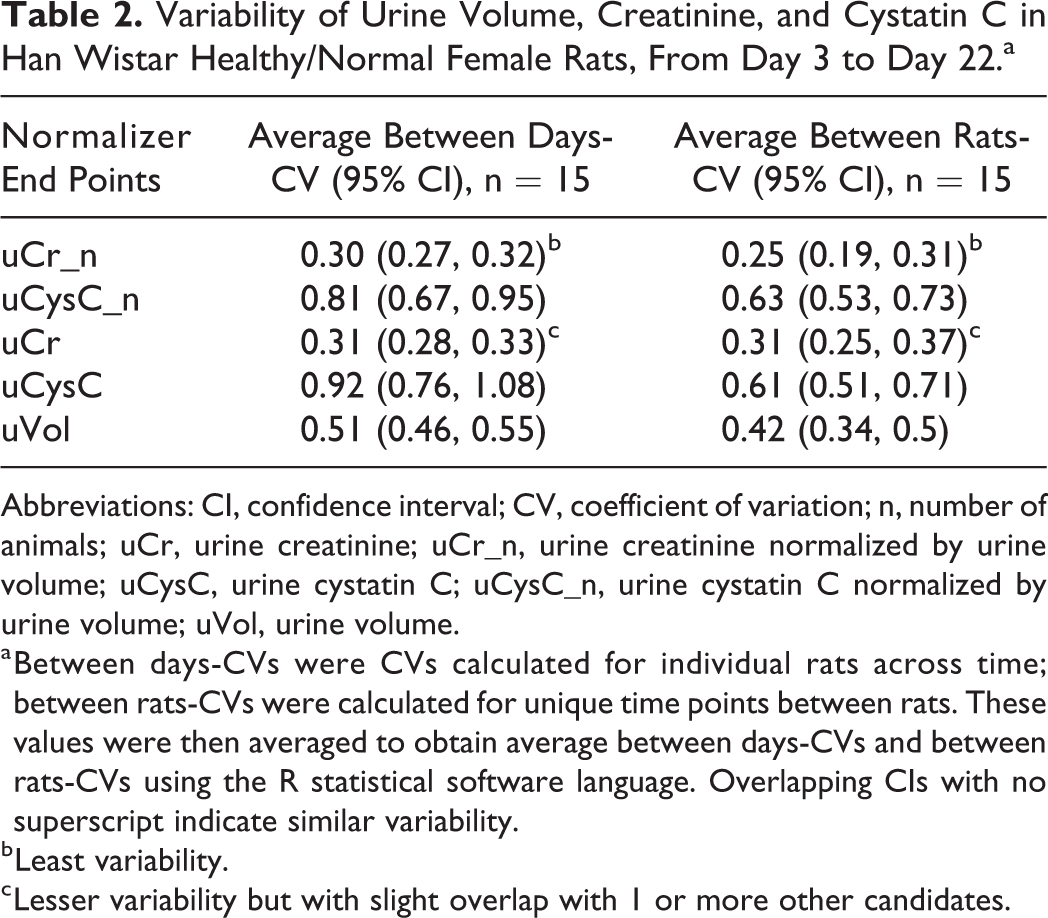
Abbreviations: CI, confidence interval; CV, coefficient of variation; n, number of animals; uCr, urine creatinine; uCr_n, urine creatinine normalized by urine volume; uCysC, urine cystatin C; uCysC_n, urine cystatin C normalized by urine volume; uVol, urine volume.
a Between days-CVs were CVs calculated for individual rats across time; between rats-CVs were calculated for unique time points between rats. These values were then averaged to obtain average between days-CVs and between rats-CVs using the R statistical software language. Overlapping CIs with no superscript indicate similar variability.
b Least variability.
c Lesser variability but with slight overlap with 1 or more other candidates.
We also conducted a pooled analysis combining the data across gender (with n = 29), and the conclusions were the same as those from the stratified analysis (Supplemental Table 1). When data from a different strain of rats (Sprague Dawley) were analyzed, the results provided similar conclusions as the Han Wister rats, indicating these observations were independent of the rat strain (Supplemental Table 2). Henceforth, data from Han Wistar rats were chosen for further analyses.
Cr and CysC Showed Relatively Constant Blood Concentration
Plasma Cr and pCysC levels were evaluated to investigate whether the differences in the variability of uCr and uCysC were replicated in the blood. The average CVs of pCr and CysC were analyzed in both sexes “within” and “between” individual animals over time. The results showed that pCr and pCysC were relatively constant, with similar minimal variability in the blood over time, in both sexes (Tables 3 and 4), with the exception of pCysC which showed a slightly better between-rats CV than pCr in males. These results were in contrast to the urine variability results.
Variability of Plasma Creatinine Versus Cystatin C in Han Wistar Healthy/Normal Male Rats, From Day 5 to Day 22.a
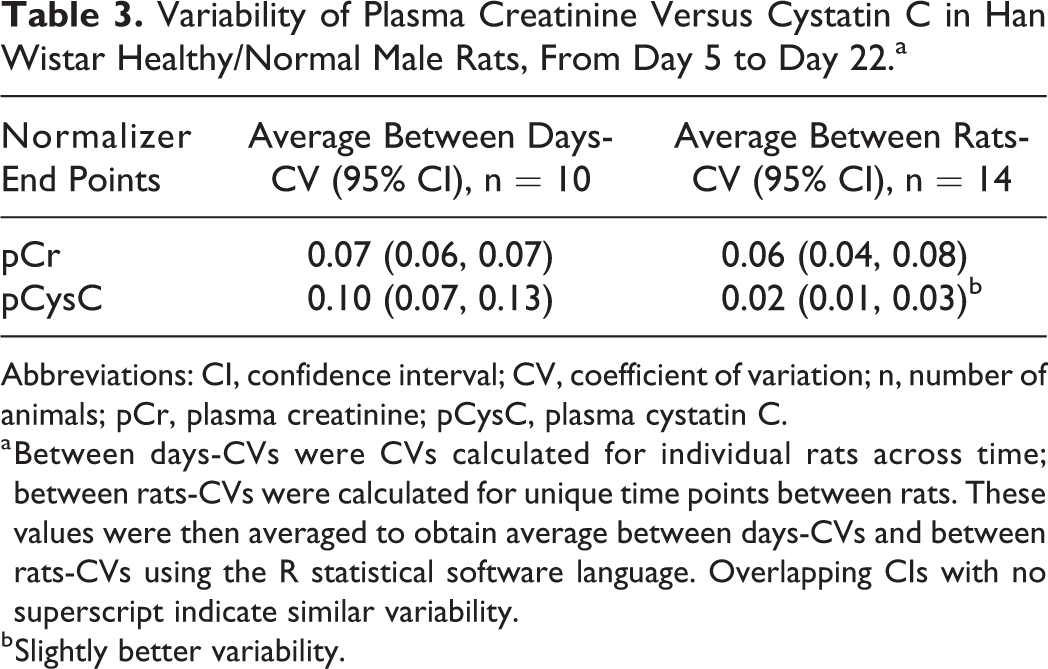
Abbreviations: CI, confidence interval; CV, coefficient of variation; n, number of animals; pCr, plasma creatinine; pCysC, plasma cystatin C.
a Between days-CVs were CVs calculated for individual rats across time; between rats-CVs were calculated for unique time points between rats. These values were then averaged to obtain average between days-CVs and between rats-CVs using the R statistical software language. Overlapping CIs with no superscript indicate similar variability.
b Slightly better variability.
Variability of Plasma Creatinine Versus Cystatin C in Han Wistar Healthy/Normal Female Rats, From Day 5 to Day 22.a
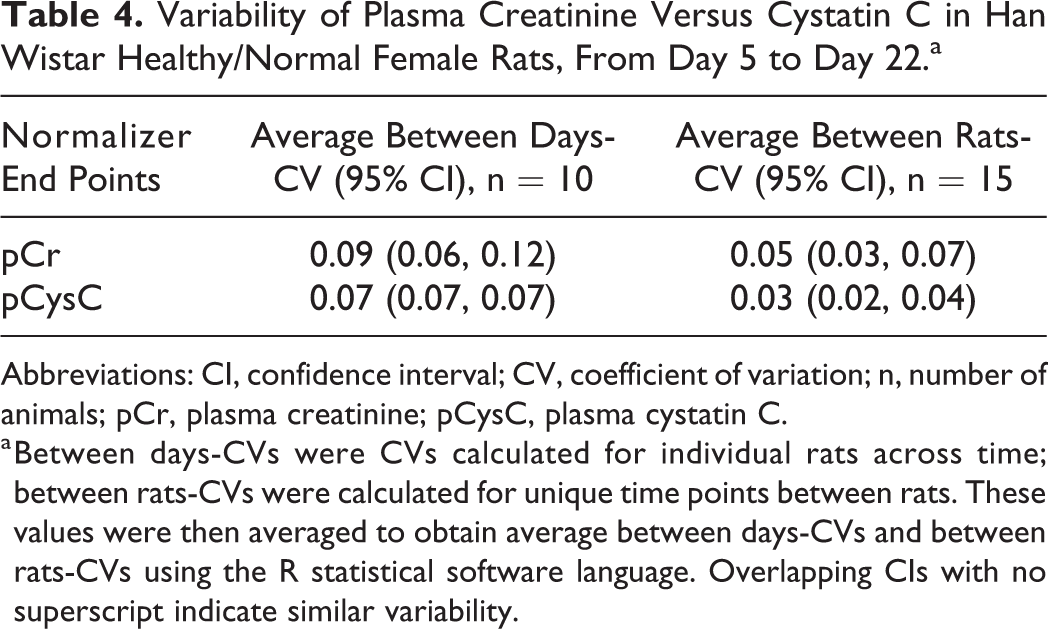
Abbreviations: CI, confidence interval; CV, coefficient of variation; n, number of animals; pCr, plasma creatinine; pCysC, plasma cystatin C.
a Between days-CVs were CVs calculated for individual rats across time; between rats-CVs were calculated for unique time points between rats. These values were then averaged to obtain average between days-CVs and between rats-CVs using the R statistical software language. Overlapping CIs with no superscript indicate similar variability.
Renal Biomarkers Showed Less Variability When Normalized With uCr in Healthy Animals
The variability of the 3 normalization end points—uVol, uCr, and uCysC—was evaluated on the normalization of the novel renal biomarkers. The average CVs of the renal biomarkers when normalized with the different end points were determined in both sexes, within- and between-individual control animals, over time.
In the males, when normalized by uCr (Table 5), biomarkers showed lower variability within and between animals, over time, in 8 of 16 CV readouts. Urine volume and uCysC normalization showed lower average between-rats CV in only 1 of 16 CV readouts (albumin for uVol and B2M for CysC). Surprisingly, when un-normalized, biomarkers showed lower average between-rats CV in 2 of 16 CV readouts (OPN and uTP).
Variability of Renal Biomarker Normalization With uVol, uCr, and uCysC in Han Wistar Healthy/Normal Male Rats.a
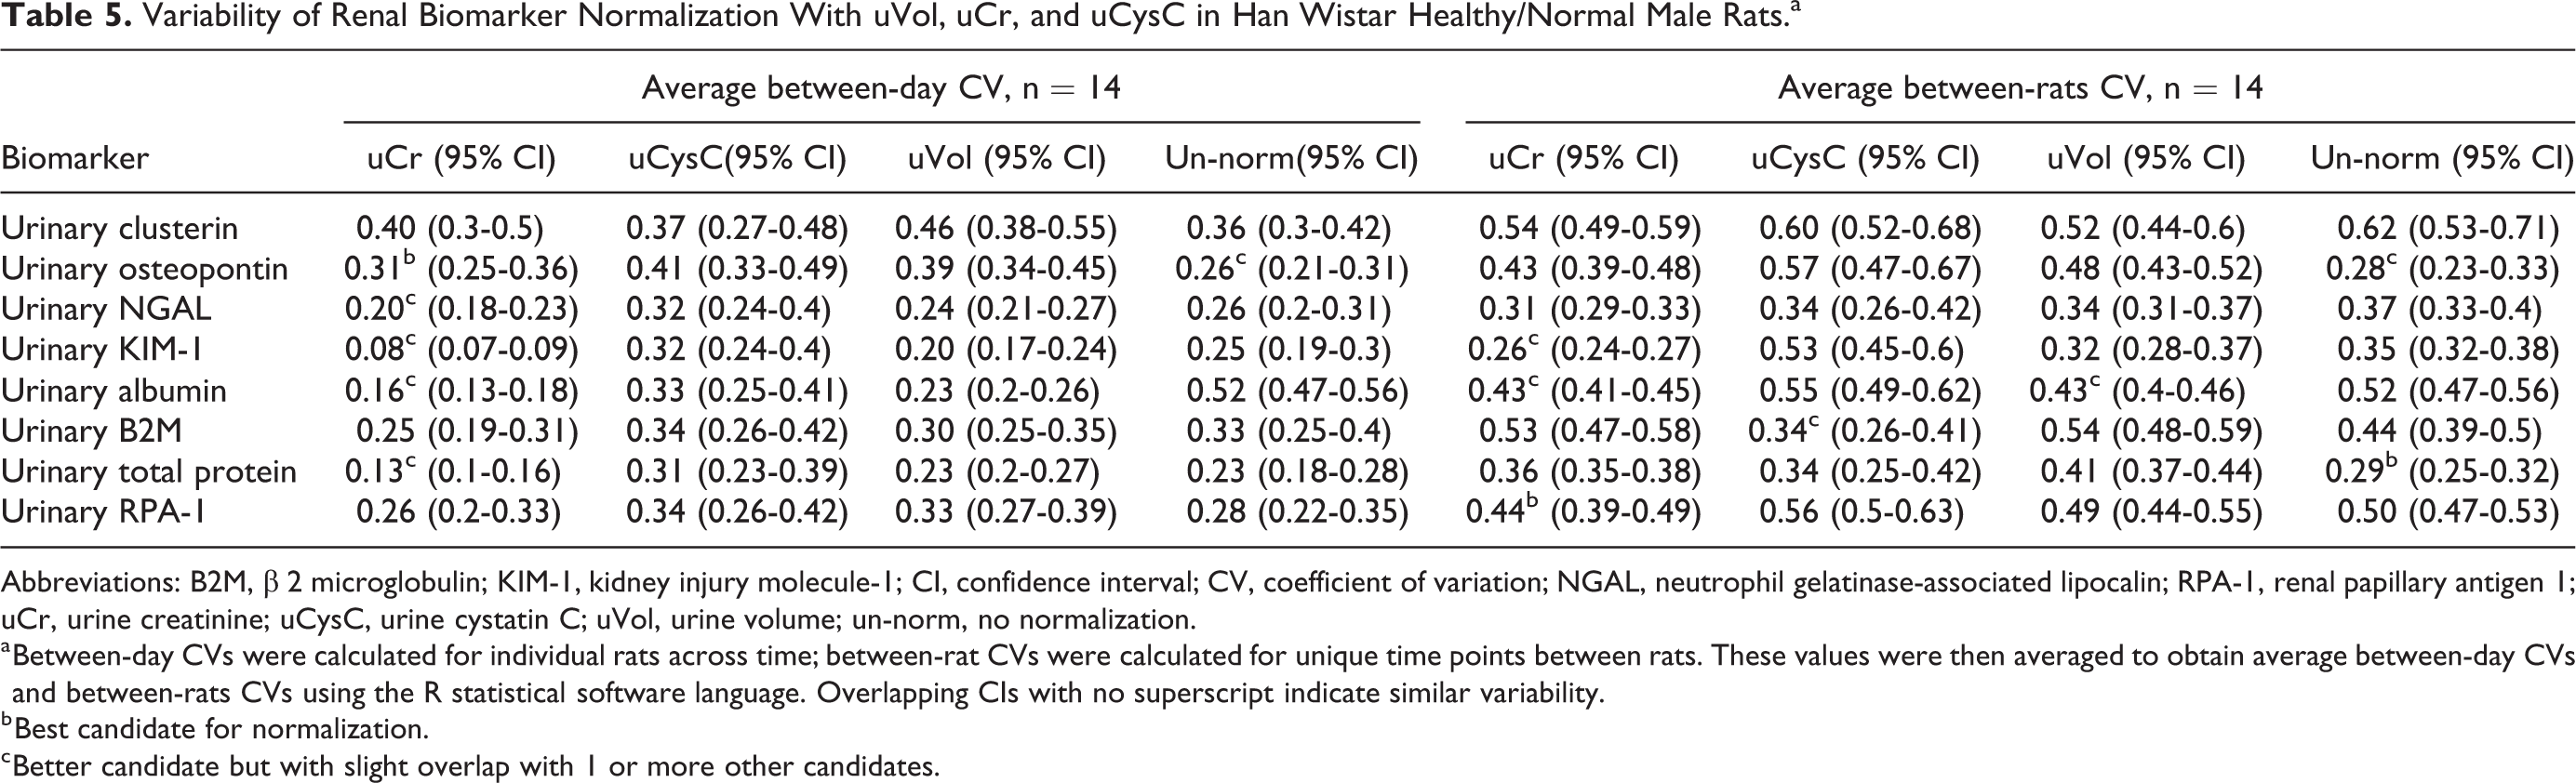
Abbreviations: B2M, β 2 microglobulin; KIM-1, kidney injury molecule-1; CI, confidence interval; CV, coefficient of variation; NGAL, neutrophil gelatinase-associated lipocalin; RPA-1, renal papillary antigen 1; uCr, urine creatinine; uCysC, urine cystatin C; uVol, urine volume; un-norm, no normalization.
a Between-day CVs were calculated for individual rats across time; between-rat CVs were calculated for unique time points between rats. These values were then averaged to obtain average between-day CVs and between-rats CVs using the R statistical software language. Overlapping CIs with no superscript indicate similar variability.
b Best candidate for normalization.
c Better candidate but with slight overlap with 1 or more other candidates.
In the females, when normalized by uCr (Table 6), biomarkers showed lower variability within and between animals, over time, in 15 of 16 CV readouts. When normalized by uVol, biomarkers showed lesser variability in 4 of 16 CV readouts (between-days CV for albumin; between-rats CV for OPN, albumin, and RPA-1). Similarly, when un-normalized, biomarkers showed lesser variability in 4 of 16 CV readouts, including OPN (between-days CV and between-rats CVs), TP, and clusterin (between-rats CVs). Biomarkers showed higher variability when normalized by uCysC in all scenarios.
Variability of Renal Biomarker Normalization With uVol, uCr, and uCysC in Han Wistar Healthy/Normal Female Rats.a
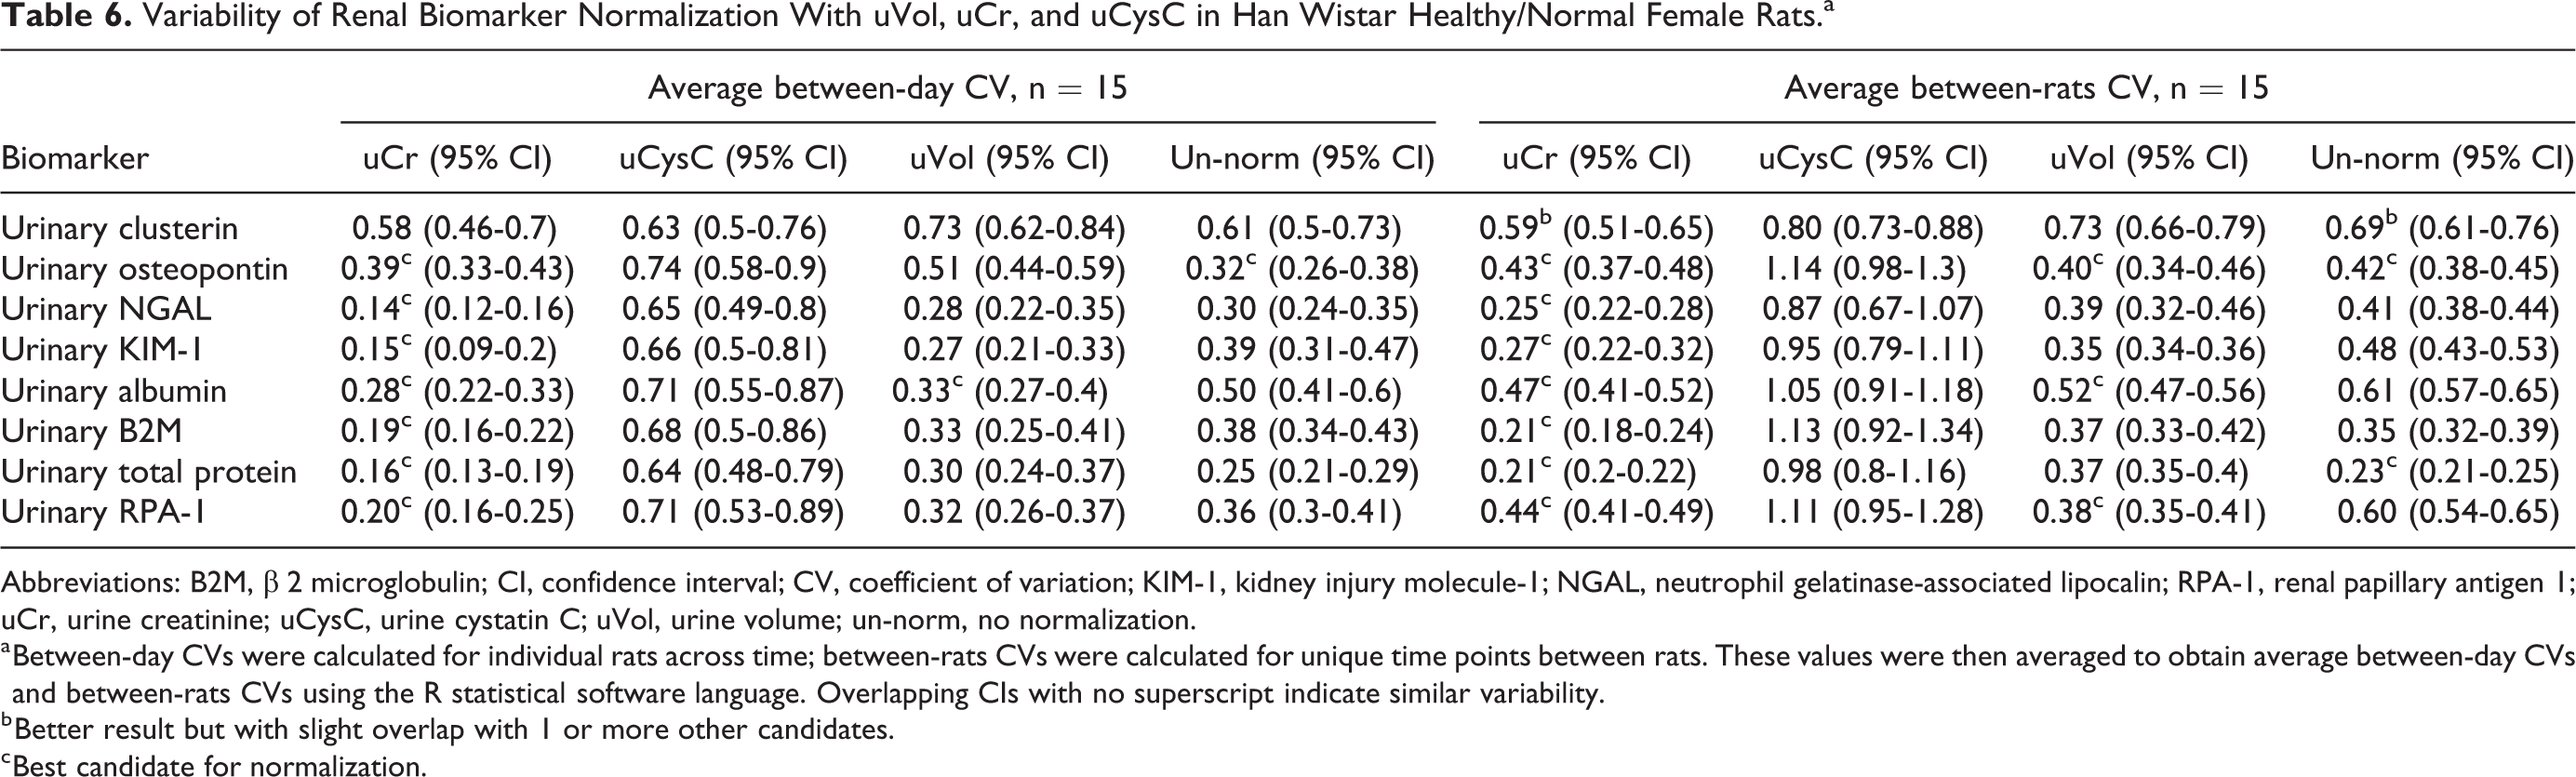
Abbreviations: B2M, β 2 microglobulin; CI, confidence interval; CV, coefficient of variation; KIM-1, kidney injury molecule-1; NGAL, neutrophil gelatinase-associated lipocalin; RPA-1, renal papillary antigen 1; uCr, urine creatinine; uCysC, urine cystatin C; uVol, urine volume; un-norm, no normalization.
a Between-day CVs were calculated for individual rats across time; between-rats CVs were calculated for unique time points between rats. These values were then averaged to obtain average between-day CVs and between-rats CVs using the R statistical software language. Overlapping CIs with no superscript indicate similar variability.
b Better result but with slight overlap with 1 or more other candidates.
c Best candidate for normalization.
Overall, these results suggested that biomarkers showed lesser variability over time, when normalized with Cr, within- and between-individual animals. These results were consistent with what was observed with uCr in Tables 1 and 2.
Sensitivity of Renal Biomarkers is Lower When Normalized With uCysC in Animals With Cisplatin-Induced Renal Injury
Given the fact that these renal biomarkers will typically be utilized in a safety assessment program where renal toxicity is suspected, it was expedient that the effects of uVol, uCr, and uCysC variability on the normalization of the novel renal biomarkers were conducted in animals with renal tubular injury. To this end, we investigated the variability of renal biomarkers when normalized by uVol, uCr, uCysC and when left un-normalized in rats that were administered a single dose of 2.5 mg/kg of cisplatin, a renal tubular toxicant that causes injury and necrosis predominantly in the S3 segment of the proximal tubule. 15
In both sexes, when normalized with uCysC, urinary biomarkers showed poor sensitivity and poor correlation to histopathology at most of the time points examined (Figures 1 –4). Moreover, in females, when renal injury was minimal to nonexistent in histopathology on postdose day 22, other than clusterin, urinary biomarkers appeared overestimated when normalized with uCysC (Figures 3 and 4). These results were consistent with the higher variability associated with uCysC (Tables 1, 2, 5, and 6).
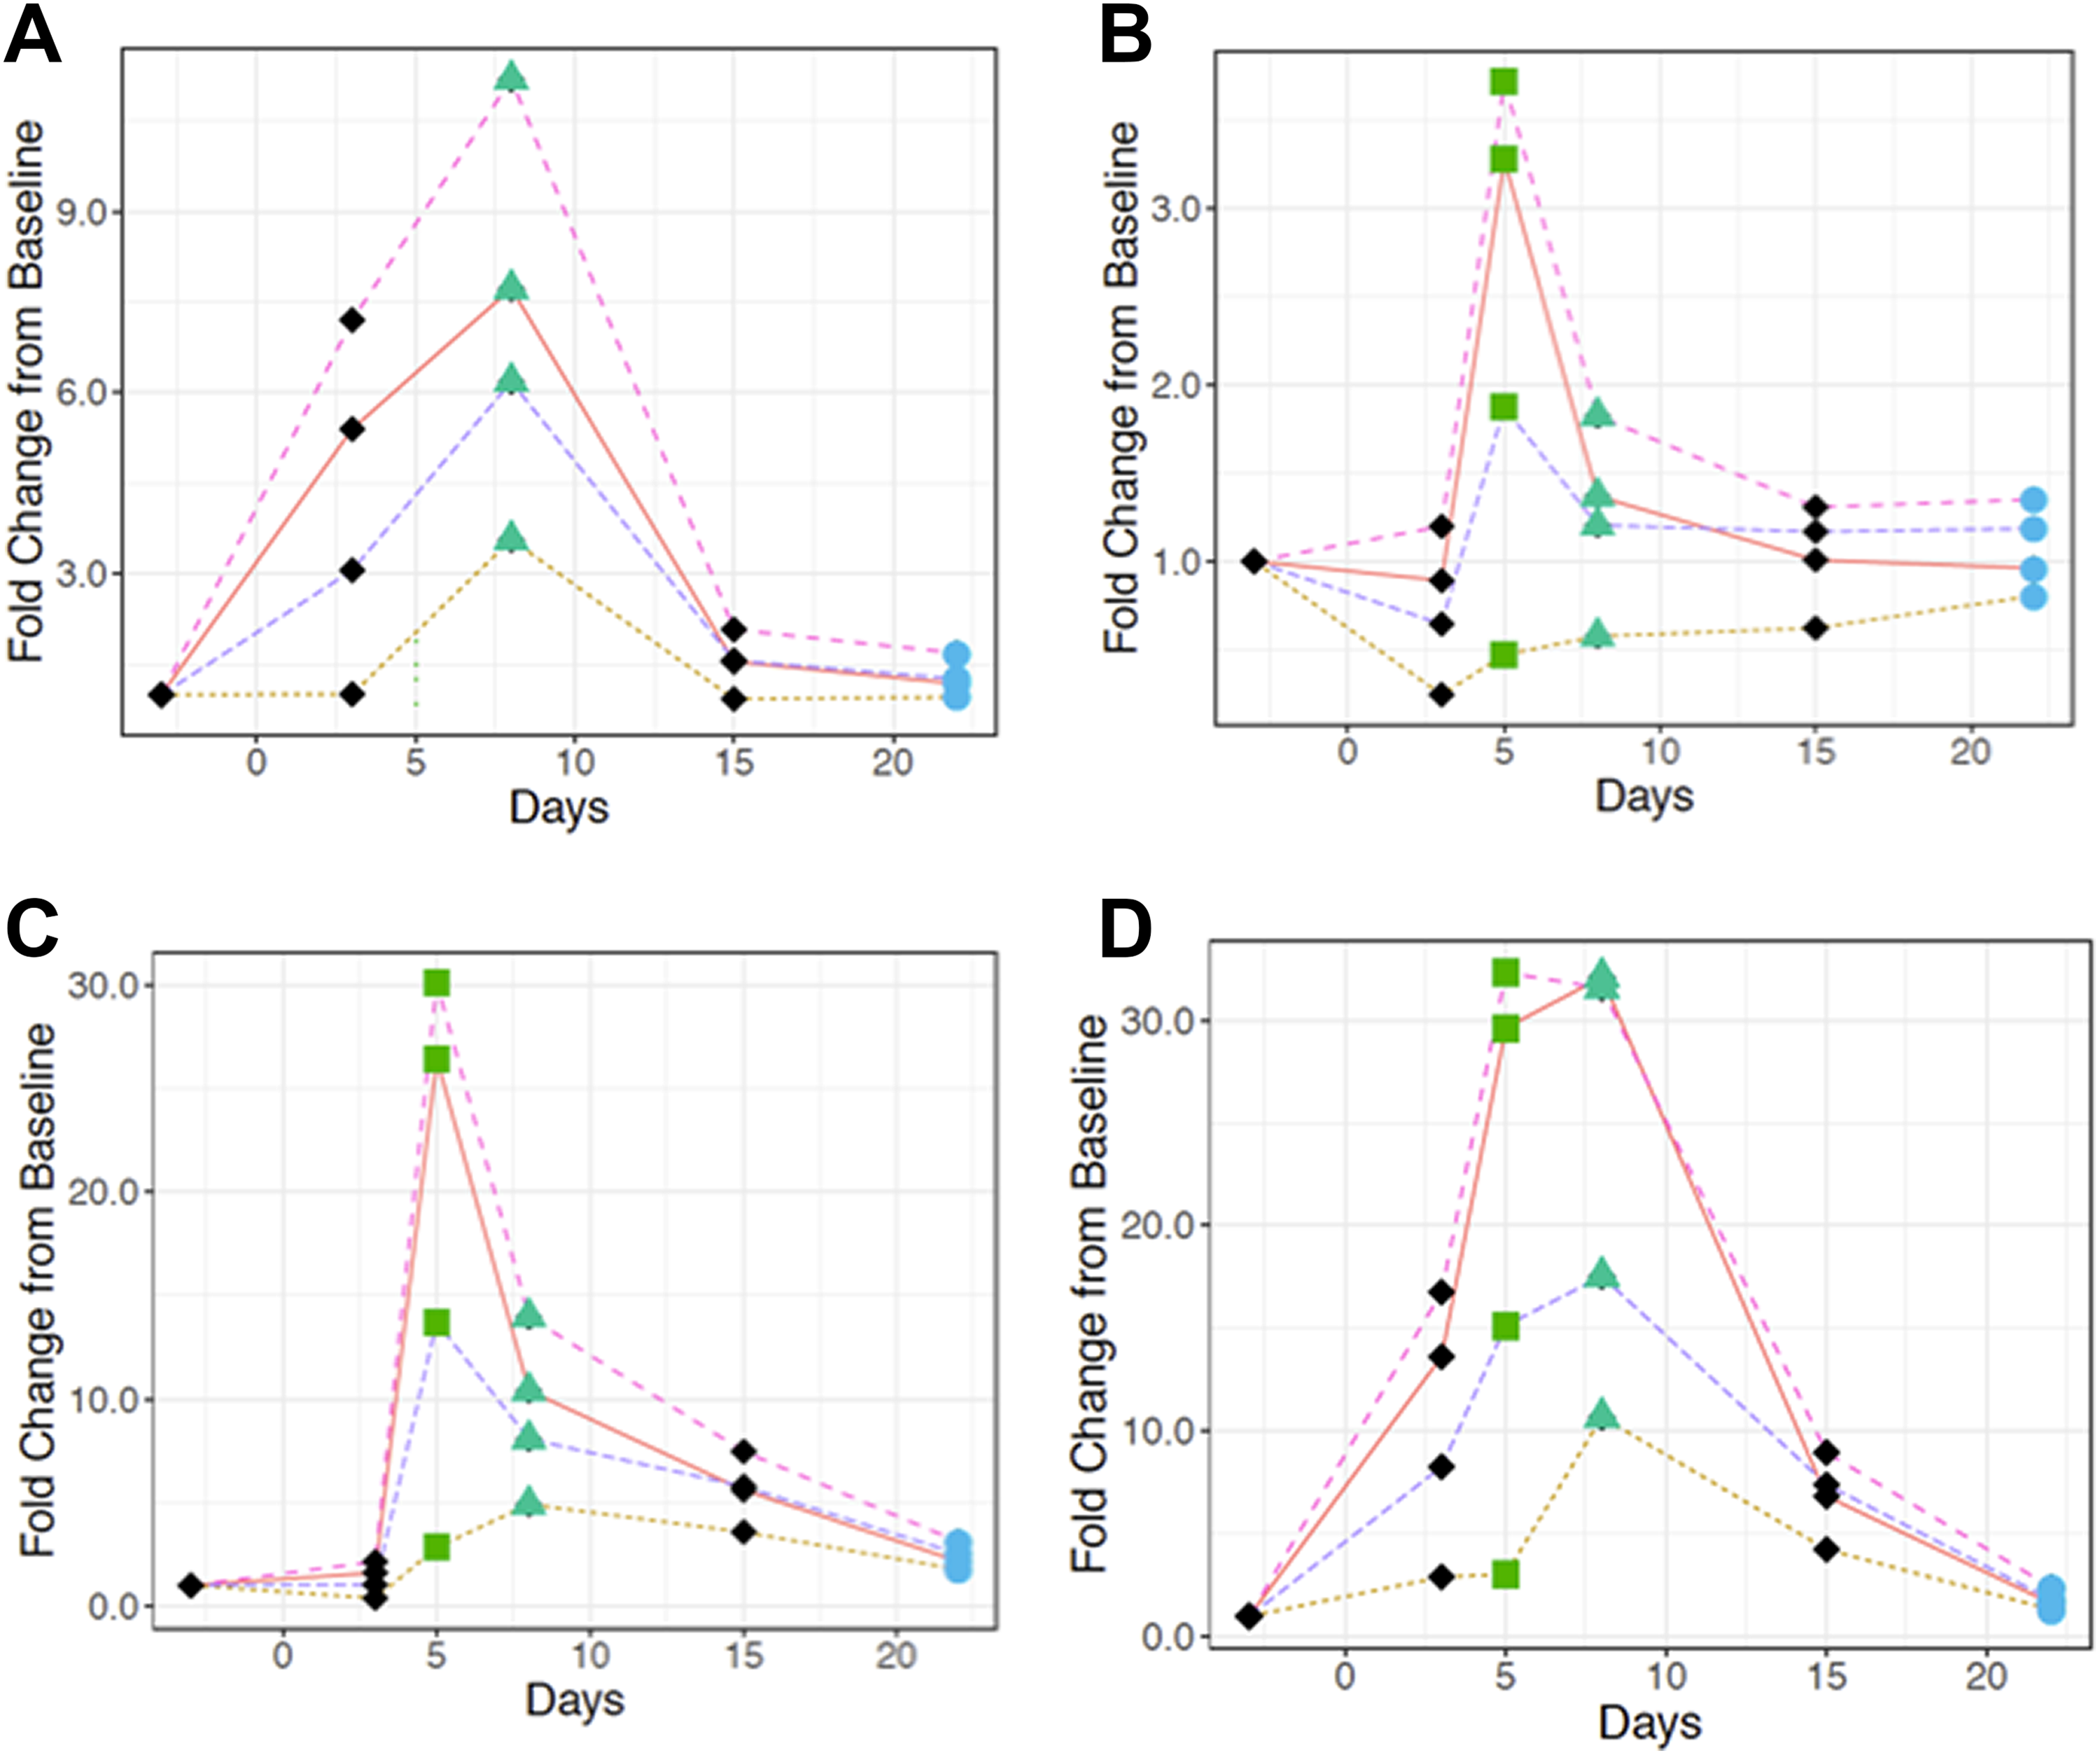
Normalization of urinary (A) albumin, (B) β-2-microglobulin, (C) clusterin, and (D) KIM-1 with urinary volume (magenta broken line), Cr (orange solid line), CysC (yellow dotted line), and un-normalized biomarker (purple broken line) in single-dose 2.5 mg cisplatin-dosed male rats. Average fold changes were calculated for each normalized marker using the statistical software R17. Time points are represented by different shapes to indicate the level of tubular necrosis. The green square on D5, green triangle on D8, and blue circle on D22 represent marked, mild to moderate, and none to minimal renal tubular degeneration/necrosis, respectively. × represents day 5 analysis is absent. Cr indicates creatinine; CysC, cystatin C; KIM-1, kidney injury molecule-1.
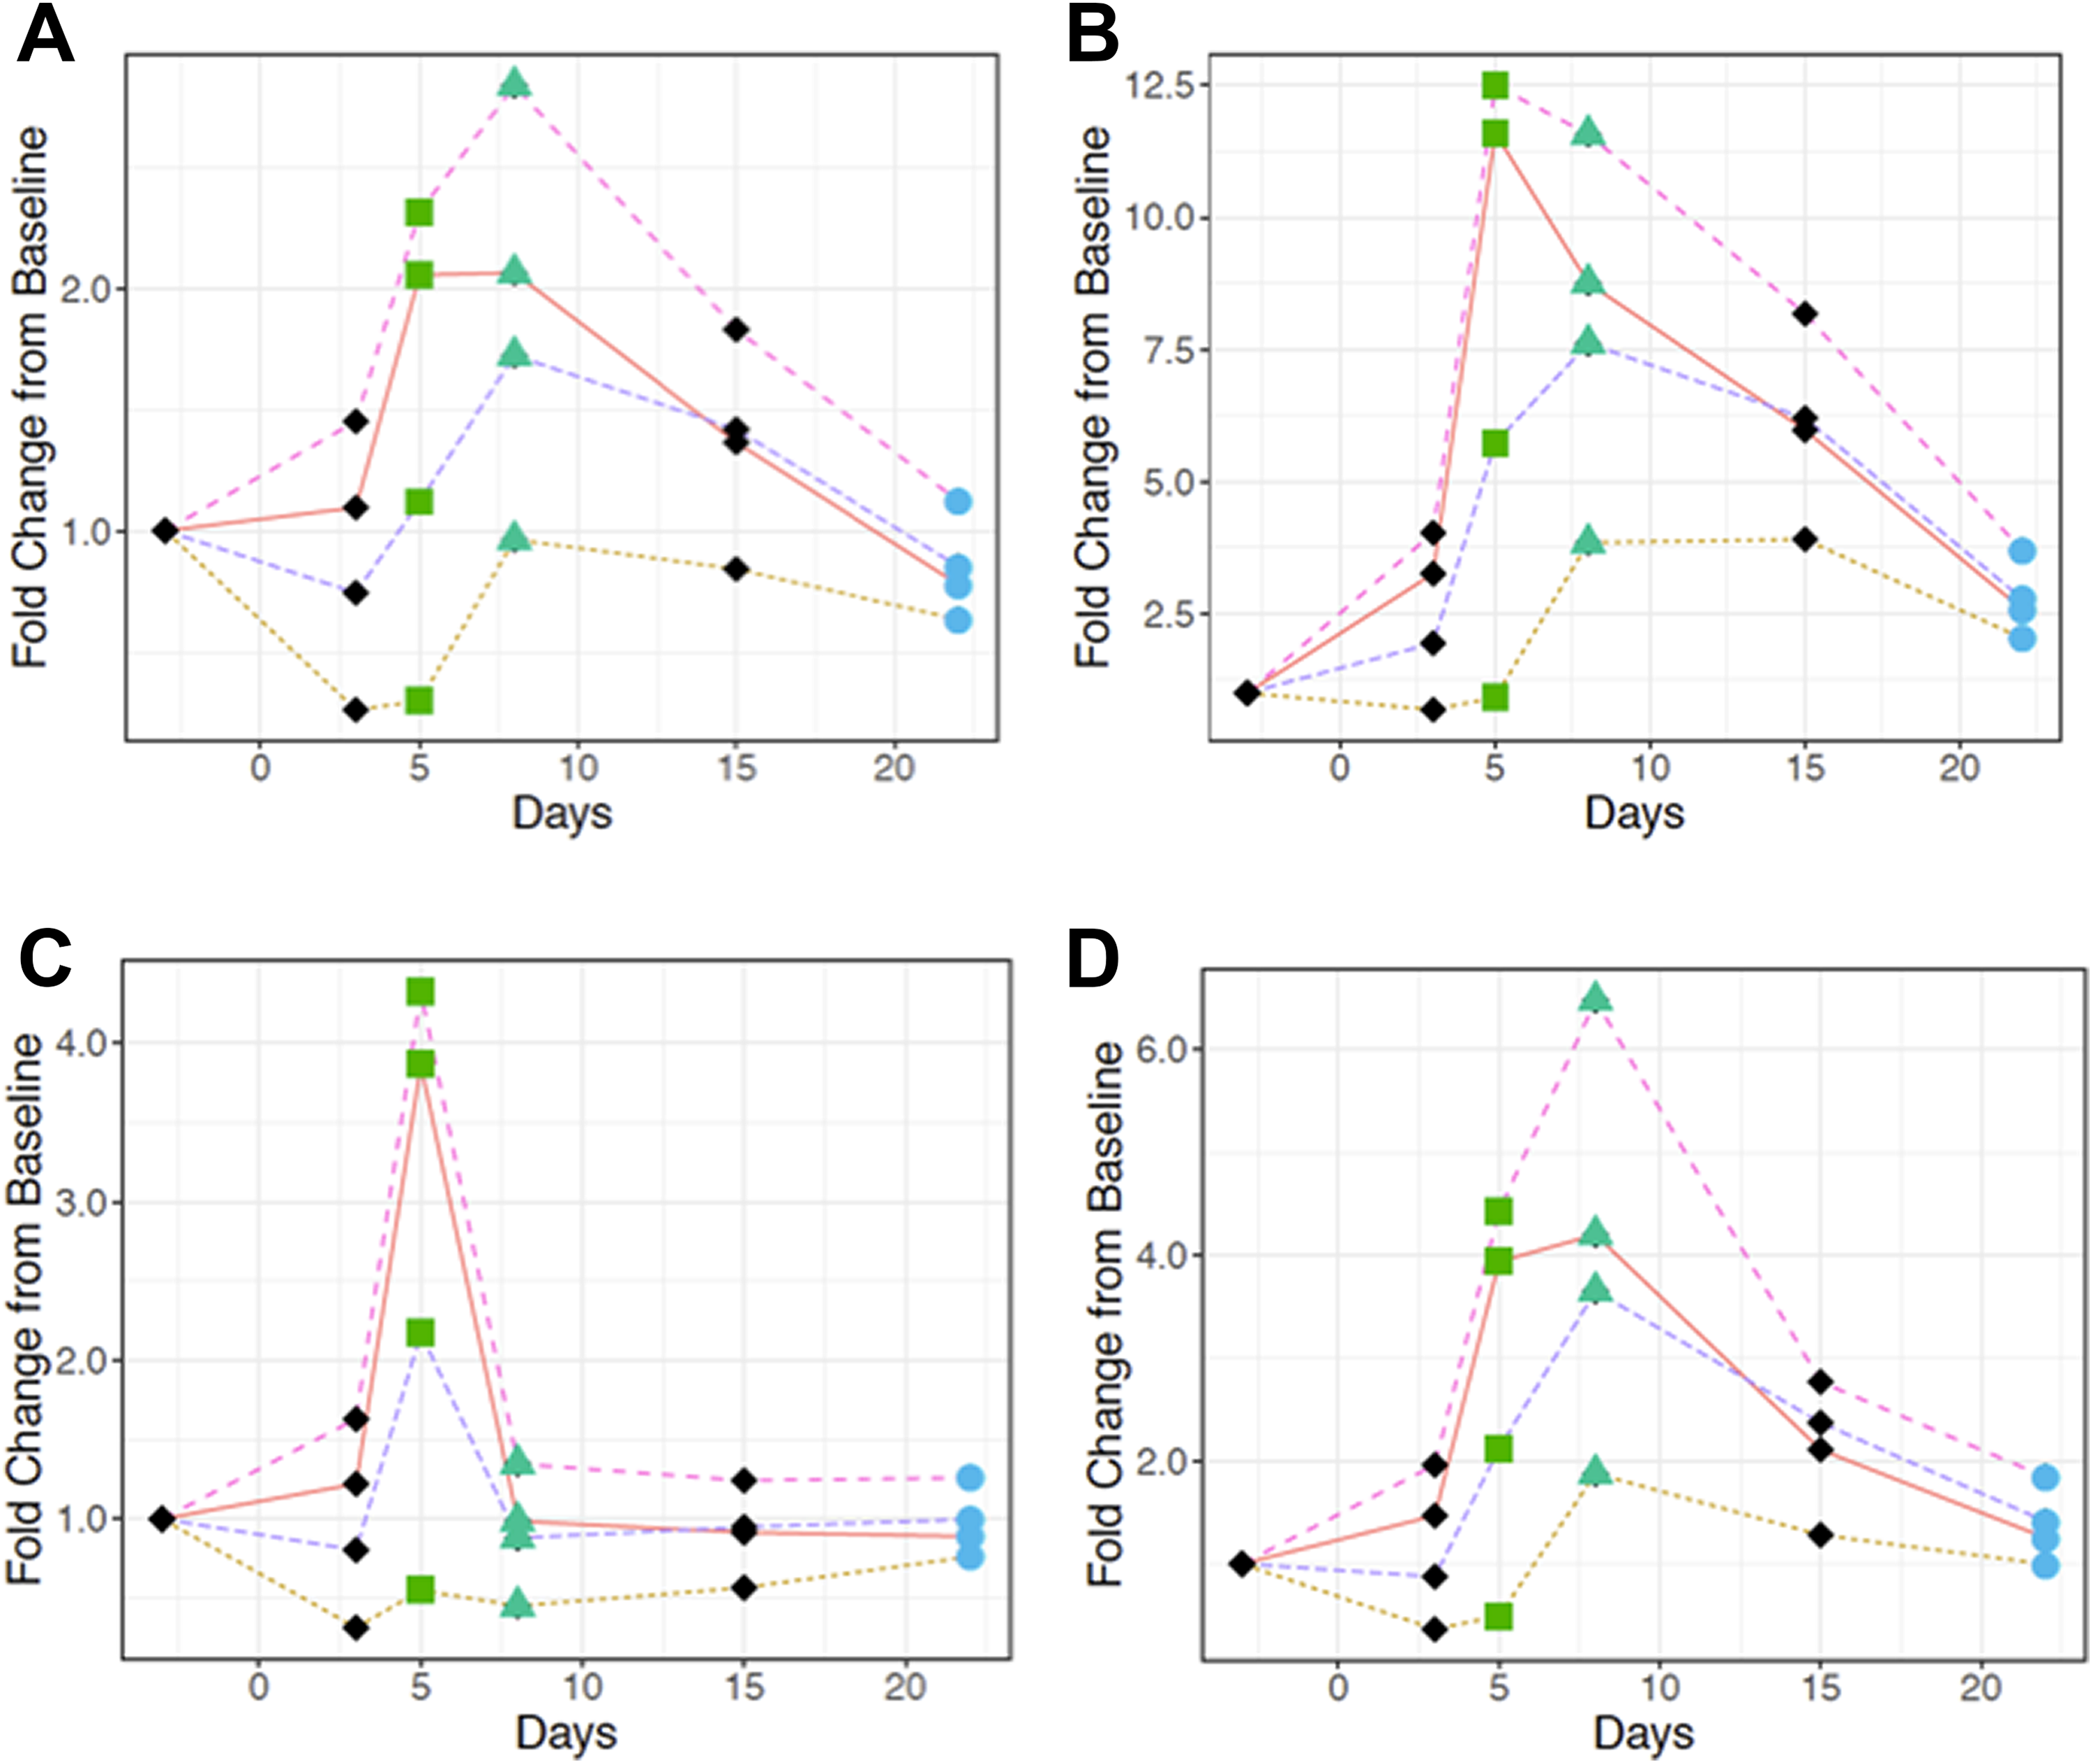
Normalization of urinary (A) NGAL, (B) osteopontin, (C) total protein, and (D) RPA-1 with urinary volume (magenta broken line), Cr (orange solid line), CysC (yellow dotted line), and un-normalized biomarker (purple broken line) in single-dose 2.5 mg cisplatin-dosed male rats. Average fold changes were calculated for each normalized marker using the statistical software R17. Time points are represented by different shapes to indicate the level of tubular necrosis. The green square on D5, green triangle on D8, and blue circle on D22 represent marked, mild to moderate, and none to minimal renal tubular degeneration/necrosis, respectively. Cr indicates creatinine; CysC, cystatin C; NGAL, neutrophil gelatinase-associated lipocalin; RPA-1, renal papillary antigen 1.
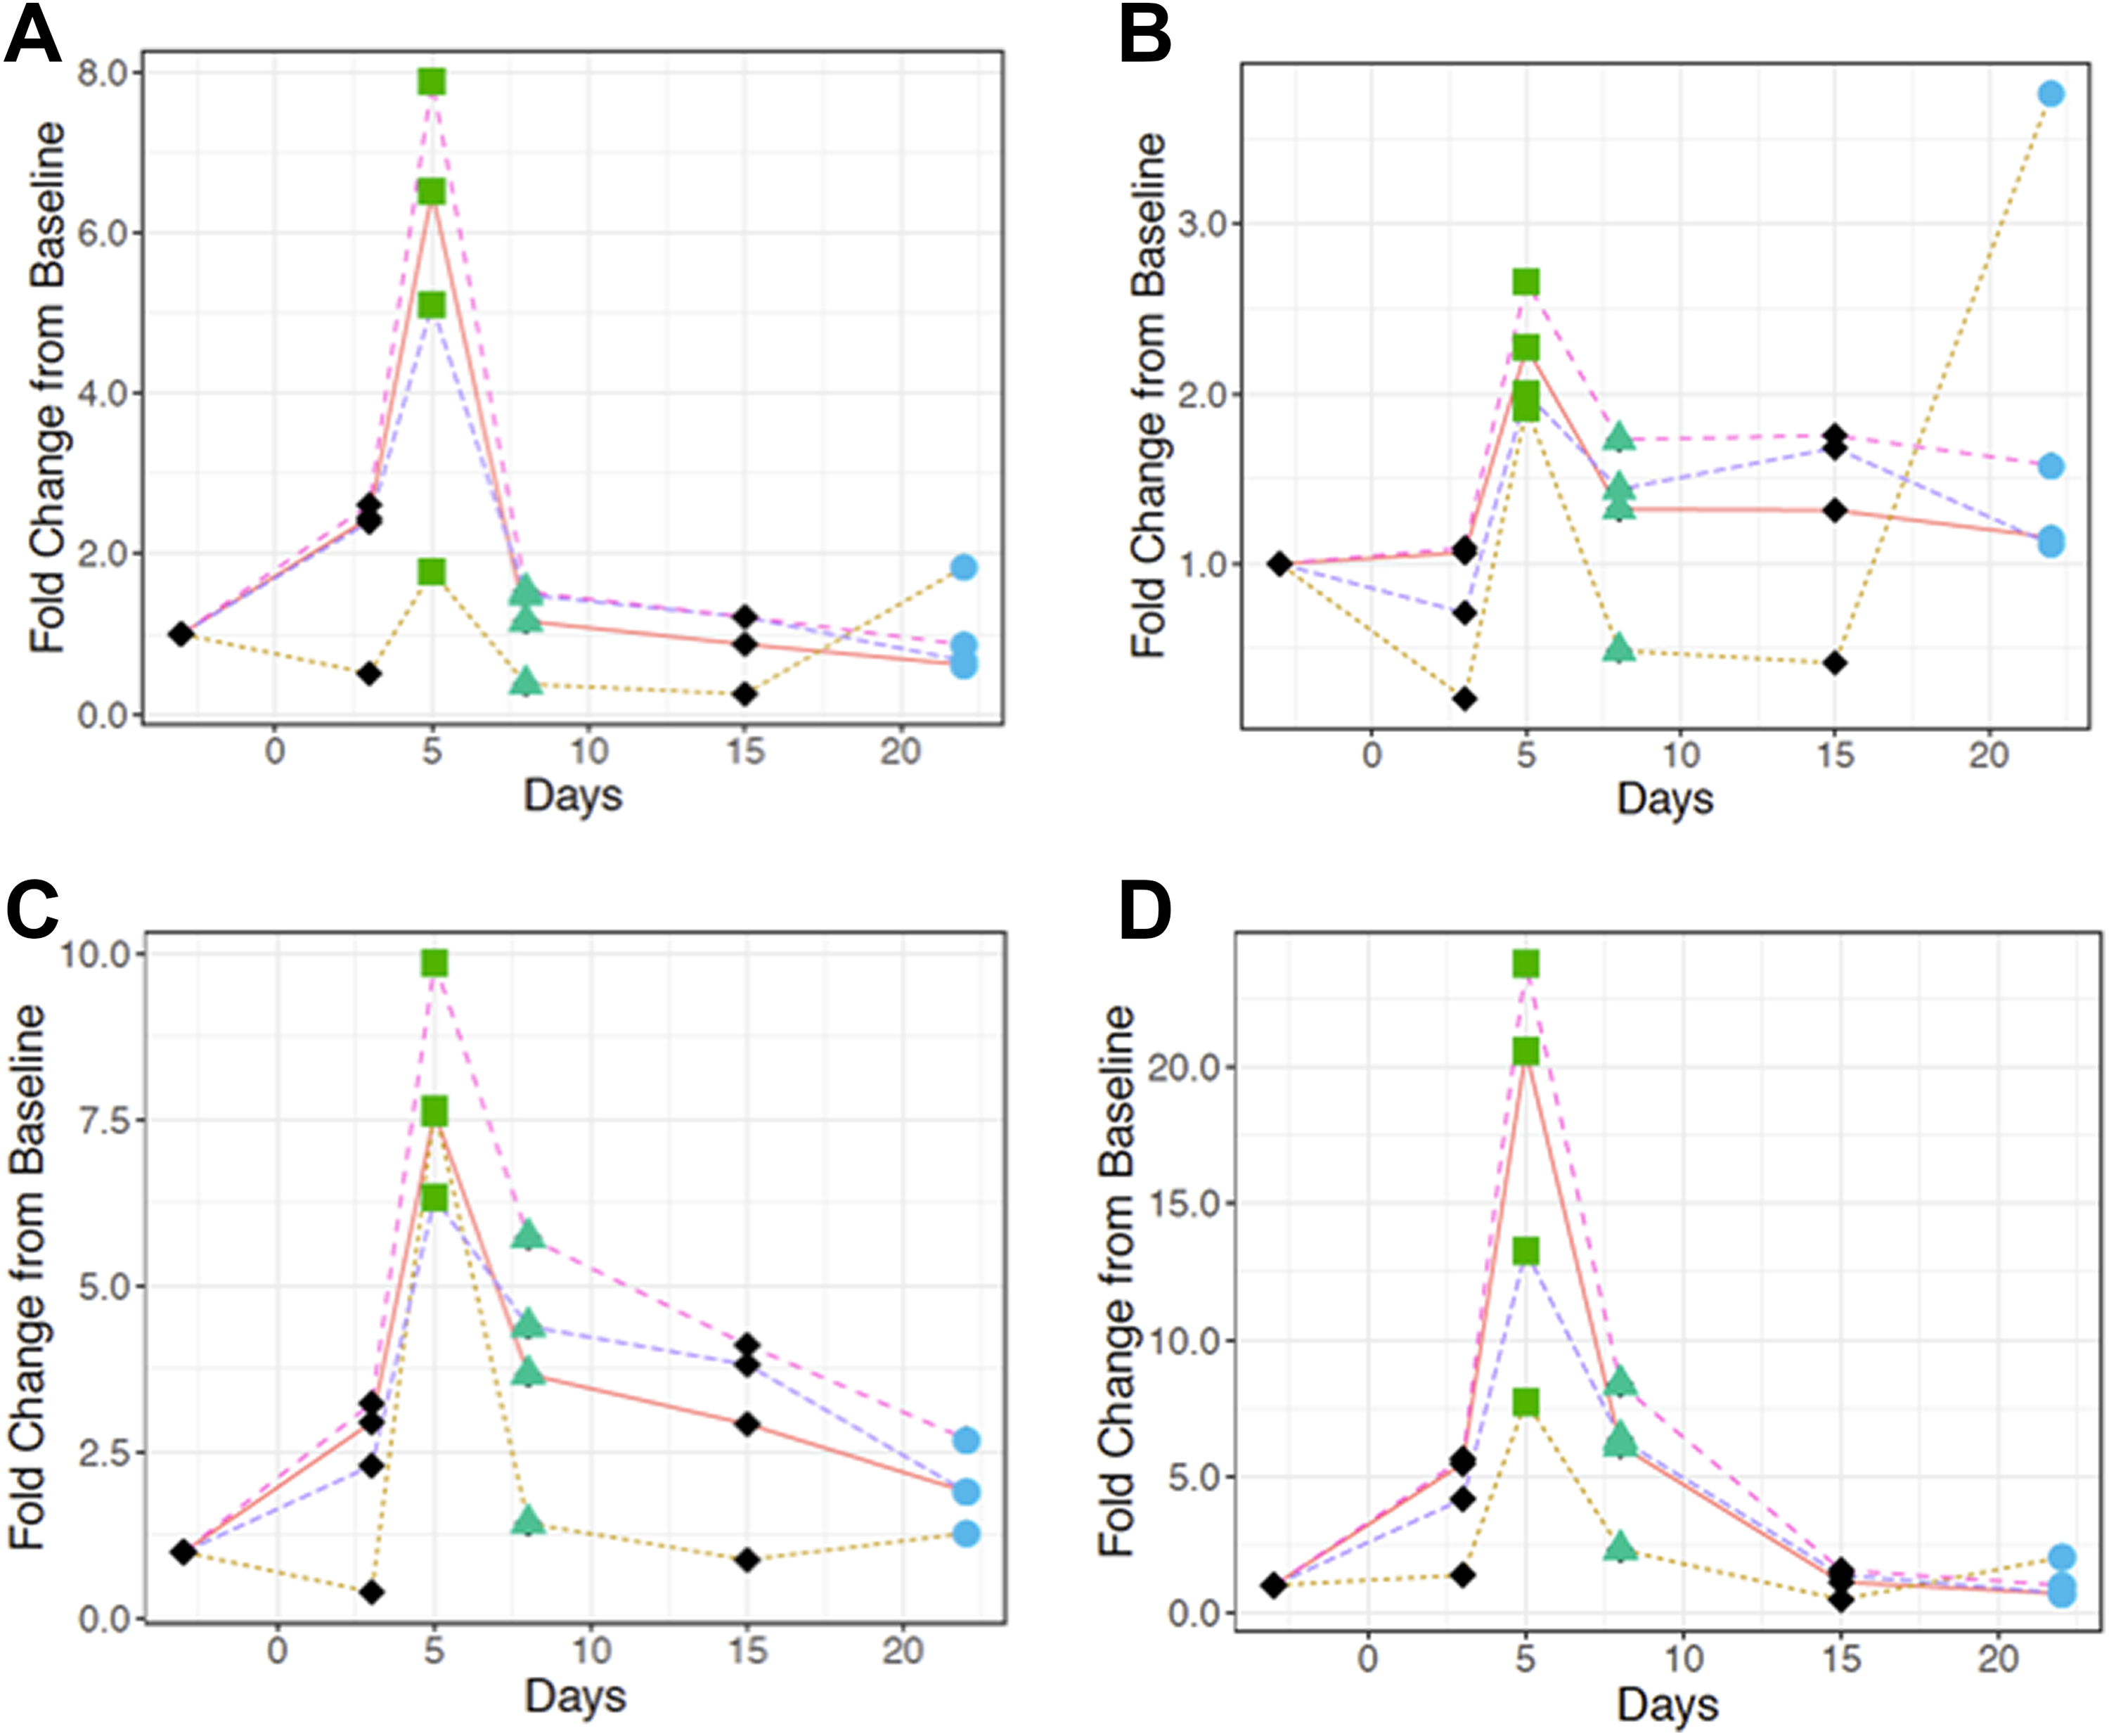
Normalization of urinary (A) albumin, (B) β-2-microglobulin, (C) clusterin, and (D) KIM-1 with urinary volume (magenta broken line), Cr (orange solid line), CysC (yellow dotted line), and unnormalized biomarker (purple broken line) in single-dose 2.5 mg cisplatin-dosed female rats. Average fold changes were calculated for each normalized marker using the statistical software R. 17 Time points are represented by different shapes to indicate the level of tubular necrosis. The green square on D5, green triangle on D8, and blue circle on D22 represent marked, mild to moderate, and none to minimal renal tubular degeneration/necrosis, respectively. Cr indicates creatinine; CysC, cystatin C; KIM-1, kidney injury molecule-1.
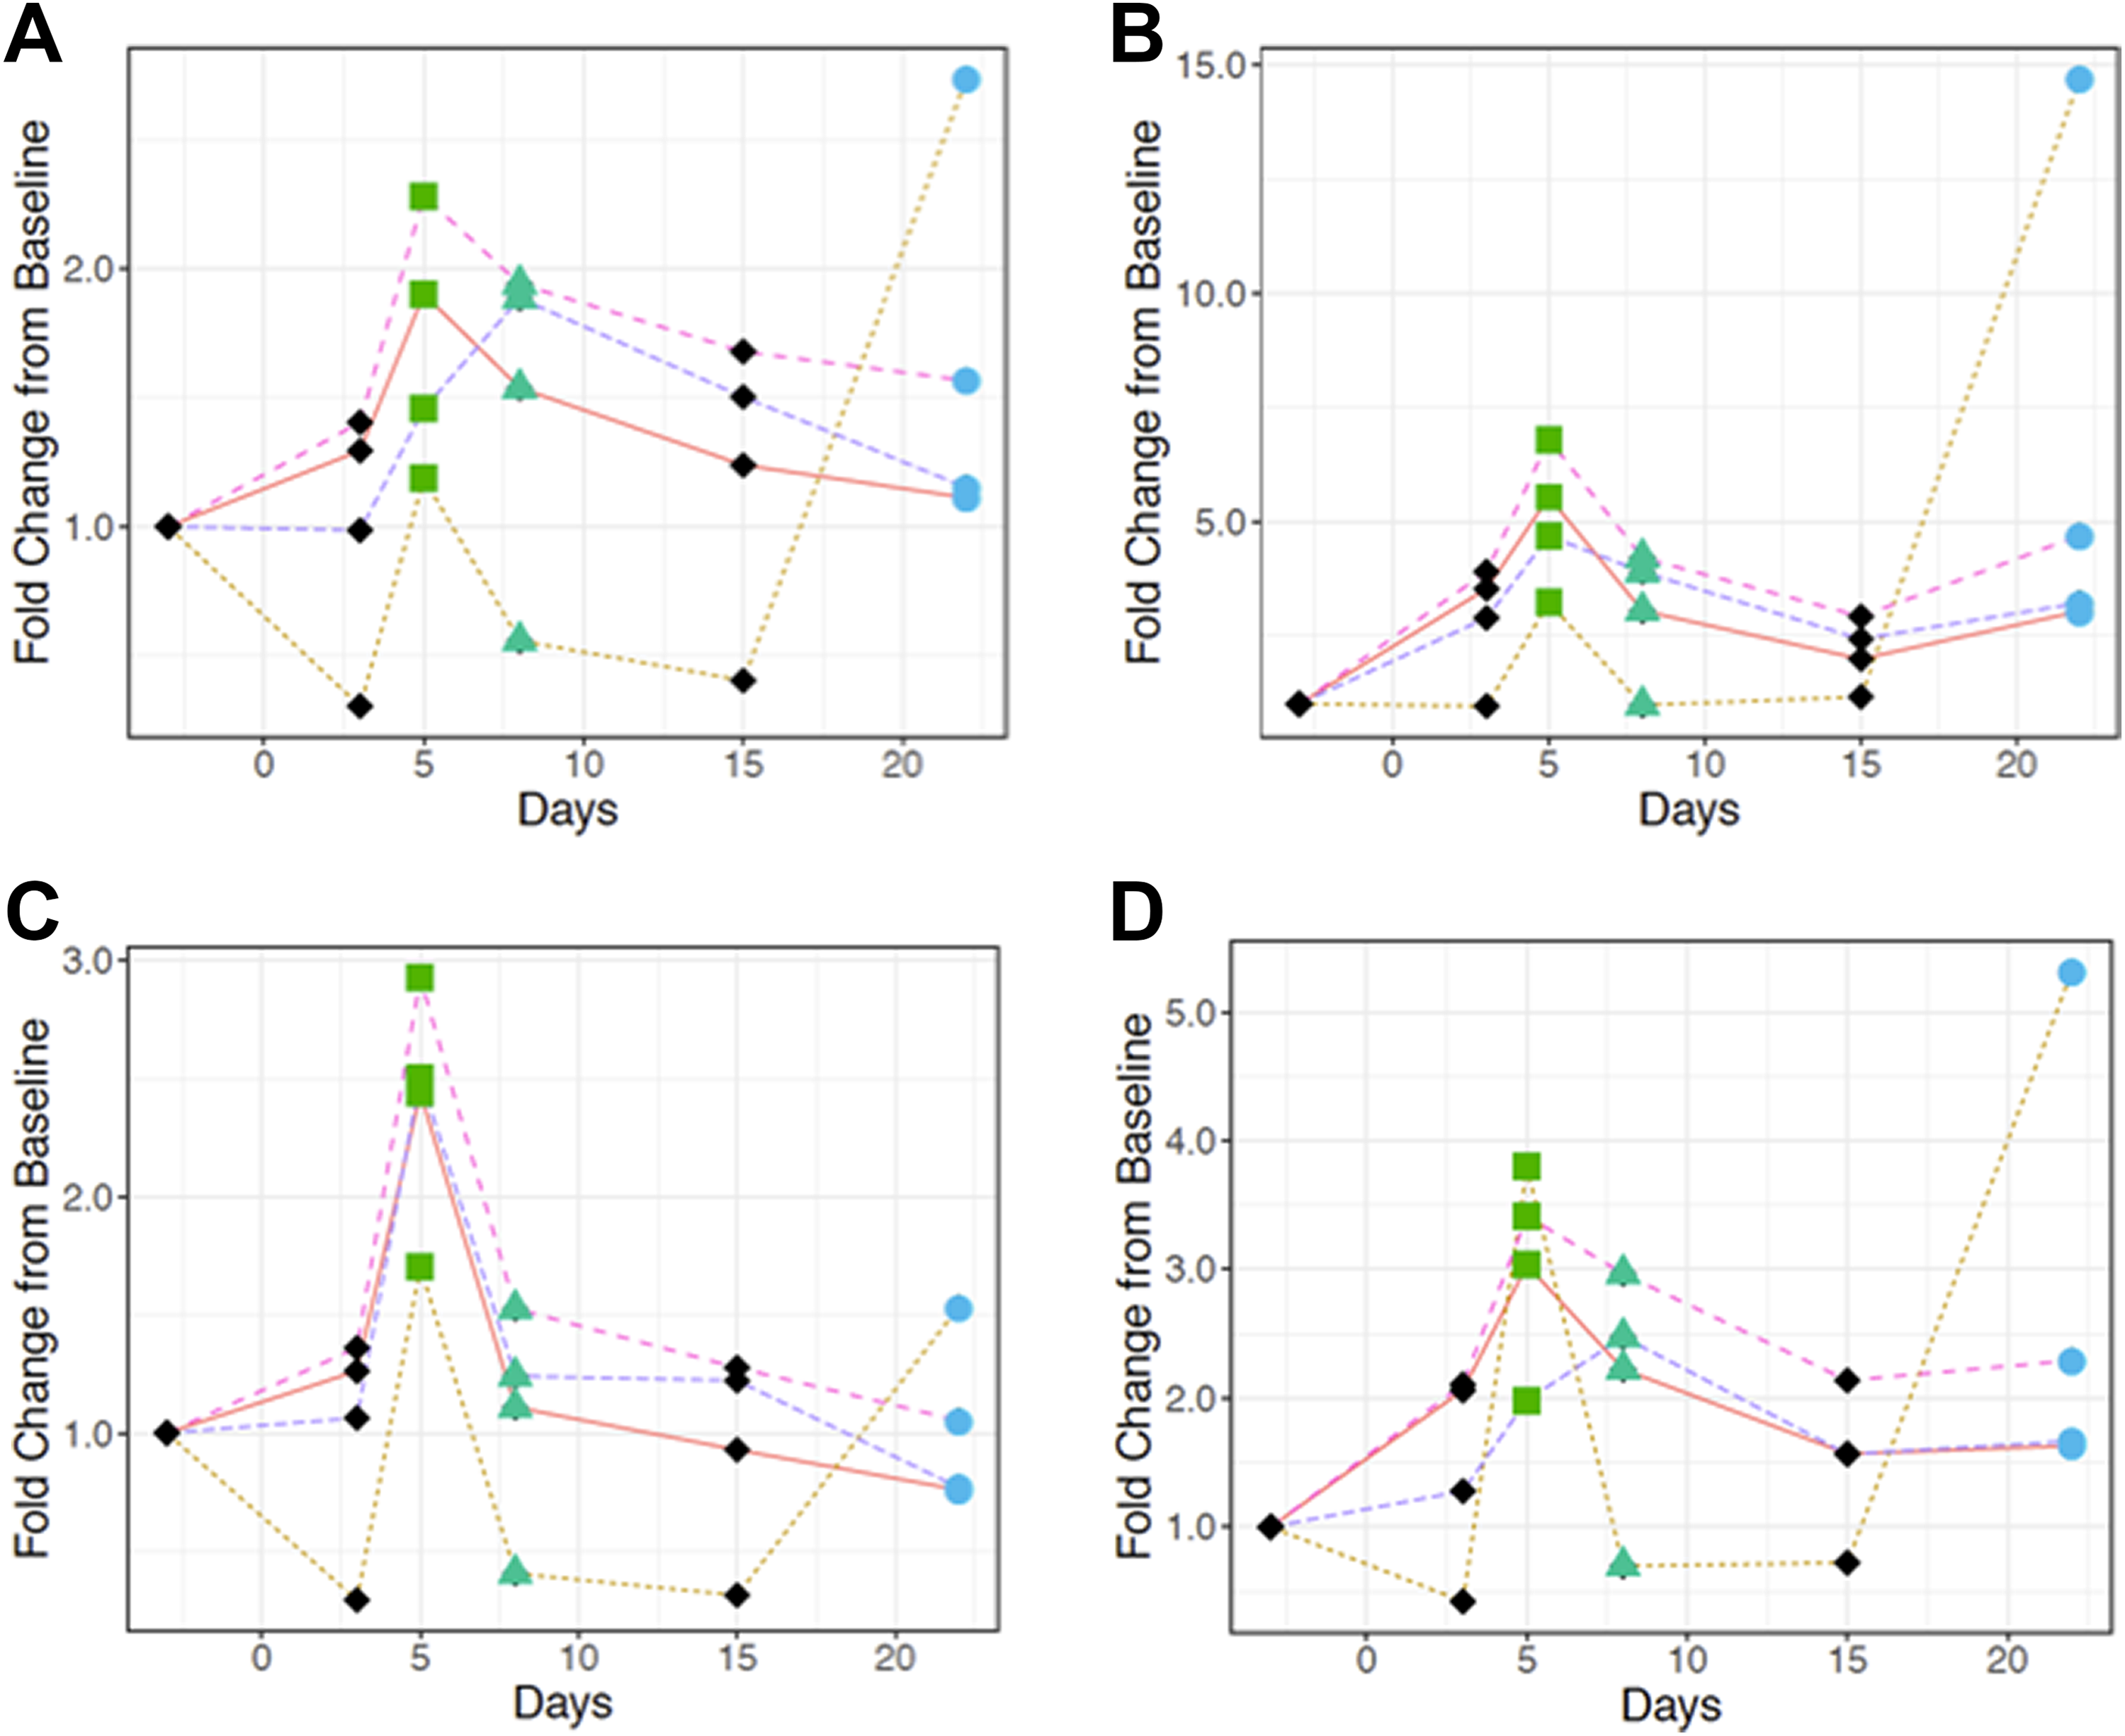
Normalization of urinary (A) NGAL, (B) osteopontin, (C) total protein, and (D) RPA-1 with urinary volume (magenta broken line), Cr (orange solid line), CysC (yellow dotted line), and unnormalized biomarker (purple broken line) in single-dose 2.5 mg cisplatin-dosed female rats. Average fold changes were calculated for each normalized marker using the statistical software R17. Time points are represented by different shapes to indicate the level of tubular necrosis. The green square on D5, green triangle on D8, and blue circle on D22 represent marked, mild to moderate, and none to minimal renal tubular degeneration/necrosis, respectively. Cr indicates creatinine; CysC, cystatin C; NGAL, neutrophil gelatinase-associated lipocalin; RPA-1, renal papillary antigen 1.
Except for few occasions in males (Figures 1A and 2D), biomarkers appeared to have similar sensitivity when normalized by uVol and uCr. When left un-normalized, biomarkers showed good sensitivity and better correlation with histopathology, relative to when normalized by uCysC.
Overall, these results suggested that renal biomarkers appeared to be more variable and less sensitive when normalized with uCysC in animals with renal injury than when normalized with uVol, uCr, or when left un-normalized.
Discussion
One of the most important results of the study was the relative consistency of Cr over time in preclinical studies, suggesting that the variability associated with Cr in humans was not observed in this study. This is likely due to the conditioned environment provided during the study which removed all the different sources of variation (eg, diet, exercise) that may affect Cr concentration in humans. 18 –21 Although weight loss was not observed in this study, there are many preclinical toxicology studies, in which weight fluctuations are observed, mostly due to decreased food intake or in programs where weight loss is one of the pharmacodynamic effects of the drug. As such, we are currently investigating the effect of weight changes on the variability of Cr and CysC in preclinical species (rodents), and how this may affect their use as a normalization factor for renal biomarkers in cases of weight fluctuations.
Another observation from this study was the increased variability associated with uCysC relative to other normalization end points. Cystatin C is an endogenous filtration marker that is being considered as either a potential supplement or a replacement to Cr for GFR estimation and, as a consequence, a normalizing factor for renal biomarkers. The sCr is widely believed to be influenced by gender, age, and the amount of muscle mass, 22 –31 whereas sCysC is believed to remain constant up to 50 years of age in humans. This is because CysC is produced at a constant rate in virtually all nucleated cells and less influenced by age, gender, weight, and muscle mass compared to sCr. 32 –40 As observed in this study, pCr and pCysC were relatively constant throughout the study duration. In contrast, more variability was observed with uCysC in both the control/healthy and the cisplatin-dosed groups in this study. This may be due to variability in the magnitude of renal tubular resorption and metabolism of uCysC, thereby decreasing its value as a potential supplement or replacement for uCr in normalizing renal biomarkers. This variability was particularly evident on postdose day 22 results in dosed females, where concentrations of 6 biomarkers appeared elevated in the absence of renal injury, thereby leading to data misinterpretation.
Normalizing biomarkers with uCysC also appeared less sensitive in capturing renal injury in the cisplatin-dosed groups. This was likely due to the increased urinary excretion of CysC as a result of renal tubular injury.
The 8 urinary
While cisplatin affects the S3 segment of the proximal tubule, we believe this urinary biomarker normalization method is applicable to any type of renal injury. This is because decreased GFR (with consequential decreased excretion of the GFR markers) will ensue irrespective of the location of the renal injury, as even postrenal injury causes decreased GFR 42 ; since the basis for renal biomarker normalization is due to the variability in uVol in response to changes in GFR, this normalization method by a GFR marker is considered applicable to any type of renal injury.
Another surprising result in this study was the observation of the un-normalized urinary biomarkers exhibiting similar to lesser variability (6 of 32 CV readouts for both sexes) relative to uVol normalization (5 of 32 CV readouts for both sexes). This suggests that, other than normalization by Cr, urinary biomarkers might be better analyzed un-normalized, rather than normalizing with uVol in healthy animals. That said, when renal injury is present, normalizing with uVol or uCr seemed more plausible given the increased sensitivity of biomarkers when normalized with these 2 normalizing end points in animals with renal injury.
Overall, the results suggested that Cr appeared to be the best among all the normalization factors examined in this study for normalizing renal biomarkers in rats. Currently, the PSTC is working on qualifying these novel biomarkers in large animal toxicology species (dogs and monkeys). As such, more studies will be conducted in these animal species to further understand the biology of these novel biomarkers, with respect to normalization with uVol, uCr, and uCysC.
In conclusion, we have compared the variability of pCr and pCysC, uCysC and uCr along with uVol, in rats. The results showed that over time, uCr appeared less variable than uVol and uCysC regardless of the sex. When normalized by Cr, urinary biomarkers appeared less variable than when normalized by uVol, uCysC, or when left un-normalized in healthy rats. In animals with renal injury, urinary biomarkers have comparable sensitivity and histopathologic correlation when normalized with uVol and uCr. As such, the authors recommend that uCr should remain the normalization factor for urinary biomarkers in drug-induced kidney injury studies. To our knowledge, this is the first report comparing the variability of uVol, uCysC, and uCr in the context of renal biomarkers’ normalization. We believe this study fills an important gap in the field and will help ensure an optimal drug-induced kidney injury biomarker normalization procedure can be adopted more uniformly in the field.
Supplemental Material
Supplemental Material, DS1_IJT_10.1177_1091581818819791 - Investigating the Value of Urine Volume, Creatinine, and Cystatin C for Urinary Biomarkers Normalization for Drug Development Studies
Supplemental Material, DS1_IJT_10.1177_1091581818819791 for Investigating the Value of Urine Volume, Creatinine, and Cystatin C for Urinary Biomarkers Normalization for Drug Development Studies by Adeyemi O. Adedeji, Tony Pourmohamad, Yafei Chen, Jennifer Burkey, Catherine J. Betts, Susan J. Bickerton, Manisha Sonee, and James E. McDuffie in International Journal of Toxicology
Supplemental Material
Supplemental Material, DS2_IJT_10.1177_1091581818819791 - Investigating the Value of Urine Volume, Creatinine, and Cystatin C for Urinary Biomarkers Normalization for Drug Development Studies
Supplemental Material, DS2_IJT_10.1177_1091581818819791 for Investigating the Value of Urine Volume, Creatinine, and Cystatin C for Urinary Biomarkers Normalization for Drug Development Studies by Adeyemi O. Adedeji, Tony Pourmohamad, Yafei Chen, Jennifer Burkey, Catherine J. Betts, Susan J. Bickerton, Manisha Sonee, and James E. McDuffie in International Journal of Toxicology
Footnotes
Acknowledgments
The authors would like to thank L. Song, M. Pinches, L. Burdett, H. Thomas, N. Derbyshire, H. B. Jones, and M. Moores for their technical assistance. The authors would also like to thank Tanja S. Zabka for her critical review of the manuscript.
Author Contribution
Adedeji, A. O. contributed to conception, design, data analysis and interpretation, and drafting the manuscript. Pourmohamad, T. and Chen, Y. contributed to design, data analysis, and drafting the manuscript. Burkey, J., Betts, C. J., and Bickerton, S. J., contributed to data acquisition, drafting the manuscript, and critically revised the manuscript. Sonee, M. contributed to design, drafting the manuscript, and critically revised the manuscript. McDuffie, J. E. contributed to conception, design, data interpretation, drafting the manuscript, and critically revised the manuscript. All authors gave final approval and agreed to be accountable for all aspects of work ensuring integrity and accuracy.
Declaration of Conflicting Interests
The author(s) declared no potential conflicts of interest with respect to the research, authorship, and/or publication of this article.
Funding
The author(s) received no financial support for the research, authorship, and/or publication of this article.
Supplemental Material
Supplemental material for this article is available online.
References
Supplementary Material
Please find the following supplemental material available below.
For Open Access articles published under a Creative Commons License, all supplemental material carries the same license as the article it is associated with.
For non-Open Access articles published, all supplemental material carries a non-exclusive license, and permission requests for re-use of supplemental material or any part of supplemental material shall be sent directly to the copyright owner as specified in the copyright notice associated with the article.