
Abstract
Predicting drug–drug interactions (DDIs) is an important step during drug development to avoid unexpected side effects. Cytochrome P450 (CYP) 3A4 is the most abundant human hepatic phase I enzyme, which metabolizes >50% of therapeutic drugs. Therefore, it is essential to test the potential of a drug candidate to induce CYP3A4 expression or inhibit its activity. Recently, 3-dimensional (3-D) mammalian cell culture models have been adopted in drug discovery research to assess toxicity, DDIs, and pharmacokinetics. In this study, we applied a human 3-D spheroid culture protocol using HepaRG cells combined with liquid chromatography-tandem mass spectrometry (LC-MS/MS) to assess its ability to predict CYP3A4 inhibition. Levels of midazolam, a specific substrate of CYP3A4, were used to determine the long-term metabolic capacity of CYP3A4. Midazolam was decreased in the 3-D HepaRG culture system by ∼80% over 7 days, whereas its primary metabolite, 1-hydroxymidazolam, increased by ∼40%. Next, we assessed hepatotoxicity by determining the cytotoxicity of known hepatotoxicants in HepaRG spheroids, HepG2 cells, and primary human hepatocytes. Significant differences in cytotoxicity were detected in the system using 3-D HepaRG spheroids. These results suggest that 3-D HepaRG spheroids are a good model for prediction of CYP inhibition and hepatotoxicity in screening of early drug candidates.
Introduction
Drug–drug interactions (DDIs) occur when 2 or more drugs react with each other in the body, which may cause unexpected side effects. Five cytochrome P450 (CYP) enzymes, CYP3A4, CYP1A2, CYP2D6, CYP2C9, and CYP2C19, contribute to the metabolism of >90% of marketed drugs metabolized by CYP enzymes; the inhibition of their catalytic activity is a major cause of DDIs. 1 In particular, CYP3A4 is the most important enzyme of the CYP3A subfamily isoforms, which include CYP3A4, CYP3A5, CYP3A7, and CYP3A43, 2 as it is an abundant phase I enzyme found in both the liver and the small intestine. 3 –5 Drug bioavailabilities are significantly influenced by both the induction and the inhibition of CYP3A4. 6 CYP3A4 has been found to be responsible for the metabolism of >50% of all marketed drugs. 7,8 For this reason, the early and correct prediction of CYP3A4 inhibition and induction is important to decrease the failure rate of potential drug candidates.
Continued technological improvements using in vitro methodologies to evaluate CYP activity in the pharmaceutical industry are reducing the need for the amount of drug required during testing, thereby reducing the time and cost associated with these evaluations. However, a large gap between in vitro and in vivo results remains intact because current in vitro assay systems do not represent the complexity of in vivo conditions. To address this limitation, drug discovery research has shifted to using 3-dimensional (3-D) cell culture systems, and collaborations between tissue engineers and cell biologists have helped to bridge the gap between conventional in vitro tests and animal models. 9 –11 In addition, diverse applications of 3-D cell culture models during drug screening have been recommended. 12,13 For example, 1 study found that 3-D human hepatocyte cell cultures had advantages over 2-dimensional (2-D) cell cultures because the cells were able to maintain a high viability and stable expression of metabolic enzymes for longer periods. 14
HepaRG cells are considered to be a good alternative to primary human hepatocytes (PHHs) in drug metabolism and toxicity studies. 15 The differentiated HepaRG cell line consists of equal numbers of hepatocyte-like cells and biliary cells, where phase I and II enzymes are reportedly expressed. 16 –18 Advances in 3-D culture systems using HepaRG cells have enabled investigators to obtain similar information to that derived from in vivo tests, and several 3-D culture systems have been developed to improve their functional and structural efficacy. 19 –21 During drug discovery, it is important to predict the potential of a new compound to induce CYP3A4 expression or inhibit its activity. In this study, we assessed a new method of quantifying CYP3A4 activity and inhibition under conditions similar to those found in vivo. We used 3-D HepaRG spheroids formed via the hanging drop system to predict the effects of xenobiotics on CYP3A4 activity, which was the first attempt to measure CYP3A4 activity using liquid chromatography-tandem mass spectrometry (LC-MS/MS) in 3-D spheroids.
Drug-induced induction or inhibition of CYP3A4 reportedly induces hepatotoxicity. 22 However, such predictions are problematic because established in vitro and cell-based models do not mimic the human liver. Although PHHs are the gold standard for drug metabolism and hepatotoxicity studies, their utility is limited by among-donor variability and decreased CYP enzyme levels compared to in vivo. 23 –25 For this reason, HepaRG spheroids are used for in vitro drug metabolism and hepatotoxicity studies. 18,26,27 Various types of 3-D HepaRG spheroids are available.
In this study, we assessed the CYP3A4 inhibition and the hepatotoxicity of hepatoxicants using 3-D HepaRG spheroids, which express metabolic enzymes during prolonged differentiation culture. We especially focused to evaluate the drug-induced CYP3A4 inhibition and chronic hepatotoxicity by high-throughput system during the early stage of drug discovery. We expect that this study will provide good information to researchers who are interested in the prediction of CYP enzyme inhibition and drug-induced chronic hepatotoxicity using a biomimic 3-D culture system.
Materials and Methods
Cell Culture
The HepG2 human hepatoma cell line was obtained from the American Type Culture Collection (Manassas, Virginia) and maintained in Dulbecco modified Eagle medium (Hyclone, Logan, Utah) supplemented with 10% fetal bovine serum (Hyclone) and 100 units/mL penicillin-streptomycin solution (Hyclone). Primary human hepatocytes (BD Gentest Cryo Human Hepatocytes, Donor No HMC 417, HH140, and HH153; BD Biosciences, Erembodegen, Belgium) were plated in collagen-I-coated culture plates (Corning, Corning) using a Gentest High Viability CryoHepatocyte Recovery Kit (CAT no 454534; Corning, Corning, New York) following the manufacturer’s instructions. Undifferentiated human HepaRG cells (Biopredic International, Saint-Gregoire, France) were maintained according to the supplier’s recommendations. Briefly, cryopreserved cells were thawed and cultured in basal hepatic cell medium (MIL700; Biopredic International) supplemented with ADD710 (Biopredic International). Confluent HepaRG cells were detached with 0.05% trypsin-EDTA. The cells were maintained in the same medium, which was refreshed every 2 to 3 days. All cultures were maintained at 37°C with 95% humidity and 5% carbon dioxide.
Three-Dimensional Culture of Cells
The 3-D hanging drop cultures were formed using the GravityPLUS Hanging Drop System (InSphero AG, Zurich, Switzerland). HepaRG and HepG2 cells were seeded into GravityPLUS plates in their respective growth media and allowed to mature for 3 days in the hanging drops. The spheroids were transferred to GravityTRAP assay plates by adding 70 μL of fresh media to each well of the GravityPLUS plates. After 3 days, the medium was replaced with differentiation medium supplemented with ADD710 (Biopredic International), causing the spheroids to undergo hepatocyte differentiation. The differentiation medium was replaced every 3 days until experimentation.
Viability Assay
Cell viability of 3-D HepaRG spheroid, HepG2 cell, and PHHs was assessed by determining the adenosine triphosphate content of viable cells with the CellTiter-Glo Luminescent Cell Viability Assay (Promega, Stockholm, Sweden). The assay was performed according to the manufacturer’s protocol. In total, 50 μL of CellTiter-Glo reagent was added to each GravityPLUS well-containing 50 μL of cell culture medium and a spheroid. For the assay of 2-D monolayer-cultured HepG2 cell and PHHs, 100 μL of CellTiter-Glo reagent was added to each well containing 100 μL of cell culture medium. The contents were mixed for 2 minutes at room temperature on an orbital shaker to induce cell lysis and then incubated at room temperature for 10 minutes. Lysed solutions (100 μL) were transferred into clear 96-well plates. Luminescence was measured using a plate reader (M1000pro; Tecan, Mannedorf, Switzerland).
Real-Time Polymerase Chain Reaction
The 2-D monolayer-cultured cells or 3-D spheroids were pooled via centrifugation. Total RNA was extracted using a MagaZorb Total RNA Mini-Prep Kit (Promega). The reactions were conducted in a MicroAmp Fast Optical 96-Well Reaction Plate sealed with MicroAmp optical adhesive film (Life Technologies, Carlsbad, California). Primer pairs used were as follows: CYP1A2 (forward) 5′-AGCAGTCCCTCCACATTT-3′ and (reverse) 5′-CATAGACACAGAAAGTAG-3′, CYP2C9 (forward) 5′-CTCACATTTTCCCTTCCC-3′ and (reverse) 5′-ACAGAGTATGGAGAATAG-3′, CYP2A19 (forward) 5′-GATTTGTGTGGGAGAGGG-3′ and (reverse) 5′-CAGGAGTTGTGTCAAGGT-3′, CYP2D6 (forward) 5′-TGGCTGACCTGTTCTCTG-3′ and (reverse) 5′-CGATCTCCTGTTGGACAC-3′, CYP3A4 (forward) 5′-CTGGGTGAGAGTGAGACT-3′ and (reverse) 5′-GAAAGGAGATGGGCTGAA-3′, and β-actin (forward) 5′-GCGAGAAGATGACCCAGA-3′ and (reverse) 5′-ATCACGATGCCAGTGGTA-3′. Reverse transcription-quantitative polymerase chain reaction (RT-qPCR) was performed using Verso SYBR Green 1-Step qRT-PCR Low ROX Mix (Thermo Scientific, Waltham, Massachusetts) on a 7500 Fast Real-Time PCR System (Applied Biosystems, Foster City, California). Expression was analyzed using the ΔΔCT normalized to β-actin. 28
Measurement of CYP3A4 Activity in 3-D HepaRG Spheroids and in Vitro Enzymatic Assay
In vitro CYP3A4 activity was assessed using the P450-Glo screening system with luciferin-isopropyl acetal (IPA; Promega, Mannheim, Germany) according to the manufacturer’s protocol. 29 Briefly, luciferin-IPA (3 μmol/L) was incubated at 37°C with a CYP3A4 enzyme and inhibitors or its vehicle for 10 minutes. Reactions were then initiated by adding the NADPH regeneration system and incubated at 37°C for 10 minutes. The luciferin detection reagent (50 μL) was added at room temperature for 20 minutes. Luminescence was measured using a plate reader (M1000pro; Tecan).
A modified protocol of the P450-Glo screening system was applied for the measurement of CYP activity in 3-D HepaRG spheroids. Three-dimensional HepaRG spheroids were washed twice with phosphate-buffered saline and incubated with 30 μL of cell culture medium containing the CYP3A4 substrate luciferin-IPA. After a 1-hour incubation at 37°C, whole medium containing 3-D HepaRG spheroids was transferred to a white opaque 96-well luminometer plate (Corning), and 25 μL of luciferin detection reagent was added. The reaction mixture was triturated with a pipette to ensure cell lysis. After a 20-minute incubation at room temperature, luminescence was measured using a plate reader (M1000pro; Tecan).
Sample Preparation
An Oasis HLB microelution 96-well extraction plate (Waters, Milford, Massachusetts) was conditioned with 200 μL of methanol and equilibrated with 200 μL of distilled water. Then, 50 μL of culture medium and 20 μL of imipramine working solution (20 ng/mL imipramine in distilled water) were loaded into the extraction plate. To remove matrix interference, the extraction plate was washed with 200 μL of 5% methanol in distilled water. Finally, the analytes were eluted with 60 μL of acetonitrile into a 96-well plate with a working volume of 350 μL per well. Finally, 7 μL of the eluted samples were injected into the LC–MS/MS system.
Measurements of LC-MS/MS
The LC-MS/MS system was composed of a 1200 Series HPLC system (Agilent, Santa Clara, Califronia) and an API 4000 QTRAP mass spectrometer (Applied Biosystems) equipped with an electrospray ionization source. The chromatograph was equipped with a Hypersil GOLD C18 column (100 × 2.1 mm i.d., 3 μm; Thermo Fisher Scientific, Waltham, Massachusetts) using a Hypersil guard column (4 mm length × 3.0 mm i.d.; Thermo Fisher Scientific). The isocratic mobile phase consisted of acetonitrile and 10 mmol/L ammonium formate (82:20, v/v) at a flow rate of 0.3 mL/minute for the sample analysis. The temperatures of the auto-sampler and column oven were 4°C and 35°C, respectively. The mass spectrometer was operated in the positive ion mode. The following parent/product ions of compounds were measured: m/z 326.1/291.1 for midazolam, m/z 342.0/203.0 for 1-hydroxymidazolam, and m/z 281.3/86.1 for imipramine (internal standard). No significant matrix interference was observed during the MS/MS. The ion spray voltage and ion source temperature were maintained at 5.5 KV and 400°C, respectively. The optimized voltages of the collision energy for midazolam, 1-hydroxymidazolam, and imipramine were set to 39, 40, and 25 eV, respectively. Data acquisition and quantification were performed using Analyst version 1.4 (Applied Biosystems/MDS SCIEX).
Results
Comparison of CYP3A4 Expression and 3-D Spheroid Formation Between HepG2 and HepaRG
We confirmed the expression of 5 CYP isoforms in HepG2 and HepaRG cells grown in 2-D cell cultures. The same concentration of HepG2 and HepaRG cells was seeded onto cell culture plates. After 1 day, total RNA was isolated from the cells for the qPCR analysis, as described above. All tested CYP isoform genes were expressed in higher amounts in HepaRG cells than in HepG2 cells (Figure 1A).
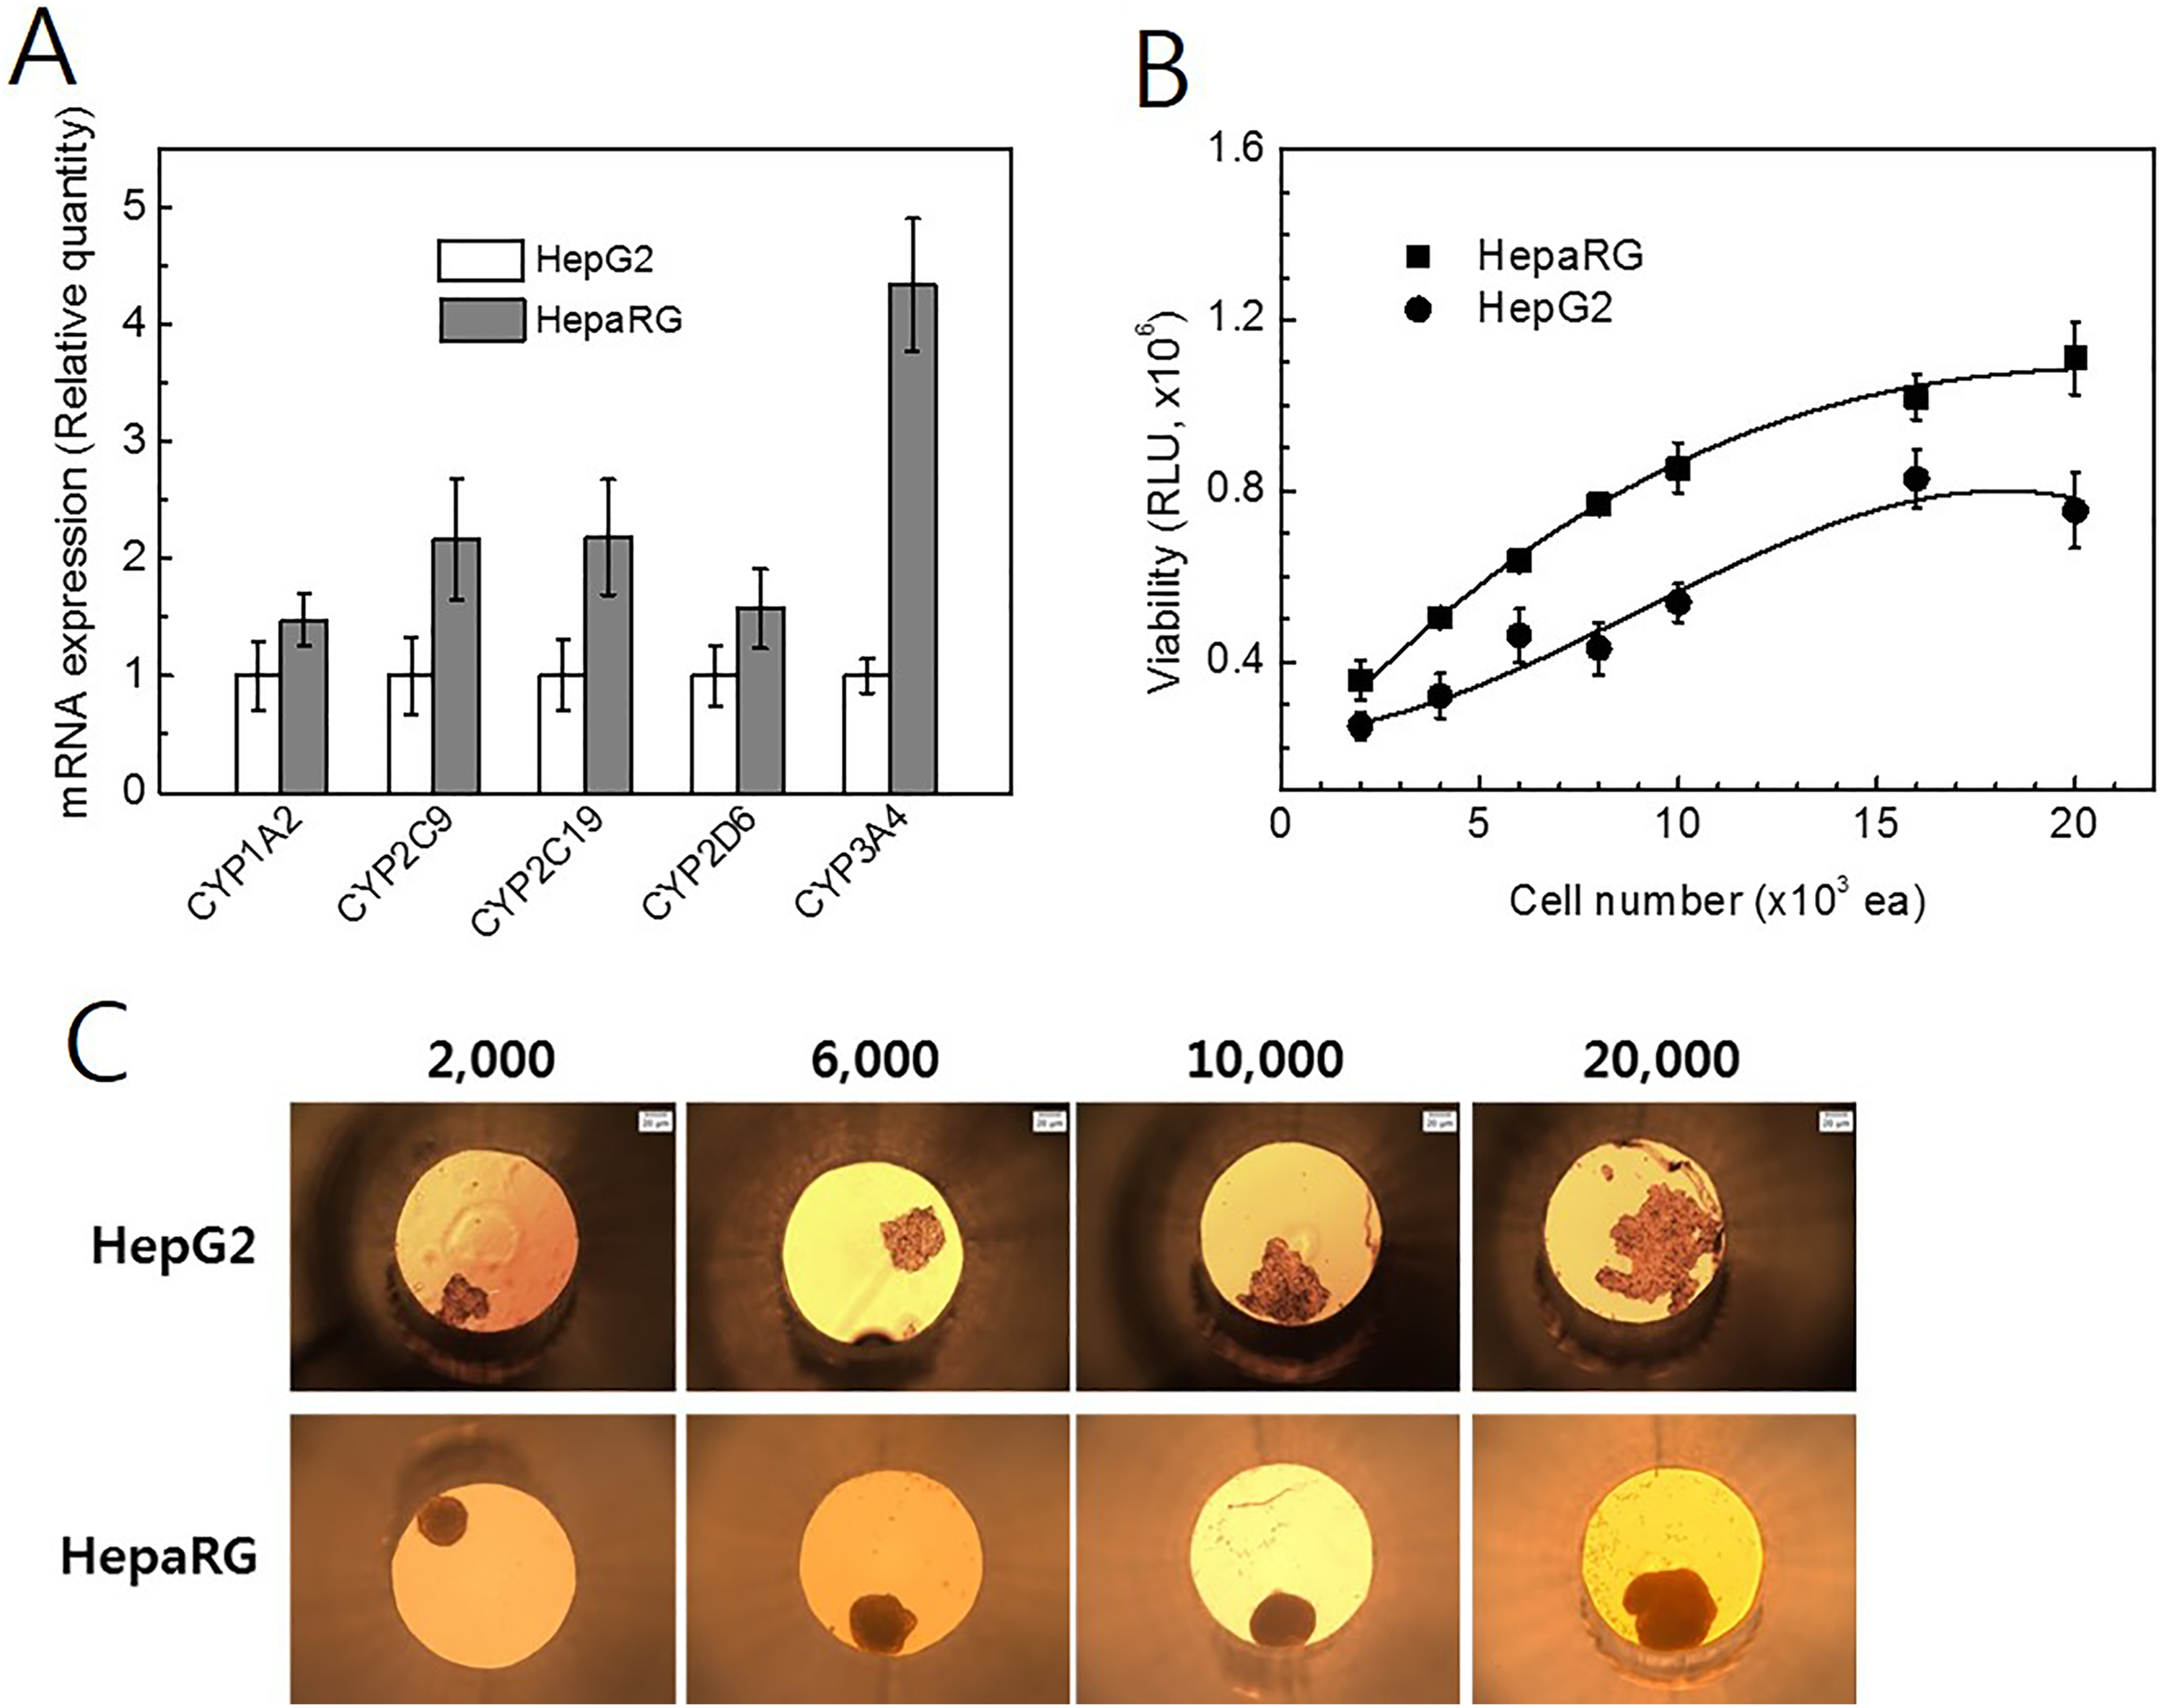
Expression of cytochrome P450 (CYP) enzymes and comparison three-dimensional (3-D) spheroid formation between HepG2 and HepaRG. A, Expression of phase I enzymes in HepG2 and HepaRG cells was compared in 2D cell culture. Cells were seeded in cell culture dishes. After 3 days, cells grown as a 2-dimensional (2D) monolayer were harvested with trypsin-EDTA for the isolation of total RNA. B, Formation of 3-D HepG2 and HepaRG spheroids was compared under the same condition. Three-dimensional spheroids were produced in hanging drop cultures; after 3 days of cultivation, they were transferred into GravityTRAP plates. The viability of the 3-D microtissue was quantified by the bioluminescent ATP detection assay kit. Luminescence was detected with a Tecan Infinite M1000 plate reader. C, The morphologies of the 3-D spheroids were observed on microscope. Microscopy images were acquired in the same magnification. Plate bottom diameter = 1 mm.
To optimize the seeding density and compare the shape of the 3-D spheroids, HepG2 and HepaRG cells were plated at various concentrations (2,000-20,000 cells/well) and allowed to aggregate for 3 days, resulting in cell aggregates of various diameters. The aggregated cells were transferred into GravityTRAP plates and cultured for 3 days. After confirming the shapes of the 3-D spheroids, the optimal seeding density was determined. The viability of the 3-D microtissue was quantified using the bioluminescent ATP detection assay described earlier. HepaRG viability was correlated linearly with spheroid size up to a seeding density of 8,000 cells/well (Figure 1B). A significant deviance from linearity (Figure 1B) was observed for spheroids in wells seeded with >10,000 cells/well. We used a seeding density of 6,000 cells/well for all subsequent experiments. The morphologies of the 3-D HepG2 and HepaRG cultures are shown in Figure 1C. The 3-D HepG2 spheroids exhibited a loose and irregular shape after 3 days, whereas the HepaRG spheroids formed a compact and circular distribution of cells. Longer incubation periods (42 days) did not result in larger 3-D spheroids.
Expression and Activity of CYP3A4 in 3-D HepaRG Spheroids
To test temporal changes in CYP3A4 expression during the maturation and differentiation of 3-D HepaRG spheroids, qPCR was conducted with total messenger RNA (mRNA) prepared from 2-D cultured cells or 3-D HepaRG spheroids collected after different incubation periods. When the expression of CYP3A4 was compared with 2D culture, relative quantity was increased during maturation of 3-D culture. By 3 days, the CYP3A4 expression in 3-D spheroids had increased by 15-fold (Figure 2A). CYP3A4 expression was additionally increased after spheroid differentiation. The distinct increase in CYP3A4 mRNA was observed at 3 days after differentiation (Figure 2B). The transcriptional level of CYP3A4 was sustained for up to 42 days. Viability of spheroids and CYP3A4 activity at each time was tested by luminescent methods described in Material and Methods section(Figure 2C). Spheroids incubated for time periods 3 to 42 days showed no decreases in the measured viability or in CYP3A4 activity, indicating that the cells remained fully functional for up to 42 days after differentiation. These results suggest that only differentiation of a 3-D culture system can improve liver-specific CYP3A4 enzyme expression.
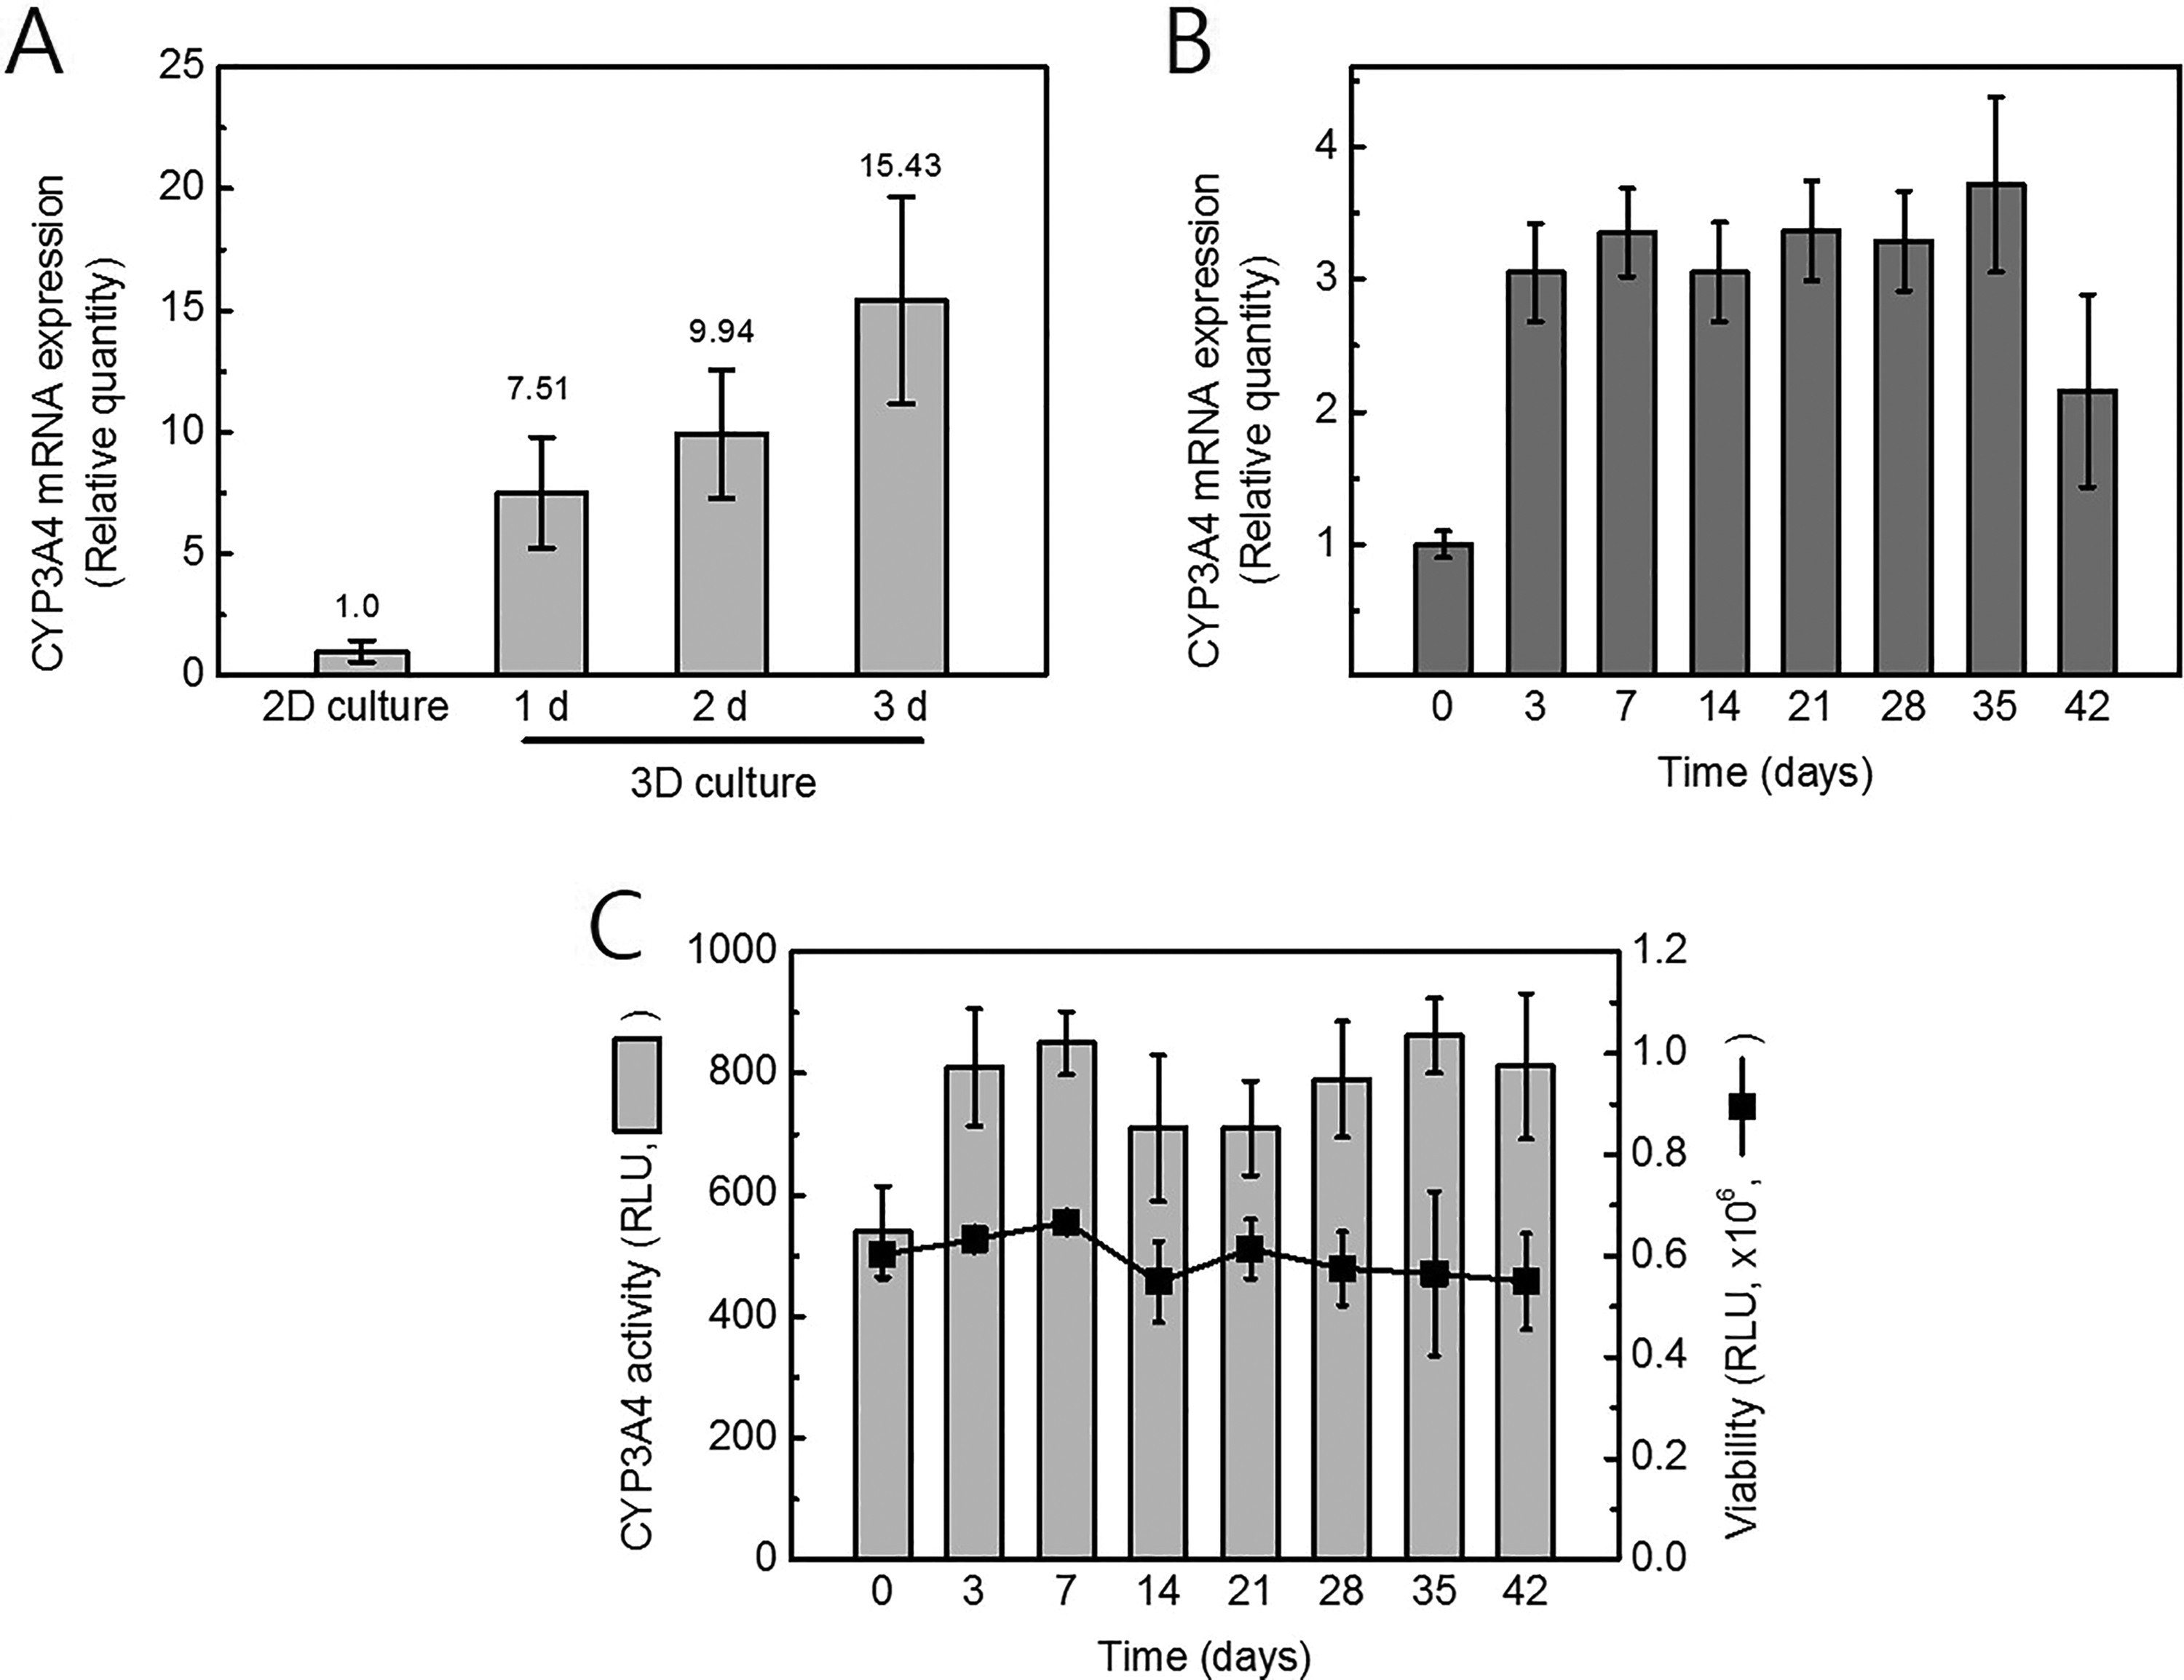
The fold-change gene expression levels of cytochrome P450 (CYP) 3A4 in 3-dimensional (3-D) HepaRG spheroids. A, Three-dimensional spheroids were formed as described in the Materials and Methods. Prior to induce differentiation, fold changes of CYP3A4 were compared with 2D culture. B, The expression of CYP3A4 on days 3, 7, 14, 21, 28, 35, and 42 after differentiation was compared to day 0 measured via real-time polymerase chain reaction (PCR) analysis. C, Enzyme activity of CYP3A4 and viability of 3-D HepaRG spheroids were measured at each time.
Determination of CYP3A4 Inhibition Using 3-D HepaRG Spheroids and In Vitro Assay
Three-day-differentiated HepaRG spheroids were treated with several CYP3A4 inhibitors at 10 μmol/L for 24 hours. Inhibition of CYP3A4 in 3-D HepaRG spheroids was strongly correlated with the results of the in vitro assay (Figure 3A). The correlation coefficient was 0.935 with a slope of 1.351; all of the inhibitors, with the exception of diltiazem, were within the 95% confidence intervals. This suggests the accuracy of evaluation of CYP3A4 inhibition in 3-D HepaRG spheroids. To confirm that CYP3A4 inhibition was not due to reduced CYP3A4 expression, CYP3A4 transcript levels were measured in 3-D HepaRG spheroids. All of the inhibitors increased transcription of CYP3A4, suggesting that inhibition of CYP3A4 activity was not due to reduced transcription (Figure 3B). This enzymatic assay system is high throughput but limited by being end point based.
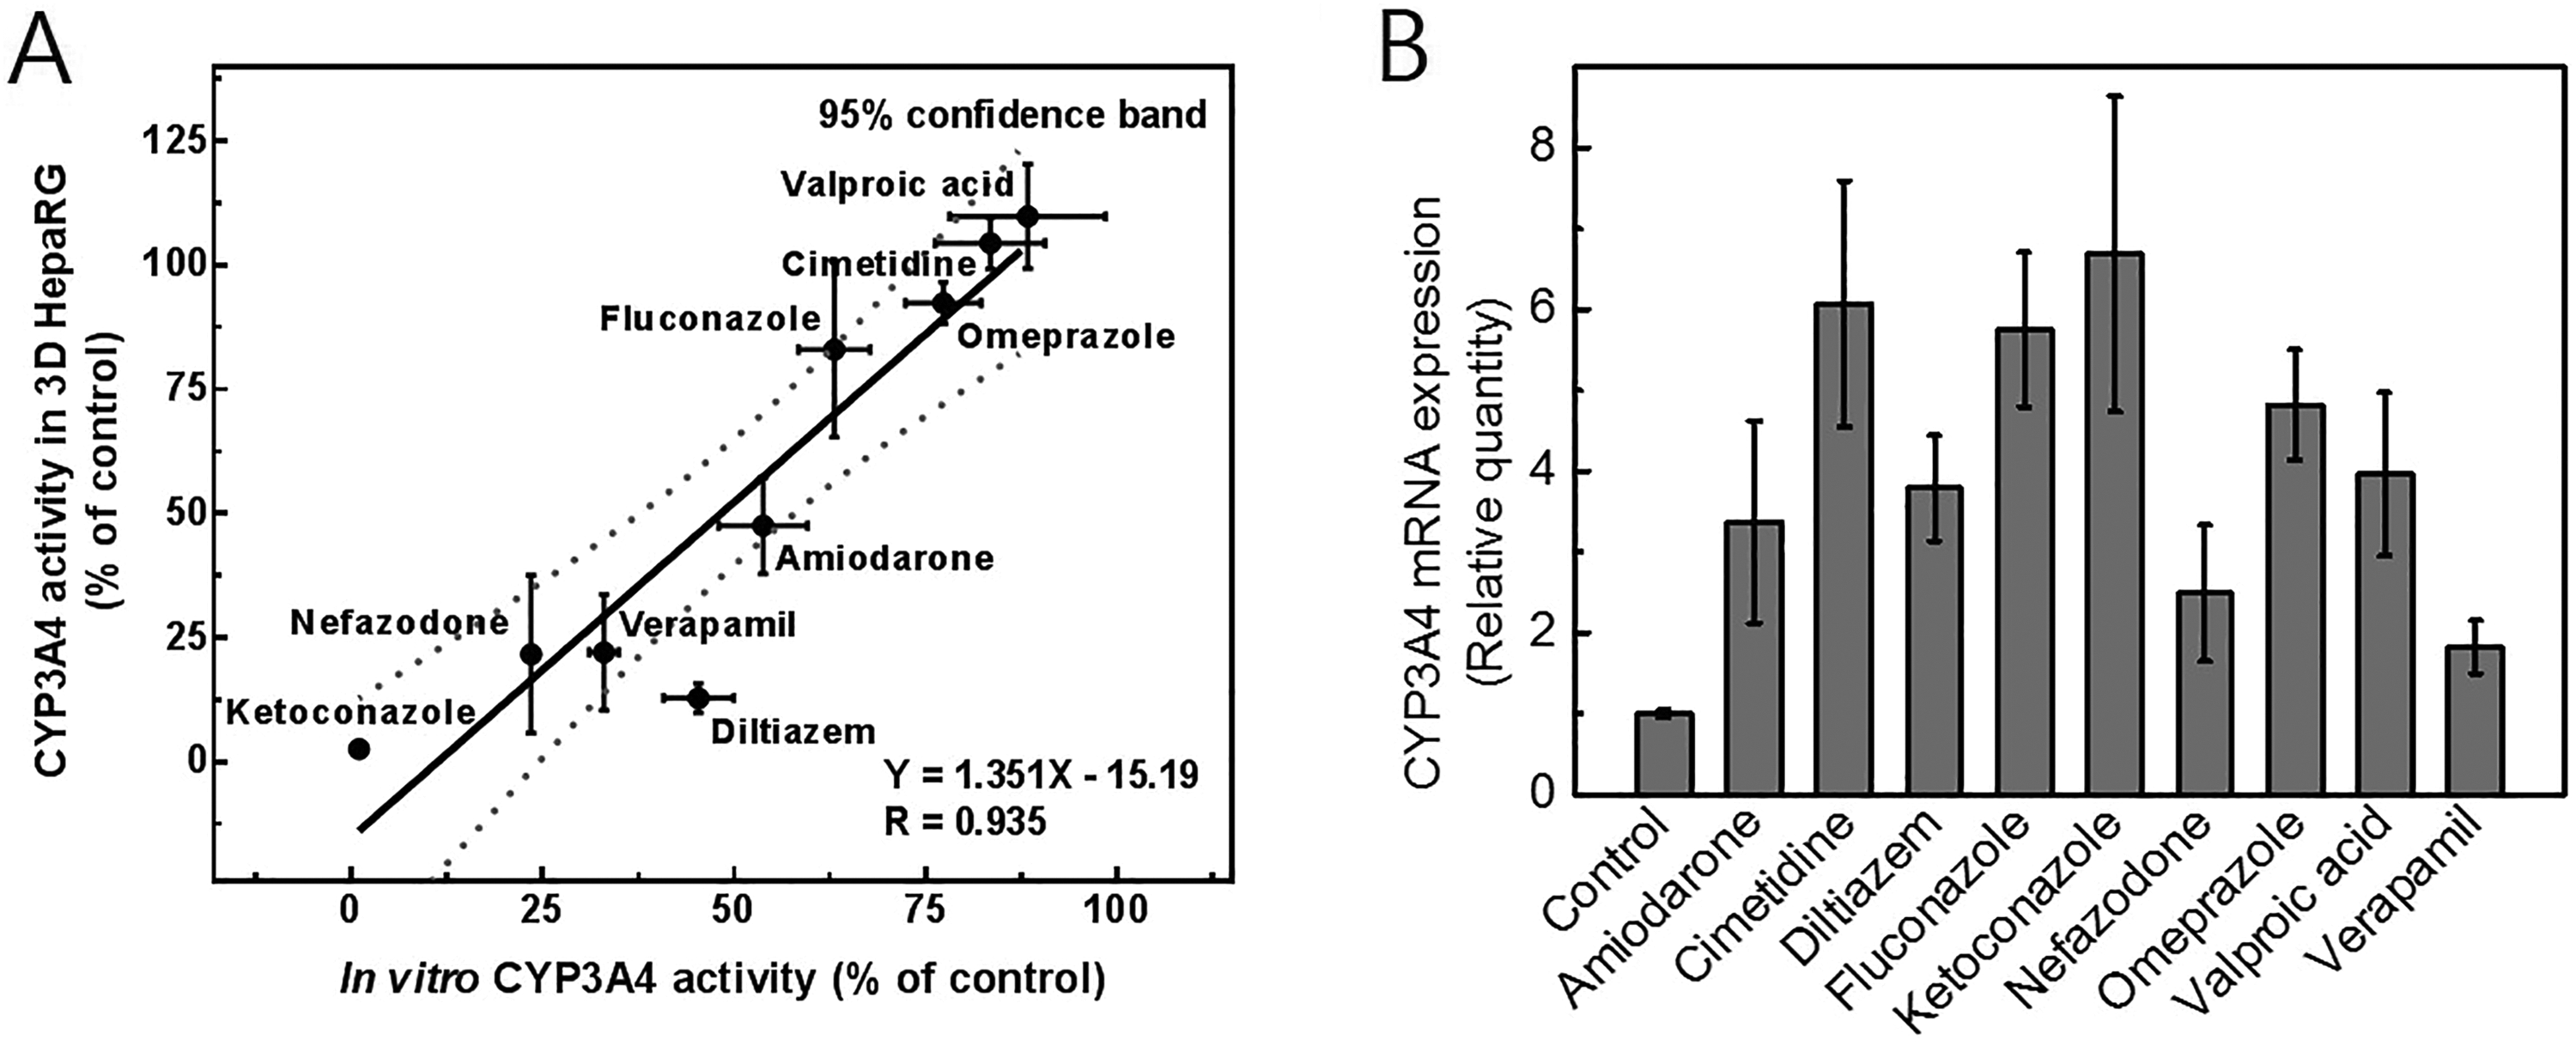
Correlation of cytochrome P450 (CYP) 3A4 inhibition between 3-dimensional (3-D) HepaRG spheroids and in vitro enzyme assay. A, Differentiated HepaRG spheroids were treated with compounds at the concentration of 10 μmol/L for 24 hours. Compounds were previously known for inhibition of CYP3A4 (n = 3). B, The expression of CYP3A4 was increased by the treatment of compound in 3-D HepaRG spheroids (n = 3).
Detection of CYP3A4-Induced Metabolite and Inhibition of CYP3A4 Metabolic Capacity During 3-D HepaRG Culturing
In order to develop a novel selective and accurate method for the prediction of CYP3A4 inhibition in 3-D HepaRG spheroids, LC-MS/MS was applied for the analysis of substrate or metabolite. Midazolam is one of the most commonly used substrates for the determination of hepatic CYP3A activity both in vitro and in vivo. 30 Midazolam is hydroxylated by CYP3A4 into 1 primary metabolite, 1-hydroxymidazolam, and 2 minor metabolites, 4-hydroxymidazolam and 1,4-dihydroxymidazolam. In this study, we used 1-hydroxymidazolam to monitor the induction or inhibition of CYP3A4 in 3-D HepaRG spheroids. Under the optimized chromatographic conditions, 1-hydroxymidazolam peaks were clearly identified at 0.64 minutes. On days 1, 3, and 5 after treatment with 100 nmol/L midazolam, 1-hydroxymidazolam levels were analyzed by LC-MS/MS. Chromatograms of 1-hydroxymidazolam are shown in Figure 4A. The area ratio of 1-hydroxymidazolam was correlated positively with incubation time (Figure 4B). In addition, metabolic activity was positively correlated with spheroid size within a given incubation period. The increment in the peak area ratio was proportionally correlated, indicating that CYP3A4 activity was dependent on the incubation period and volume of the 3-D spheroids.
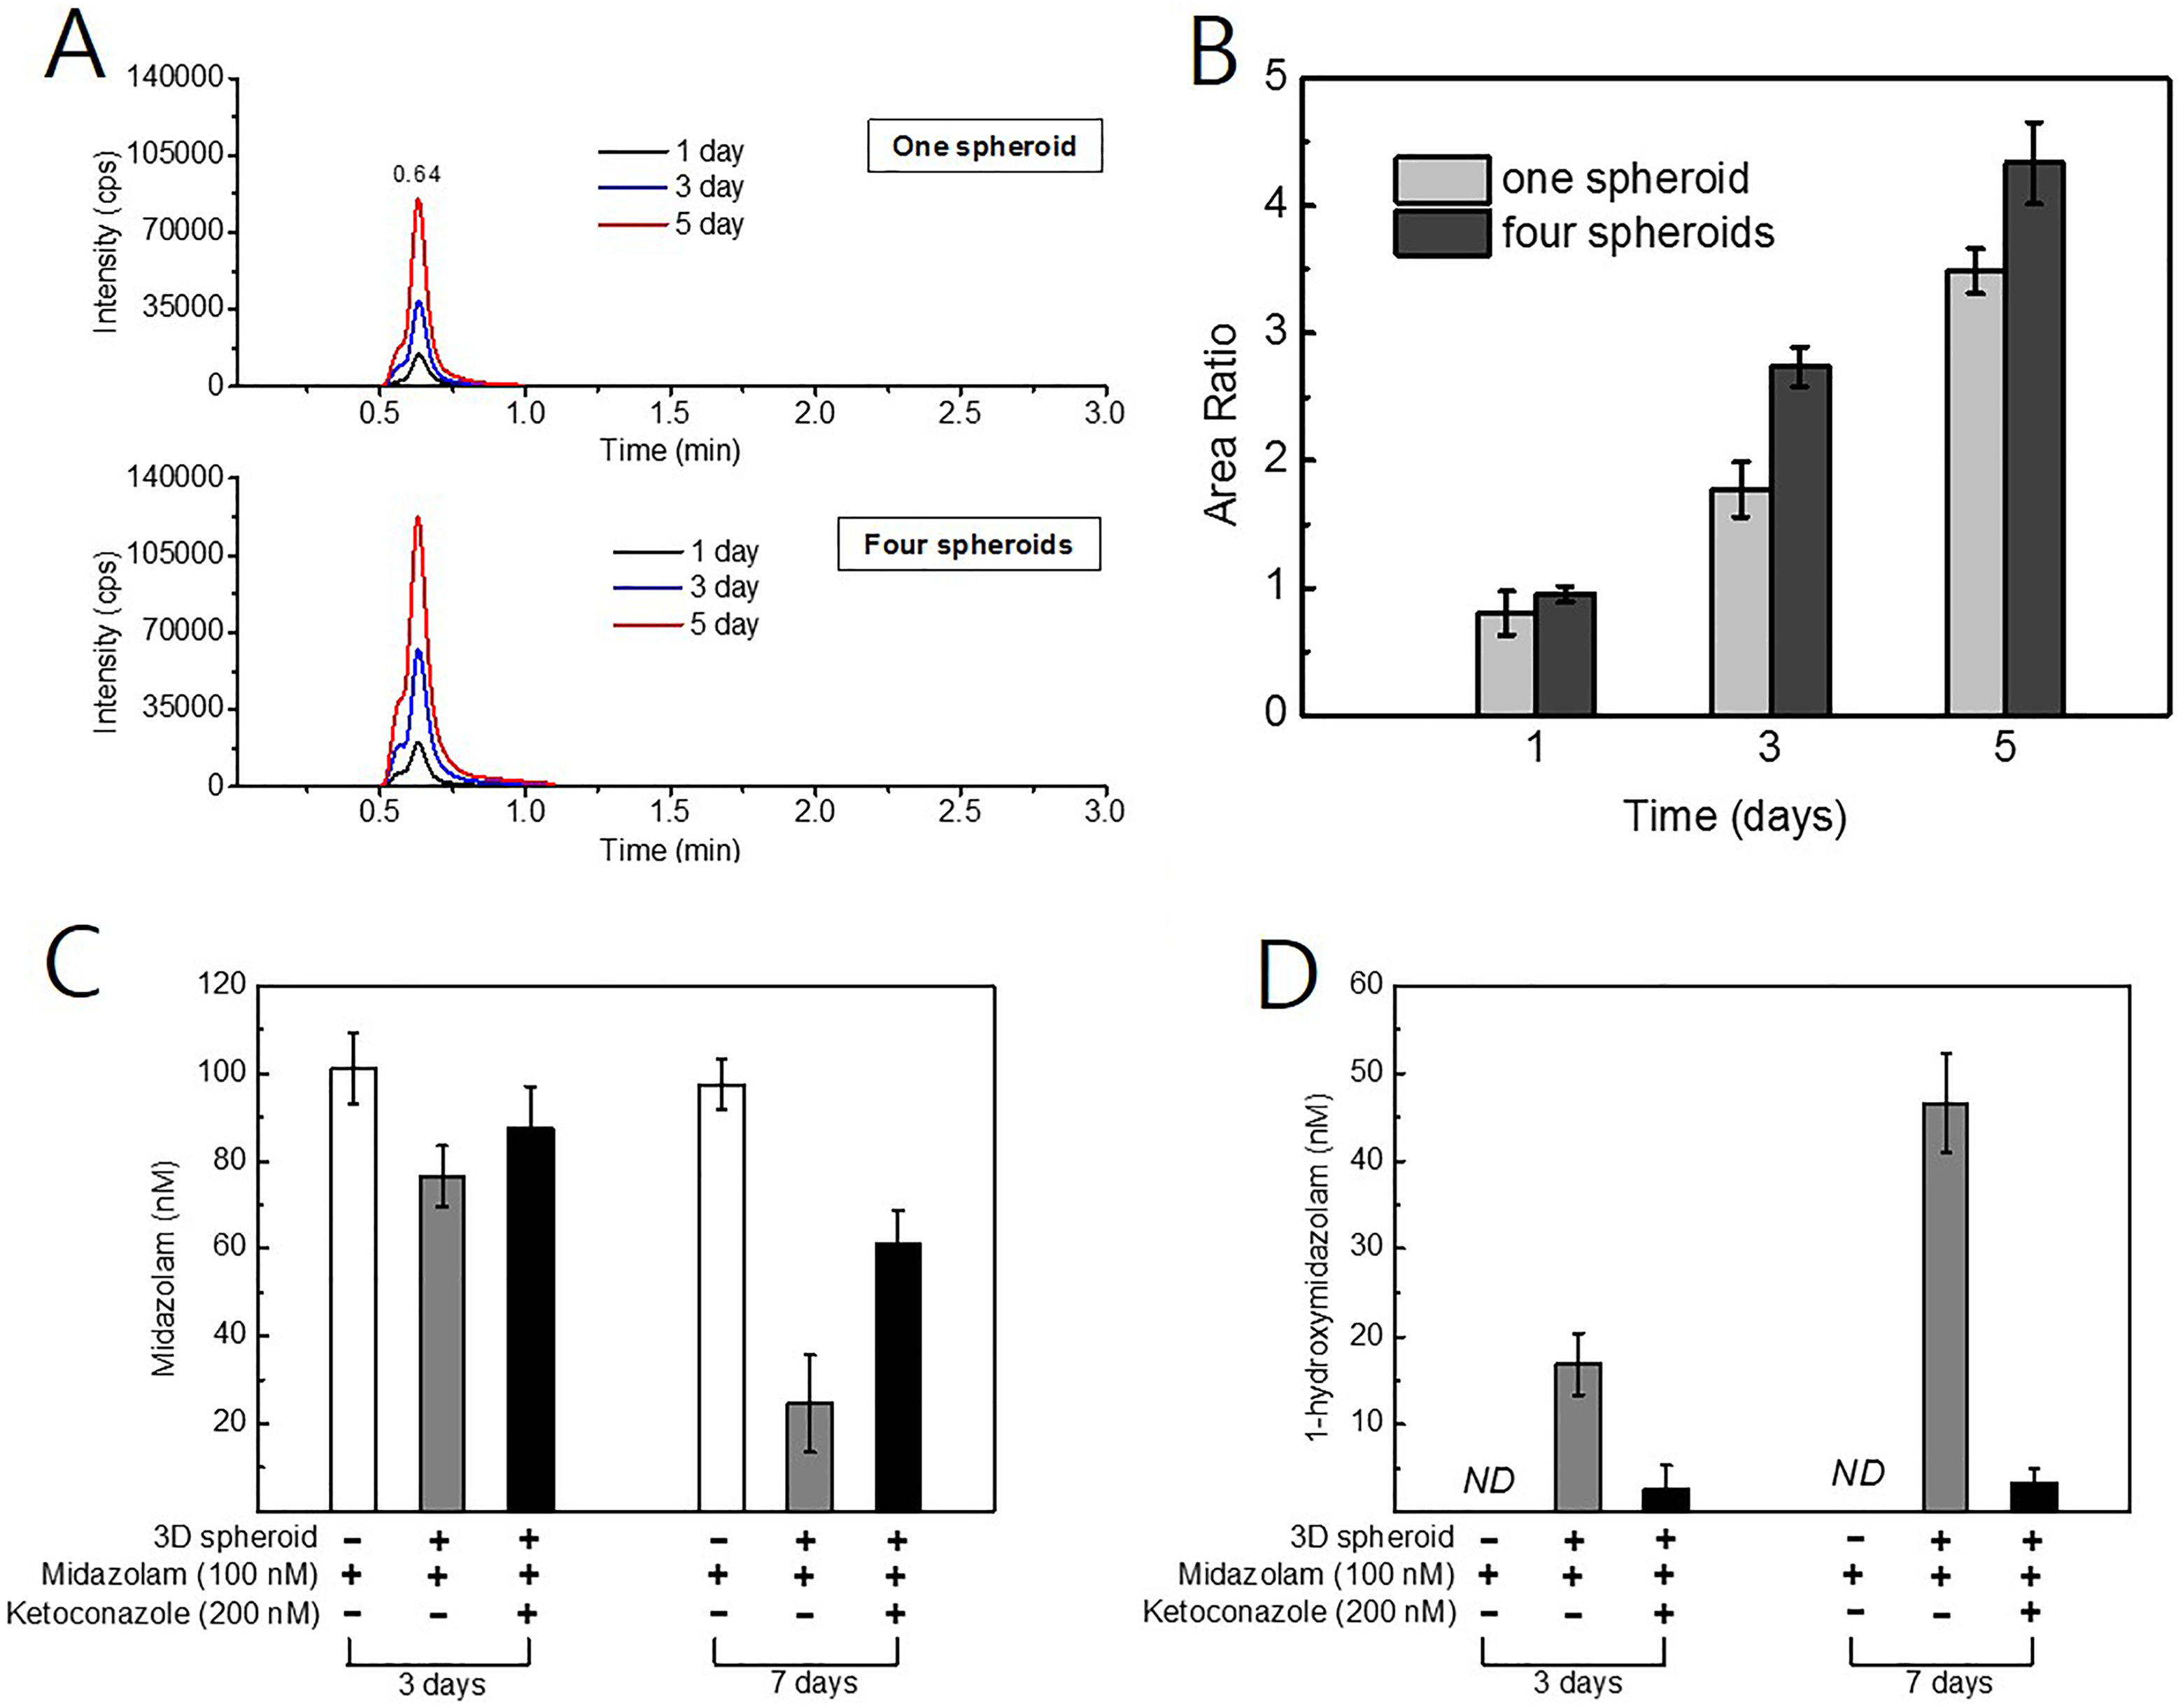
Analysis of 1-hydroxymidazolam metabolited by cytochrome P450 (CYP) 3A4 in three-dimensional (3-D) HepaRG spheroids. Midazolam was treated in 3-D HepaRG spheroid to be 10 μmol/L. At each time, 1-hydroxymidazolam levels were analyzed by liquid chromatography-tandem mass spectrometry (LC-MS/MS). A, The peak of 1-hydroxymidazolam was detected in 0.64 minutes of retention time. B, Time-dependent increase of 1-hydroxymidazolam was measured in the presence of 1 or 4 spheroids. Peak area ratio was analyzed by using Analyst version 1.4 (n = 3). C, Inhibited metabolic activity of CYP3A4 in 3-D HepaRG spheroids was measured by LC-MS/MS. Cells were treated with 100 nM of midazolam. In addition, some cells were co-treated with 200 nmol/L of ketoconazole to inhibit the metabolic activity of CYP3A4. The product ion of midazolam (m/z 291.1) was quantitated in each treated medium (n = 3). (D) The product ion of 1-hydroxymidazolam (m/z 203.0) was quantitated in the same media (n = 3).
We used ketoconazole to test the inhibitory capacity of CYP3A4 in 3-D HepaRG spheroids. Three and 7 days after treatment with 100 nmol/L midazolam, culture medium containing HepaRG spheroids was collected from the culture plate and processed for the LC-MS/MS analysis as described above. The specific substrate of CYP3A4, midazolam, was analyzed as described above (Figure 4C). When incubated in culture medium without a HepaRG spheroid, the midazolam concentration remained about 100 nmol/LM over time. When incubated in culture medium containing a HepaRG spheroid, the midazolam concentration decreased by ∼23 nmol/L after 3 days and >70 nmol/L after 7 days. Midazolam reduction was prevented by cotreatment with 200 nmol/L of ketoconazole, indicating that ketoconazole successfully inhibited the metabolic capacity of CYP3A4. We conducted the 1-hydroxymidazolam analysis with aliquots of the same medium as that used for the analysis of midazolam. Meaningful peaks of 1-hydroxymidazolam were detected in medium containing a HepaRG spheroid without ketoconazole (Figure 4D). We detected 1-hydroxymidazolam concentrations of ∼17 and 47 nmol/L after 3 and 7 days, respectively. Cotreatment with ketoconazole inhibited the production of 1-hydroxymidazolam by CYP3A4. These results indicate that the metabolic activity of CYP3A4 in differentiated 3-D HepaRG spheroids remains stable for at least 7 days of incubation, and other results (Figure 2C) indicate that this activity is maintained for at least 42 days.
A number of previous studies have characterized CYP3A4 activity, induction, and inhibition (as well as other CYPs) across these cell lines. Furthermore, the ability to detect hepatotoxicity across these cell lines has also been studied.
Comparison of CYP3A4 Inhibition Between 3-D HepaRG and PHH
We compared the metabolic capacity of CYP3A4 in PHHs and differentiated HepaRG cells by analyzing midazolam and 1-hydroxymidazolam concentrations. The PHHs were plated in 24-well cell culture plates and cultured for 2 days. Cells were incubated with midazolam for 3 days, and the culture medium was analyzed following the same procedure as described above for the HepaRG cells. The midazolam concentration decreased in PHHs by ∼64 nmol/L, whereas the concentration of 1-hydroxymidazolam increased by ∼27 nmol/L (Figure 5A). When PHHs were cotreated with ketoconazole and midazolam, the midazolam concentrations exhibited some loss. After incubation for 7 days, the metabolic trend of midazolam in the HepaRG spheroids was similar to that in the PHHs (Figure 5B). The inhibitory capacity of CYP3A4 by ketoconazole was more greater in HepaRG spheroids than in PHHs. These data suggest that HepaRG spheroids are valid for the assessment of CYP3A4 inhibition over long and stable cellular incubation periods.
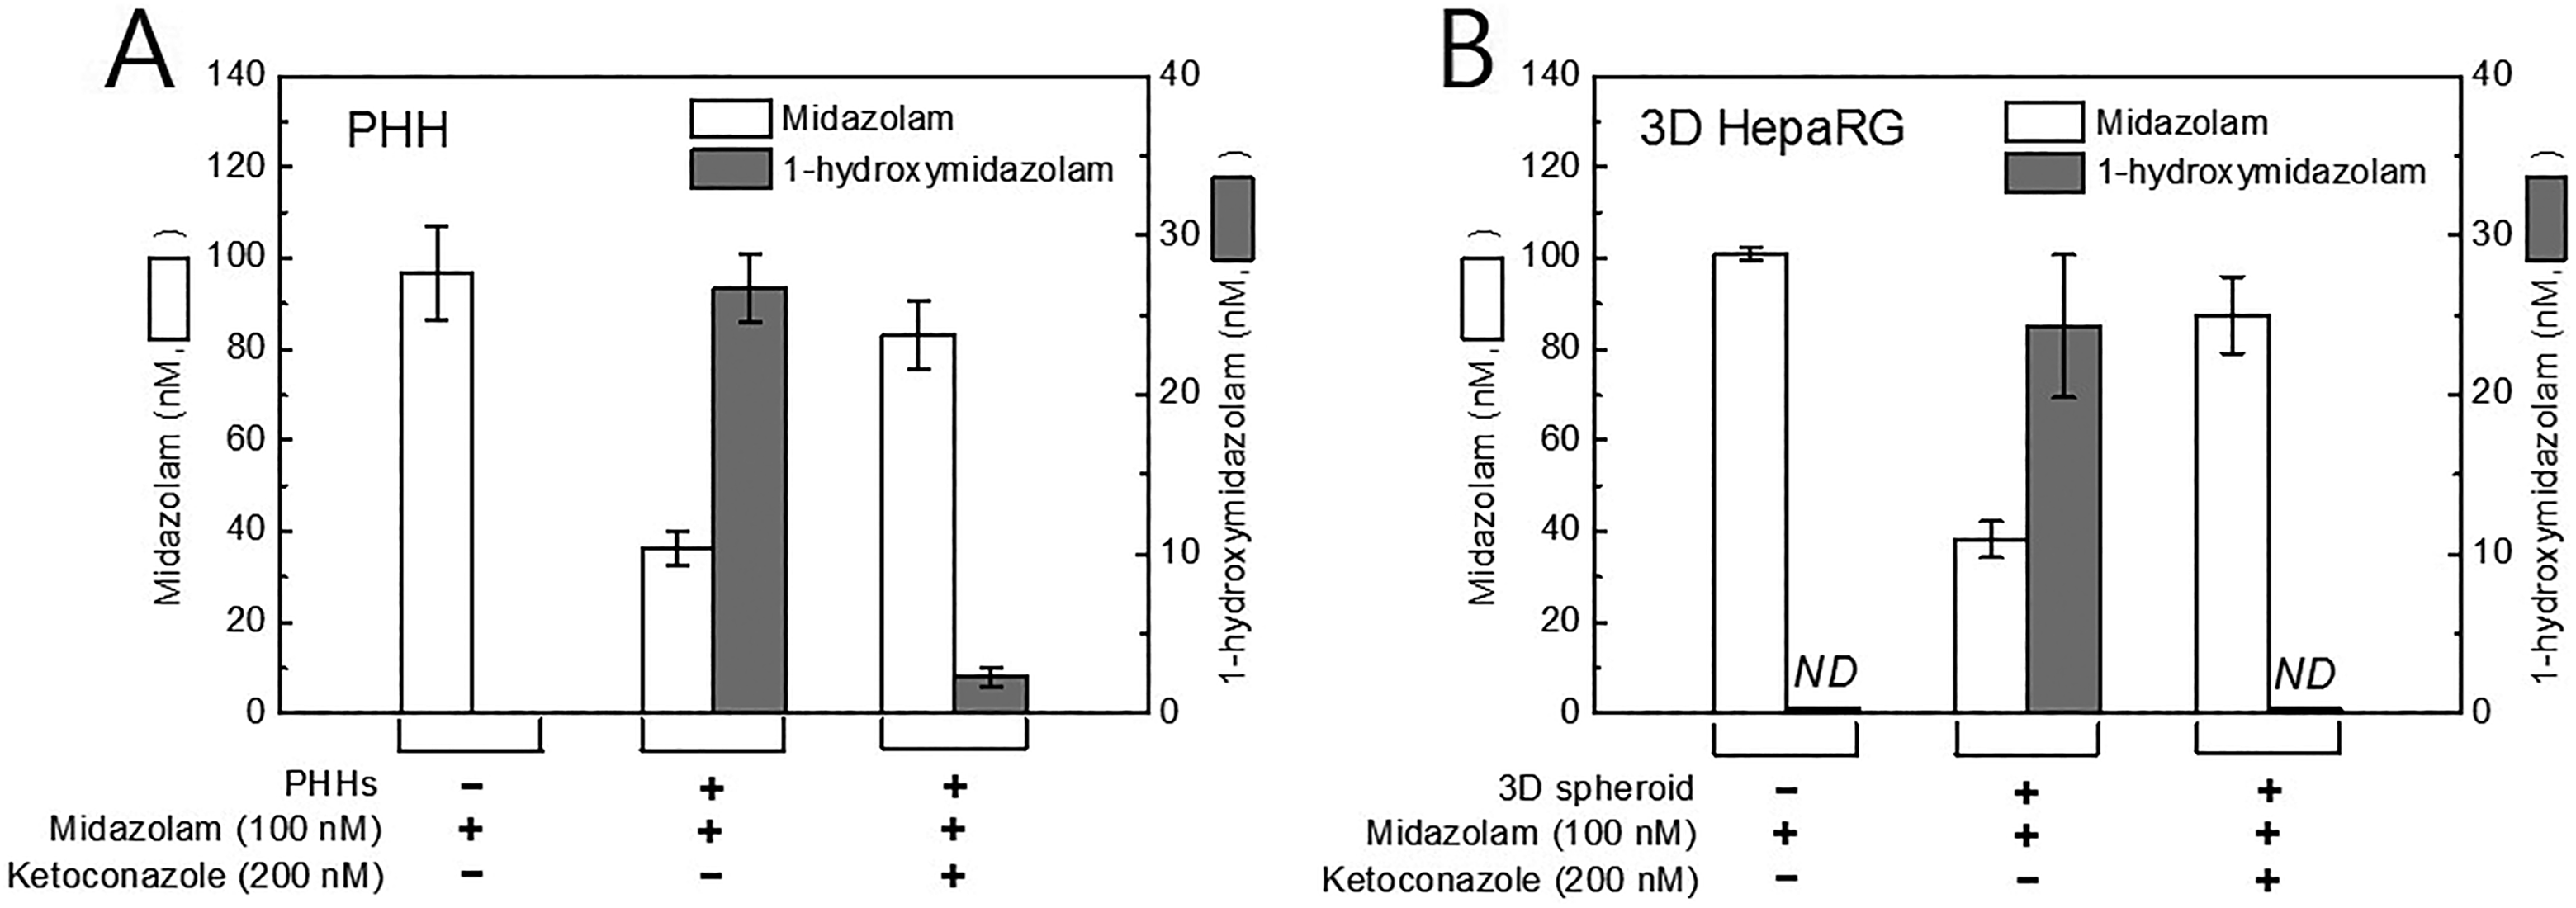
Comparison of cytochrome P450 (CYP) 3A4 activity in primary human hepatocytes (PHHs) and three-dimensional (3-D) HepaRG spheroids. Cells were treated with 100 nmol/L of midazolam or co-treated with 200 nM of ketoconazole. The product ion of midazolam and 1-hydroxymidazolam was analyzed in each culture medium. (A) Primary human hepatocytes were treated in 24-well cell culture plates for 3 days (n = 3). B, Three-dimensional HepaRG spheroids were treated for 7 days (n = 3).
Evaluation of Hepatotoxicity in 3-D HepaRG Spheroids
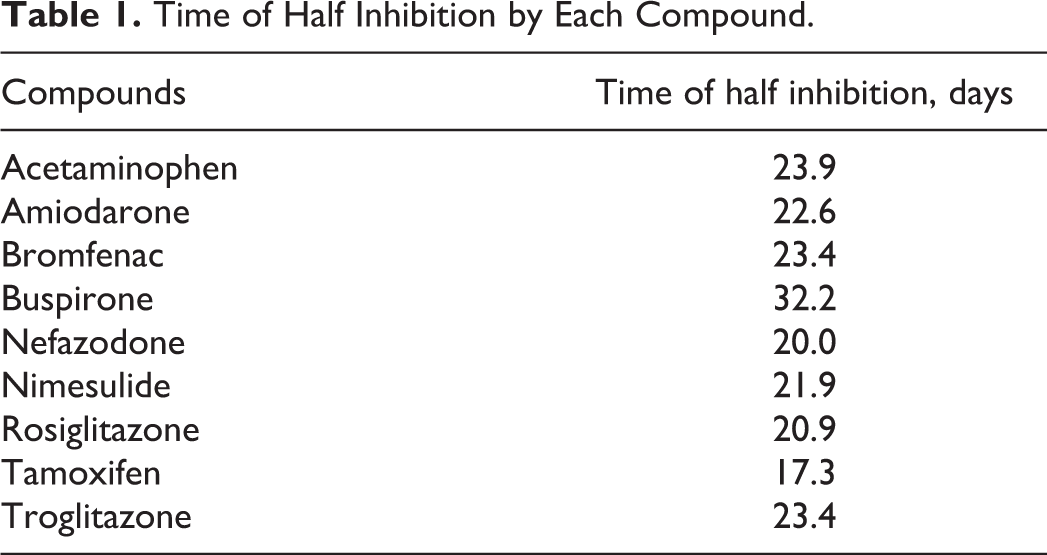
Hepatocyte systems containing liver metabolic enzymes enable prediction of hepatotoxicity during drug development. The hepatotoxicity induced by major CYP enzyme-mediated metabolites is important in terms of consumer safety. 31 CYP3A4 is responsible for the hepatotoxicity of amiodarone. 32 Three-dimensional culture models enable evaluation of the chronic hepatotoxic effect of drug candidates. We tested the cytotoxicity of 9 compounds in 3-D HepaRG spheroids, PHHs, and HepG2 cells during culture for 7 days (Figure 6). At 3 days, medium was replaced with fresh medium containing 1 of the 9 compounds or 0.1% dimethyl sulfoxide (DMSO). The 3-D HepaRG spheroids were more sensitive to the cytotoxic effect of certain test compounds than PHHs or HepG2 cells. In PHHs and HepG2 cells, 100 μM acetaminophen, bromfenac, buspirone, and rosiglitazone caused minimal cytotoxicity (<10%), whereas 100 µmol/L bromfenac and buspirone showed ∼20% cytotoxicity in 3-D HepaRG spheroids (Figure 6). Moreover, ≤100 µmol/L nimesulide did not show significant cytotoxicity in HepG2 cells (Figure 6C). Next, 3-D HepaRG spheroids were administered with 10 µmol/L hepatotoxic compounds for 35 days to evaluate chronic hepatotoxicity. All of the compounds, with the exception of buspirone, exerted cytotoxicity at 21 days (Figure 7). The predicted time, which each compound reduced cell viability by 50%, is shown in Table 1. Tamoxifen reduced cell viability by 50% after 17 days. Most of the compounds, with the exception of buspirone, reduced cell viability by 50% after 20 to 25 days. Chronic hepatotoxicity induced by compounds was successfully detected in our long-term period culture system of HepaRG spheroids. We expect that these findings will facilitate prediction of the chronic hepatotoxicity of drug candidates.
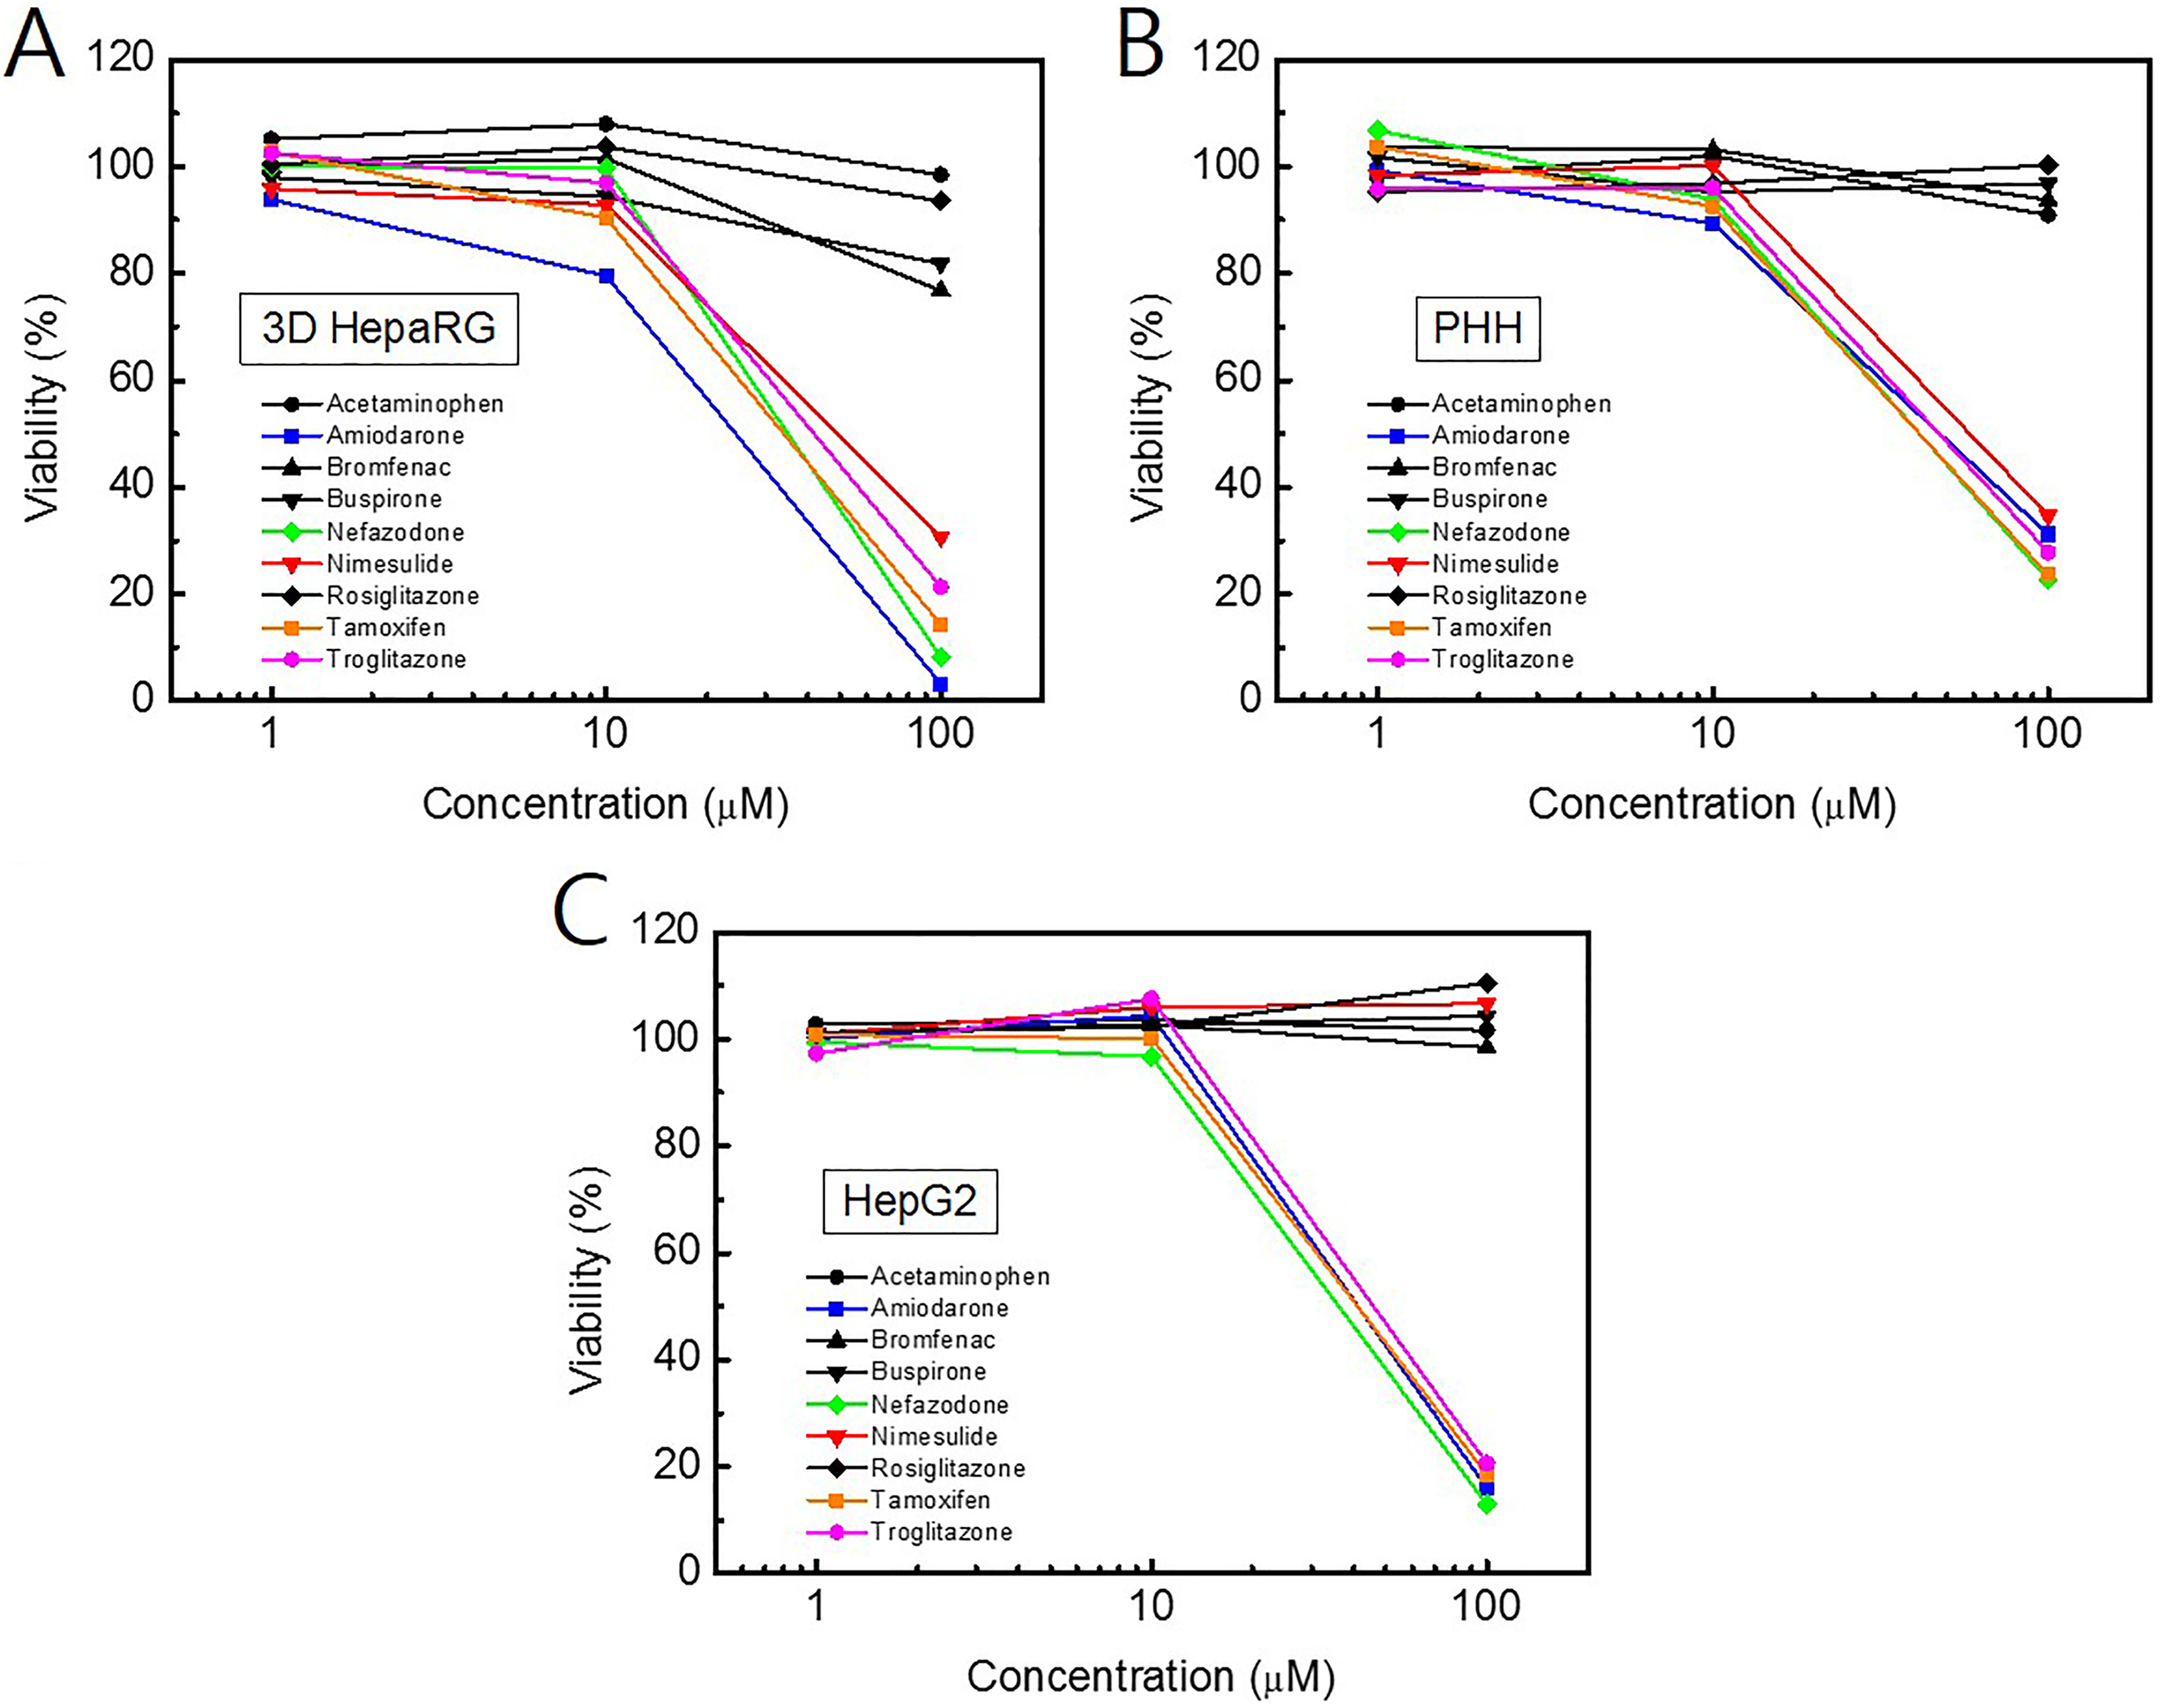
Cell viability in primary human hepatocyte (PHH), HepG2, and 3-dimensional (3-D) HepaRG spheroids after 7 days treatments with previously known for hepatotoxicants. Each compound was diluted in complete culture medium and refreshed at 3 days after first treatment. (A) HepaRG spheroids were treated with compounds after differentiation for 3 days. (B) Primary human hepatocyte and (C) HepG2 cell were seeded on cell culture plate and treated with compounds at the same time schedule with HepaRG spheroids.
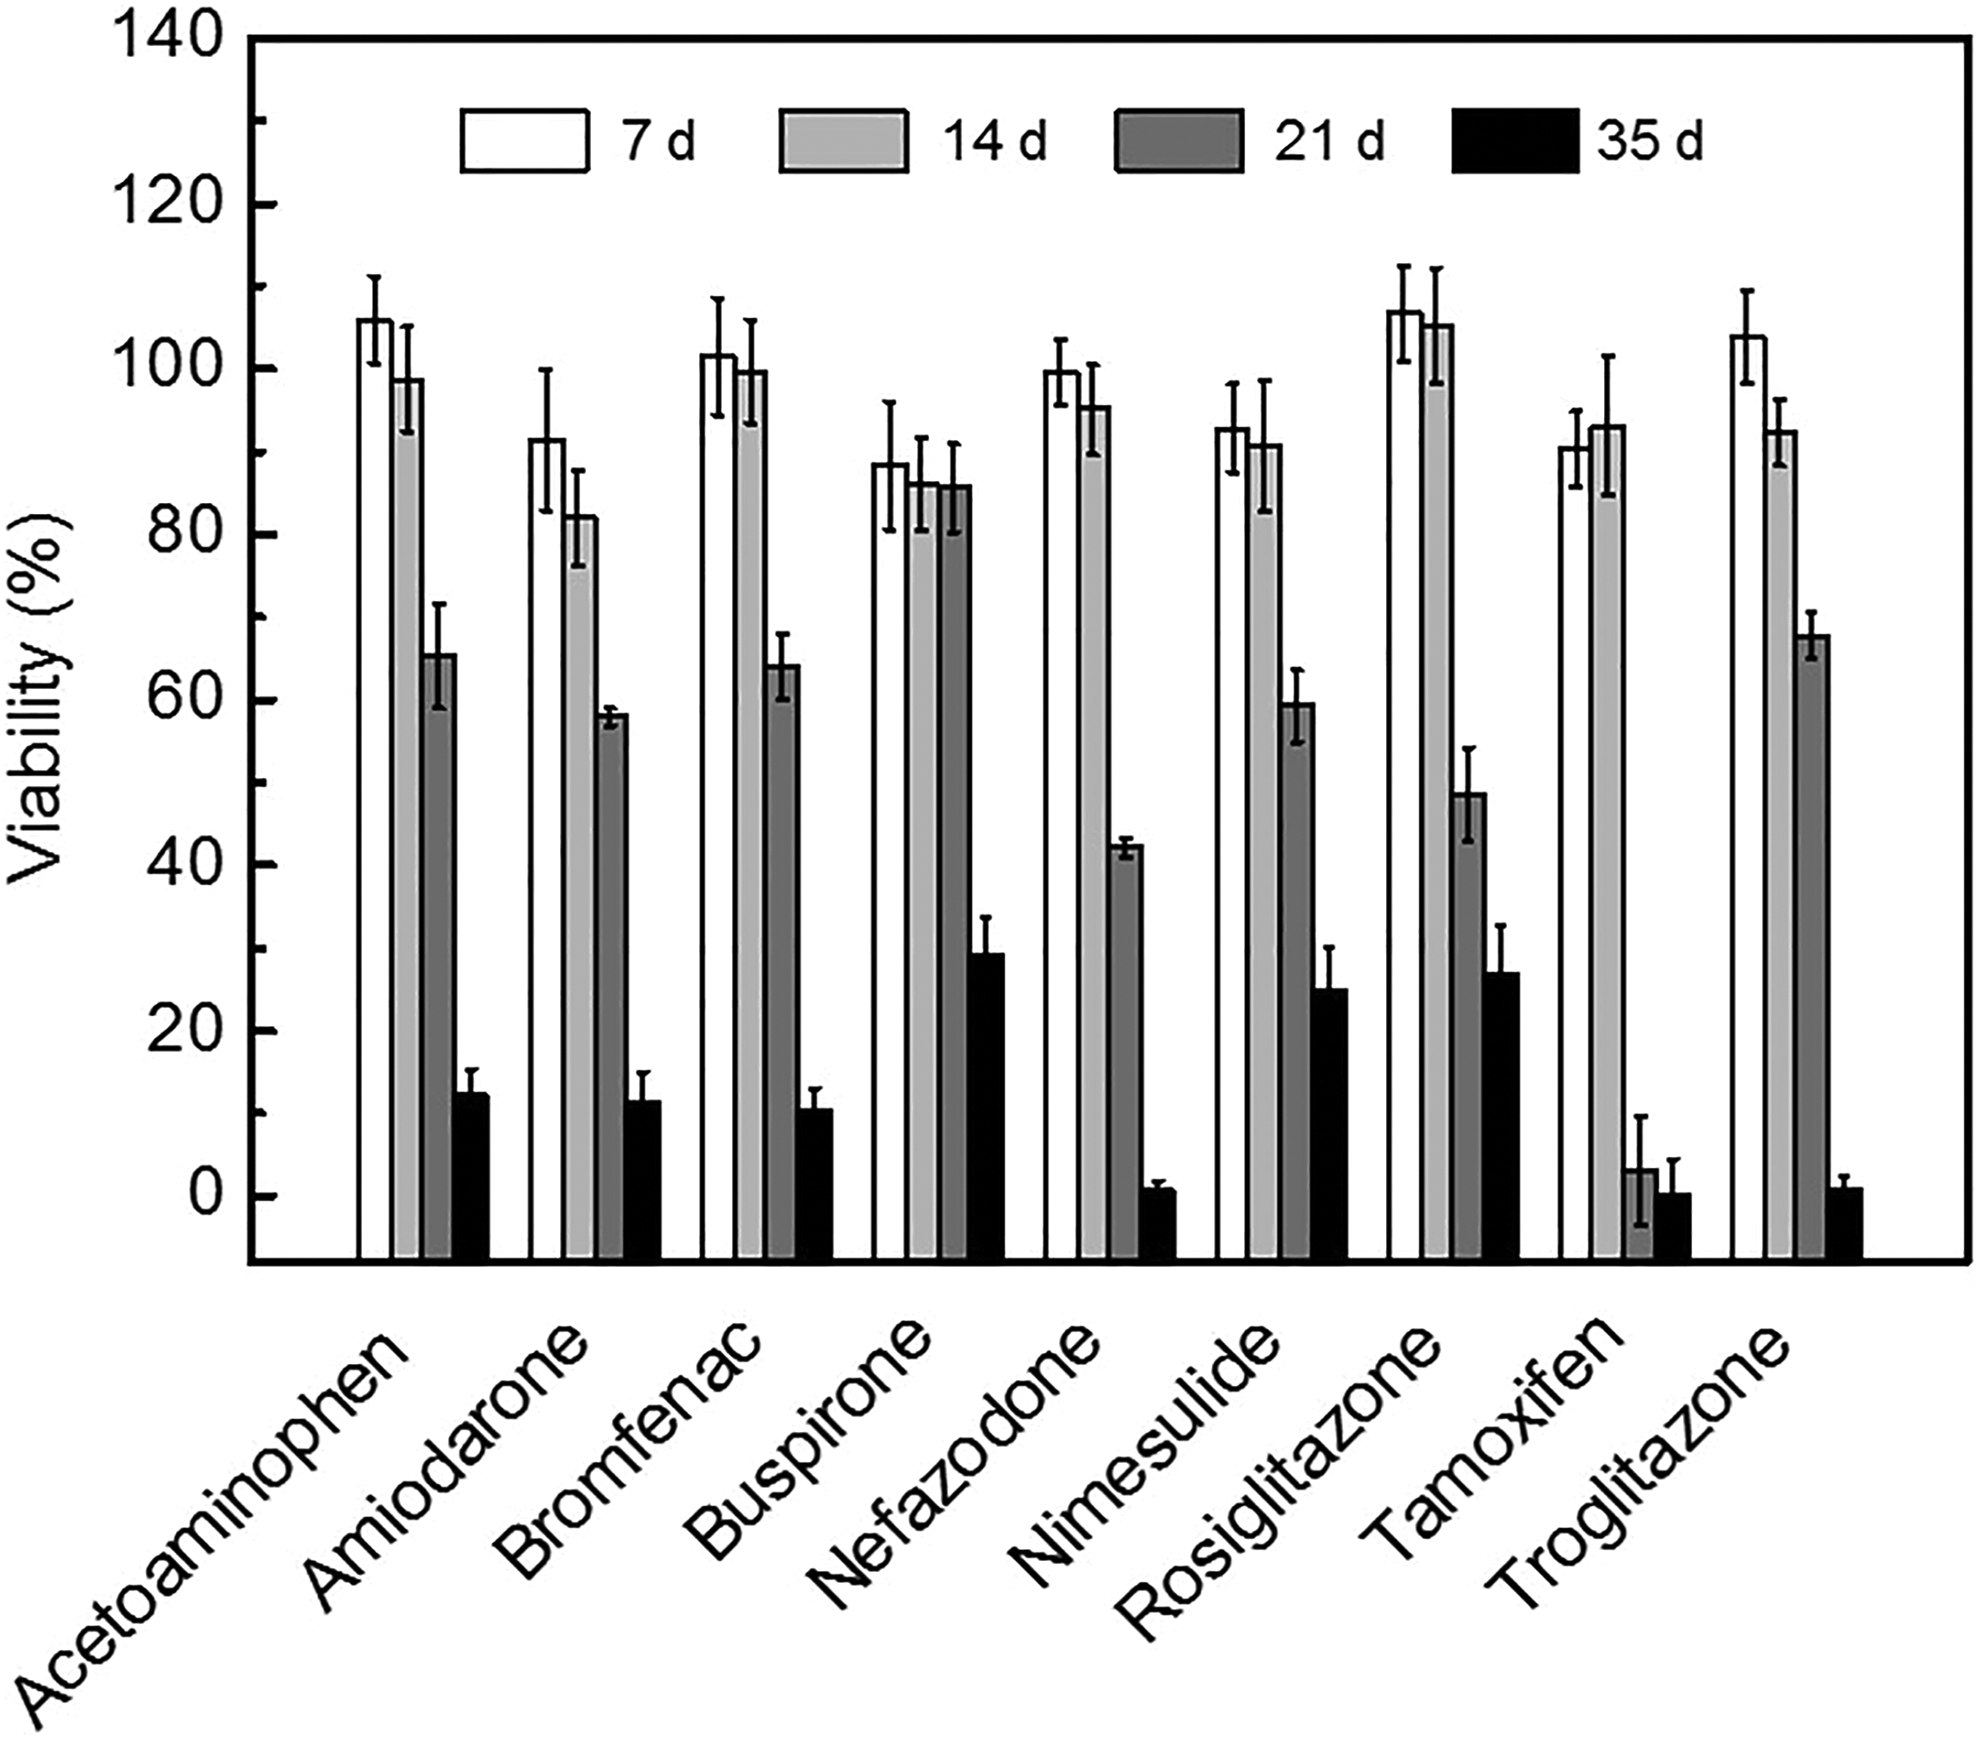
Analysis of chronic hepatotoxicity in 3-dimensional (3-D) HepaRG spheroids. HepaRG spheroids were maintained in differentiation medium for treatment period. Hepatotoxic compounds were diluted in differentiation medium and refreshed every 3 days. Relative cell viability compared with dimethyl sulfoxide (DMSO)-treated control (0.1%) was calculated and depicted as mean values ± standard deviation (SD) of triplicates.
Time of Half Inhibition by Each Compound.
Discussion
Among several human hepatic-derived cell lines, hepatocarcinoma HepG2 cells are used widely in hepatotoxicity studies. However, HepG2 cells show poor metabolic enzymes such as CYP enzymes. 33,34 Researchers have attempted to create a stable cell line that expresses CYP enzymes to screen for hepatotoxicity, 35 –37 as CYP expression is an important parameter for evaluating hepatotoxicity and drug metabolism under similar conditions as those in vivo. In this study, we confirmed that differentiated HepaRG cells express major drug-metabolizing enzymes. In particular, CYP3A4 expression, which is responsible for the metabolism of >50% of marketed drugs, remained stable over a long incubation period in 3-D spheroid cultures. Assessing CYP3A4 activity is an essential recommended index for the determination of DDIs according to the US Food and Drug Administration. Human hepatocytes have become the gold standard for evaluating hepatic metabolism and the toxicity of drugs and other xenobiotics in vitro because the expression patterns of metabolic enzymes in PHHs are similar to those in human liver. However, PHHs typically have a short lifespan when grown in cell culture plates, although a method for the long-term culture and expansion using PHHs was recently reported. 38,39
Due to the phenotypic and functional instability of PHHs, 3-D HepaRG spheroids are expected to become a powerful tool for the evaluation of drug metabolism and hepatotoxicity. The metabolic activity of CYP3A4 in 3-D HepaRG spheroids after 7 days was similar to that of PHHs after 3 days (Figure 5). As shown by our results, PHHs are useful for assessing short-term metabolic activity and hepatotoxicity. However, they have some limitations for their use in drug discovery, such as their difficulty to obtain spontaneous dedifferentiation and variability in metabolic capabilities between individual donors. Moreover, the durability of their original functionality is relatively short lived during cell culturing. The 3-D HepaRG spheroids seem to be favorable for longer-term experiments resulting in more realistic hepatotoxicity assessments and metabolic characterization of long-acting drugs under conditions similar to those experienced in vivo.
There is need for a novel, improved system in drug discovery that better represents conditions experienced in the human body. Many researchers have examined 3-D HepaRG cultures in applications related to hepatotoxicity, DDIs, and pharmacokinetics. The hanging drop system has many advantages that may be beneficial to drug discovery research because they only require small amounts of xenobiotics, allowing for their use in high-throughput systems. Therefore, we adopted the hanging drop system for the assessment of phase I metabolic enzyme activity. This system may become a powerful tool to screen the effects of xenobiotics on CYP inhibition as well as other hepatocellular responses. Our results clearly show that higher, sustained levels of CYP3A4 enzyme expression and activity are attained by approximately 3 days after differentiation (Figure 2B and C). The subsequent experiments to assess CYP3A4 activity were conducted on days 3 and 7 after spheroid differentiation.
In a previous study, 2 midazolam metabolites, 1-hydroxymidazolam and 4-hydroxymidazolam, were readily observed in LC/MS chromatograms after incubation with CYP3A4-transfected Caco-2 cells. 40 The analyte 1-hydroxymidazolam was the major and primary metabolite formed by CYP3A4; therefore, we did not quantify 4-hydroxymidazolam in this study. Although multiple LC-MS/MS methods on the quantification of 1-hydroxymidazolam have been published, this is the first validated and optimized quantitative assay to determine CYP3A4 inhibition or induction in 3-D HepaRG spheroids. Several specialized in vitro assays have been used to predict CYP inhibition and induction by drug candidates, allowing for relatively fast screenings of the effects of xenobiotics on CYP enzymes. However, most of these methods only assessed enzyme activity after a single time point. Using these methods, it is impossible to examine dynamic changes, such as enzyme expression and activity, throughout the incubation. We aimed to create a novel method that overcame these weaknesses. Our results show that the metabolic capacity of CYP3A4 can be measured in a 3-D HepaRG culture system over long incubation periods of differentiated HepaRG spheroids (Figure 2). Since we only focused on measuring the metabolic capacity of CYP3A4 in this study, it will be necessary to test other major phase I enzymes to capture the complexity of xenobiotic metabolism.
Finally, we assessed the chronic hepatotoxicity of drug candidates. Determination of hepatotoxicity is problematic because various phenotypic characteristics are used as indicators of hepatotoxicity. We assessed chronic hepatotoxicity in terms of hepatocyte damage. The stability of the biological and metabolic activity of phase I and II drugs is essential for assessment of hepatotoxicity. Therefore, we used the 3-D HepaRG system under differentiation conditions. Differentiated HepaRG spheroids are used in hepatotoxicity studies more frequently than HepG2 and other hepatoma cell lines. High and stable expression of CYP enzymes enables detection of drug metabolites and toxic effects; this allows repeated-dose studies to be performed. The 3-D HepaRG system has greater sensitivity towards toxicants than HepG2 cells or PHHs. Inhibition rate of amiodarone and tamoxifen at the concentration of 10 and 100 μmol/L was the highest in HepaRG spheroids. Furthermore, the 3-D HepaRG system was tested to predict the chronic hepatotoxicity of drug candidates. Most of the test compounds at 10 µmol/L showed cytotoxicity in 3-D HepaRG spheroids by 14 days (Figure 7). However, the time to 50% inhibition differed slightly among the compounds. Although the mechanism and phenotype of chronic hepatotoxicity vary, cytotoxic effects were detected in this study. Interestingly, buspirone, which reportedly has mild mitochondrial toxicity, exerted a slight hepatotoxic effect in our system. In summary, we suggest that methods for the assessment of repeated-dose hepatotoxicity are needed during drug development, and the 3-D HepaRG spheroid system appears to be a useful model for these early predictive determinations.
Footnotes
Authors’ Contributions
Dae-Seop Shin contributed to conception and design, acquisition, analysis, and interpretation, drafted thebmanuscript, and critically revised the manuscript; Hyewon Seo, Jung Yoon Yang, and Jeongmin Joo contributed to acquisition and analysis, drafted the manuscript, and critically revised the manuscript; So Hee Im and Seong Soon Kim contributed to analysis and interpretation and critically revised the manuscript; Sang Kyum Kim contributed to interpretation and critically revised the manuscript; Myung Ae Bae contributed to conception and design, contributed to analysis and interpretation, drafted the manuscript, and critically revised manuscript. All authors gave final approval and agree to be accountable for all aspects of work ensuring integrity and accuracy.
Declaration of Conflicting Interests
The author(s) declared no potential conflicts of interest with respect to the research, authorship, and/or publication of this article.
Funding
The author(s) disclosed receipt of the following financial support for the research, authorship, and/or publication of this article: This work was supported by a grant from the Ministry of Trade, Industry, and Energy, Korea (grant no. 2017-10063396).