
Abstract
Compensatory tissue repair (CTR) in thioacetamide (TA)-primed rats protects them against acetaminophen (APAP)-induced lethality. This study was aimed at investigating the mechanisms of CTR-mediated heteroprotection in mice. Male Swiss Webster mice received a priming dose of TA (40 mg/kg body weight [BW] in 10 mL distilled water [DW]/kg BW, intraperitoneally [IP]). Thioacetamide-induced liver injury, CTR, and expression of annexin A1 and A2 (ANX1 and ANX2), the endogenous inhibitors of the death protein secretory phospholipase A2 (sPLA2), were measured over a time course of 84 hours after TA priming. Both centrilobular necrosis and CTR peaked at 36 hours after TA priming as indicated by significantly increased plasma alanine transaminase (ALT) and aspartate transaminase (AST) activities, liver histology, and proliferating cell nuclear antigen immunostaining. Thioacetamide priming resulted in the overexpression of ANX1 and ANX2 at 36 to 84 hours and 12 to 60 hours, respectively. A lethal dose of APAP (600 mg/kg BW in 10 mL 0.45% NaCl/kg BW, IP) was given at 12, 24, or 36 hours after TA-priming. Thioacetamide priming did not affect the rise in plasma ALT, AST, sPLA2, and arachidonic acid levels seen at 2 hours after the APAP overdose. Neither these biochemical parameters nor histology suggested any escalation of hepatic injury at later time points (12 and 24 hours after APAP overdose), consistent with 100% survival of the TA + APAP-treated mice compared to DW + APAP-treated mice, which had 100% mortality. Inhibition of ANX1 and ANX2 biosynthesis using cycloheximide (40 mg/kg BW in 5 mL DW/kg BW, IP) abolished this heteroprotection. Our data indicate that hepatic overexpression of ANX1 and ANX2 inhibits APAP-induced expansion of liver injury.
Introduction
Autoprotection and heteroprotection are the phenomena of protection afforded by the prior administration of a small dose of a toxicant against the toxic and lethal effects of a larger dose of the same (auto) or a different (hetero) toxicant, respectively. These phenomena were first described by our laboratory in early 1990s.
1,2
A well-known example of autoprotection is that of CCl4 autoprotection.
3,4
Well-known examples of heteroprotection are the protection provided by the priming dose of thioacetamide (TA) against a lethal dose of acetaminophen (APAP) in male Sprague Dawley (SD) rats,
2
phenylhydrazine against 2-butoxyethanol-induced hematotoxicity in female SD rats,
5
and by mercuric chloride (HgCl2) against S-(1,2-dichlorovinyl)-
For this study, we hypothesized that the hepatic overexpression of ANX1 and ANX2 in the CTR-derived newly dividing/divided hepatocytes of the TA-primed mice would prevent the sPLA2-mediated expansion of liver injury after a lethal dose of APAP. The significance of ANX1 and ANX2 overexpression in the complete protection by TA against APAP-induced liver failure (Table 1) was further confirmed by blocking the biosynthesis of ANX1 and ANX2 with a protein synthesis inhibitor cycloheximide (CHX) administered at 1 hour prior to the priming dose of TA. As expected, CHX intervention completely abolished the otherwise observed 100% protection against APAP-induced liver injury and mortality of TA-primed mice. The loss of protection was characterized by the inhibited hepatic overexpression of ANX1 and ANX2. Our findings demonstrate that the inhibition of the destructive action of the death protein sPLA2 by its endogenous inhibitors ANX1 and ANX2 explains the TA-mediated heteroprotection against the mortality induced by a lethal dose of APAP in mice.
Effect of TA Priming on Survival of APAP-Overdosed Mice.a
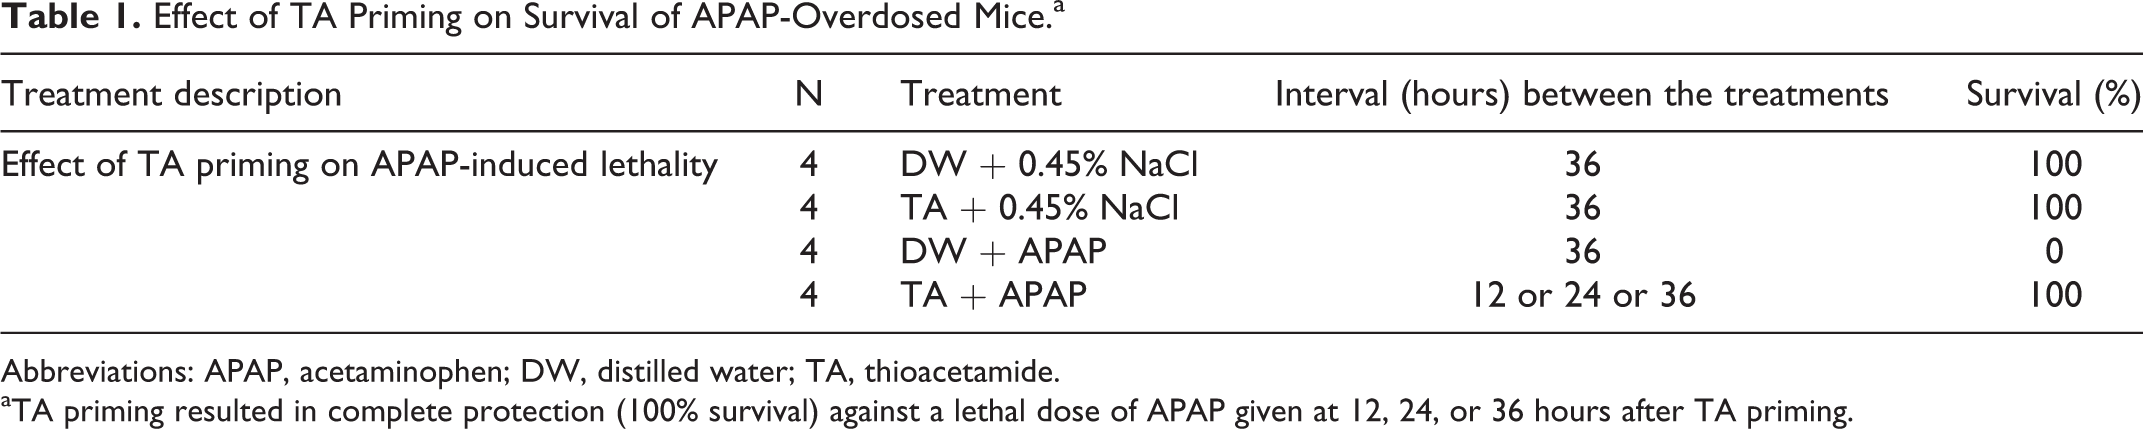
Abbreviations: APAP, acetaminophen; DW, distilled water; TA, thioacetamide.
aTA priming resulted in complete protection (100% survival) against a lethal dose of APAP given at 12, 24, or 36 hours after TA priming.
Materials and Methods
Animals
Male Swiss Webster (SW) mice (25-30 g) were procured from Harlan Sprague-Dawley (Indianapolis, Indiana) and were housed over sawdust bedding free of any known chemical contaminants (Sani-Chips; Harlan Teklad, Madison, Wisconsin) in temperature (21°C ± 1°C) and humidity-controlled facility with a 12-hour photoperiod. Mice had ad libitum access to rodent chow (Harlan Teklad Rat Chow No. 7001) and water and were acclimatized for 5 days in our central animal facility before their use in experiments. All animal experiments were carried out according to the protocol approved by the Institutional Animal Care and Use Committee at the University of Louisiana at Monroe.
Chemicals
Unless otherwise specified, all the chemicals and biochemicals were obtained from Sigma-Aldrich (St Louis, Missouri).
Treatment
After a 5-day acclimation period, mice were divided into 6 groups. Group 1 received a priming dose of TA (40 mg/kg body weight [BW] in 10 mL distilled water (DW)/kg, intraperitoneally [IP]). Groups 2 and 3 received a lethal dose of APAP (600 mg/kg BW in 10 mL 0.45% NaCl/kg BW, pH 8.2, IP) at 36 hours after a priming dose of DW (DW + APAP) or TA (TA + APAP), respectively. The TA-primed group 1 mice were euthanized at 0, 12, 24, 36, 48, 60, 72, and 84 hours (n = 4 for each time point) after TA priming. Four mice from groups 2 (n = 16) and 3 (n = 16) each were euthanized at 2, 12, and 24 hours after the APAP overdose, and the remaining 4 mice of each of these groups were observed for 14 days to record survival versus mortality. Mice in groups 4 (n = 8) and 5 (n = 8) received a single dose of either DW or CHX (40 mg/kg BW in 5 mL DW/kg BW, IP) intervention, respectively, administered at 1 hour before TA priming. For the 4 mice in groups 4 and 5, each were euthanized at 36 hours after TA priming. The remaining 4 mice from groups 4 and 5 each received a lethal dose of APAP at 36 hours after TA priming and were observed for 14 days to record survival and mortality. Group 6 mice (n = 8) received a priming dose of TA at 36 hours before a lethal dose of APAP and a single dose of diethyl maleate (DEM, 0.2 mL/kg BW in 5 mL corn oil/kg BW, IP) at 75 minutes after APAP overdosing. Four mice from this group were euthanized at 2 hours after APAP overdosing, and the remaining 4 mice were observed for 14 days to record survival and mortality (Table 2).
Effect of DEM-Induced Almost Complete Depletion of Hepatic GSH on the Survival of APAP-Overdosed TA-Primed Mice.a
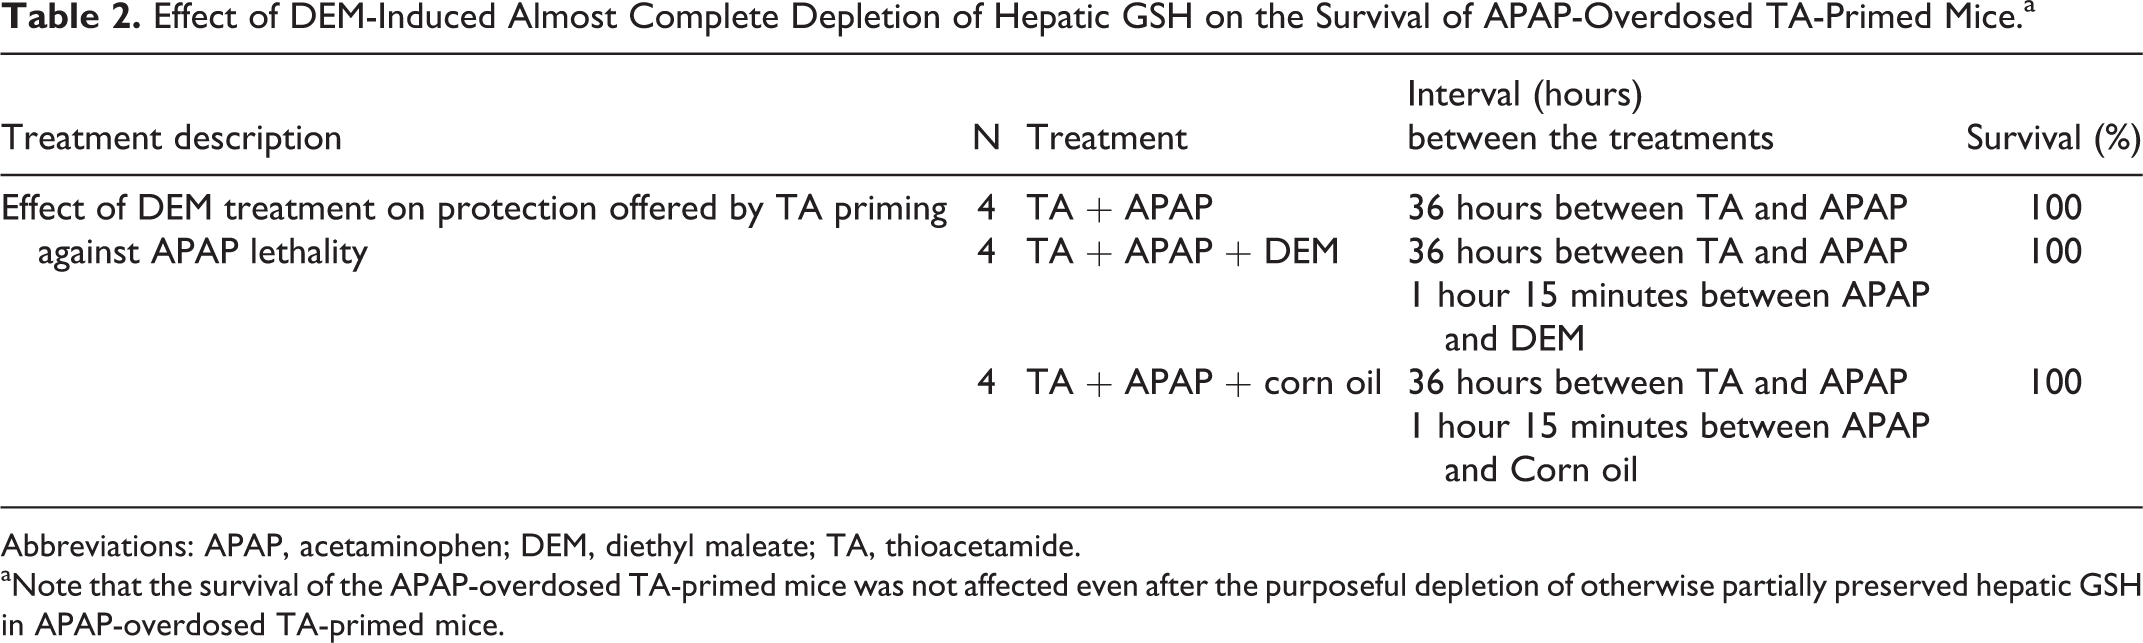
Abbreviations: APAP, acetaminophen; DEM, diethyl maleate; TA, thioacetamide.
aNote that the survival of the APAP-overdosed TA-primed mice was not affected even after the purposeful depletion of otherwise partially preserved hepatic GSH in APAP-overdosed TA-primed mice.
Biochemical Analysis
Blood samples were collected from the retro orbital sinus of the mice under light diethyl ether anesthesia. Entire liver from the animals (euthanized in a CO2 chamber) was excised and immediately stored at −80°C for further analysis. Plasma was collected by centrifugation of blood samples at 5,000g (4°C, 7 minutes) for the biochemical assessments. Plasma alanine transaminase (ALT) and aspartate transaminase (AST) activities were measured using the respective kits from Pointe Scientific Co (Canton, Michigan) and were expressed as U/L. Plasma sPLA2 activity was measured using the sPLA2 assay kit from Cayman Chemical Co (Ann Arbor, Michigan) and was expressed as µmoles of the diheptanoyl thio-phosphatidylcholine substrate hydrolyzed/min/mL. Plasma arachidonic acid (AA) was measured using the enzyme-linked immunosorbent assay kit from Biotang Inc (Lexington, Massachusetts), as per the manufacturer’s instructions. Hepatic microsomes for the cytochrome P-450 content were prepared by differential ultracentrifugation as per previously described method. 15 Hepatic reduced (GSH) and oxidized glutathione (GSSG) were measured as described previously. 16 Results were expressed in nmoles of GSH and GSSG per milligram liver protein. Protein content in liver homogenate was measured using the kit supplied by Thermo Scientific Co (Rockford, Illinois).
Histology and Immunohistochemistry
Liver samples from control and treated mice were washed in ice-cold normal saline (0.9% NaCl), cut into thin slices, and then fixed for 48 hours in neutral-buffered 10% formalin solution supplied by Sigma-Aldrich. The tissues were then transferred into 70% ethyl alcohol, processed, and embedded in paraffin wax. Paraffin-embedded liver sections (4 µm) were stained with hematoxylin–eosin for light microscopic histopathological examination. Histology and immunohistochemistry were performed as described previously 9 using rabbit polyclonal primary antibody for proliferating cell nuclear antigen (PCNA, 1:1,000 dilution; Santa Cruz Biotechnology, Santa Cruz, California) and goat polyclonal primary antibody for ANX1 (1:300 dilution; Santa Cruz Biotechnology) for the expression analysis of PCNA and ANX1, respectively. Color development was achieved using horseradish peroxidase (HRP)-conjugated anti-rabbit (1:5,000; Cell Signaling Technology, Danvers, Massachusetts) or anti-goat (1:5,000; Santa Cruz Biotechnology) secondary antibody and incubation with diaminobenzidine for 5 minutes, which gave a brown reaction product. The cells were counterstained with hematoxylin. The PCNA-positive hepatocytes were quantified for 10 high-power fields using digital camera equipped with Axiovision software (Zeiss, Jena, Germany).
Western Blot Analysis
Liver samples were homogenized in lysis buffer (50 mmol/L Tris base, 150 mmol/L sodium chloride, 1.0% Triton X-100, 0.5% sodium deoxycholate, 0.1% sodium dodecyl sulfate, 100 mmol/L sodium fluoride, 1 mmol/L phenylmethanesulfonyl fluoride, 10 mmol/L EDTA, and 2 mmol/L sodium orthovanadate). Samples were then incubated for 1 hour in ice bath and centrifuged at 10,000g for 10 minutes. Supernatant was collected and protein concentration of each sample was determined. Samples containing equal amounts of protein in equal volumes of sample buffer were separated on a 4% to 20% Mini-Protean TGX Precast Gel (Bio-Rad Laboratories, Hercules, California). Precision Plus Protein Kaleidoscope Standards marker (Bio-Rad Laboratories) was included during each Western blot running. After transferring the proteins to 0.45 µm polyvinylidene fluoride transfer membranes (Thermo Scientific, Rockford, Illinois), nonspecific binding sites were blocked with 2% bovine serum albumin in Tris-buffered saline (10 mmol/L Tris-HCl, 50 mmol/L NaCl, pH 7.4, and 0.1% Tween 20; TBST) for 2 hours at room temperature. Membranes were then incubated overnight at 4°C with goat polyclonal primary antibodies for ANX1 (1:300 dilution; Santa Cruz Biotechnology) or rabbit polyclonal primary antibody for ANX2 (1:300 dilution; Santa Cruz Biotechnology) or rabbit polyclonal primary antibody for Cyp2e1 (1:1,000 dilution; Abcam, Cambridge, Massachusetts) or rabbit polyclonal primary antibody for β-actin (1:2,000 dilution; Cell Signaling Technology). Antibodies were diluted with TBST. Membranes were then washed with TBST and incubated with HRP-conjugated antirabbit (1:5,000; Cell Signaling Technology) or anti-goat (1:5,000; Santa Cruz Biotechnology) secondary antibody for 1 hour at room temperature. Immunoreactive proteins were detected using Supersignal West; Femto Maximum Sensitivity Substrate provided by Thermo Scientific. Protein expression was determined by densitometric analysis using the AlphaImager HP V 5.0.1 software (Cell Biosciences, Santa Clara, California). The housekeeping protein β-actin was used as a loading control. Protein expression is shown as the optical density of the protein band relative to that of the housekeeping protein β-actin content.
Statistical Analysis
All data are expressed as mean ± standard error of the mean (SEM). Data were analyzed using one-way analysis of variance, with Tukey’s post hoc analysis. P ≤ 0.05 was considered as a statistically significant difference. All calculations were performed using GraphPad Prism software (GraphPad Software, Inc, La Jolla, California).
Results
Plasma ALT and AST Activities After the Priming Dose of TA
Plasma ALT and AST activities were measured as biomarkers of liver injury. The ALT and AST activities peaked at 36 hours after TA priming, declining thereafter (Figure 1A). These values returned to their normal levels by 84 hours after TA priming.
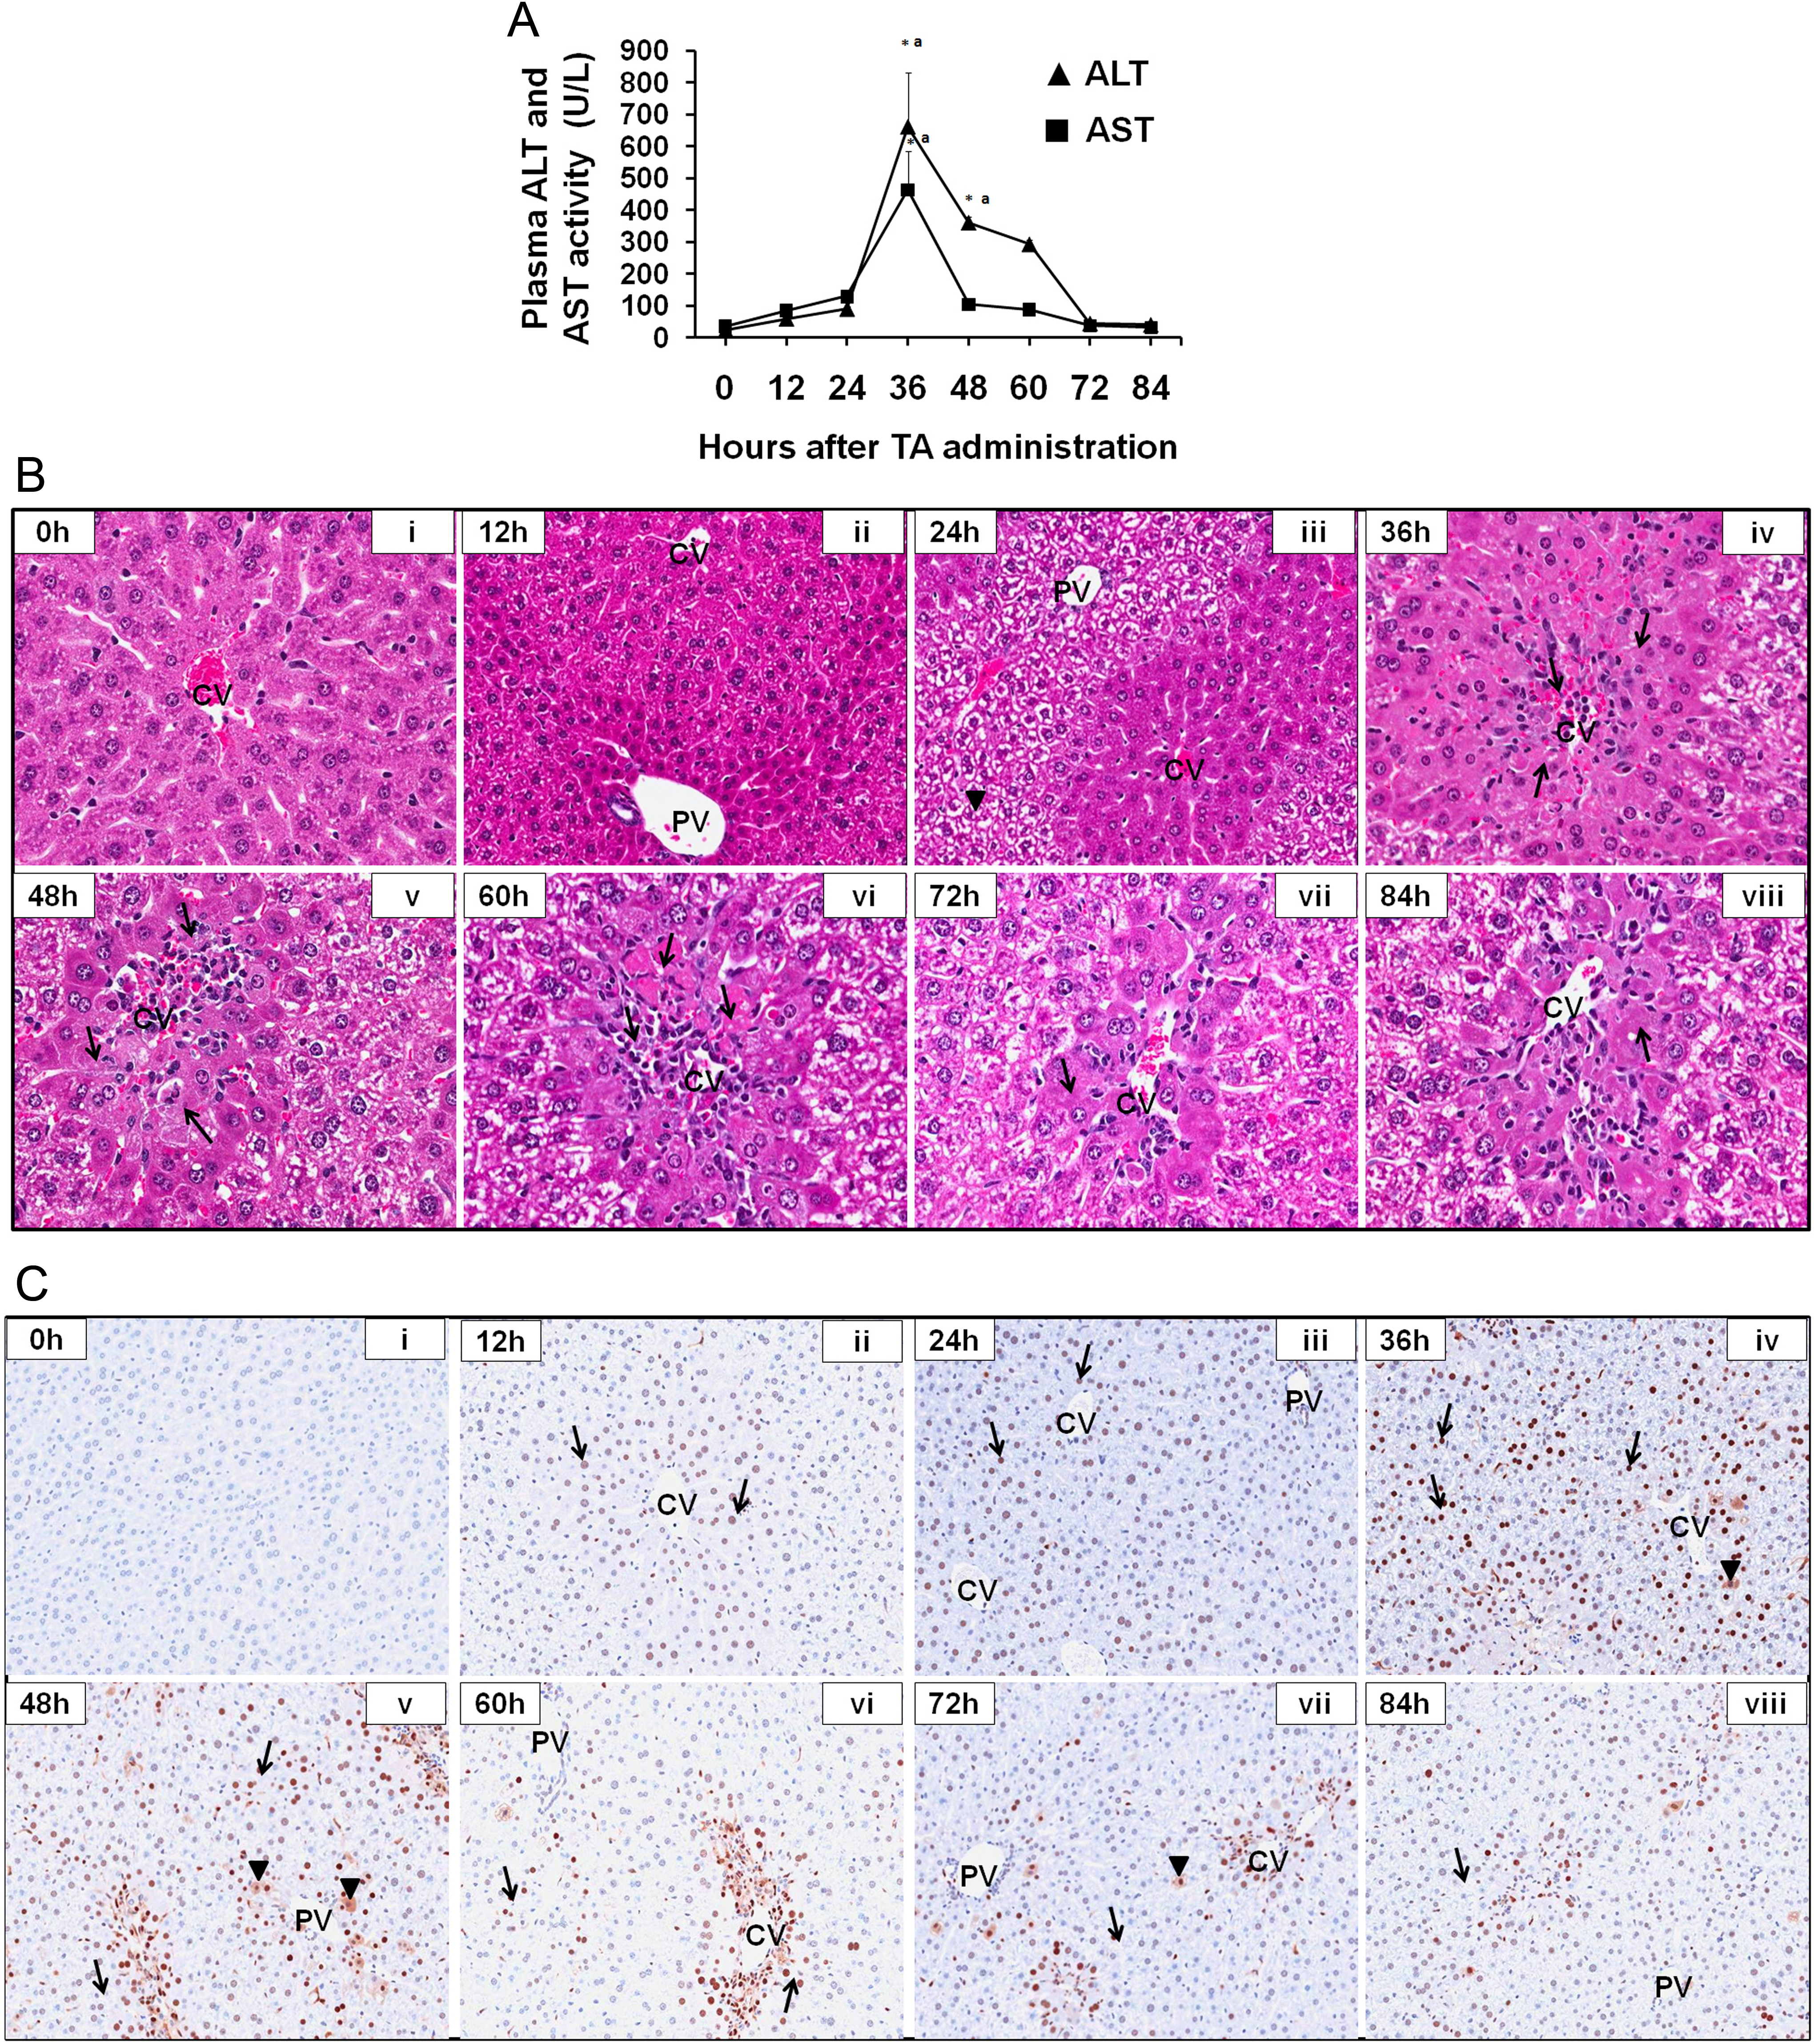
A, Time course study of plasma ALT and AST activities in TA-primed mice. On day 0, mice were treated with a priming dose of TA (40 mg/kg BW in DW, IP) in 10 mL DW/kg BW. Plasma ALT and AST activities were measured at the indicated time points. The TA-induced liver injury peaked at 36 hours as indicated by the highest activities of ALT and AST at this time point. Results are expressed as mean ± SEM (n = 4) for each group at every time point. *,aSignificantly different from 0-hour value for the respective parameter (P ≤ 0.05). Representative photomicrographs of the time course study for (B) histopathological analysis and (C) PCNA immunohistochemical staining in liver after a priming dose of TA. (i) control mice without TA priming 0 hour, (ii) TA-primed mice euthanized at 12 hours, (iii) TA-primed mice euthanized at 24 hours, (iv) TA-primed mice euthanized at 36 hours, (v) TA-primed mice euthanized at 48 hours, (vi) TA-primed mice euthanized at 60 hours, (vii) TA-primed mice euthanized at 72 hours, (viii) TA-primed mice euthanized at 84 hours. Magnification in (i) to (viii): 550× in (B) and 275× in (C). Arrow and arrowhead in (B) represent necrotic cells and periportal glycogen deposition, respectively. Arrow and arrowhead in (C) represent PCNA-positive staining and cells in G2 phase, respectively. ALT indicates alanine transaminase; AST, aspartate transaminase; DW, distilled water; PCNA, proliferating cell nuclear antigen; SEM, standard error of the mean; TA, thioacetamide.
Liver Histopathology After the Priming Dose of TA
As expected, histopathologic comparison of livers from TA-primed mice at 12, 24, 36, 48, 60, 72, and 84 hours after TA priming showed maximum liver injury at 36 hours (Figure 1B[iv]) compared to the control mice (Figure 1B[i]). Liver injury was characterized by maximum centrilobular necrosis at 36 hours followed by mild to minimal centrilobular necrosis at 48 to 84 hours after TA priming (Figure 1B[v]-[viii], respectively). Microvesicular vacuolization (degeneration) of centrilobular eosinophilic hepatocytes was observed at 12 and 24 hours after TA priming (Figure 1B[ii] and 1B[iii], respectively).
Thioacetamide Priming Stimulates Proliferation of Mice Hepatocytes
The TA-induced CTR response was measured by examining the PCNA-positive cells through immunohistochemical staining procedure. Very minimal or no PCNA staining was observed in the liver of the control mice at 0 hour (Figure 1C[i]). Strong PCNA staining was observed at 24, 36, and 48 hours after TA priming (Figure 1C[iii], 1C[iv], and 1C[v], respectively). Minimal staining was observed at 12, 60, 72, and 84 hours after TA priming (Figure 1C[ii], 1C[vi],1C[vii], and 1C[viii], respectively). Hepatocytes in different stages of cell cycle were identified using this technique. As compared to control mice livers, where most cells were in the resting phase (G0), TA priming resulted in the progression of G0 cells to G1 phase within 12 hours. The stimulated cell cycle continued thereafter resulting in a large number of cells in G1 and a few cells in S-phase at 24 hours. The maximum number of cells in the S-phase was observed at 36 and 48 hours followed by 60 hours after TA priming. At 48 and 60 hours after TA priming, hepatocytes in all phases of the cell cycle (G1, S, G2, and M) were present throughout hepatic lobules. At 72 hours after TA priming, most of the cells were found in G2 and M phases. By 84 hours, the stimulatory effect of TA-priming on liver tissue regenerative repair was almost completed as evidenced by higher number of cells in G0 phase and very small number of the cells in G2 and M phases.
Hepatic Expression of ANX1 and ANX2 in TA-Primed Mice
The TA priming resulted in overexpression of ANX1 (Figure 2A) and ANX2 (Figure 2B) in mice livers. Maximum expression of ANX1 and ANX2 was observed at 36 to 84 hours and 12 to 60 hours, respectively, after TA priming. These findings are commensurate with the results obtained from the PCNA immunostaining where the PCNA-positive proliferating hepatocytes were found at 12 to 84 hours after TA priming (Figure 1C[ii]-[viii]).
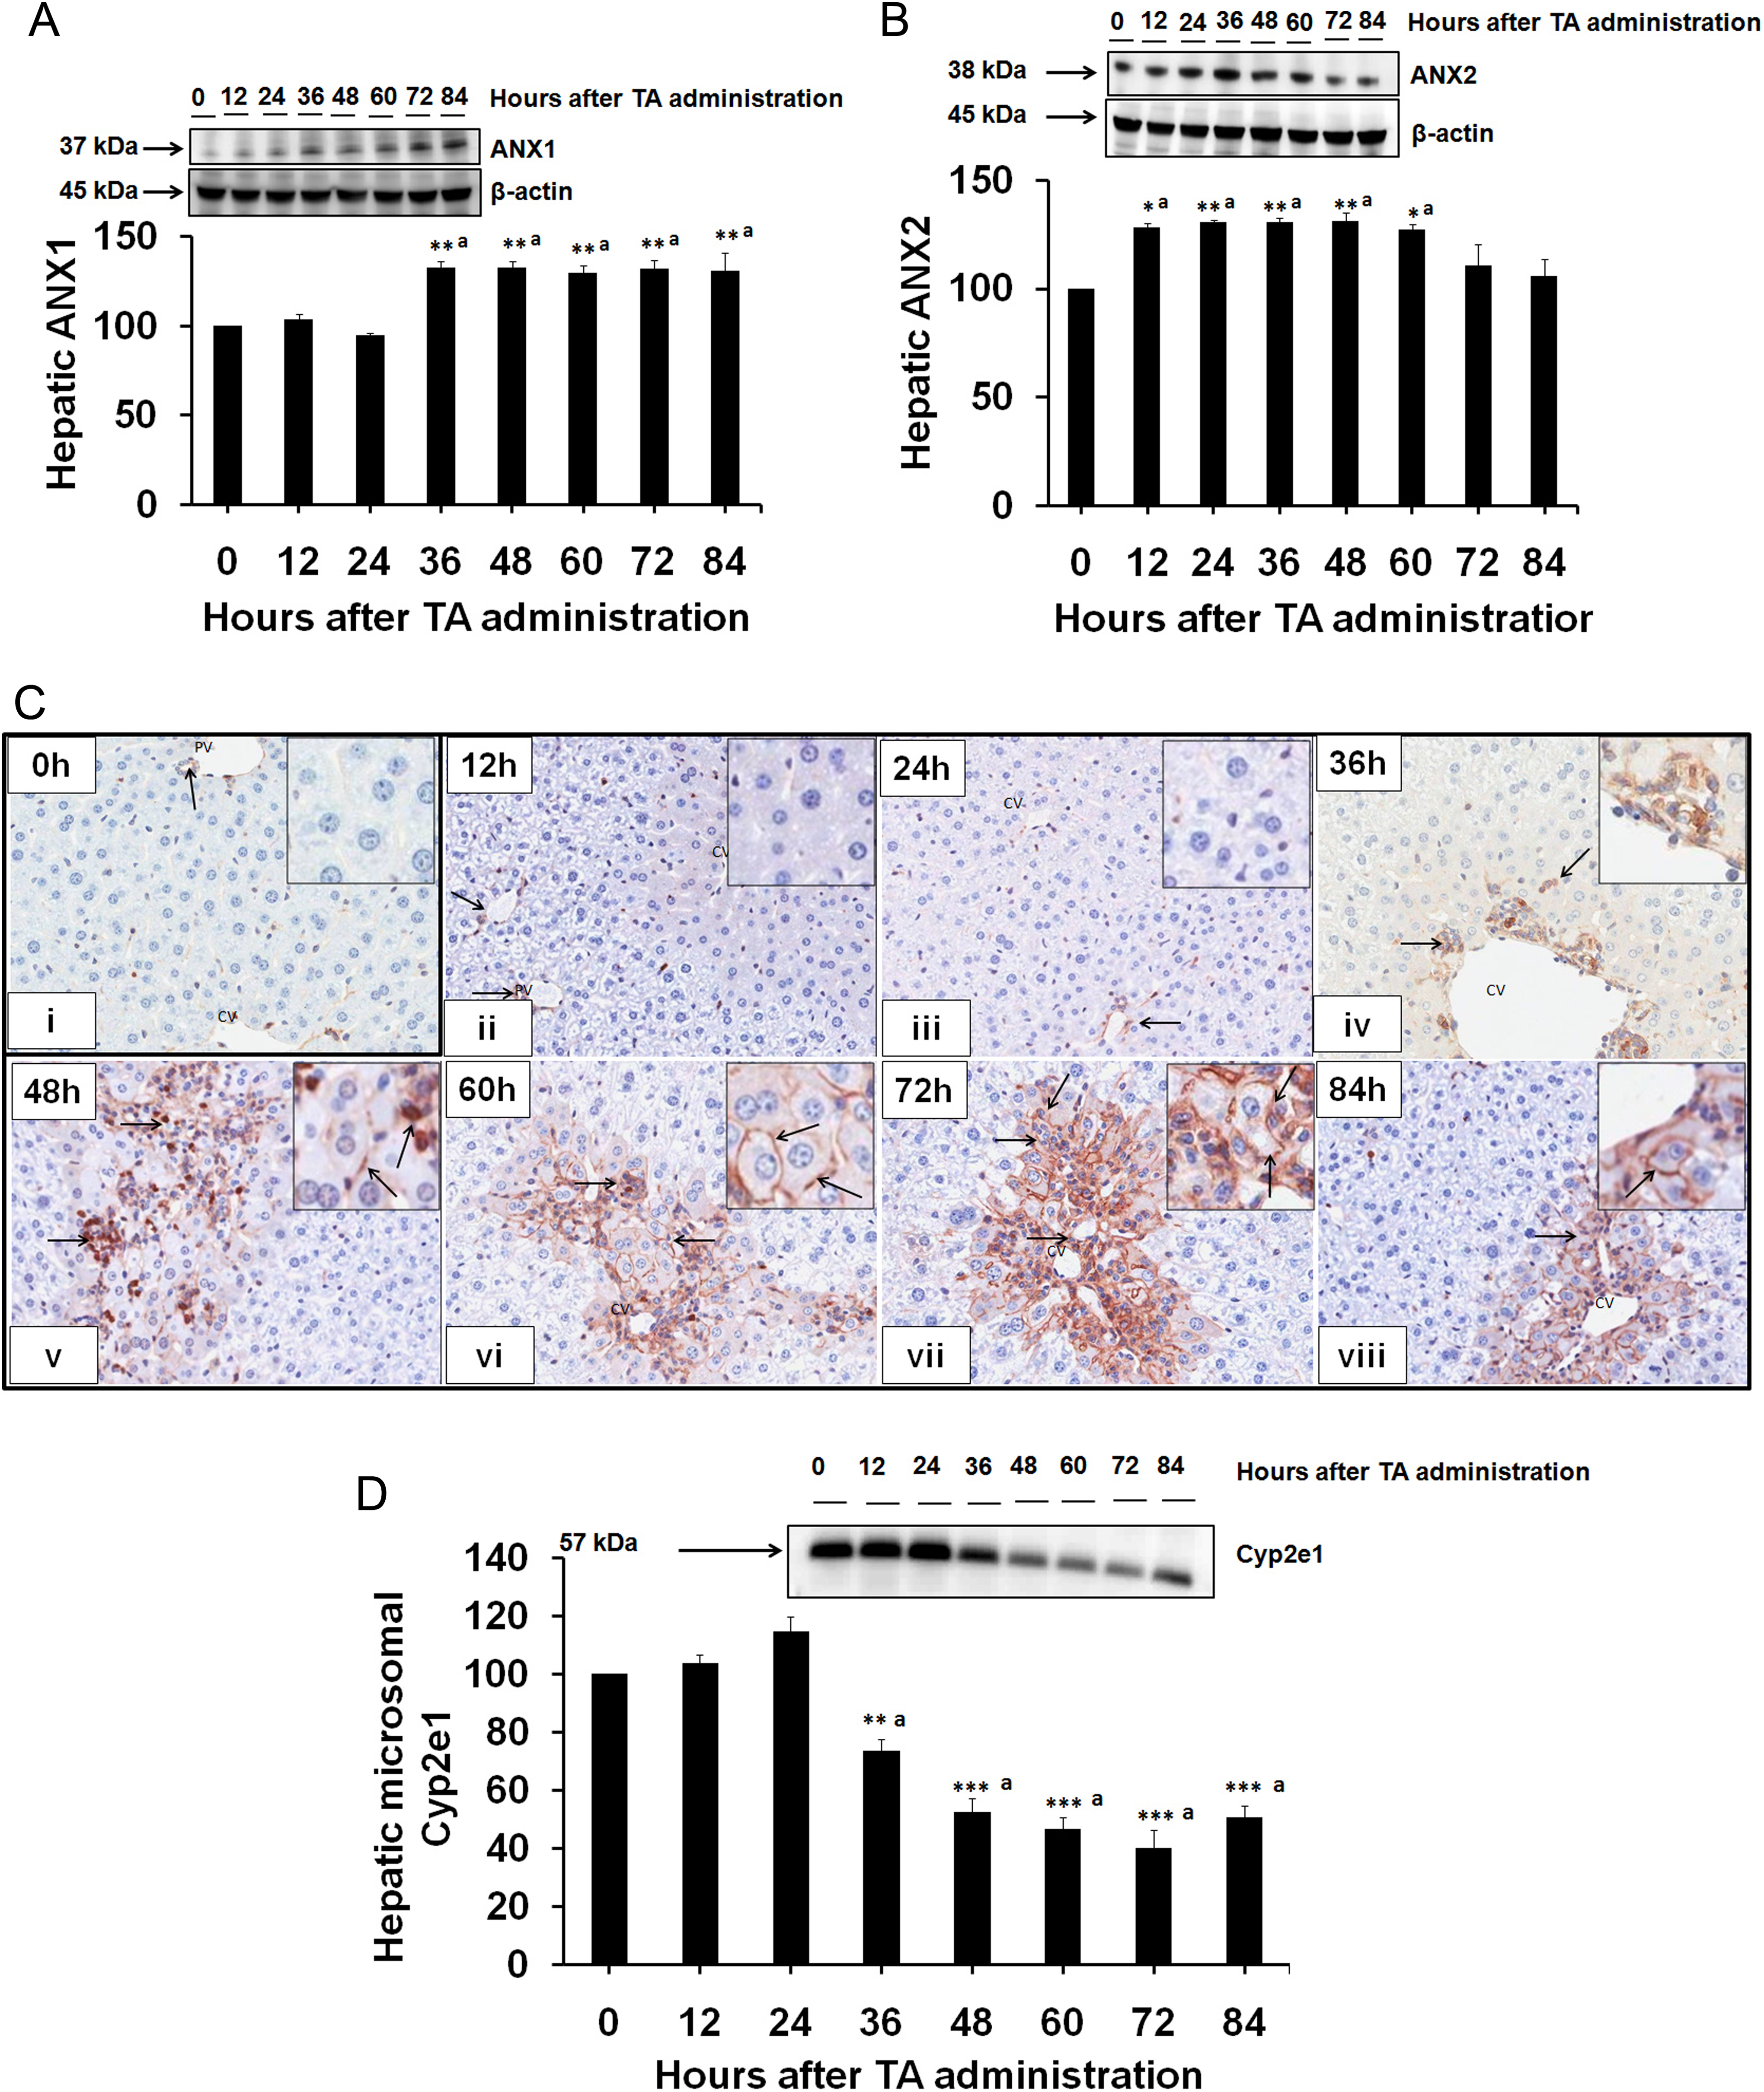
Representative blots of hepatic (A) ANX1 and (B) ANX2 protein expression along with the respective densitometric analysis in TA-primed mice. β-Actin served as an internal control. Densitometric results are expressed as mean ± SEM (n = 3) for each group at every time point. *,aSignificantly different from control (P ≤ 0.05). C, Representative photomicrographs of the hepatic ANX1 immunohistochemical staining in TA-primed mice euthanized at 0 (i), 12 (ii), 24 (iii), 36 (iv), 48 (v), 60 (vi), 72 (vii), and 84 hours (viii) after TA priming. Brown color represents ANX1-positive staining (arrow). Magnification in (i) to (viii): 550×. D, Representative blot with the respective densitometric analysis of the hepatic microsomal Cyp2e1 protein as assessed by Western blot analysis at 0, 12, 24, 36, 48, 60, 72, and 84 hours after TA priming. Densitometric results are expressed as mean ± SEM (n = 3) for each group at every time point. *,aSignificantly different from control (P ≤ 0.05). ANX1 indicates annexin A1; ANX2, annexin A2; SEM, standard error of the mean; TA, thioacetamide.
Plasma Membrane Localization of ANX1 in TA-Primed Mice
Only bile duct epithelial cells and endothelial cells of the blood vessels stained positive for ANX1 at 0, 12, and 24 hours after TA priming (Figure 2C[i], 2A[ii], and 2C[iii], respectively), indicating its basal expression in these cells. Little increase in ANX1 staining was observed in centrilobular area at 36 hours after TA-priming (Figure 2C[iv]). Stronger immunostaining was observed at 48 to 84 hours after TA priming (Figure 2C[v]-2C[viii], respectively). As expected, the plasma membranes of the hepatocytes were found to be intensely stained for ANX1 than cytoplasm. The results were consistent with the Western blot analysis for ANX1, where increased expression of ANX1 was observed at 36 to 84 hours after TA priming.
Liver Microsomal Cytochromes P-450 Levels in TA-Primed Mice
Western blot analysis was performed to measure the hepatic microsomal Cyp2e1 level after TA priming over a time course. Although TA priming did not affect the hepatic microsomal Cyp2e1 level at 12 and 24 hours after TA-priming, a marginal decrease (∼25%) at 36 hours and dramatic decrease thereafter the TA priming (Figure 2D) was observed.
Plasma ALT, AST, and sPLA2 Activities and AA Level After a Lethal Dose of APAP in TA-Primed and DW-Primed Mice
Rise in ALT, AST, and sPLA2 activities and AA level was examined at 2, 12, and 24 hours after a lethal dose of APAP in TA-primed and DW-primed mice. Thioacetamide priming did not affect the rise in ALT (Figure 3A), AST (Figure 3B), and sPLA2 (Figure 3C) activities and AA level (Figure 3D) seen at 2 hours after a lethal dose of APAP. No further rise in ALT, AST, and sPLA2 activities and AA level was observed after a lethal dose of APAP in TA-primed mice in stark contrast to continued elevation of these biomarkers of hepatocyte destruction after a lethal dose of APAP in DW-primed mice.
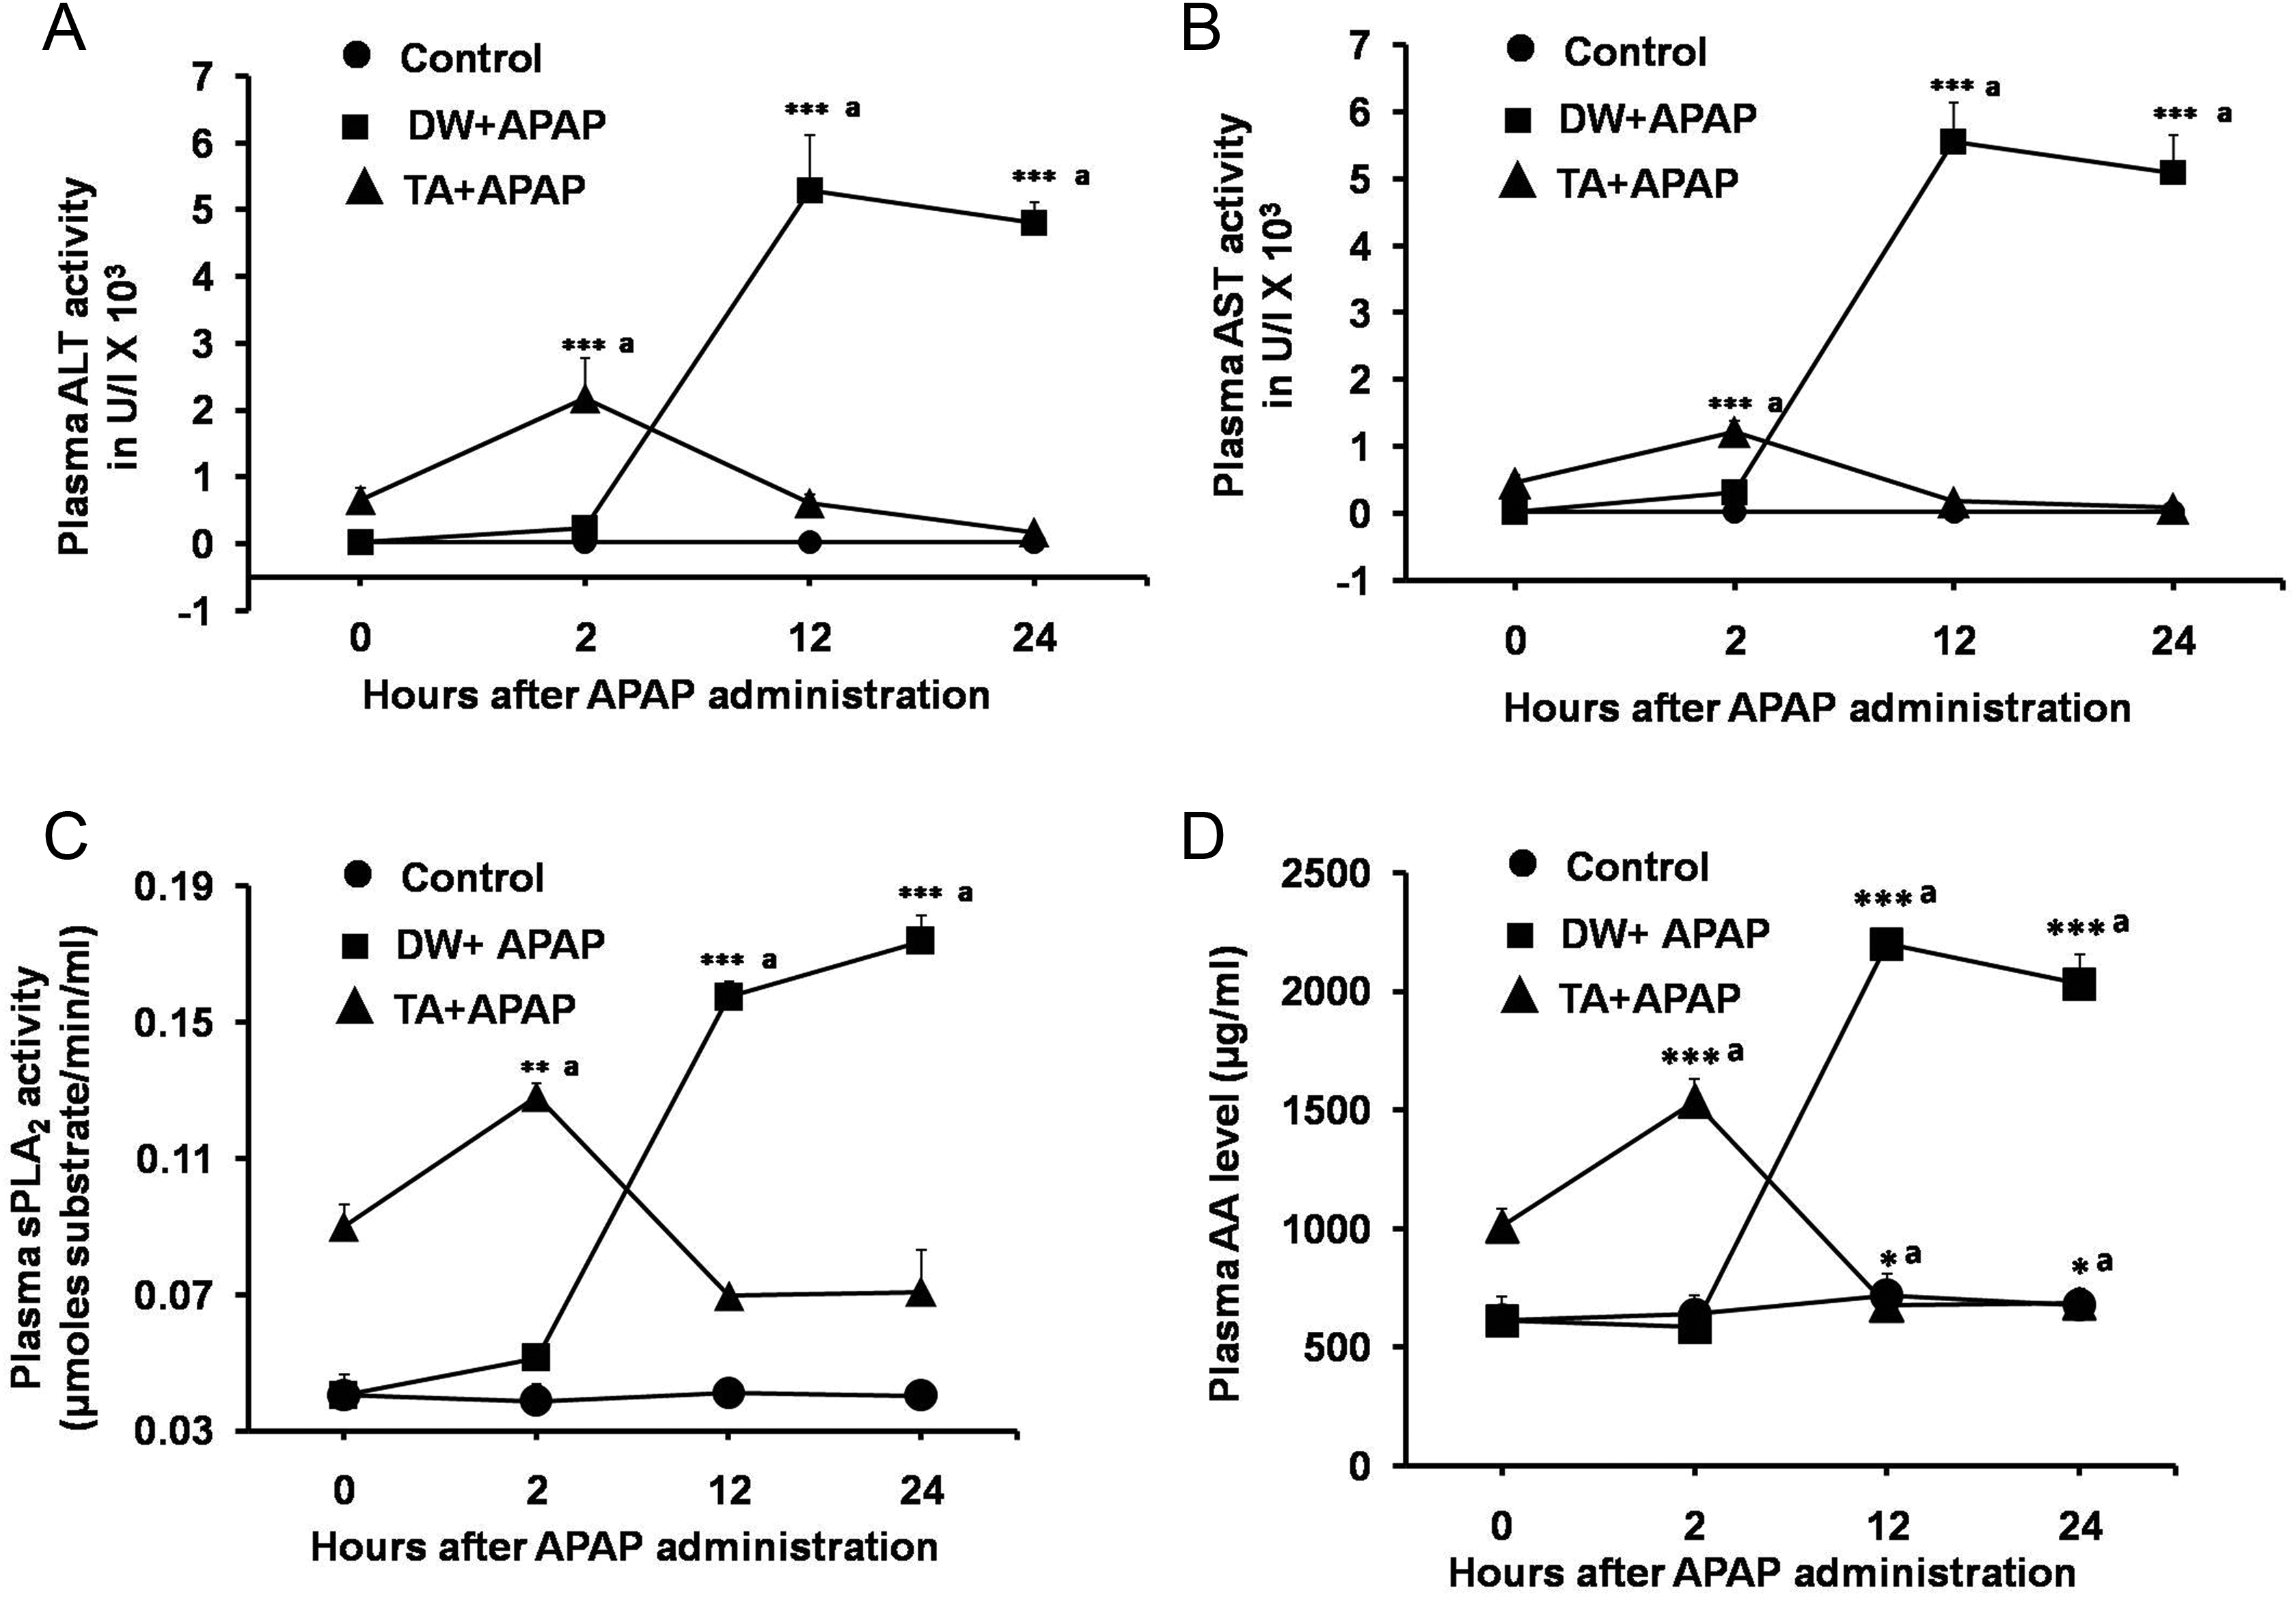
Plasma ALT (A), AST (B), and sPLA2 (C) activities and AA levels (D) at the indicated time points after a lethal dose of APAP in TA-primed and DW-primed mice. Results are expressed as mean ± SEM (n = 4) for each group at every time point. *,aSignificantly different from control (P ≤ 0.05). ALT indicates alanine transaminase; APAP, acetaminophen; AST, aspartate transaminase; DW, distilled water; SEM, standard error of the mean; sPLA2, secretory phospholipase A2; TA, thioacetamide.
Liver Histopathology After a Lethal Dose of APAP
Severe diffused centrilobular liver necrosis was observed at 2 hours after a lethal dose of APAP in TA-primed mice (Figure 4A[v]) as compared to DW-primed mice (Figure 4A[ii]). Only a single cell necrosis along with microvesicular cytoplasmic vacuolization was observed in most centrilobular locations (Figure 4A[ii]) at 2 hours after a lethal dose of APAP in DW-primed mice. In spite of the massive liver necrosis at 2 hours in the heteroprotection group, the centrilobular degeneration and necrosis were mild at 12 hours (Figure 4A[vi]) and minimal at 24 hours (Figure 4A[vii]) after a lethal dose of APAP in TA-primed mice as compared to severe diffused centrilobular necrosis with lobular bridging at 12 (Figure 4A[iii]) and 24 hours (Figure 4A[iv]) after a lethal dose of APAP in DW-primed mice. These findings are in complete concordance with the biochemical markers of liver injury (Figure 3).
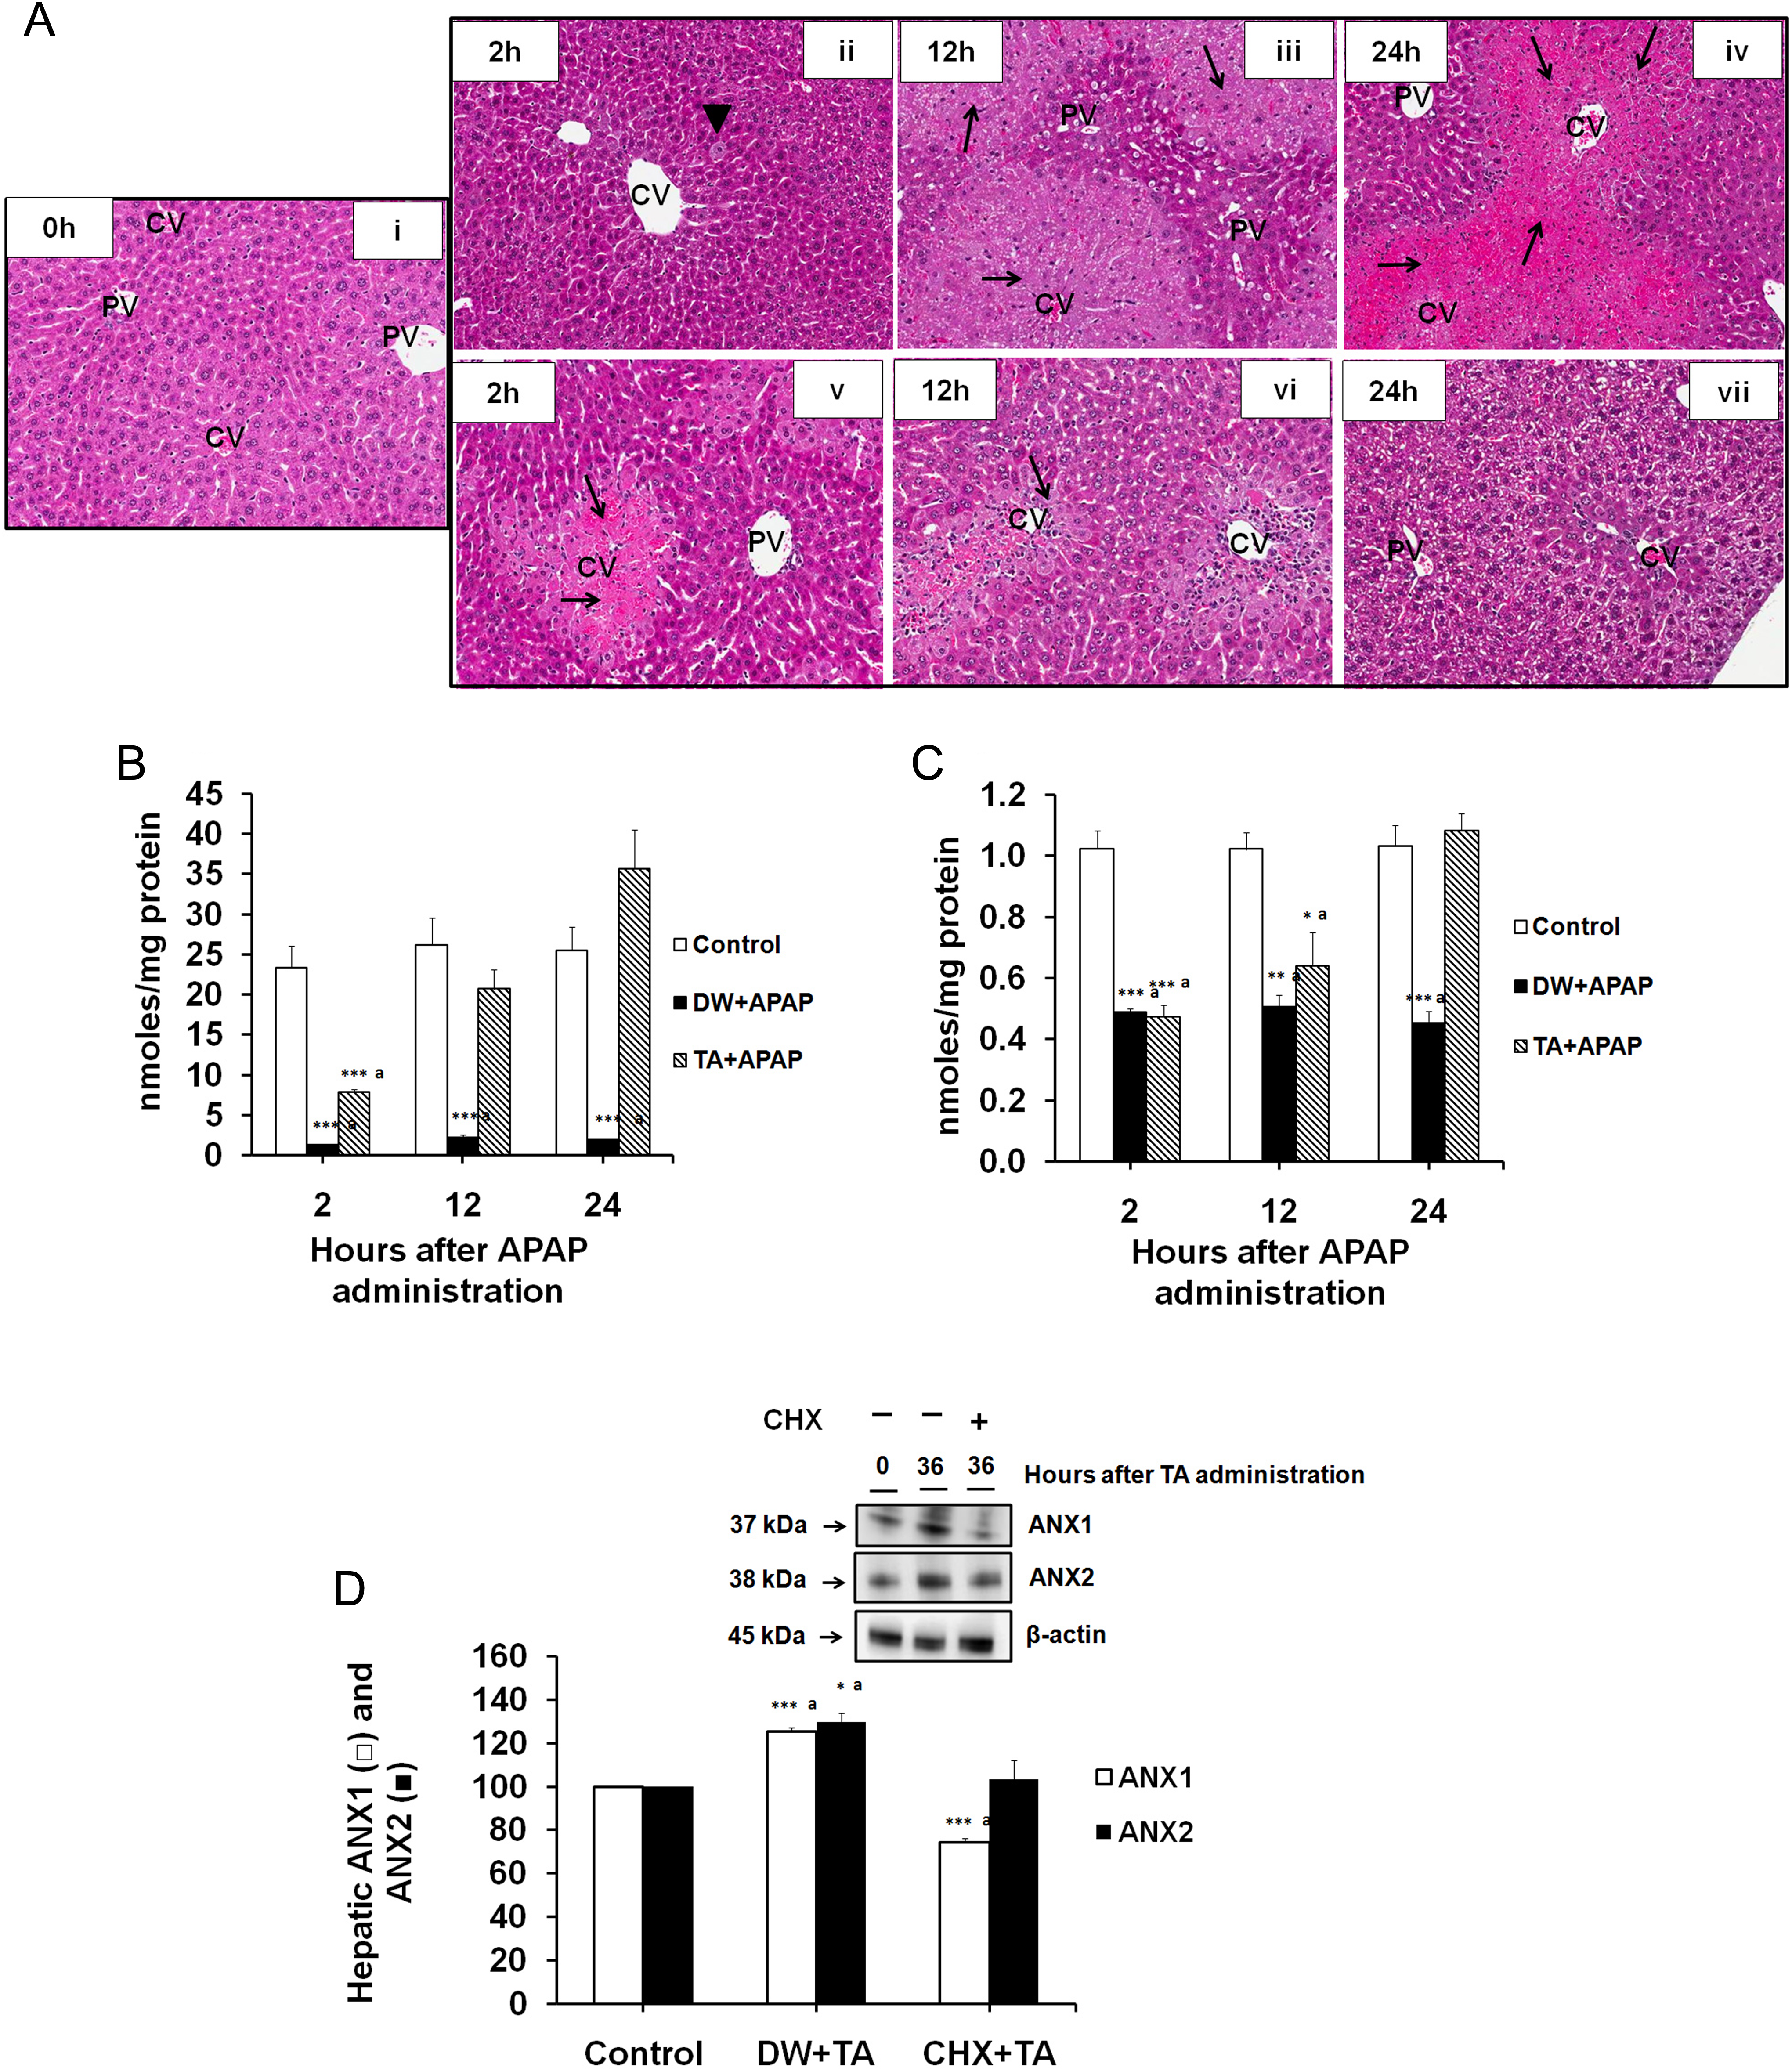
A, Histopathological analysis of liver after a lethal dose of APAP in TA-primed and DW-primed mice: (i) control mice, (ii) DW-primed mice euthanized at 2 hours after APAP overdose, (iii) DW-primed mice euthanized at 12 hours after APAP overdose, (iv) DW-primed mice euthanized at 24 hours after APAP overdose, (v) TA-primed mice euthanized at 2 hours after APAP overdose, (vi) TA-primed mice euthanized at 12 hours after APAP overdose, and (vii) TA-primed mice euthanized at 24 hours after APAP overdose. Arrow and arrowhead represent necrotic cells and single cell necrosis, respectively. Magnification in (i) to (viii): ×275. Hepatic (B) reduced (GSH) and (C) oxidized form of glutathione (GSSG) during a time course after a lethal dose of APAP administered to TA-primed and DW-primed mice. It should be noted that at 12 and 24 hours, the TA-primed mice already began resynthesizing hepatic GSH. The recovery of GSH was complete by 24 hours. D, Hepatic ANX1 and ANX2 protein expression along with the respective densitometric analysis at 36 hours in TA-primed mice receiving either CHX or its vehicle DW. β-Actin served as an internal control. Densitometric results are expressed as mean ± SEM (n = 3) for each group at every time point, *,aSignificantly different from control (P ≤ 0.05). ANX1 indicates annexin A1; ANX2, annexin A2; APAP, acetaminophen; CHX, cycloheximide; DW, distilled water; GSH, reduced glutathione; GSSG, oxidized glutathione; TA, thioacetamide.
Hepatic Glutathione Levels After the Lethal Dose of APAP
Conjugation of the N-acetyl-P-benzoquinone imine (NAPQI), the reactive metabolite of APAP, with hepatic GSH leads to the depletion of hepatic GSH after administration of a lethal dose. Lethal dose of APAP led to a significant depletion (∼70%) of hepatic GSH at 2 hours after APAP poisoning in TA-primed mice as compared to 95% hepatic GSH depletion in DW-primed mice (Figure 4B). Although TA-priming slightly preserved GSH, it did not affect the GSSG depletion at 2 hours after a lethal dose of APAP (Figure 4C). The restoration of GSH and GSSG commenced at 12 hours and was completed by 24 hours after APAP treatment in TA-primed animals. Restoration of normal GSH and GSSG in the liver did not occur in APAP-poisoned DW-primed mice.
Effect of a Single Dose of DEM on Hepatic GSH Levels in APAP-Overdosed TA-Primed Mice
A single dose of DEM at 75 minutes after APAP overdose led to nearly complete depletion (∼97%) of hepatic GSH and GSSG (Supplemental Figure) at 2 hours after APAP poisoning in TA-primed mice in contrast to ∼70% depletion of hepatic GSH at 2 hours after APAP poisoning in TA-primed mice that received the vehicle corn oil. In spite of the DEM-induced nearly complete depletion of hepatic GSH at 2 hours after a lethal dose of APAP in TA-primed mice, the survival was not affected, still yielding 100% survival (Table 2).
Effect of CHX Intervention
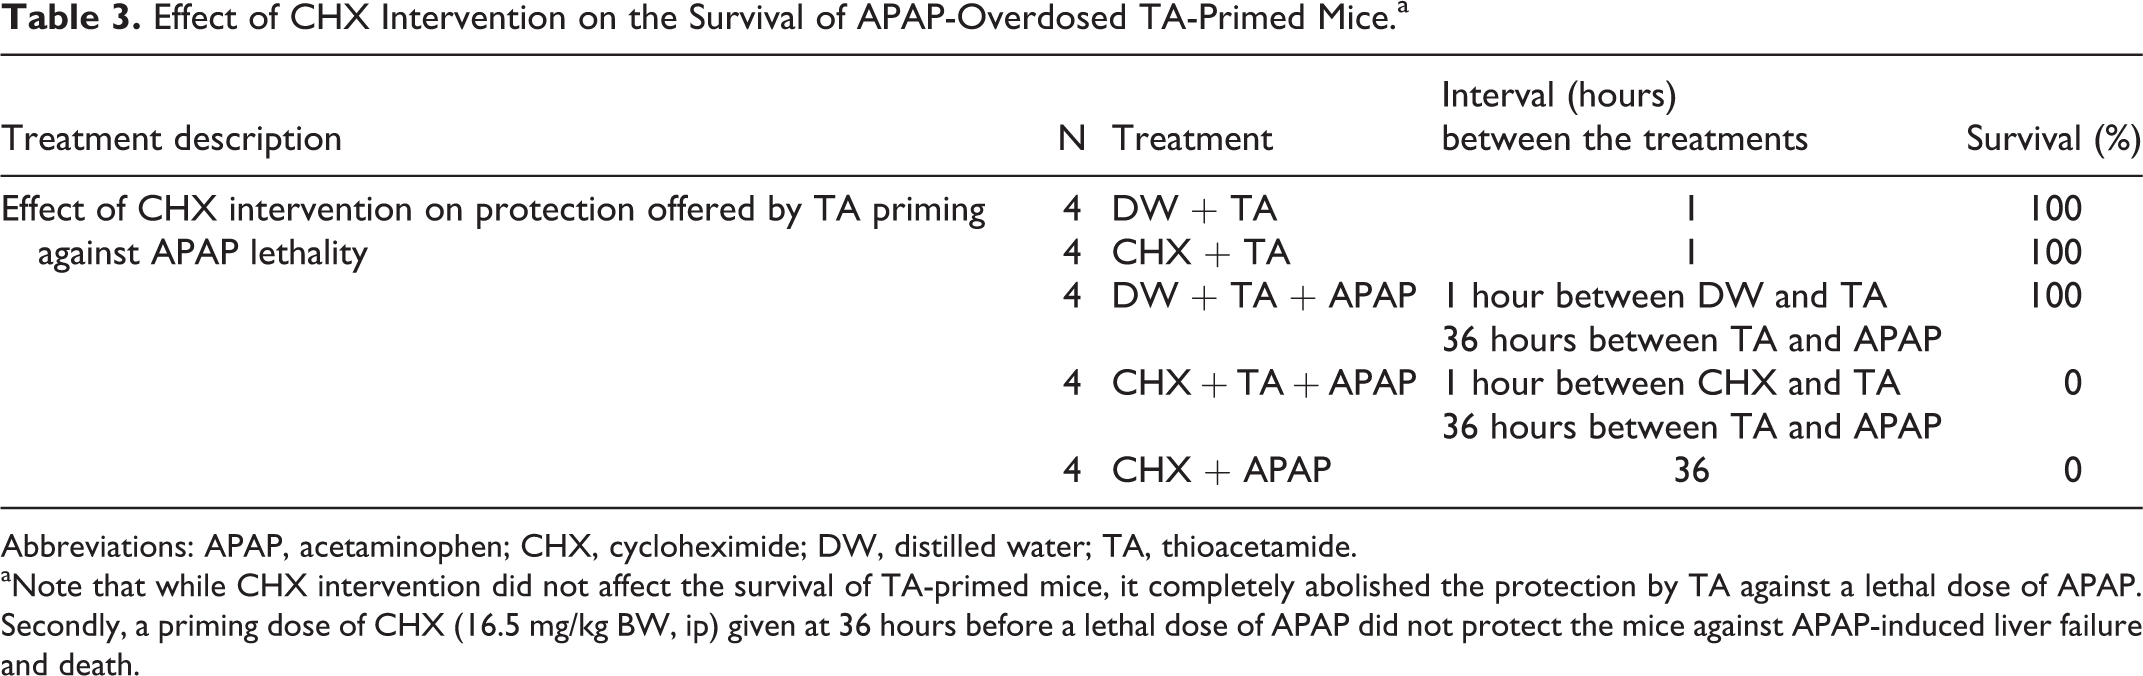
The protection offered by the overexpression of ANX1 and ANX2 was further confirmed by administering CHX at 1 hour before TA priming to inhibit the TA-induced protein biosynthesis of ANX1 and ANX2. As expected, CHX treatment inhibited the overexpression of both proteins ANX1 and ANX2 (Figure 4D) and abolished the heteroprotection in stark contrast to 100% survival of the TA-primed APAP-overdosed mice that received the vehicle DW intervention (Table 3). In the absence of APAP overdose, CHX administration did not cause any mortality of the TA-primed mice.
Effect of CHX Intervention on the Survival of APAP-Overdosed TA-Primed Mice.a
Abbreviations: APAP, acetaminophen; CHX, cycloheximide; DW, distilled water; TA, thioacetamide.
aNote that while CHX intervention did not affect the survival of TA-primed mice, it completely abolished the protection by TA against a lethal dose of APAP. Secondly, a priming dose of CHX (16.5 mg/kg BW, ip) given at 36 hours before a lethal dose of APAP did not protect the mice against APAP-induced liver failure and death.
Discussion
Induced cell division and CTR as a result of the inflicted tissue injury from a priming dose of toxicant have long been reported as the mechanism of the protection observed in auto- and heteroprotection models of toxicity. 1,2,4,17,18 However, the mechanisms that make the CTR-derived newly divided cells resilient to lethality of the subsequently administered lethal dose of the same (autoprotection) or a different toxicant (heteroprotection) were unknown. The question of why the death proteins sPLA2- and calpain-mediated expansion of liver injury, which normally occurs after a lethal dose of the toxicants, 7 does not ensue in the presence of newly divided cells has remained only partially answered.
In order to address this void, in this study, we stimulated the cell division and CTR by administering a priming dose (40 mg/kg) of TA at 36 hours before administering a lethal dose of APAP. This priming dose of TA is 1/12th of the LD100 dose in mice 19 and causes minimal liver necrosis. As a result of the TA-initiated liver necrosis, the surrounding hepatocytes are stimulated to divide in order to replace the dying necrotic cells. 17,18 This results in increased cell proliferation and stimulated CTR after TA priming. The time course study of plasma ALT and AST in TA-primed mice indicated that TA caused only a minimal level of liver injury, which did not expand beyond 36 hours due to CTR (Figure 1A). These findings were corroborated by the histopathological analysis, which revealed maximum centrilobular necrosis at 36 hours, declining thereafter (Figure 1B). As an opposing force to TA-initiated liver injury, the CTR also peaked at 36 hours (Figure 1C), when most hepatocytes were in the S-phase of cell division compared to the control mice livers with most of the cells in the resting phase (G0). The TA priming–induced cell cycle continued thereafter, resulting in a large number of cells in G1 and S-phase till 60 hours after TA priming. The large population of cells in G2 and M phases at 48 and 60 hours after TA-priming indicates that the stimulatory effect of the TA-priming on CTR was very minimal beyond these time points. To investigate the CTR-mediated mechanisms of resiliency of these newly divided cells to the lethal dose of APAP, we examined significance of the hepatic expression of ANX1 and ANX2, the endogenous inhibitors of the death protein sPLA2. As expected, TA priming resulted in the overexpression of ANX1 and ANX2 during 36 to 84 hours and 12 to 60 hours, respectively (Figure 2A and 2B). This indicates that hepatocytes in the S, G2, and M phases of cell cycle overexpress ANX1, whereas ANX2 was largely expressed by the G1 and S phases of the hepatocytes. In order to examine the cellular location of the ANXs, we performed immunohistochemical analysis of ANX1. As expected, ANX1 was localized on the plasma membrane of the hepatocytes (Figure 2C). This finding strongly supports our hypothesis of the inhibition of sPLA2-mediated destruction of hepatocytes by the ANXs. Our findings are consistent with the previous observations made by De Coupade et al 13 and Masaki et al, 14 who reported the overexpression of ANX1 and ANX2 in the regenerating liver of mice. Annexin A1 and several related proteins were upregulated in the alcoholic liver disease in baboons and humans, suggesting the role of ANX1 in regulating liver injury and promoting repair of the injured livers. 20 Similarly, hepatic ANX2 was one of the highly upregulated genes after a priming dose of APAP in APAP autoprotection study in mice. 21
On the basis of ANX1 and ANX2 expression data (Figure 2A-C) and the hepatic microsomal Cyp2e1 level after TA priming (Figure 2D), we administered a lethal dose (LD80) of APAP at 36 hours after a priming dose of TA. The rationale of selecting 36-hour time period between TA priming and a lethal dose of APAP was to capture the earliest time point after TA priming, showing the overexpression of both ANX1 and ANX2. As expected, TA priming resulted in 100% survival of the APAP-overdosed death-bound mice in contrast to 100% mortality of APAP-overdosed mice that received a priming dose of vehicle DW (Table 1). Possible interference of APAP bioactivation was not the reason of 100% survival of APAP-overdosed TA-primed mice, because TA priming did not affect the rise in plasma ALT, AST, and sPLA2 activities seen at 2 hours after the APAP overdose (Figure 3A-C). The rise in plasma AA, the hydrolytic product of the death protein sPLA2, was also not affected at 2 hours after APAP overdose in TA-primed mice (Figure 3D). Thioacetamide priming, however, prevented further elevation of these biomarkers seen at 12 and 24 hours after the APAP overdose (Figure 3A-D) in vivid contrast to the continued elevation of these biomarkers in the mice that received a priming dose of DW. Decreased plasma AA levels at 12 and 24 hours after APAP overdose in TA-primed mice (Figure 3D) indicate the inhibited activity of death protein sPLA2 by ANX1 and ANX2. The rapid decline in the plasma sPLA2 activity beyond 2 hours after a lethal dose of APAP in TA-primed mice could also be attributed to the extremely short circulatory half-lives (2.85 minutes for group 1 and <30 seconds for group 2 isozymes) of sPLA2 enzymes as reported in the rats. 22,23 The alteration in these biochemical parameters (ALT, AST, sPLA2, and AA) were completely concordant with what we found in liver histological analysis. Histopathology of liver tissue revealed massive centrilobular necrosis at 2 hours (Figure 4A[v]) after APAP overdose in TA-primed mice as compared to DW-primed mice (Figure 4A[ii]). In spite of this much higher centrilobular necrosis at 2 hours in APAP-overdosed TA-primed mice, there was dramatic recovery at 12 (Figure 4A[vi]) and 24 hours (Figure 4A[vii]) after the APAP overdose in these mice as compared to the continued expansion of injury leading to the profound centrilobular necrosis and bridge formation in DW-primed mice at 12 (Figure 4A[iii]) and 24 hours (Figure 4A[iv]) after APAP overdose. This is second evidence that negates the possibility of interference with the initiation of APAP-induced liver injury by TA priming. The third evidence that completely rule out the possibility of interference with APAP bioactivation by TA priming is evident by the observation that all the mice (n = 4) survived a lethal dose of APAP even when given at 12 or 24 hours after TA priming when Cyp2e1 level was not decreased. Because only ANX2 was overly expressed at these early time points (Figure 2A, B), these findings indicate that overexpression of ANX2 alone can protect the mice against a lethal dose of APAP. This is consistent with the observation made by O’Connor et al 21 where only hepatic ANX2 and not ANX1 was upregulated after a priming dose of APAP in their autoprotection model. But it should be noted that unlike O’Connor’s autoprotection study with APAP, 21 we administered TA to prime the animals in our heteroprotection study. The difference in toxicants, their priming dose and the extent of priming dose-induced liver injury, and CTR explains why the hepatic expression of ANX1 was also found in the TA-primed mice of our heteroprotection study. Due to highly significant decrease (∼50%) in hepatic microsomal Cyp2e1 at and beyond 48 hours after TA priming (Figure 2D), we did not administer a lethal dose of APAP at these later time points. Taken together, our findings clearly indicate that animals can withstand the lethal dose of APAP when the death protein sPLA2 is inhibited. The death protein sPLA2 has already been reported to mediate the expansion of liver injury after a lethal dose of the hepatotoxicant, ischemia/reperfusion-induced myocardial injury, lipopolysaccharide-induced acute lung injury, and neuronal injury. 9,24 –26 These studies highlight the detrimental role of sPLA2 in tissue injury.
Another noteworthy finding of our study was an abrupt and remarkable restoration of the depleted hepatic GSH after a lethal dose of APAP in TA-primed mice as compared to the sustained depletion of hepatic GSH after a lethal dose of APAP in DW-primed mice (Figure 4B). Unexpectedly, there was a partial preservation of hepatic GSH at 2 hours after APAP overdose in TA-primed mice as compared to APAP-overdosed DW-primed mice (Figure 4B). However, the protection offered by TA priming appears to be unrelated to the partially preserved hepatic GSH after TA priming. This conclusion is supported by the observation from the experiment where purposeful depletion of hepatic GSH using a single dose of DEM (Supplemental Figure) did not affect the survival of the APAP-overdosed TA-primed mice (Table 2). Consistent with our observation, the already published literature reports that the altered hepatic GSH homeostasis is not the reason of in vitro hepatoprotection against APAP toxicity in mice hepatocytes. 27 Collectively, these data negate the possibility of decreased bioactivation of APAP and partially preserved hepatic GSH as the mechanisms of 100% survival of the APAP-overdosed TA-primed mice.
Now, if the inhibition of sPLA2 by the overexpression of ANX1 and ANX2 was the mechanism of heteroprotection by TA against a lethal dose of APAP, the inhibition of ANX1 and ANX2 protein synthesis using a universal protein synthesis inhibitor CHX 28 should abolish this heteroprotection. As expected, intervention with CHX at 1 hour before TA priming resulted in inhibited overexpression of ANX1 and ANX2 (Figure 4D) as examined at 36 hours after TA priming. The CHX-induced inhibition of ANX1 and ANX2 biosynthesis in TA-primed mice resulted in 100% mortality after a lethal dose of APAP as compared to 100% survival of these mice when intervened with vehicle DW (Table 3). Furthermore, when the mice were primed with a small IP dose (∼1/6th of LD50) 29 of CHX (16.5 mg/kg BW in DW) instead of TA, it failed to offer protection against a lethal dose of APAP, yielding 100% mortality (Table 3). These data strongly suggest that the regression of APAP-initiated liver injury in TA-primed mice is solely attributable to the inhibition of the death protein sPLA2 by the plasma membrane ANX1 and ANX2.
Our results indicate that the inhibition of death protein sPLA2 by the hepatic overexpression of ANX1 and ANX2 in the newly divided liver cells of the TA-primed mice prevents the expansion of APAP-induced liver injury. According to the US Centers for Disease Control and Prevention, more than 400 people die annually due to APAP poisoning. 30 This implies that there is a need to develop the effective antidotal therapy in order to save the APAP-poisoned patients. Our findings suggest that inhibition of death protein sPLA2 using ANX-based synthetic inhibitor might offer a novel strategy for rescuing the APAP-overdosed patients.
Footnotes
Acknowledgments
The authors gratefully acknowledge the financial support by Dr. Mehendale to carry out the entire work described here.
Author Contributions
Vivekkumar Dadhania contributed to conception and design, contributed to acquisition, analysis, or interpretation of data, and drafted manuscript; Levan Muskhelishvili contributed to acquisition, analysis, or interpretation of data, and critically revised the manuscript for important intellectual content. John R. Latendresse contributed to acquisition, analysis, or interpretation of data and critically revised the manuscript for important intellectual content. Harihara M. Mehendale contributed to conception and design, contributed to acquisition, analysis, or interpretation of data, and critically revised the manuscript for important intellectual content. All authors gave final approval and agree to be accountable for all aspects of work ensuring integrity and accuracy.
Declaration of Conflicting Interests
The author(s) declared no potential conflicts of interest with respect to the research, authorship, and/or publication of this article.
Funding
The author(s) received no financial support for the research, authorship, and/or publication of this article.