
Abstract
Cardiovascular (CV) safety concerns are among the leading causes of compound attrition in drug development. This work describes a strategy of applying novel end points to a 7-day rodent study to increase the opportunity to detect and characterize CV injury observed in a longer term (ie, 28 days) study. Using a ghrelin receptor agonist (GSK894281), a compound that produces myocardial degeneration/necrosis in rats after 28 days at doses of 0.3, 1, 10, or 60 mg/kg/d, we dosed rats across a range of similar doses (0, 0.3, 60, or 150 mg/kg/d) for 7 days to determine whether CV toxicity could be detected in a shorter study. End points included light and electron microscopies of the heart; heart weight; serum concentrations of fatty acid-binding protein 3 (FABP3), cardiac troponin I (cTnI), cardiac troponin T (cTnT), and N-terminal proatrial natriuretic peptide (NT-proANP); and a targeted transcriptional assessment of heart tissue. Histologic evaluation revealed a minimal increase in the incidence and/or severity of cardiac necrosis in animals administered 150 mg/kg/d. Ultrastructurally, mitochondrial membrane whorls and mitochondrial degeneration were observed in rats given 60 or 150 mg/kg/d. The FABP3 was elevated in rats given 150 mg/kg/d. Cardiac transcriptomics revealed evidence of mitochondrial dysfunction coincident with histologic lesions in the heart, and along with the ultrastructural results support a mechanism of mitochondrial injury. There were no changes in cTnI, cTnT, NT-proANP, or heart weight. In summary, enhancing a study design with novel end points provides a more integrated evaluation in short-term repeat dose studies, potentially leading to earlier nonclinical detection of structural CV toxicity.
Introduction
Cardiovascular (CV) safety-related liabilities are a significant cause of attrition in both the nonclinical and the clinical phases of pharmaceutical development. 1 These liabilities vary in presentation, appearing as changes in cardiac or vascular function or morphology or worsening of preexisting CV disease in either animal models or human patients. These liabilities often limit medicines development and/or may result in removal of an effective medication from the market. Pharmaceutical companies are keenly interested in detecting these CV liabilities as early in the medicine development process as possible. Early recognition is critical for mitigating risk to patients by supporting the termination of candidate development, by supporting implementation of appropriate investigative studies, or by continuing medicine development with the addition of sensitive monitoring strategies to prevent harm to clinical study patients. Accordingly, failure to identify a potential liability early in nonclinical development may put patients at unintended risk and adds to the already considerable cost and resources of drug development.
Guidelines for assessing CV liabilities in nonclinical studies supporting human pharmaceutical development are defined by the International Conference on Harmonization (ICH; S7a, S7b). Strategies commonly applied among pharmaceutical companies involve evaluation of CV function in single-dose studies and morphologic characterizations with routine light microscopy in repeat-dose general toxicity studies. In vitro assessments of cardiomyocyte ion channel activity and dedicated in vivo studies using surgically implanted instrumentation aim to assess drug-related effects on blood pressure, heart rate, and electrophysiology. Functional assessments in general toxicity studies are mostly confined to periodic electrocardiogram recordings in either restrained or externally instrumented nonrodents.
Repeat-dose general toxicity studies generally follow a paradigm beginning with short duration studies in rodents and nonrodents to support candidate selection and phase I clinical trials (ICH; M3(R2)). An initial in vivo assessment in a nongood laboratory practice (non-GLP) rodent study of relatively short duration (4-14 days) often guides and supports the significant investment in a GLP-compliant package of longer duration nonclinical studies required for regulatory approval of first-time in-human clinical studies. In vivo general toxicity studies are very sensitive platforms for identifying structural injury to organ systems. High doses of compounds given in early, short-duration studies are aimed at detecting the limits of tolerability for longer duration studies as well as identifying likely target organs of toxicity. These short-term general toxicity studies include an assessment of tolerability, the gross and microscopic examination of a wide spectrum of potential target organs, toxicokinetics, and evaluation of a routine panel of serum chemistry and hematology parameters.
Organ systems with a physiologic reserve capacity (like the CV system) may not overtly exhibit injury until that reserve capacity has been exhausted following longer term exposure (ie, the dose does not always compensate for duration). Accordingly, development-limiting, drug-induced injury may not be detected by routine end points until longer duration nonclinical studies.
Novel biomarkers and capabilities in conjunction with traditional assessments provide an opportunity for a more holistic and temporally sensitive approach to detecting and characterizing CV toxicity (ie, identify potential liabilities earlier). Measureable changes in heart weight have traditionally been considered a subchronic or chronic change driven by changes in cardiac hemodynamic load, energetic deficiency, or anabolic growth. Serum levels of cardiac troponins (cTn) and fatty acid-binding protein (FABP) are translational markers that have been shown to report cardiomyocyte injury, oftentimes with sensitivity that exceeds histopathological findings depending on the chronologic progression of the injury and the sampling methods. 2,3 N-terminal proatrial natriuretic peptide (NT-proANP) has recently been characterized in rodents as a biomarker of hemodynamic load and ventricular stretch similar to clinical use. 4 -7 Transmission electron microscopy (TEM) is not a new capability, and although it is more labor intensive and evaluates a smaller area of tissue than light microscopy, this technique yields greater sensitivity for characterizing subcellular injury. Transcriptional tissue microarray analyses are extremely data rich, but data interpretation is time consuming and remains a challenge in the absence of an established uniform approach. In addition, small sample sizes in short-term repeat dose studies make it very challenging to associate unsupervised specific gene changes identified in large microarrays with a compound-related effect, particularly when the biologic association is unknown. We propose that a supervised approach that utilizes quantitative polymerase chain reaction (PCR; of a select number of CV-related genes for analysis) can be valuable in the overall study results interpretation.
Our objective was to evaluate a strategy to improve detection and characterization of CV injury earlier in drug development. As a proof of concept, we added novel end points onto a short duration repeat-dose rodent study (ie, 7 days) with a small-molecule ghrelin receptor agonist, GSK894281. Development of GSK894281 was terminated after CV toxicity (myocardial degeneration, necrosis, and fibrosis) was identified in a 28-day GLP-compliant rat study. Minimal to moderate myocardial injury was observed in male and female rats at all doses (0.3, 1.0, 10, and 60 mg/kg/d) in that 28-day study. Cardiovascular toxicity was not evident in 2 previous routine 7-day repeat-dose rodent studies with doses of 30, 100, or 300 mg/kg/d in male rats only or 3, 10, or 200 mg/kg/d in male and female rats (data not published). In addition to the microscopic changes in the heart, increases in heart weight in female rats administered 10 or 60 mg/kg/d and cardiac troponin I (cTnI) in male rats at all doses were observed in the 28-day rat study. Following a 4-week recovery period, the heart weight and cTnI levels were comparable to control values, although minimial myocardial degeneration/necrosis was noted in males previously given 60 mg/kg/d. Importantly, heart weight and cTnI were not measured on the previous 7-day studies. Therefore, in this investigative study, we enhanced the traditional 7-day study design by adding novel/nonroutine end points including electron microscopy, heart weight, transcriptomic analysis of heart tissue, and serum cardiac markers, cTnI, cTnT, and FABP3 to provide a holistic integration of evaluations, potentially leading to earlier nonclinical detection of structural CV toxicity.
Materials and Methods
Dose Formulation and Administration
GSK894281 was given by oral gavage to male Crl: CD(SD) rats (6/group) at doses of 0 (vehicle), 0.3, 60, or 150 mg/kg/d once daily for 7 days. The doses selected were based on the doses used in previous studies that produced CV findings. The test article was formulated as a solution at a concentration of 0.03 mg/mL and as a suspension at concentrations of 6 and 15 mg/mL in 1% methylcellulose (Sigma Chemical Co, St Louis, MO, 400 cps at 2%) in reverse osmosis-treated water (w/v) and administered to rats at a dose volume of 10 mL/kg. Additional pharmacological information about GSK894281 has been reported previously. 8
Animals
Experiments on animals followed the guidelines established in the Guide for the Care and Use of Laboratory Animals, 9 were conducted in accordance with the GSK Policy on the Care, Welfare, and Treatment of Laboratory Animals, and were reviewed by the Institutional Animal Care and Use Committee at GlaxoSmithKline.
Twenty-four [Crl: CD(SD)] specific pathogen-free male rats were obtained from Charles River Laboratories, Inc (Raleigh, North Carolina) and randomized by body weight into 4 groups of 6 rats/group. Rats were identified by a unique animal number by implanted transponder, were approximately 11 weeks of age, and weighed between 350 and 390 g on the first day of dosing. Certified Rodent Diet 5002 (PMI Nutrition International, Richmond, Indiana) and municipal water with treatment by reverse osmosis were available ad libitum throughout the study. Rats were housed 3/cage in polycarbonate solid-bottom cages with Bed-O’Cobs (The Andersons, Maumee, Ohio) and a rat tunnel (Bio-Serv, Inc, Frenchtown, New Jersey) in an environment with a temperature of 64°F to 79°F, 30% to 70% relative humidity, and a 12-hour light–dark cycle (lights on at 06:00 hours). The animal room had artificial light (30 foot candles at 1 m off of the floor) and ˜14 air changes/h. The rats were acclimated to the animal room conditions for 6 days prior to dosing and were fasted for approximately 16 hours prior to clinical pathology blood collections and necropsy.
Study Procedures
Viability checks were performed at least twice daily and clinical observations were performed approximately 2 to 4 hours after dosing. Nonfasted bodyweights were collected on days 1, 4, and 7 and a fasted body weight was measured on the day of necropsy (day 8). On the day of necropsy, blood samples from the abdominal vena cava of rats under isoflurane anesthesia were collected into sterile vacutainer tubes (without anticoagulant for serum biochemical profiles). Blood samples were processed within approximately 60 minutes of collection, and the serum was separated immediately and stored at −80°C until analysis within the following 5 days. Serum analysis included cardiac troponin I (cTnI), cardiac troponin T (cTnT), and FABP3 using the MesoScale Discovery platform (Rockville, Maryland) and NT-proANP using the Biomedica (Vienna, Austria) proANP (1-98) EIA kit. The assays were performed according to the manufacturers’ protocols. A necropsy with macroscopic examination was performed following the blood sample collection.
The apical 1/3 of the heart was transferred to a cryogenic tube, flash-frozen in liquid nitrogen, and stored at or below −70°C for genomic analysis. This portion of the left ventricle apex was chosen to easily characterize gene expression changes and spare enough sample of the heart for histopathologic and ultrastructural analysis. The remaining two-third of the heart was bisected longitudinally so that each half contained both left and right atria and left and right ventricles. From one-half, a portion of the left ventricular free wall was collected for electron microscopy. The remainder of this half, as well as the entire other half, was placed in 10% neutral-buffered formalin for routine microscopy.
Heart samples collected for ultrastructural assessment were diced into 1 × 1 × 1 mm3 cubes and were covered with 2% glutaraldehyde in 0.1 mol/L phosphate buffer, pH 7.2 to 7.4 (Electron Microscopy Sciences, Hatfield, Pennsylvania) and stored at 2°C to 8°C. The heart tissue was postfixed using 1% osmium tetroxide (Electron Microscopy Sciences) for 1 hour and dehydrated in graded ethyl alcohol and infiltrated in Spurr resin (Electron Microscopy Sciences). After polymerization in a 70°C oven, 1-µm thick sections were cut and stained with toluidine blue (Electron Microscopy Sciences). The blocks were trimmed and ultrathin sections (600-800 nm) were cut and placed on nickel grids. The grids were examined with a JEOL 1230 electron microscope (Tokyo, Japan) at 80 kV, and digital images were acquired using a GATAN side mount camera (Pleasanton, California).
Statistical Methods for NT-proANP and FABP3
Proc MIXED 10 in SAS v. 9.2 was used to analyze the NT-proANP and FABP3 parameters. The FABP3 parameter results were log transformed prior to performing the statistical analysis due to the heterogeneity of the variances among the groups. The differences between the treated groups versus the control group were assessed via the Dunnett multiple comparison test using Proc MIXED. Dunnett test compares multiple groups back to a single control group while controlling the error rate for the multiple comparisons.
Microarray Methods
Heart samples from all animals (n = 6/treatment group) were analyzed for cardiac gene expression. A portion of the left ventricle of the apical 1/3 of the heart was used to isolate RNA with a modified guanidium isothiocyanate method (TRIzol; Invitrogen Corporation, Carlsbad, California). The RNA was further purified using silica membrane spin columns (RNEasy Total RNA Kit; Qiagen Inc, Valencia, California). The integrity of the RNA samples was assessed using an Agilent Bioanalyzer Lab-on-a-Chip Nano 6000 chip, Santa Clara, CA. Biotin-labeled complementary RNAs were generated from 10 µg total RNA and hybridized to the rat genome 230 2.0 array (Affymetrix, Inc, Santa Clara, California). All procedures were carried out according to the manufacturer’s recommendations.
Microarray data processing and analysis were conducted using ArrayStudio 7.1.0.84 (Cary, North Carolina). Log2 probeset intensity was normalized using Robust Multi-array Average. Low signal intensity probesets, which were not detected in any animal, were removed from subsequent analysis.
Differentially expressed probesets were determined using a false discovery rate with the Benjamini-Hochberg (FDR-BH) multiplicity correction with the general linear model. A probeset was considered differentially expressed if it showed a FDR-BH P value of ≤0.05 with a fold-change of ≥1.5.
The microarray data will be deposited in NCBI’s Gene Expression Omnibus, accessible through GEO series accession number GSExxxxx (http://www.ncbi.nlm.nih.gov/geo/query/acc.cgi?acc=GSExxxxx) upon acceptance of manuscript for publication.
Quantitative PCR Methods
The same RNA samples from the heart of 6 animals/group were used for quantitative PCR. Approximately 1 µg of purified RNA was reverse transcribed using Applied Biosystems' High Capacity cDNA Conversion kit, Foster City, CA. The resulting cDNA was diluted 1:50 using dH2O and mixed with Applied Biosystems’ Universal PCR Master Mix, Foster City, CA, in a 1:1 ratio for loading onto a custom-designed Taqman low-density array for real-time PCR. Quantitative PCR data were then analyzed using Real-Time Statminer (Integromics, Granada, Spain). Results were reported as log2 relative fold-change with the statistical significance threshold set to P ≤ 0.05.
Ingenuity pathway analysis (IPA, version 4.0; Ingenuity of Mountain View, California; http://www.ingenuity.com/index.html) was used to identify protein–protein interactions and networks from the results of the quantitative PCR analysis.
Results
In-Life Evaluations
Of the 6 rats given 150 mg/kg/d, 5 had a combination of clinical observations that included decreased activity, loss of skin elasticity, rough coat, irregular breathing, partially closed eyes, and/or slight red staining around the eyes, nose, and/or muzzle. Two rats given 60 mg/kg/d had sporadically decreased activity and another animal in this dose group had red staining (slight to moderate) around the left eye. Animals given 0.3 mg/kg/d had no clinical observations.
A dose-related decrease in body weight and food consumption was observed in rats given ≥60 mg/kg/d. Compared with the control group, group mean body weight was decreased for rats given 150 mg/kg/d and represented a mean body weight loss of 8% from day 1 to day 7, which correlated with a reduction in mean food consumption of approximately 50% relative to control. Similarly, group mean body weight was decreased by 6% for rats given 60 mg/kg/d and correlated with a decrease in food consumption (up to 20% decrease relative to control).
Pathology
Table 1 summarizes the pathology findings (light microscopy, electron microscopy, and heart weight) of individual animals and the correlation with novel/additional study end points (ie, FABP3, cTnI, cTnT, NT-proANP, and transcriptomics). A spectrum of myocardial lesions was present in small numbers of individual animals in control and treated groups (Figure 1). Myocardial lesions characterized as focal to multifocal necrosis were present in single animals given 0.3 mg/kg/d (minimal) or 60 mg/kg/d (mild) and 3 of the 6 animals given 150 mg/kg/d (minimal to mild). Although these lesions in rodents can be observed sporadically in control animals as rodent progressive cardiomyopathy, 11,12 the increased incidence in animals given 150 mg/kg/d was considered related to test article administration, while the lesions at 0.3 and 60 mg/kg/d were not considered test article related. There were no treatment-related changes in cTnI, NT-proANP (Figure 2), cTnT, or heart weights (data not shown). Relative to controls, mean serum FABP3 was increased (3.7× relative to control) in rats given 150 mg/kg/d on day 8 (Figure 2), although there was not a consistent correlation between high FABP3 and microscopic cardiac changes in an individual animal basis (Table 1).
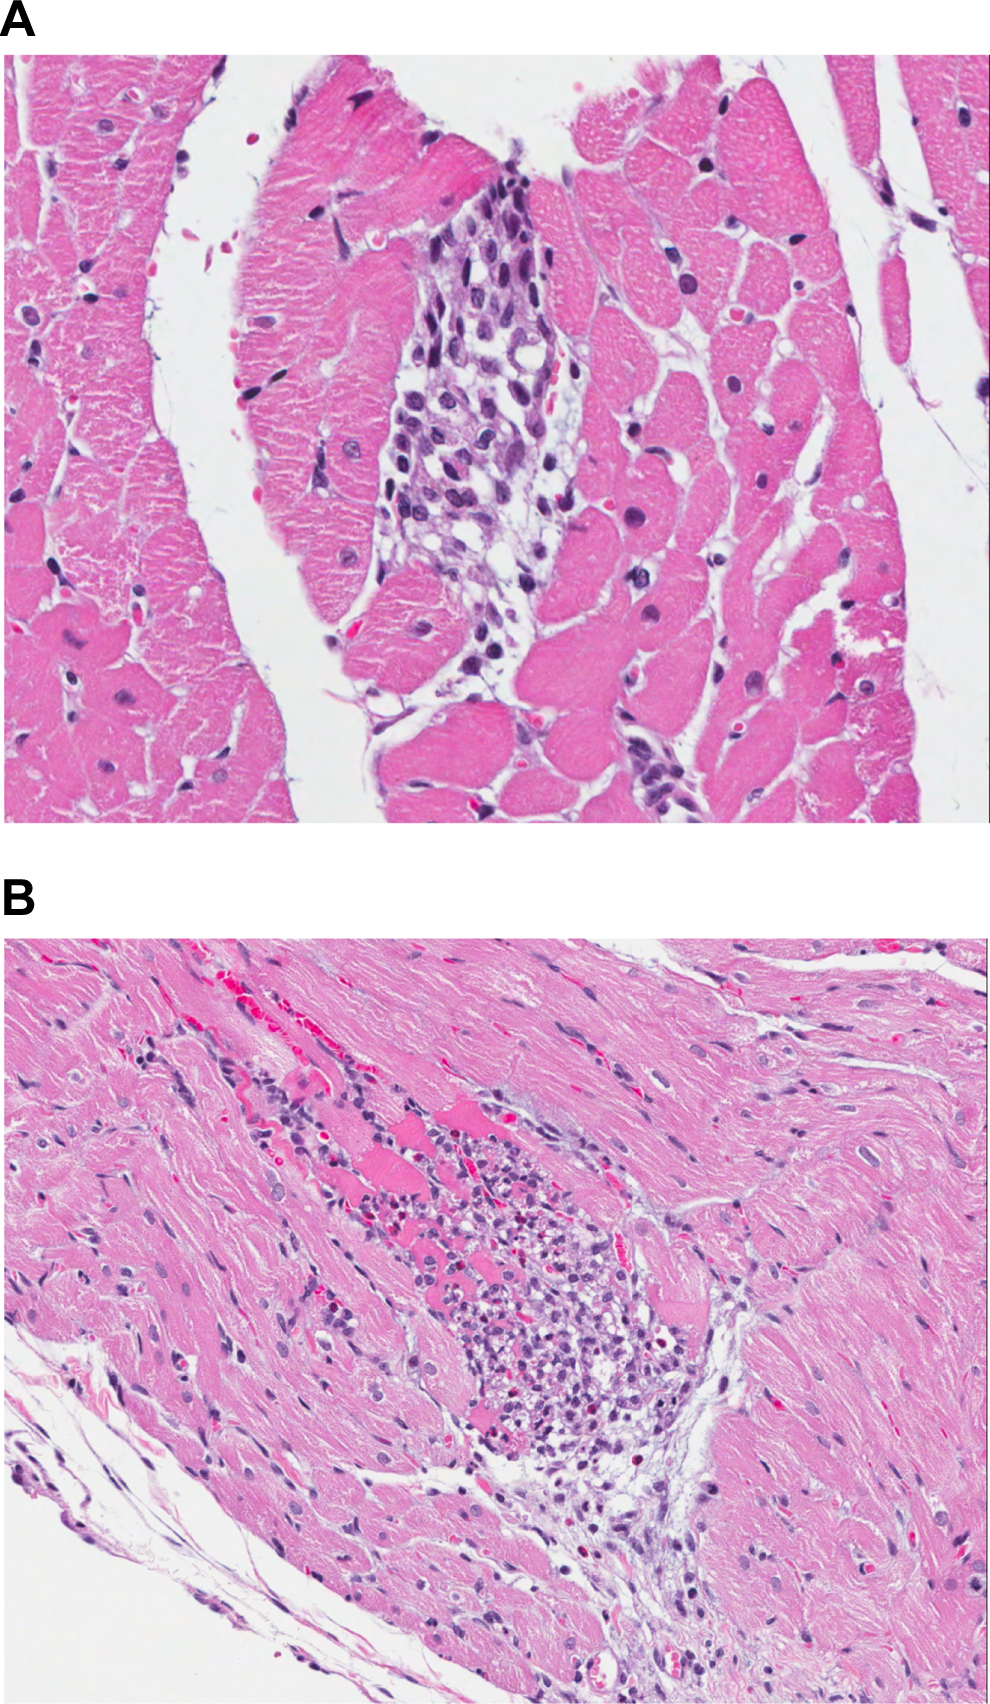
Light Micrograph images (40×, image A or 20×, image B magnification) showing areas of cardiomyocyte necrosis in rats administered 150 mg/kg/d of GSK894281. Such lesions can be observed as part of complex known as rodent progressive cardiomyopathy.
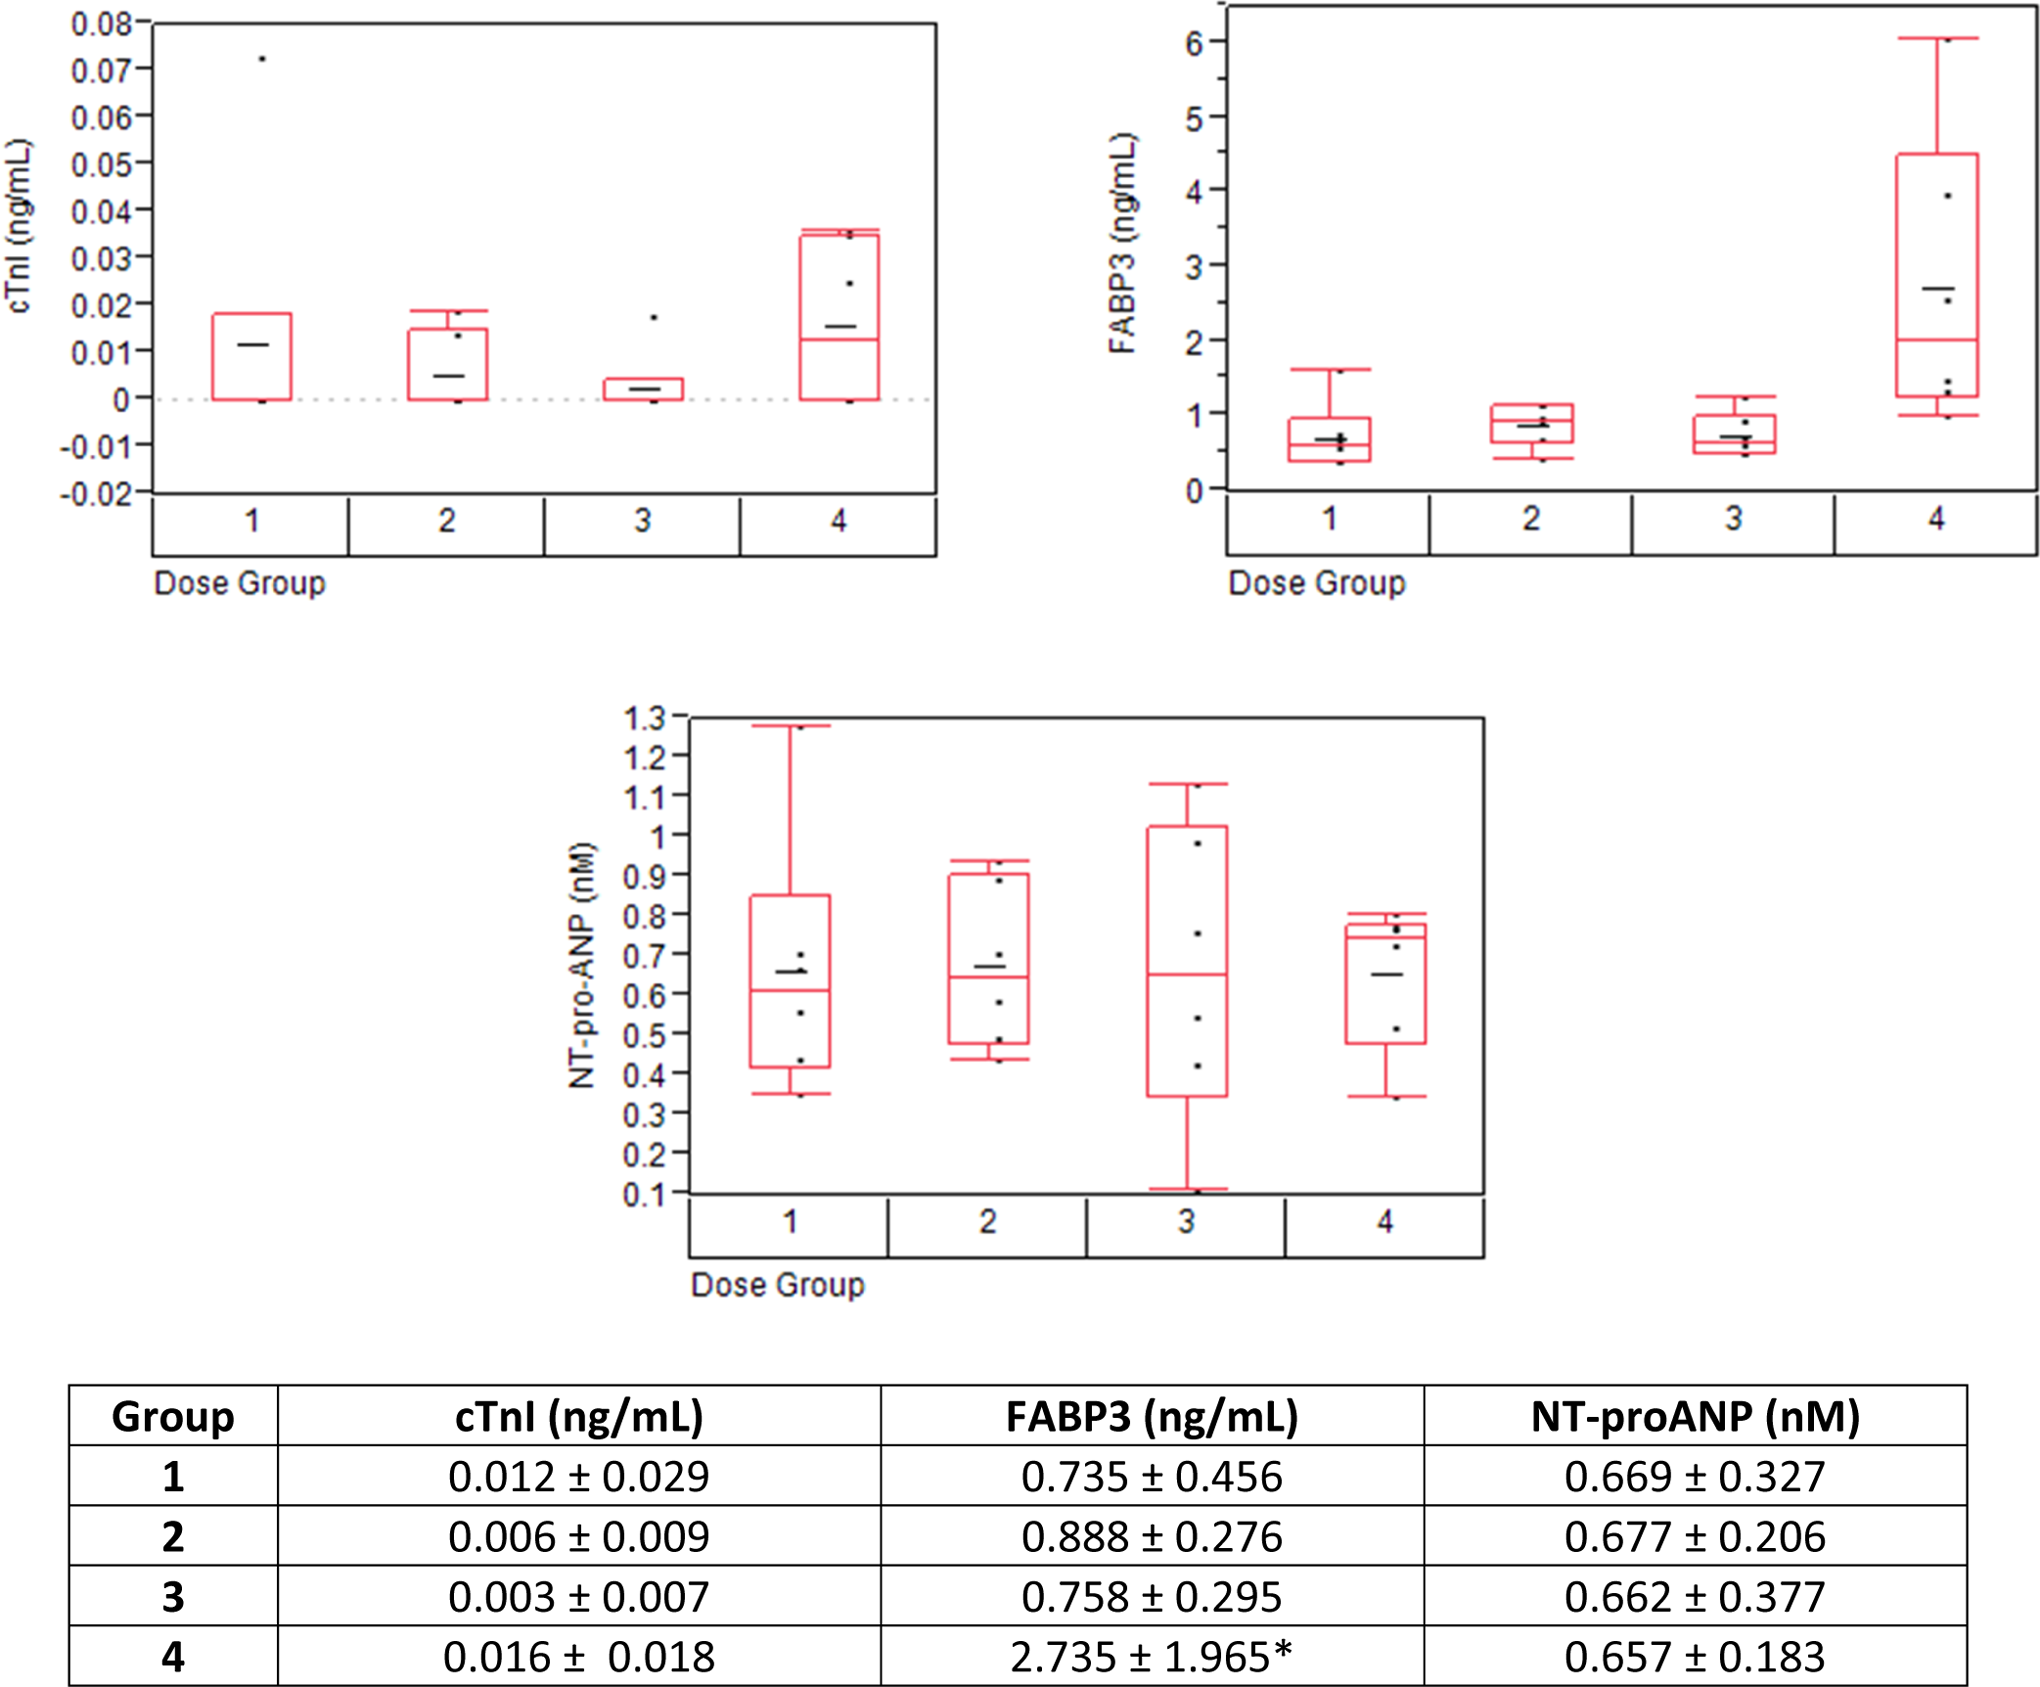
Measurement of cardiac troponin I, fatty acid-binding protein 3 (FABP3), and NT-proANP in the serum of rats on day 8. Values represent the mean ± standard deviation (SD). The horizontal line in the middle of the box in the figure represents the mean of the data and the boxes represent the 25th and 75th percentile of the data. The whiskers extend to the farthest point that is with the 1.5× interquartile range. Group 1 = 0 mg/kg/d, group 2 = 0.3 mg/kg/d, group 3 = 60 mg/kg/d, and group 4 = 150 mg/kg/d. While there were no test article-related changes in cardiac troponin I (cTnI) or NT-proANP, mean FABP3 was significantly increased (3.7× relative to controls; P value of 0.0011) on day 8 in rats given 150 mg/kg/d; however, there was no consistent correlation between high FABP3 and microscopic cardiac changes in an individual animal basis. NT-proANP indicates N-terminal proatrial natriuretic peptide.
Summary of Cardiovascular End Points Added Onto This 7-Day Rat Study.a
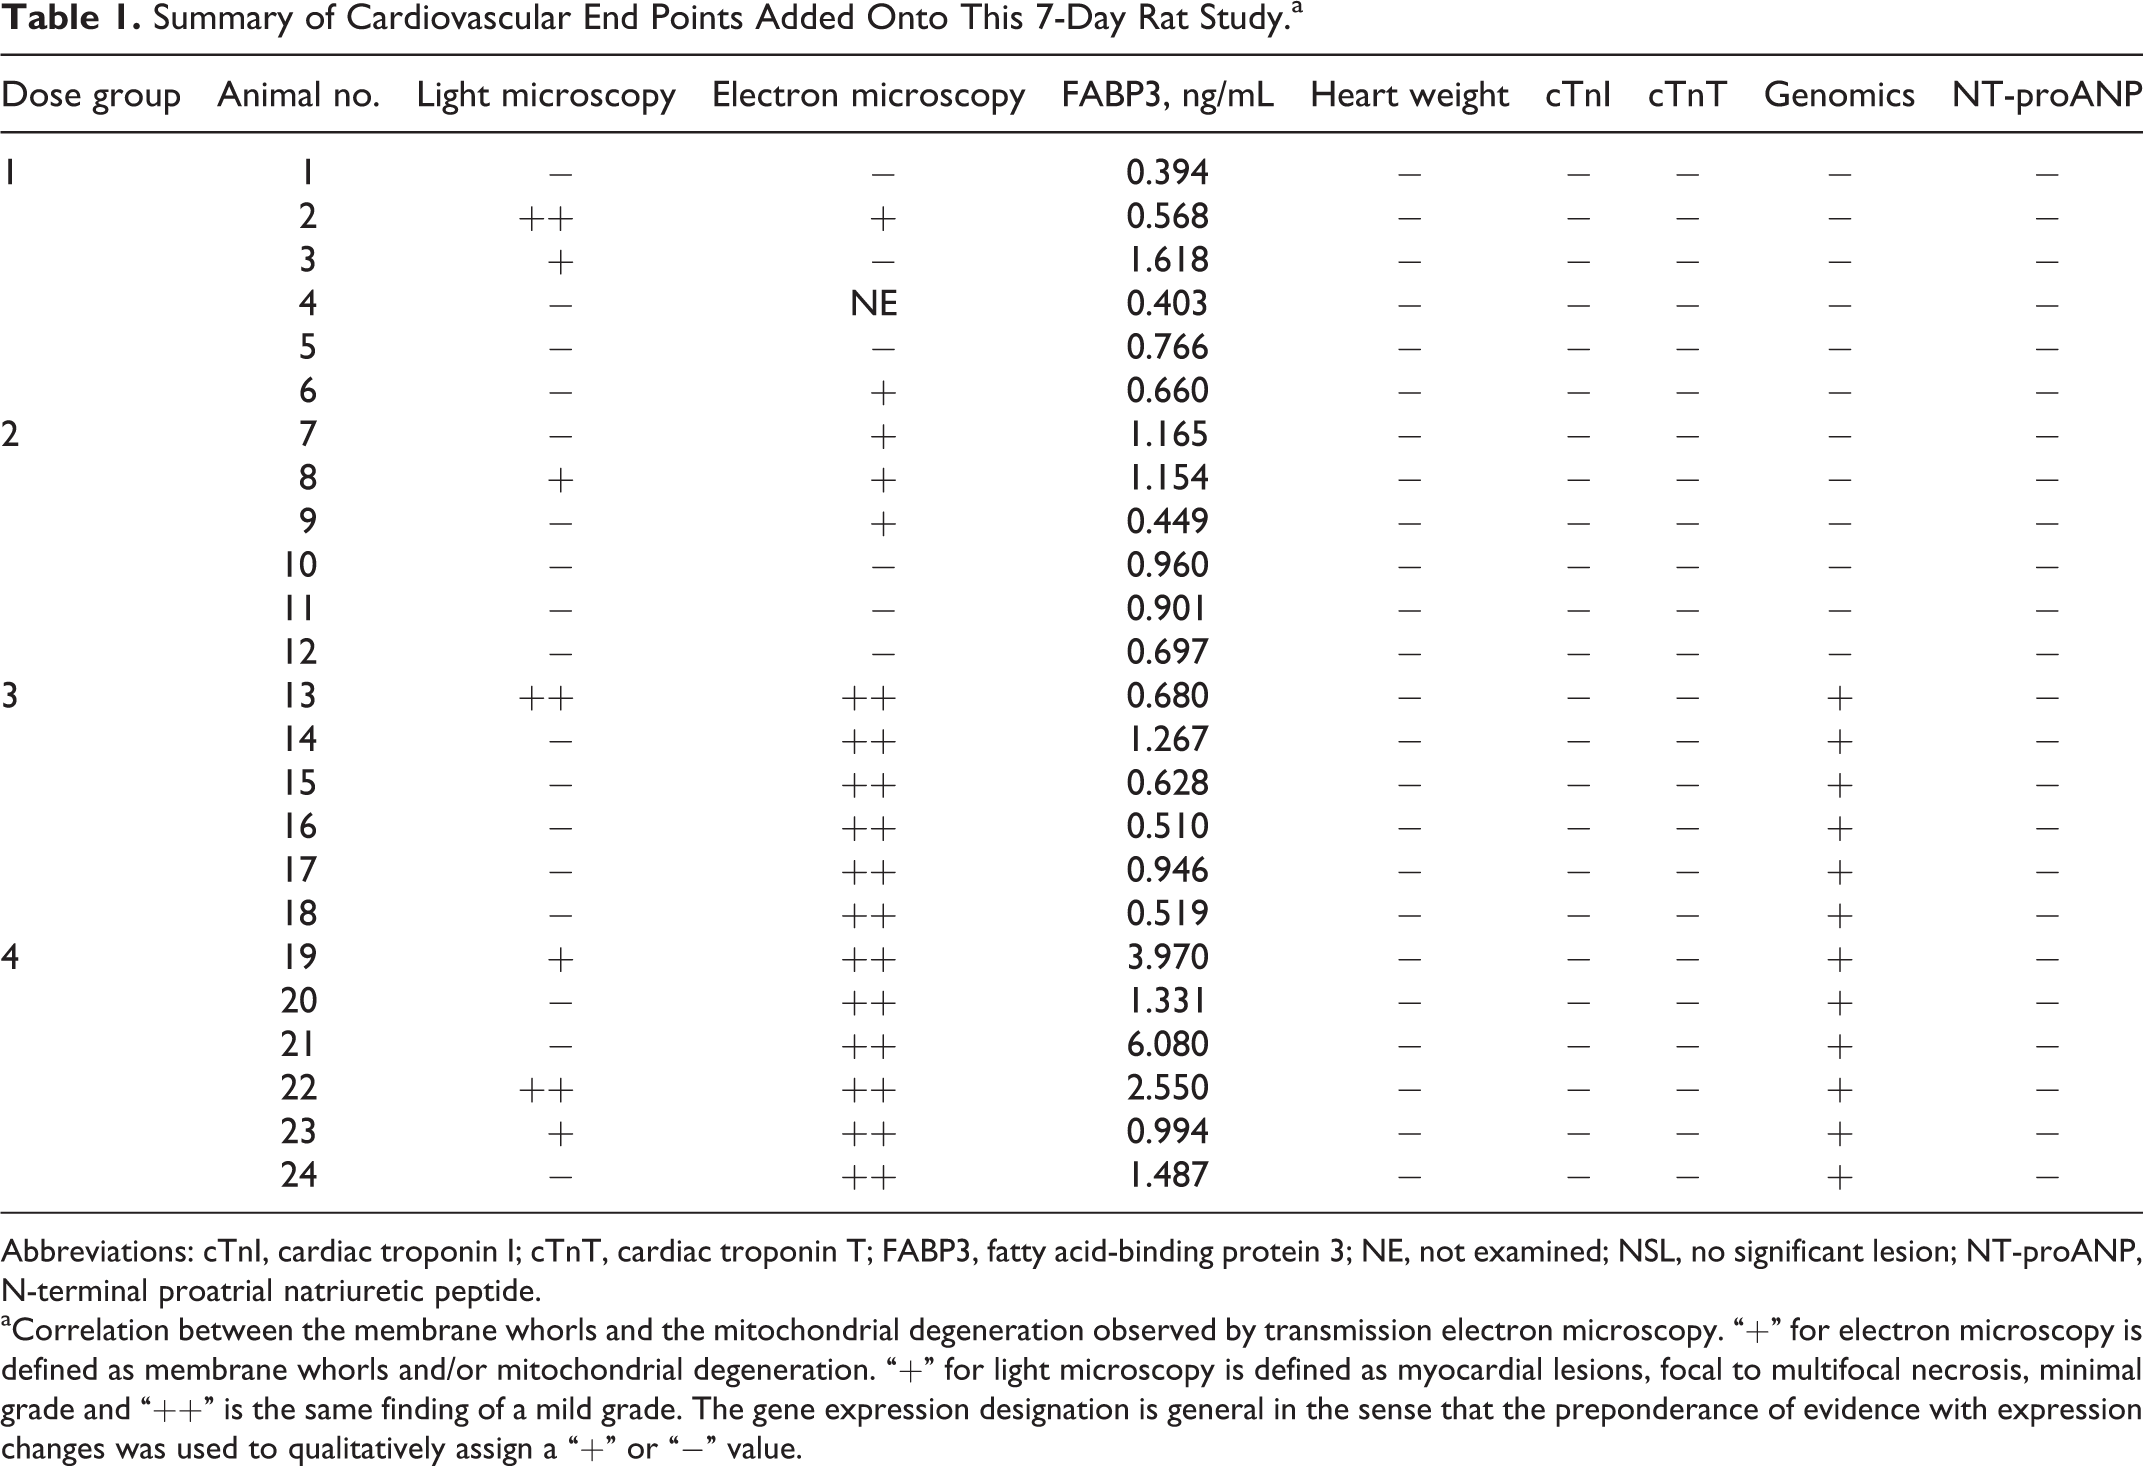
Abbreviations: cTnI, cardiac troponin I; cTnT, cardiac troponin T; FABP3, fatty acid-binding protein 3; NE, not examined; NSL, no significant lesion; NT-proANP, N-terminal proatrial natriuretic peptide.
aCorrelation between the membrane whorls and the mitochondrial degeneration observed by transmission electron microscopy. “+” for electron microscopy is defined as membrane whorls and/or mitochondrial degeneration. “+” for light microscopy is defined as myocardial lesions, focal to multifocal necrosis, minimal grade and “++” is the same finding of a mild grade. The gene expression designation is general in the sense that the preponderance of evidence with expression changes was used to qualitatively assign a “+” or “−” value.
The electron microscopy assessment showed an increased incidence of cytoplasmic membrane whorls and mitochondrial degeneration in animals given ≥60 mg/kg/d (Figure 3 and Table 1). Membrane whorls were present within cardiac myocytes, endothelial cells, perithelial cells, intravascular leukocytes, and spindle-shaped or mononuclear cells of the myocardial interstitium. These whorls were characterized as membrane-bound, concentric stacks of membranous material. Mitochondrial degeneration occurred as individual or small clusters of swollen mitochondria with irregular shape, heterogeneous electron density, and dilated cristae (Figure 3). These degenerate mitochondria were interspersed with interfibrillar mitochondria of normal architecture.
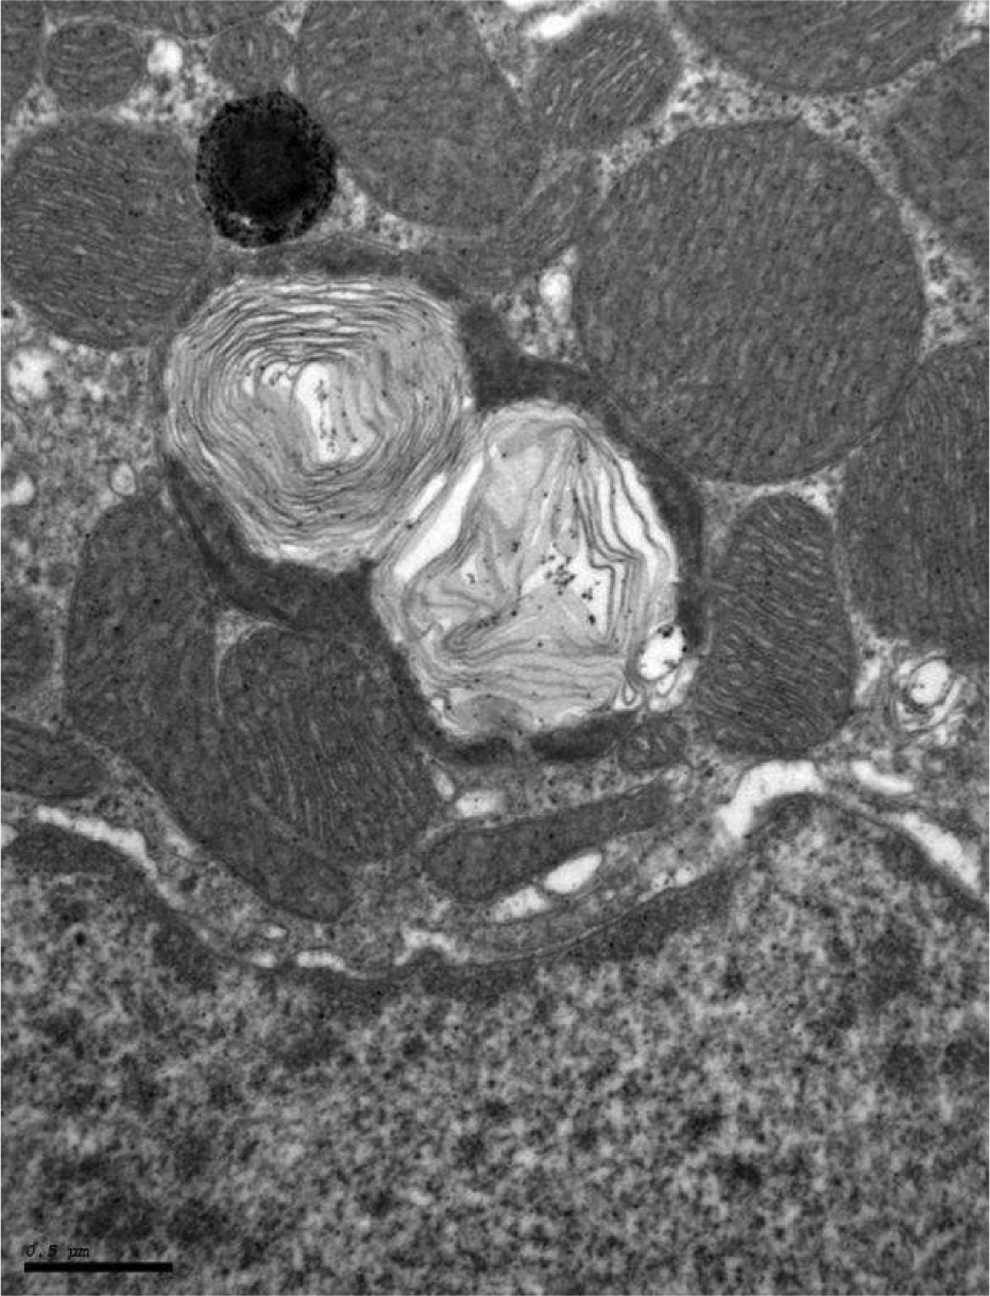
Electron micrograph showing cardiomyocyte membrane whorls in mitochondria, which are characterized as membrane-bound, closely apposed, concentric stacks of membranous material from a treated rat (150 mg/kg/d).
Microarray Results
Principle components analysis (PCA) of the Arraystudio microarray results is shown in Figure 4. Each animal is a point in the PCA plot, and points more distant from each other have more dissimilar overall gene expression patterns relative to points closer to one another. The gene responses cluster into 2 clear groups, one group containing the control and the low-dose (0.3 mg/kg/d) group and the other group comprised of the mid- and high-dose groups (60 and 150 mg/kg/d). Based on the PCA, we would expect the low-dose group to have fewer differentially expressed genes than the mid- and high-dose groups when compared with the control group.
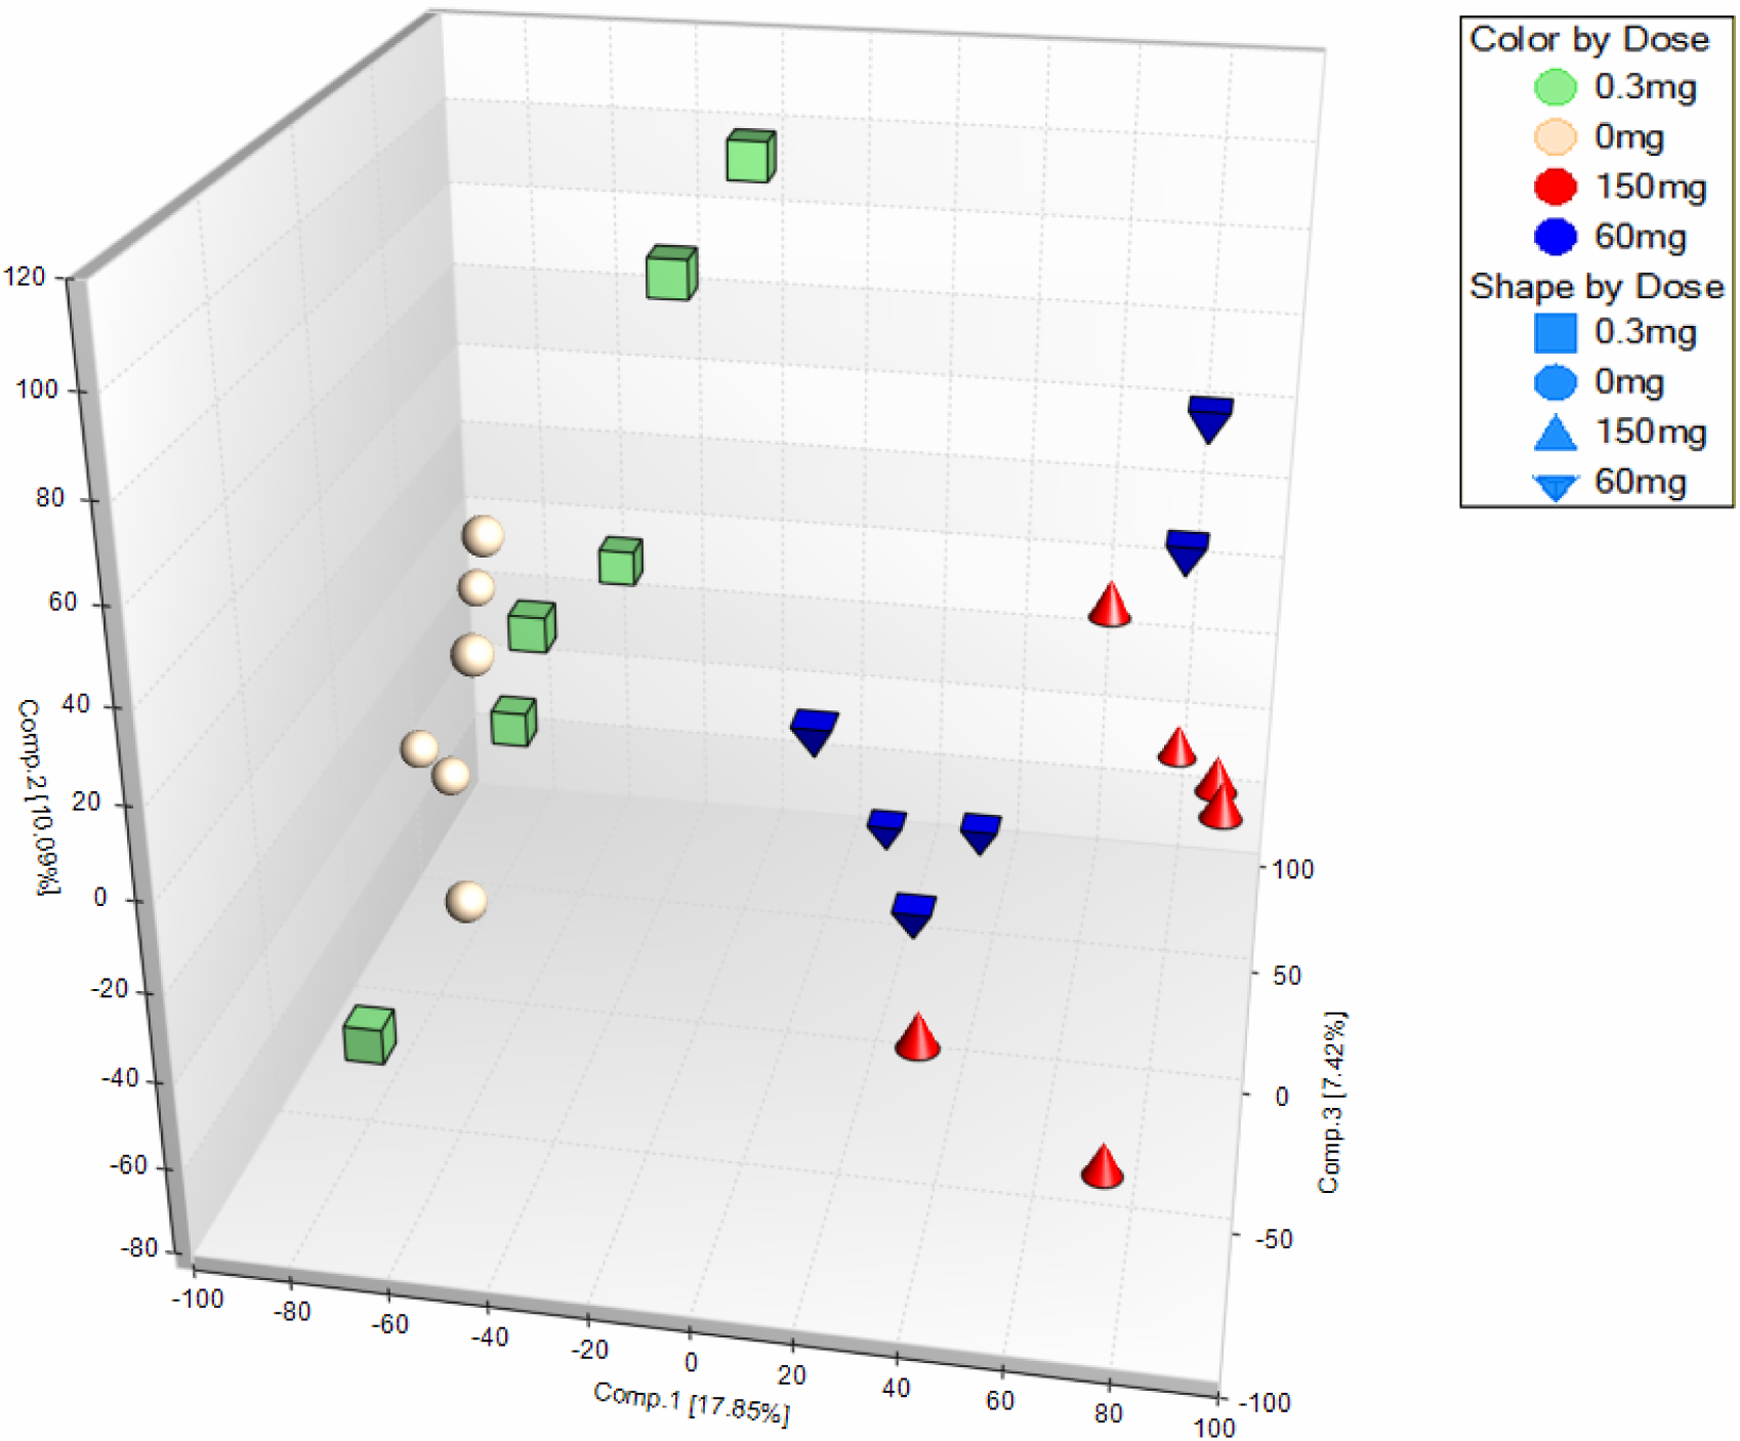
Three-dimensional principle components analysis (PCA) plot of probeset values shows 2 major groupings with the control and the low dose forming one group and the mid and high dose forming another group. Each animal is a point, and the overall difference in gene expression is related to the relative distance among the points.
A very striking pattern of gene expression is shown with Hierarchical Clustering of the ArrayStudio analyzed microarray results in Figure 5. In general, expression pattern of almost all of the genes in mid- and high-dose groups is the opposite of the control and low-dose group. A large majority of the genes in the mid- and high-dose group are downregulated compared with the control and low-dose group.
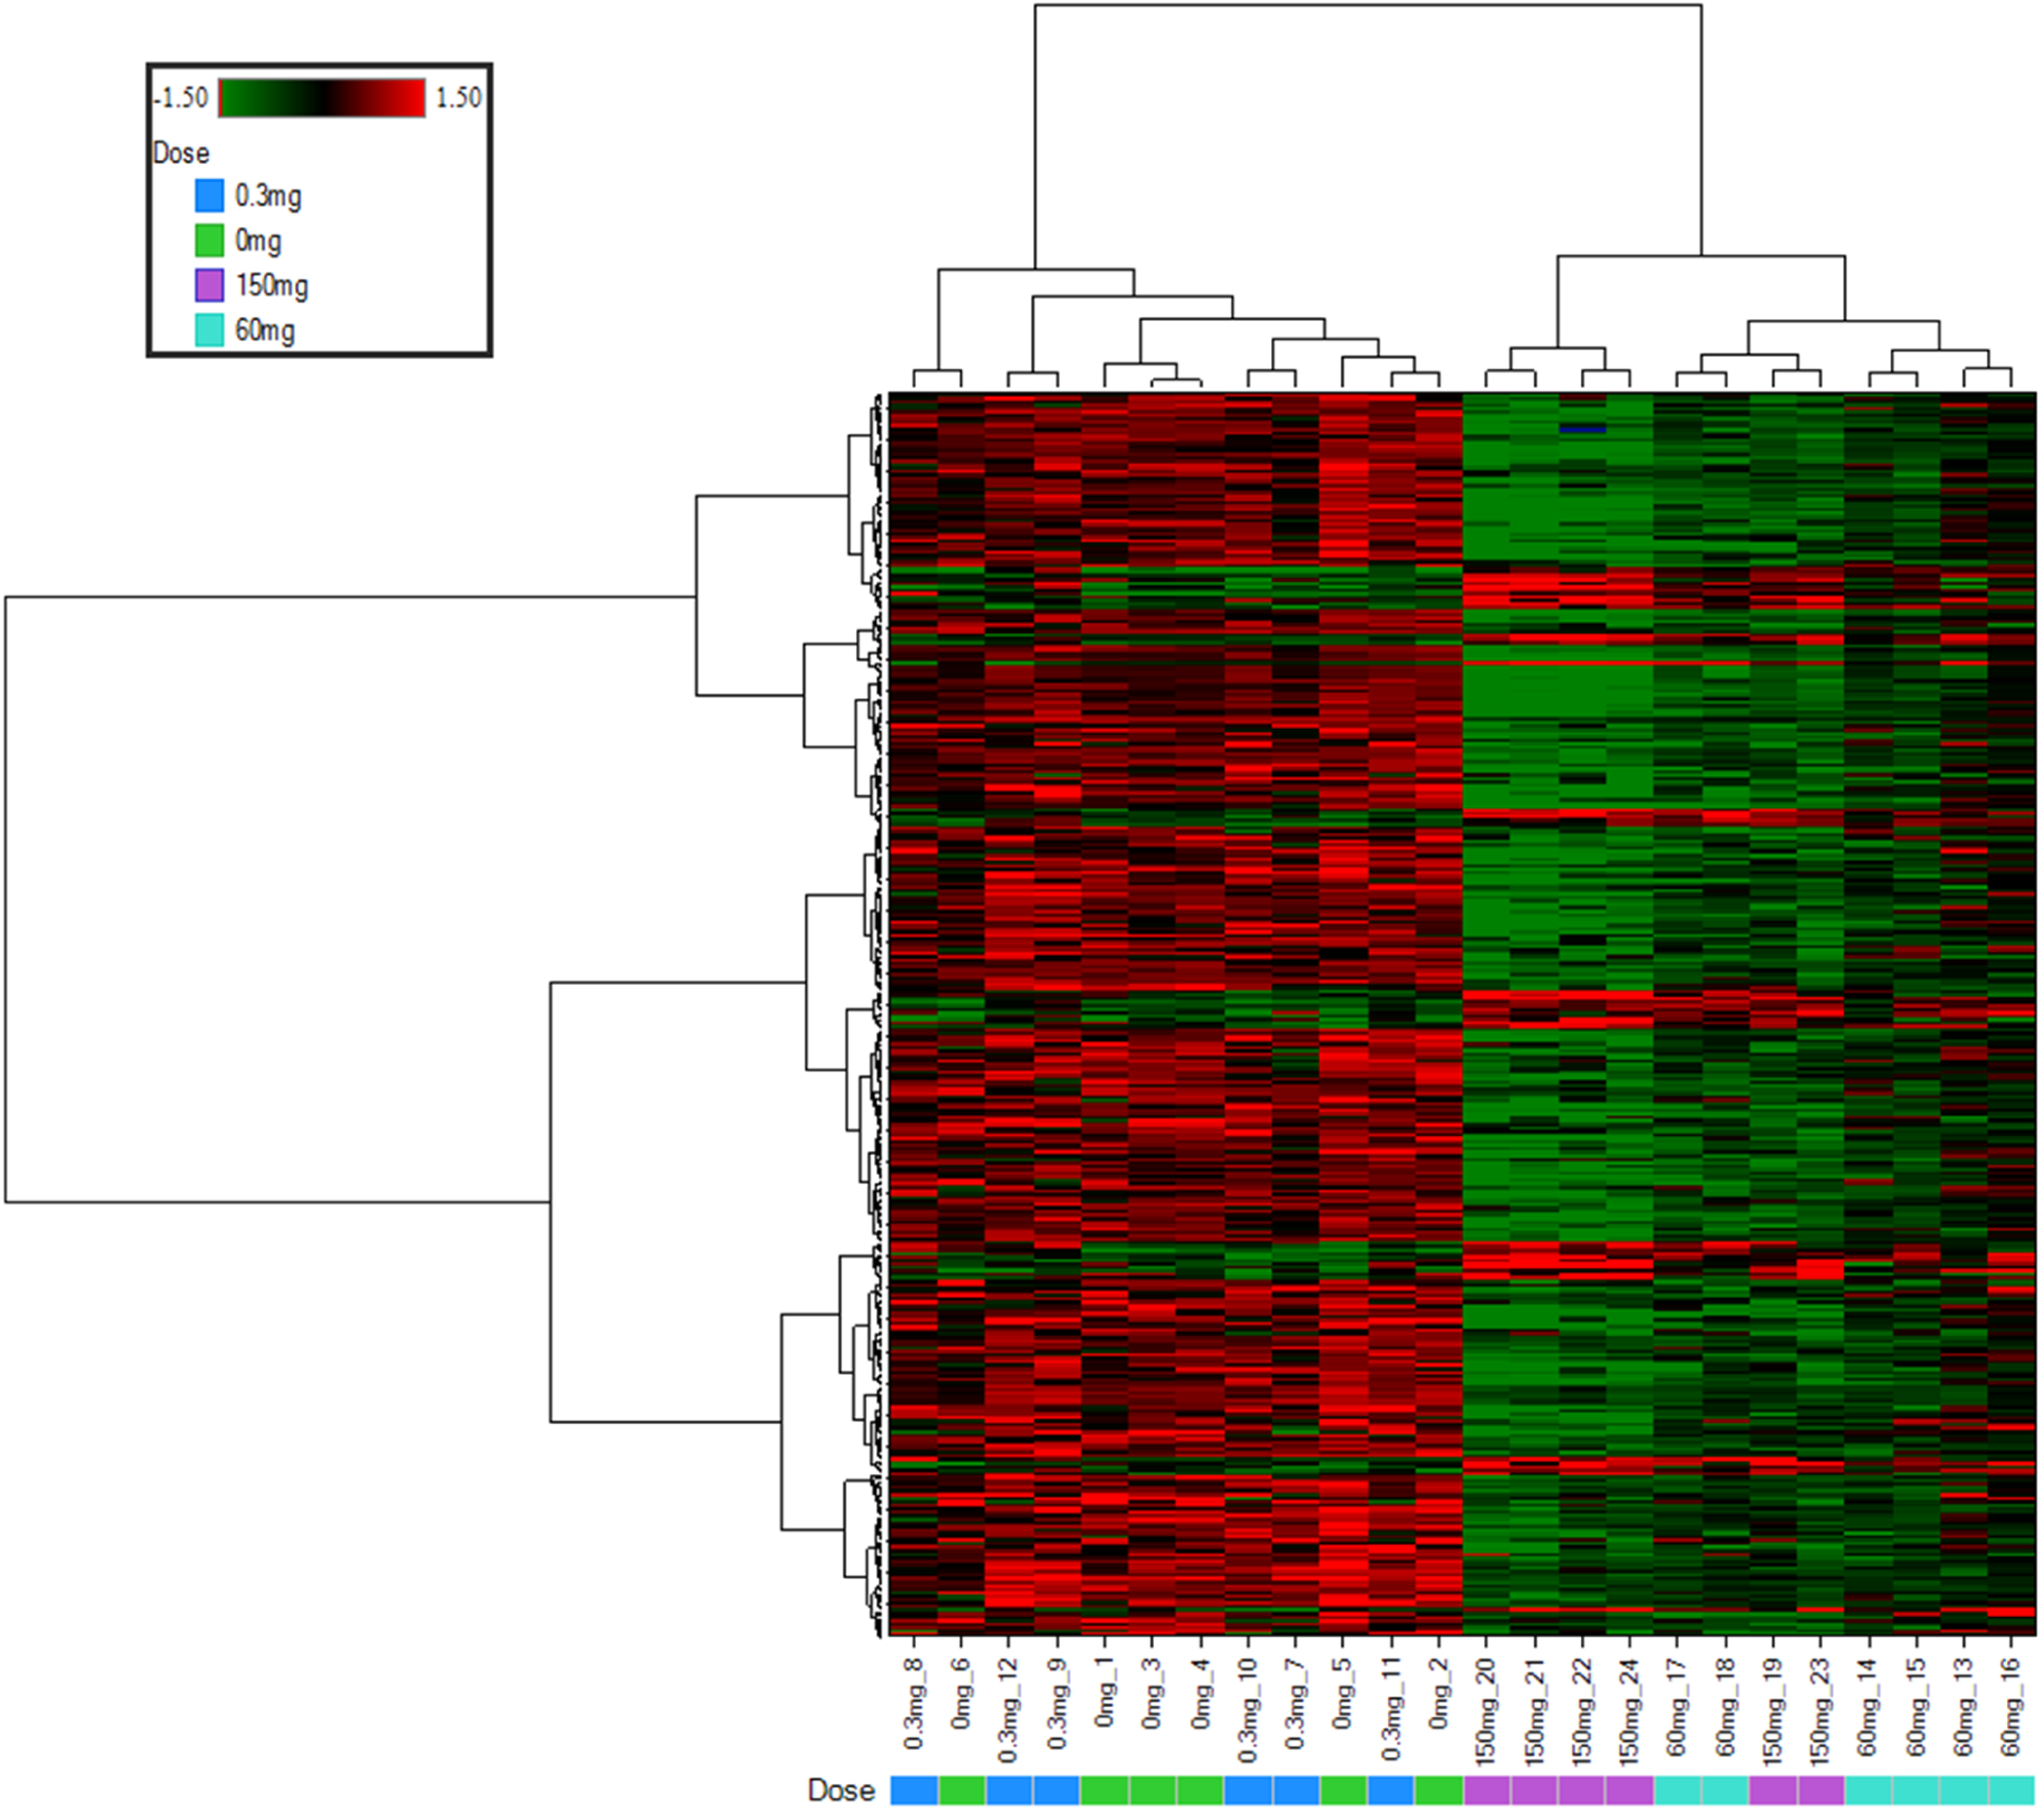
Hierarchical clustering analysis and heat map from the ArrayStudio analysis of the microarray data show that the control and low-dose groups cluster together whereas the mid- and high-dose groups form a unique cluster. The colors are red for increased expression and green for decreased expression.
Quantitative PCR Results
The quantitative PCR data results demonstrate dose-dependent and statistically significant (P ≤ 0.01) gene expression changes primarily in the mid- and high-dose groups compared with the concurrent control group (Table 2). In addition, IPA using the toxicity list function shows altered expression of genes involved in cardiac hypertrophy, fibrosis/cardiac fibrosis, mitochondrial dysfunction, cardiac necrosis/cell death, and nuclear factor-erythroid 2-related factor-mediated oxidative stress primarily in the mid- and high-dose groups compared with control.
Quantitative PCR Results show the Dose–Response Relationship of Gene Expression (the Mean FC* Values) Examined for Each Treatment Group Compared With the Concurrent Control.a
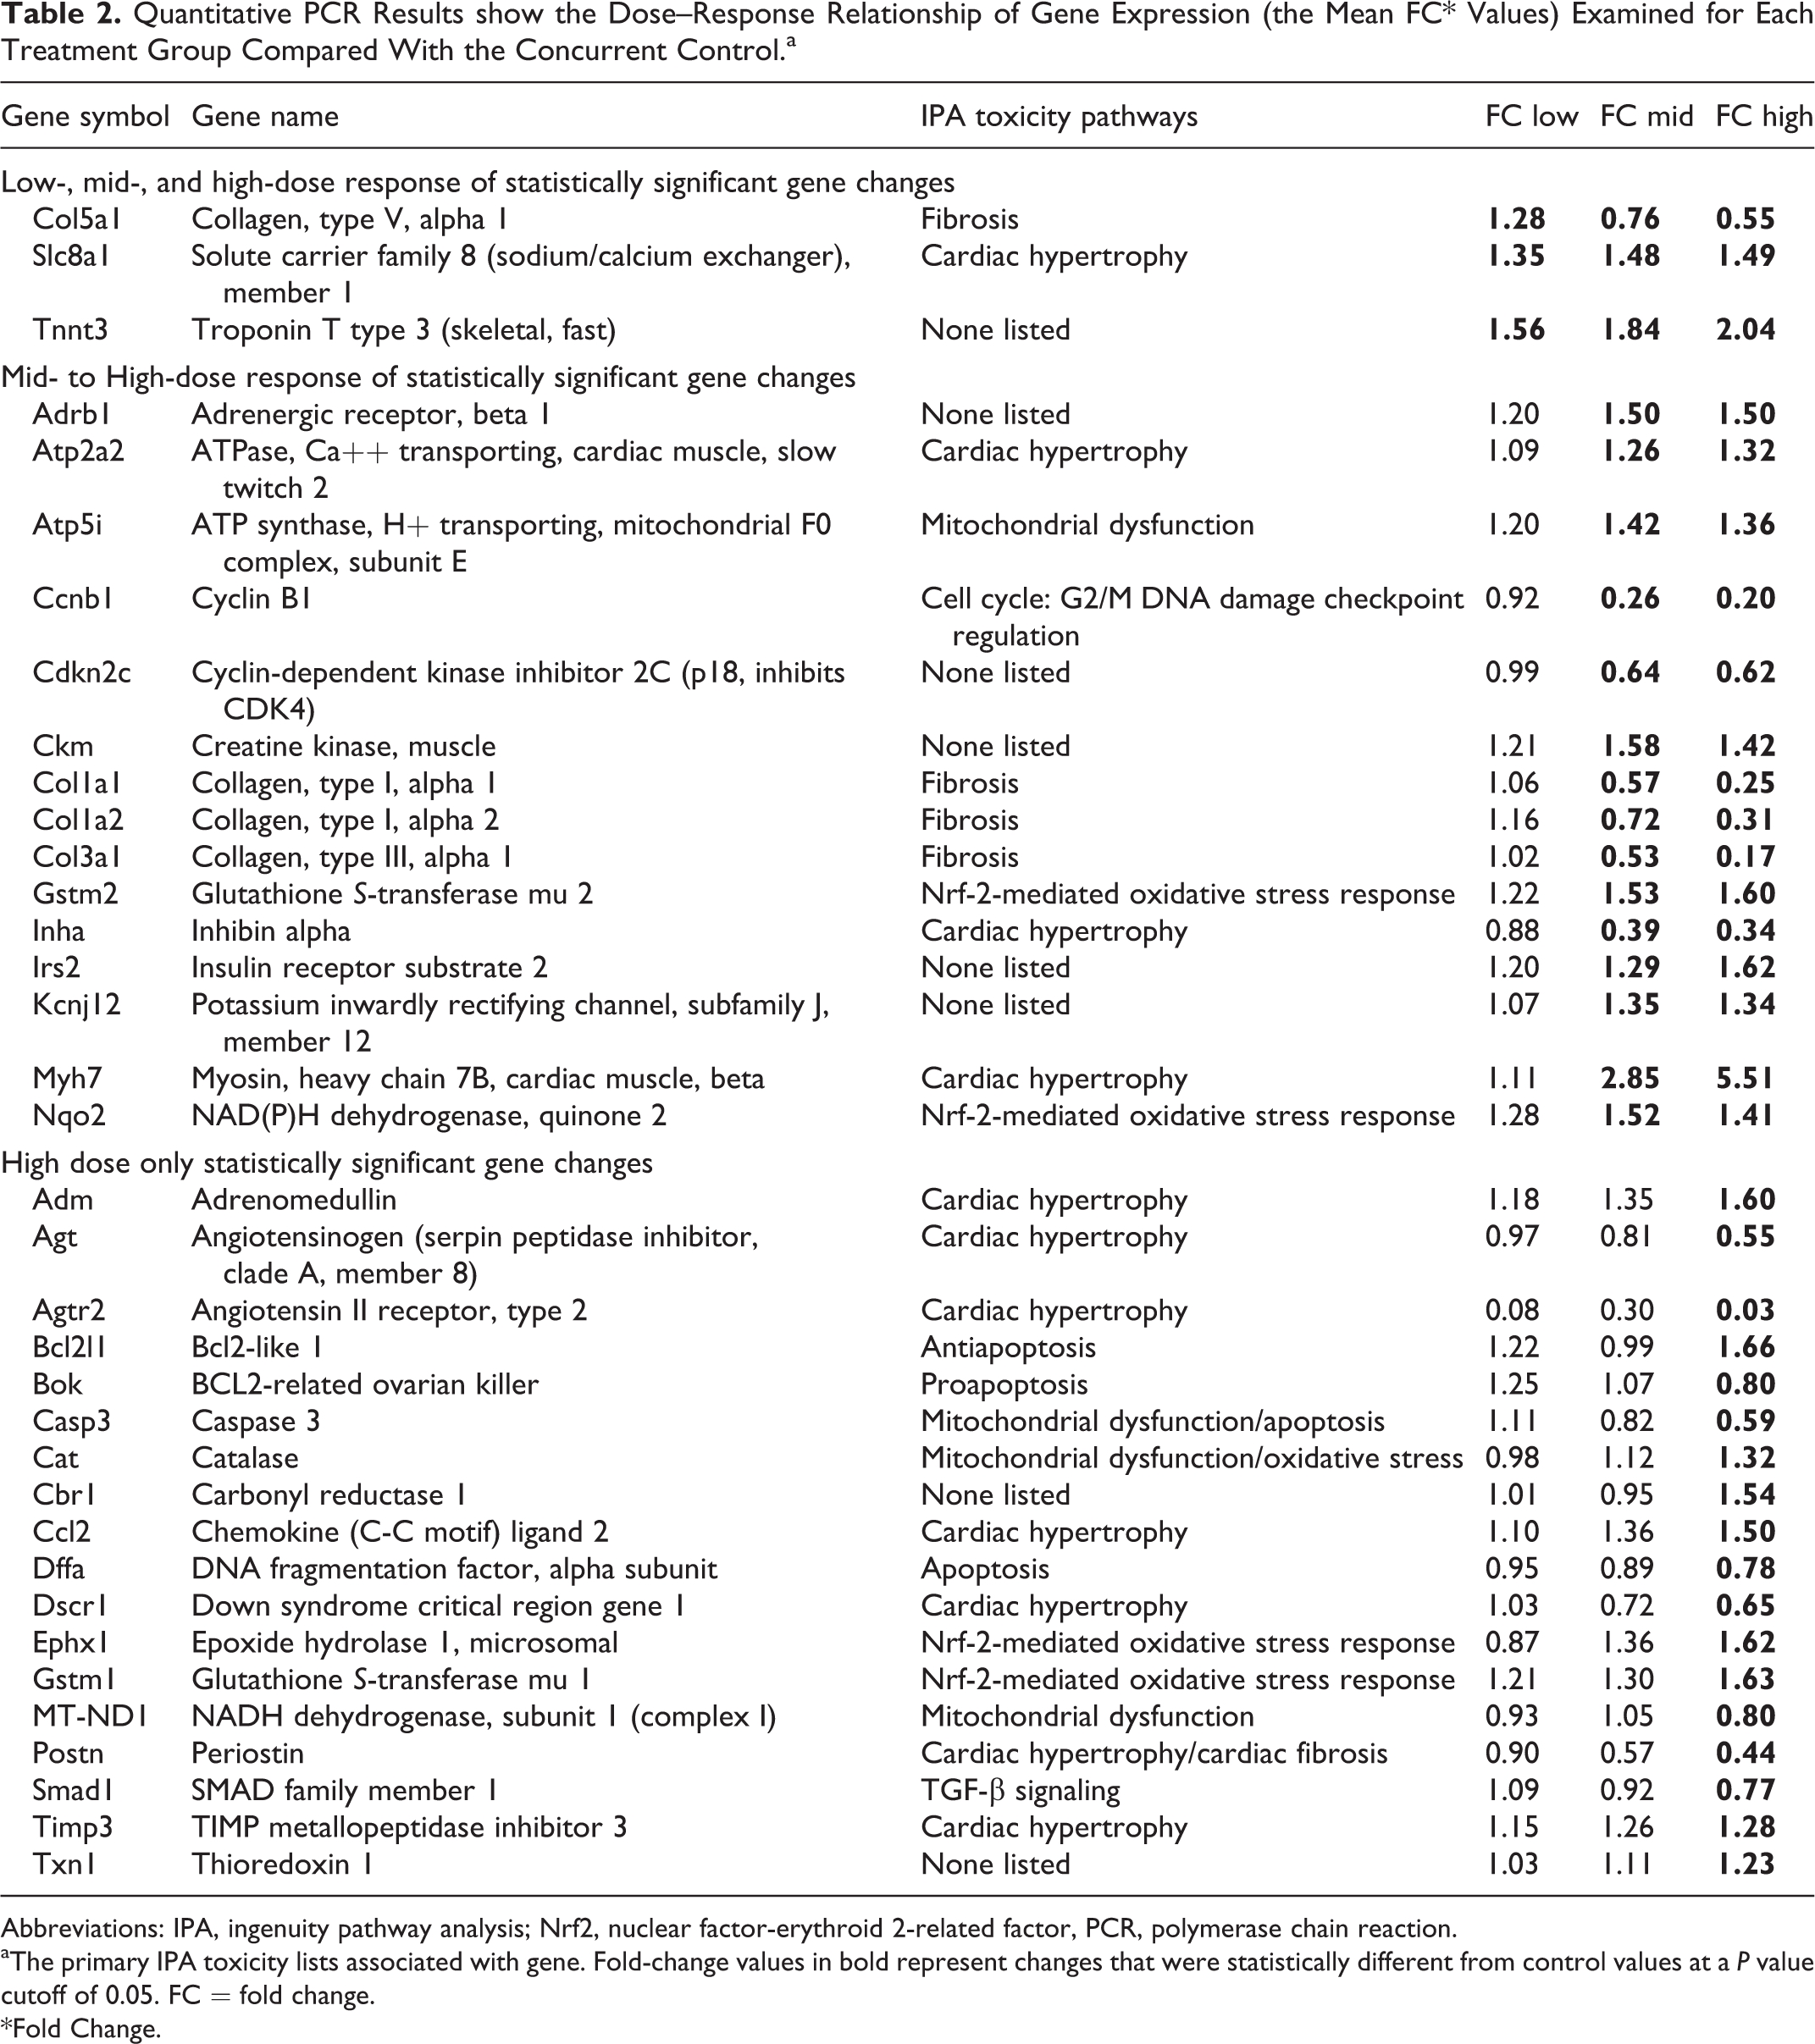
Abbreviations: IPA, ingenuity pathway analysis; Nrf2, nuclear factor-erythroid 2-related factor, PCR, polymerase chain reaction.
aThe primary IPA toxicity lists associated with gene. Fold-change values in bold represent changes that were statistically different from control values at a P value cutoff of 0.05. FC = fold change. *Fold Change.
Discussion
The enhanced study design described in this article revealed an equivocal change in the incidence of light microscopic lesions in the heart of rats treated with 0.3 and 60 mg/kg of the test compound, a ghrelin receptor agonist. These lesions were characterized as focal to multifocal areas of cardiomyocyte necrosis and inflammatory cell infiltrate akin to those commonly seen as a manifestation of rodent progressive cardiomyopathy. 13 In a routine, general toxicology paradigm, this change likely would have been noted but deferred for further characterization to a subsequent longer duration GLP-compliant study. Our enhanced study design allowed further characterization of microscopic findings as well as increased sensitivity using ultrastructural and transcriptomic analysis, both of which revealed subcellular changes in the low- and mid-dose groups that were not revealed by routine histopathology. Ultrastructural examination revealed degenerative changes in cardiomyocyte mitochondria as well as in the mitochondria of other cellular elements of the myocardium (ie, capillary endothelial and perithelial cells) with an increased incidence in rats given ≥60 mg/kg/d relative to the control rats and the low-dose group (0.3 mg/kg/d).
Cardiac transcriptomic results revealed evidence of oxidative stress, apoptosis, and mitochondrial dysfunction in the 60 and 150 mg/kg/d groups, coincident with the ultrastructural results that support a mechanism of mitochondrial injury. Therefore, the addition of these end points appear to provide a more sensitive method for detecting cardiac perturbations than routine histopathology.
Heart weight increases (15% relative to brain weight) were observed in the previous 28-day rat study in females at the top 2 doses tested (10 or 60 mg/kg/d; data not published). While our laboratory has observed heart weight changes after 7 days of dosing with other compounds (data not published), no heart weight changes were noted in this 7-day study with GSK894281 indicating that this is insufficient time for this lesion to manifest in response to the mitochondrial effects. We had hypothesized that including heart weight on this 7-day study could provide early recognition of growth promotion or hemodynamic stress as can be seen with anabolic steroids or compounds that induce changes in cardiac work through primary inotropic or chronotropic effects, vasodilation, or plasma volume expansion, respectively. Additionally, serum NT-proANP is increasingly recognized to report changes in cardiac wall stress in rodents that can result from hemodynamic overload. 7 Since measures of CV function are not generally included in rodent general toxicity studies, changes in NT-proANP permit detection of a hemodynamic stress that may correlate with a change in heart weight or at least instigate a more detailed assessment of functional changes in a follow-up study. No changes in NT-proANP were observed in this 7-day study and this correlated with the absence of heart weight effects.
Increases in cTnI were observed in the previous 28-day rat study with GSK894281 in males at all doses (0.3, 1, 10, and 60 mg/kg/d; data not published) in which myocardial injury was more prominent but there were no changes in cTnI levels observed in this 7-day study, which is consistent with the low magnitude of histologic evidence of myocardial cell damage. Serum cTnI can be a sensitive biomarker of acute cardiomyocyte injury, especially when measured serially. 2,3,14 Additional collections within the first 24 hours of dosing might have been informative.
The current 7-day study used a single gender (males only) and the authors acknowledge that previous gender differences in effects were observed in the 28-day study (eg, heart weight changes in females only). The decision to use males only for this investigation was to determine whether the 7-day study design using a single gender (a common study design in our laboratory) could provide sufficient information to make definitive decisions for compound progression. Using both genders will provide a better chance to detect changes in these end points, but the use of additional animals must be balanced by 3R’s and resource considerations.
The objective of this study was to determine whether additional CV end points in a shorter term (ie, 7 days) rat study would enable early detection of CV liabilities. This was accomplished using a compound known to produce CV structural toxicity in a longer term (28 days) study (data not published). The additional end points were designed to detect effects across the CV system (vasculature, cardiomyocytes, etc) and were not chosen based on the knowledge of the particular molecule being tested. Therefore, measurable effects in all end points added to this 7-day study were not expected. However, we propose that this panel of end points would likely produce different results with other cardiotoxicants depending on the mechanism of action. For example, a compound that directly damages cardiomyocytes would be expected to trigger a cTnI signal but not necessarily alter NT-proANP or heart weight. Some molecules are expected to have a multitude of effects on the CV system that could exhibit effects on multiple biomarkers designed to detect different types of toxicity. Acknowledging the fact that changes in these parameters are not expected on every study, individual investigators would have to decide whether or not addition of these end points on every study is warranted. This could be influenced by the molecular target, previous experience with the molecule or class of molecules, and/or the intended patient population.
One shortcoming of this study was that toxicokinetic analysis was not performed. This was an intentional decision to optimally utilize resource. Instead, the authors relied on pharmacodynamic end points that were defined in the previous 7- and 28-day studies to confirm exposure. The low dose of 0.3 mg/kg/d was chosen as a dose that would have minimal CV changes (1 of the 6 rats had minimal focal necrosis and mild subsarcolemnal membrane whorls) and the higher doses of 60 and 150 mg/kg/d were chosen as doses expected to produce CV injury as predicted from the results of the previous 7- and 28-day studies. The toxicokinetic data on the previous 28-day study produced gender averaged, steady state area under the curve at zero to time t (AUC0-t) values of 0.59, 3.36, 44.55, or 177 µg h/mL and Cmax values of 0.09, 0.31, 2.74, and 8.63 µg/mL at doses of 0.3, 1, 10, or 60 mg/kg/d, respectively.
The ghrelin peptide influences the CV system with generally positive effects such as lowering of blood pressure, inhibition of myocardial cell apoptosis, and improvement in cardiac contractility and cardiac output. 15 -19 There are several explanations to account for the cardiotoxic effects observed with this ghrelin agonist. One explanation is direct chemical toxicity and not an effect of the ghrelin peptide hormone system. Another explanation is biased signaling through the ghrelin receptor. The ghrelin peptide and GSK894281 could bind to different parts of the ghrelin receptor producing a different signaling cascade leading to different pharmacology. 20 This is supported by the fact that the ghrelin receptor is associated with multiple g-proteins, β-arrestin, and extracellular signal-regulated kinases phosphorylation.
Using a ghrelin receptor agonist as a tool molecule to explore CV perturbations, the addition of nontraditional CV end points to a short-duration, 7-day rodent general toxicity study revealed putative liabilities not previously identified until longer, 28-day duration studies with considerably greater investment in resource. Possible CV signals that may be interpreted as equivocal in isolation became more meaningful when collated into an integrated package of CV relevant end points. Additionally, using this more holistic assessment can provide insight into the pathogenesis of lesions that are discovered.
Footnotes
Acknowledgment
The authors would like to gratefully acknowledge Carie Kimbrough for providing statistical analysis of the NT-proANP and FABP3 data.
Author Contributions
A.H. Stokes, J.G. Falls, H.M. Colton, and B.R. Berridge contributed to conception and design; acquisition, analysis, and interpretation; drafted the article; critically revised the article; gave final approval; and agreed to be accountable for all aspects of work ensuring integrity and accuracy. L. Yoon contributed to design, acquisition, analysis, and interpretation; critically revised the article; gave final approval; and agreed to be accountable for all aspects of work ensuring integrity and accuracy. N. Cariello and H.L. Jordan contributed to acquisition, analysis, and interpretation; critically revised the article; gave final approval; and agreed to be accountable for all aspects of work ensuring integrity and accuracy. B. Faiola contributed to conception and design; acquisition, analysis, and interpretation; critically revised the article; gave final approval; and agreed to be accountable for all aspects of work ensuring integrity and accuracy.
Declaration of Conflicting Interests
The author(s) declared the following potential conflicts of interest with respect to the research, authorship, and/or publication of this article: The authors are employees of GlaxoSmithKline with the exception of B. Faiola who was an employee of GlaxoSmithKline at the time of study conduct and who is now employed by Becton, Dickinson and Company.
Funding
The author(s) received no financial support for the research, authorship, and/or publication of this article.