
Abstract
The minimal inhibitory concentration (MIC) of an antimicrobial agent for a microbial population (MIC50, obs and MIC90, obs) is an interpolated value determined for antibacterial drugs by in vitro methods. Many studies have tried to determine the correlation between the MIC50, obs or MIC90, obs value and the physicochemical parameters to allow quantitaive structure activity relationship (QSAR) predictions of efficacy. A rigorous evaluation of approaches to this problem is presented here. In order to find a correlation between chemical structure and the derivatives of the MIC values for 9 indicatory bacterial strains, it is necessary to employ a number of physicochemical parameters in combination. Only an arithmetic expression composed of many features illustrating the chemical structure of the molecule can be linked to the ƒMIC50, obs value. This article demonstrated that, despite the complexity of the MIC value used as the end point, it is possible to validate the model in a limited extent.
Introduction
The minimal inhibitory concentration (MIC) in relation to 50% or 90% of microbial population (MIC50, obs or MIC90, obs) is an interpolated value determined for antibacterial drugs by in vitro methods.
1
These parameters determine the concentration of the drug which inhibits the growth of microorganisms in 50% or 90% of the population. Many studies have tried to determine the correlation between the MIC50, obs or MIC90, obs value and the physicochemical parameters of antibacterial drugs. This facilitates inter alia the development of new antimicrobial substances and identification of pharmacophoric groups.
2
-4
A certain number of antimicrobial substances may be present in food. Residues of veterinary medicines would get into the human digestive tract by consuming the tissues of animals that had been previously exposed to a veterinary drug.
5
These substances may therefore affect the growth of bacteria that reside in the human digestive tract. Effects on growth of these bacteria have been used to determine the value of acceptable daily intake (ADI) of the antibacterial drugs for humans.
7
-9
Currently, ADIs based on the MIC value concerning the effect on the growth of human intestinal bacteria are calculated from the formula:

where MICcalc = mean of the MIC50, obs value calculated for a particular strain of bacteria (confidence interval = 90%), MCC = mass of colon content (220 g/d), F = fraction oral dose available to microorganisms, and BW = mean human body weight. 10 Currently, the indicator strains (for which the MIC50, obs or MIC90, obs value is defined) include the following: Bifidobacterium sp, Eubacterium sp, Clostridium sp, Bacteroides sp, Fusobacterium sp, Enterococcus sp, Escherichia coli sp, Peptococcus/Peptostreptococcus sp, and Lactobacillus sp. 10 In the case of veterinary medicines, the ADI values determined on the basis of the MIC50, obs value are particularly important in the process of drug registration because they are used to determine the maximal residue limit (MRL) value. 11 -13 This parameter specifies the maximum residue level of the drug in tissues and products of animal origin intended for human consumption. Determining the MRL based on a microbiological ADI permits the determination of proper withdrawal period for veterinary antimicrobial drugs. 14 The purpose of this study was to find the relationship between the chemical structure of antibacterial drugs and the MIC50, obs and MIC90, obs values designated for 9 strains of indicator bacteria. 10
Material And Method
Selection of Drugs and Minimal Inhibitory Concentrations
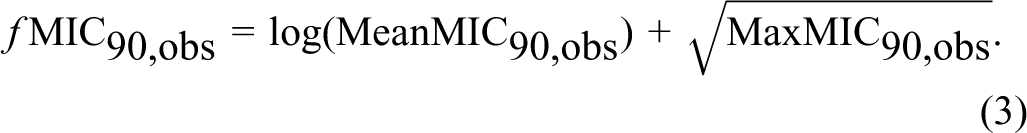
The MIC50, obs and MIC90, obs values were obtained from the database KnowledgeBase, The Antimicrobial Index, Knowledgebase, version 1.8. 15 The MIC values were collected for 9 strains of indicator bacteria, which form the basis for the determination of microbiological ADI. 10 The only substances used for the analysis were those for which the MIC50, obs and MIC90, obs values were determined simultaneously for at least 5 indicatory bacterial strains. In this manner, 21 antimicrobial substances were selected for which the MIC50, obs (n = 158) and MIC90, obs (n = 159) values were determined. The aim of this study was not to determine a simple relationship substance physicochemical parameter—the MIC value, therefore derivatives of the MIC (ƒMIC50, obs and ƒMIC90, obs) were used for the analysis of correlation between chemical structure and the MIC50, obs and MIC90, obs values. They were determined based on the average values (MeanMIC50, obs and MeanMIC90, obs) as well as on maximum values (MaxMIC50, obs and MaxMIC90, obs) obtained for all 9 strains for each selected substance of potential concern (Equations 2 and 3). In order to calculate the derivative the following formulas were applied:
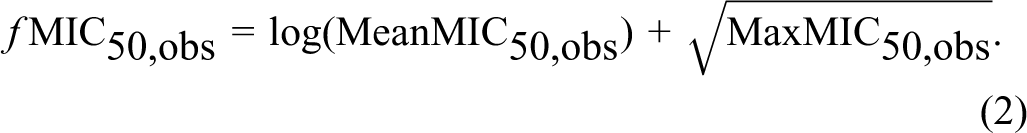
and
In Silico Calculations
Analysis of physicochemical parameters of selected drugs was preceded by the conversion of a structural chemical formula into a mol. file using MarvinSketch 5.11.5 (ChemAxon Ltd, Cambridge, MA). The converted data were used for calculation in QuickProp 3.1 software from Schrödinger package v 31207. 16,17 QuickProp was run in the normal mode. Three-dimensional structures of compounds were prepared in LigPrep 2.2. 17 In cases where the compounds were chiral or underwent tautomerization, up to 32 stereoisomer calculations were generated for each compound or tautomer. The used software allowed for the calculations of 51 parameters. 18 Topological polar surface area (tPSA) was calculated using Marvin Sketch 5.11.4 (ChemAxon Ltd). Complexity—the measure of structural complexity—was taken from PubChem Compound. 19
Model Development
In the first step of the analysis, a search for direct correlation between chemical structure of drugs and the MIC50, obs and MIC90, obs values was conducted. At this step, the MIC50, obs and MIC90, obs values were correlated with each of the 53 physicochemical parameters calculated.
In the second step of the analysis, the ƒMIC50, obs and ƒMIC90, obs values were correlated with each of the 53 physicochemical parameters calculated. Following this (third step), arithmetic expressions were constructed based on the values of all 53 physicochemical parameters. The values of these expressions were correlated with the ƒMIC50, obs, and ƒMIC90, obs values using a previously described method used for that purpose. 18 For equations with significant correlations, internal validation was performed using observed ƒMIC50, obs and ƒMIC90, obs versus predicted ƒMIC50, pred and ƒMIC90, pred data. 20,21
Statistical Analysis and Model Validation
A statistical analysis was performed using Microsoft Office Excel software (Microsoft Corporation). The linear correlation and regression analysis functions were used for the determination of a relationship between the mathematical model value and ƒMIC50, obs and ƒMIC90, obs. All correlations were confirmed by the Fisher test (confidence interval 95%) and differences of P < 0.05 were regarded as statistically significant. Goodness of fit was evaluated based on the ƒMIC50, obs: ƒMIC50, pred and ƒMIC90, obs: ƒMIC90, pred values. The coefficient of determination (R 2) of the observed versus predicted data was determined. The leave-one-out method was used for cross-validation of the model. 22,23 Squared cross-validated correlation coefficient (Q 2) parameter and differences between Q 2 and R 2 were calculated as measure of the internal performance and predictive ability of the model. Q 2 was calculated according to the formula:

where Y obs = observed value for the ith object, Y = value of the ith object estimated using a model, and Y m = average value of the training set. Validation criteria that have to be fulfilled by an optimized model were assumed on the level Q 2 ≥ 0.65, R 2 ≥ 0.85, Q 2 − R 2 < 0.3, and P < 0.05. 20 -23 Only a model that simultaneously meets all the criteria can be qualified as correct.
Results
In the first step, no correlation was found between the MIC50, obs and the MIC90, obs values and any of the 53 of physicochemical parameters calculated for the test substances. A similar effect was obtained when trying to find a correlation between derivatives of the ƒMIC50, obs and ƒMIC90, obs and individual physicochemical parameters (second step of analysis). The values of derivatives ƒMIC50, obs and ƒMIC90, obs from step 3 are presented in Table 1. In the course of the analysis, another arithmetic expression was brought out and the correlation between values of expressions and derivatives the ƒMIC50, obs and ƒMIC90, obs was examined. An example of subsequent expressions that were tested during the operation is shown in Table 2. The model that allowed validation was constructed on the basis of 8 characteristics listed in Table 3. All the tested expressions were validated in a limited way (excluding the F test) in case of obtaining Q 2 − R 2 > 0.3, and in full way in case when Q 2 − R 2 < 0.3. Results of the validation of parameters for all the 25 arithmetic expressions related to the ƒMIC50, obs value are summarized in Table 4. Among the tested expressions, a group was distinguished which fulfills all the validation criteria except the R 2 value. This concerned expression numbers 16 to 20, 22, and 25 (Table 4). Only expressions 23 and 34 met all the criteria for validation. Expression 24 obtained the lowest Q 2 − R 2 value, the highest F test value, and at the same time very high Q 2 and R 2 values. The achievement of such values of validation criteria has allowed for the selection of expression 24 as expressing the best relationship between the chemical structure of the analyzed drugs and the ƒMIC50, obs and ƒMIC90, obs derivatives. The relationship between the value of an arithmetic expression (number 24 from Table 2) and the ƒMIC50, obs and ƒMIC90, obs derivatives is illustrated in Figure 1 . The high value of the coefficient of determination in regard to the relation between the chemical structure of the analyzed drugs and derivative ƒMIC50, obs (Figure 1A) allowed for model validation. This model allows the calculation of the ƒMIC50, obs and ƒMIC50, pred values determined on the basis of an the arithmetic expression number 24.
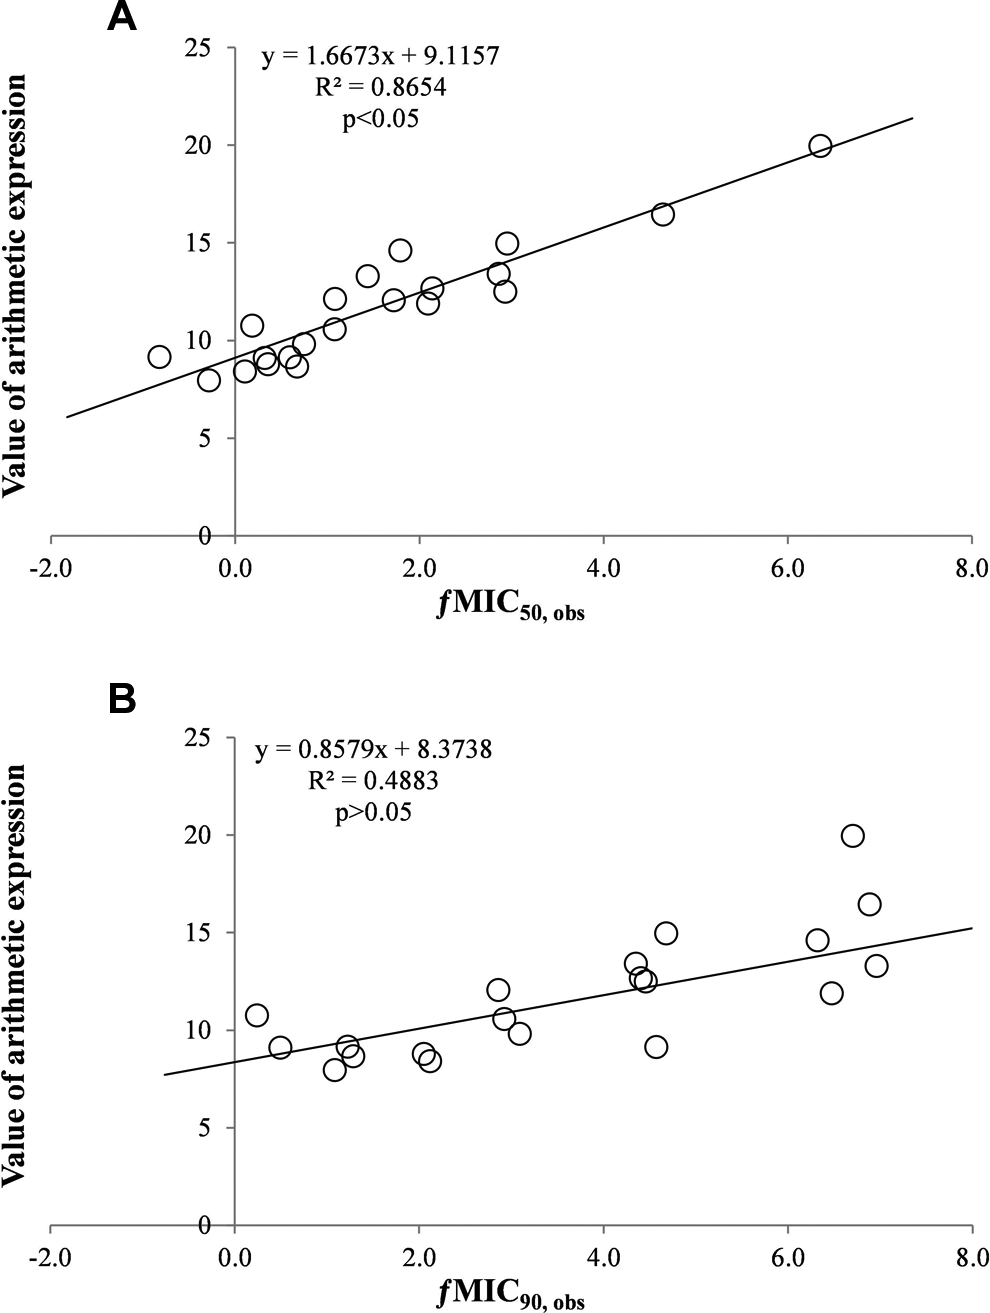
The relationship between the value of an arithmetic expression
Derivation of ƒMIC50,obs (Calculated From Equation: ƒ
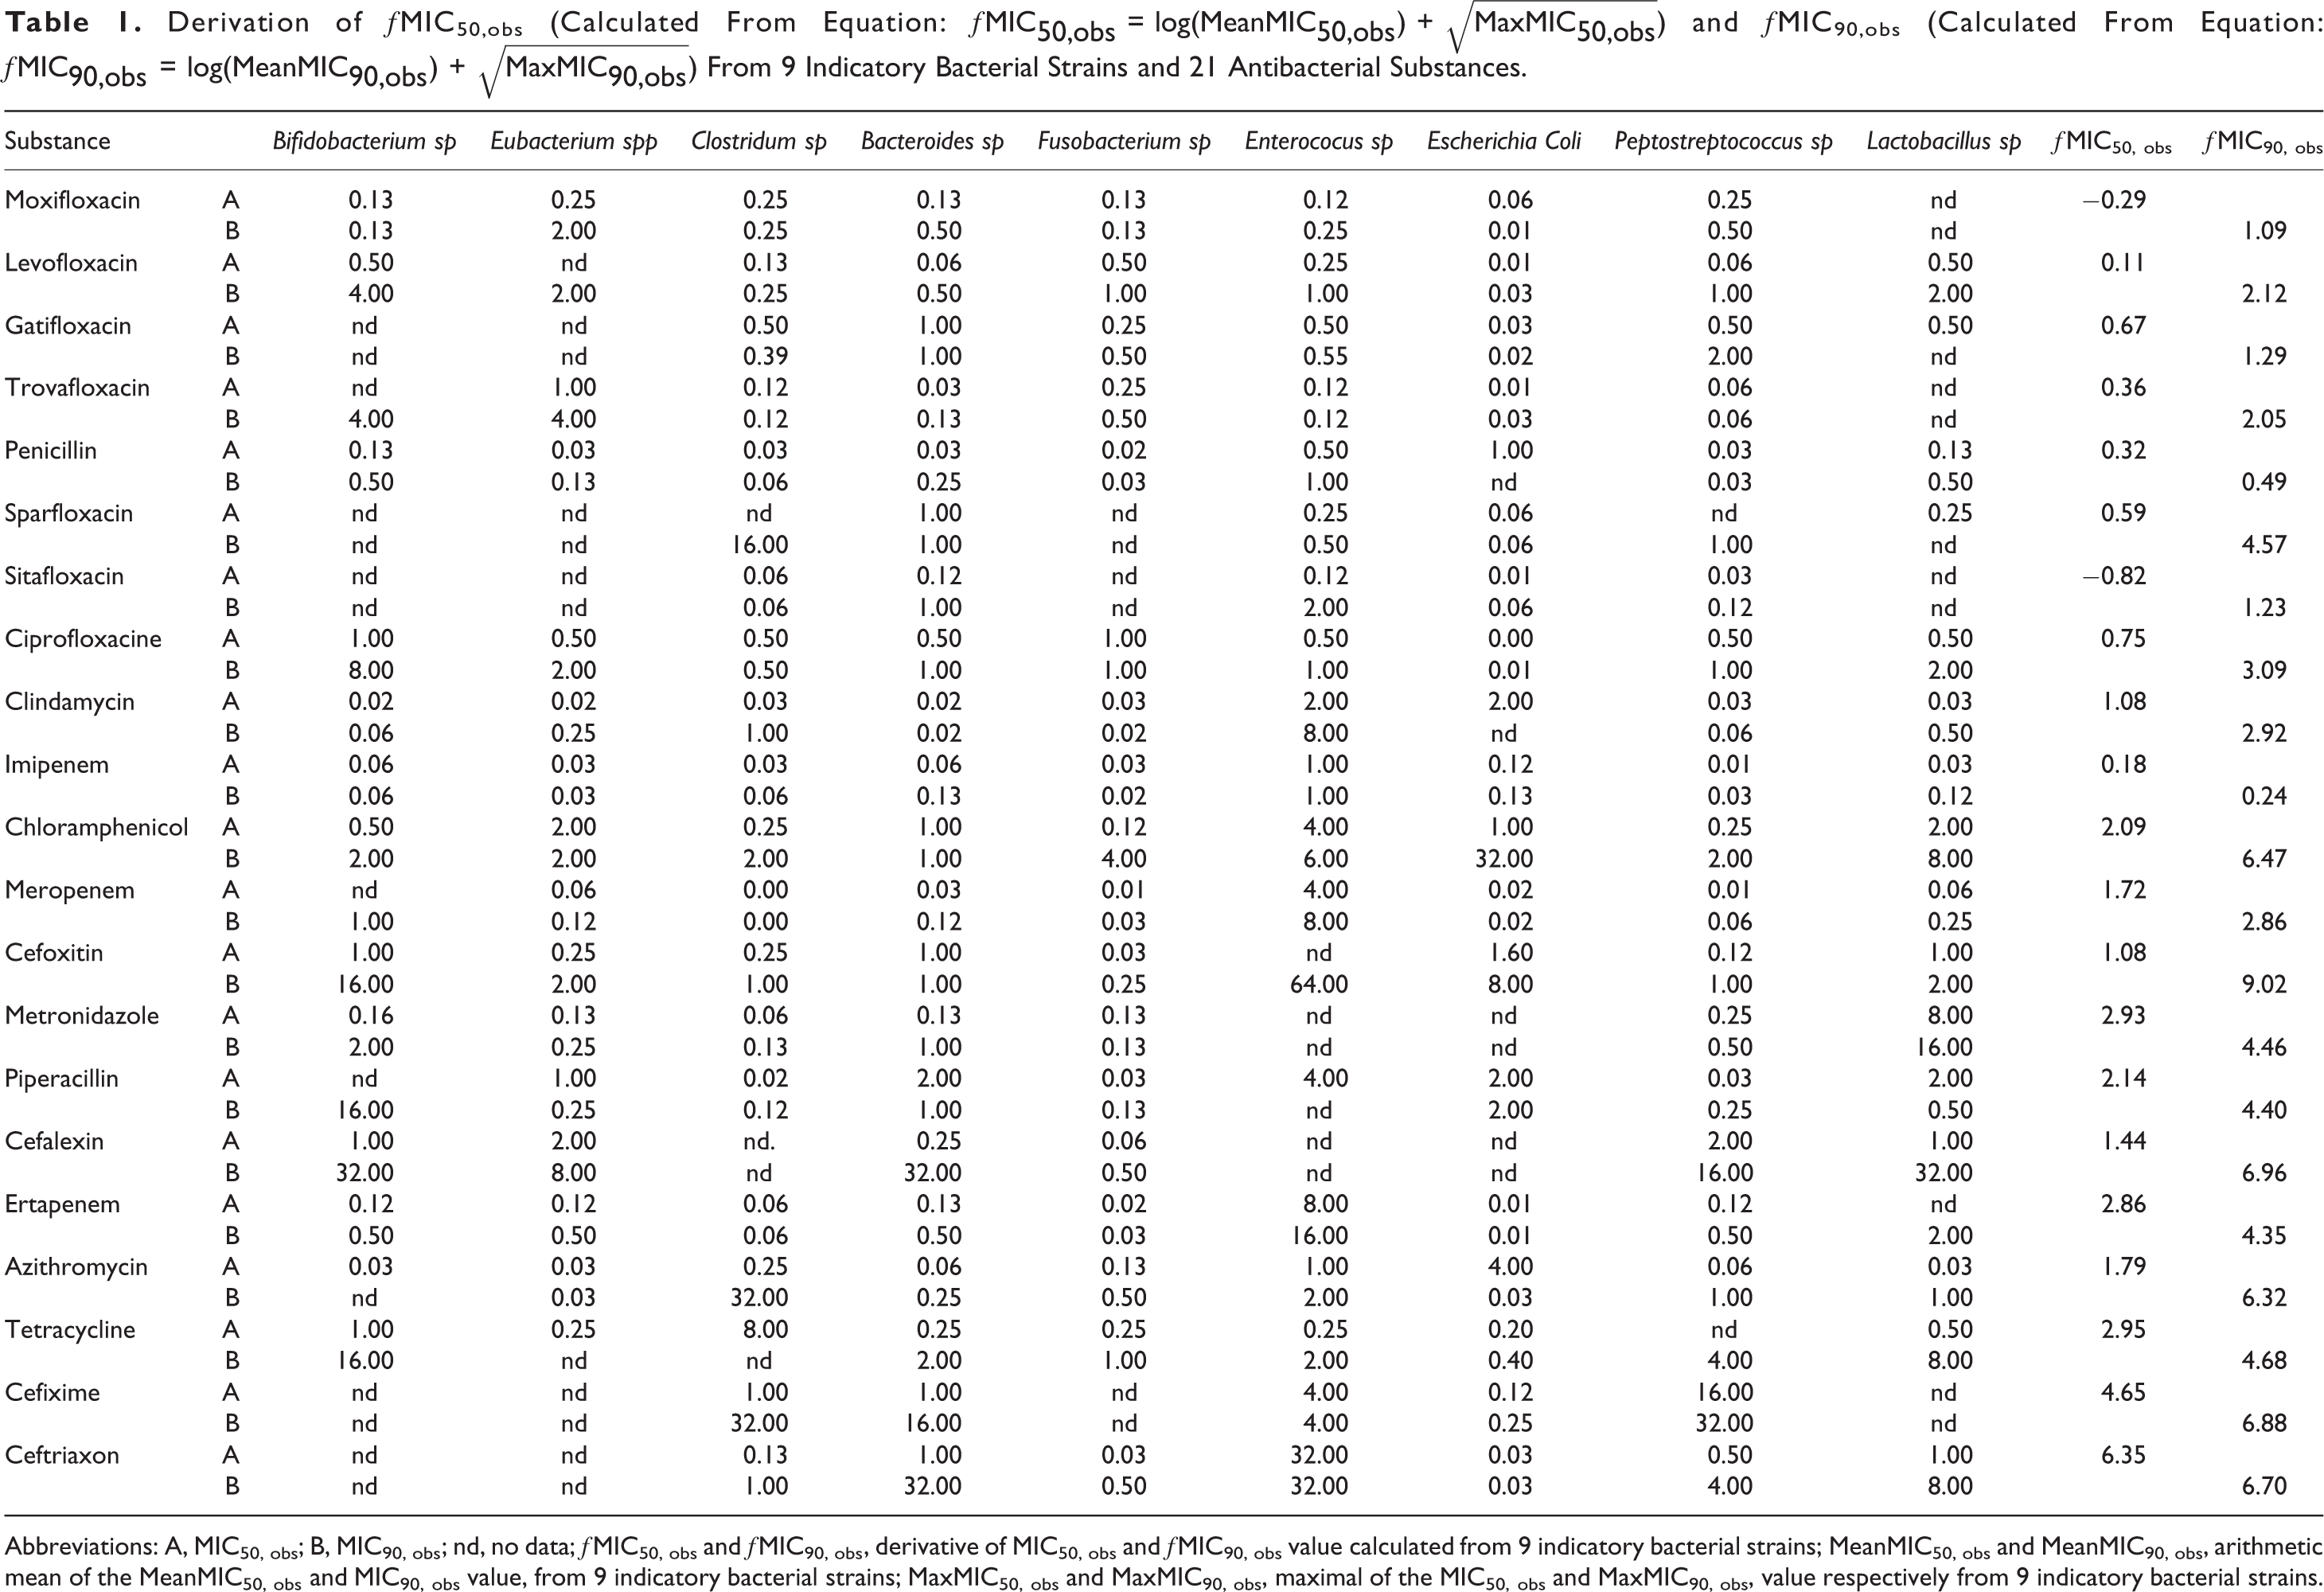
Abbreviations: A, MIC50, obs; B, MIC90, obs; nd, no data; ƒMIC50, obs and ƒMIC90, obs, derivative of MIC50, obs and ƒMIC90, obs value calculated from 9 indicatory bacterial strains; MeanMIC50, obs and MeanMIC90, obs, arithmetic mean of the MeanMIC50, obs and MIC90, obs value, from 9 indicatory bacterial strains; MaxMIC50, obs and MaxMIC90, obs, maximal of the MIC50, obs and MaxMIC90, obs, value respectively from 9 indicatory bacterial strains.
An Example of Arithmetic Expression Development.
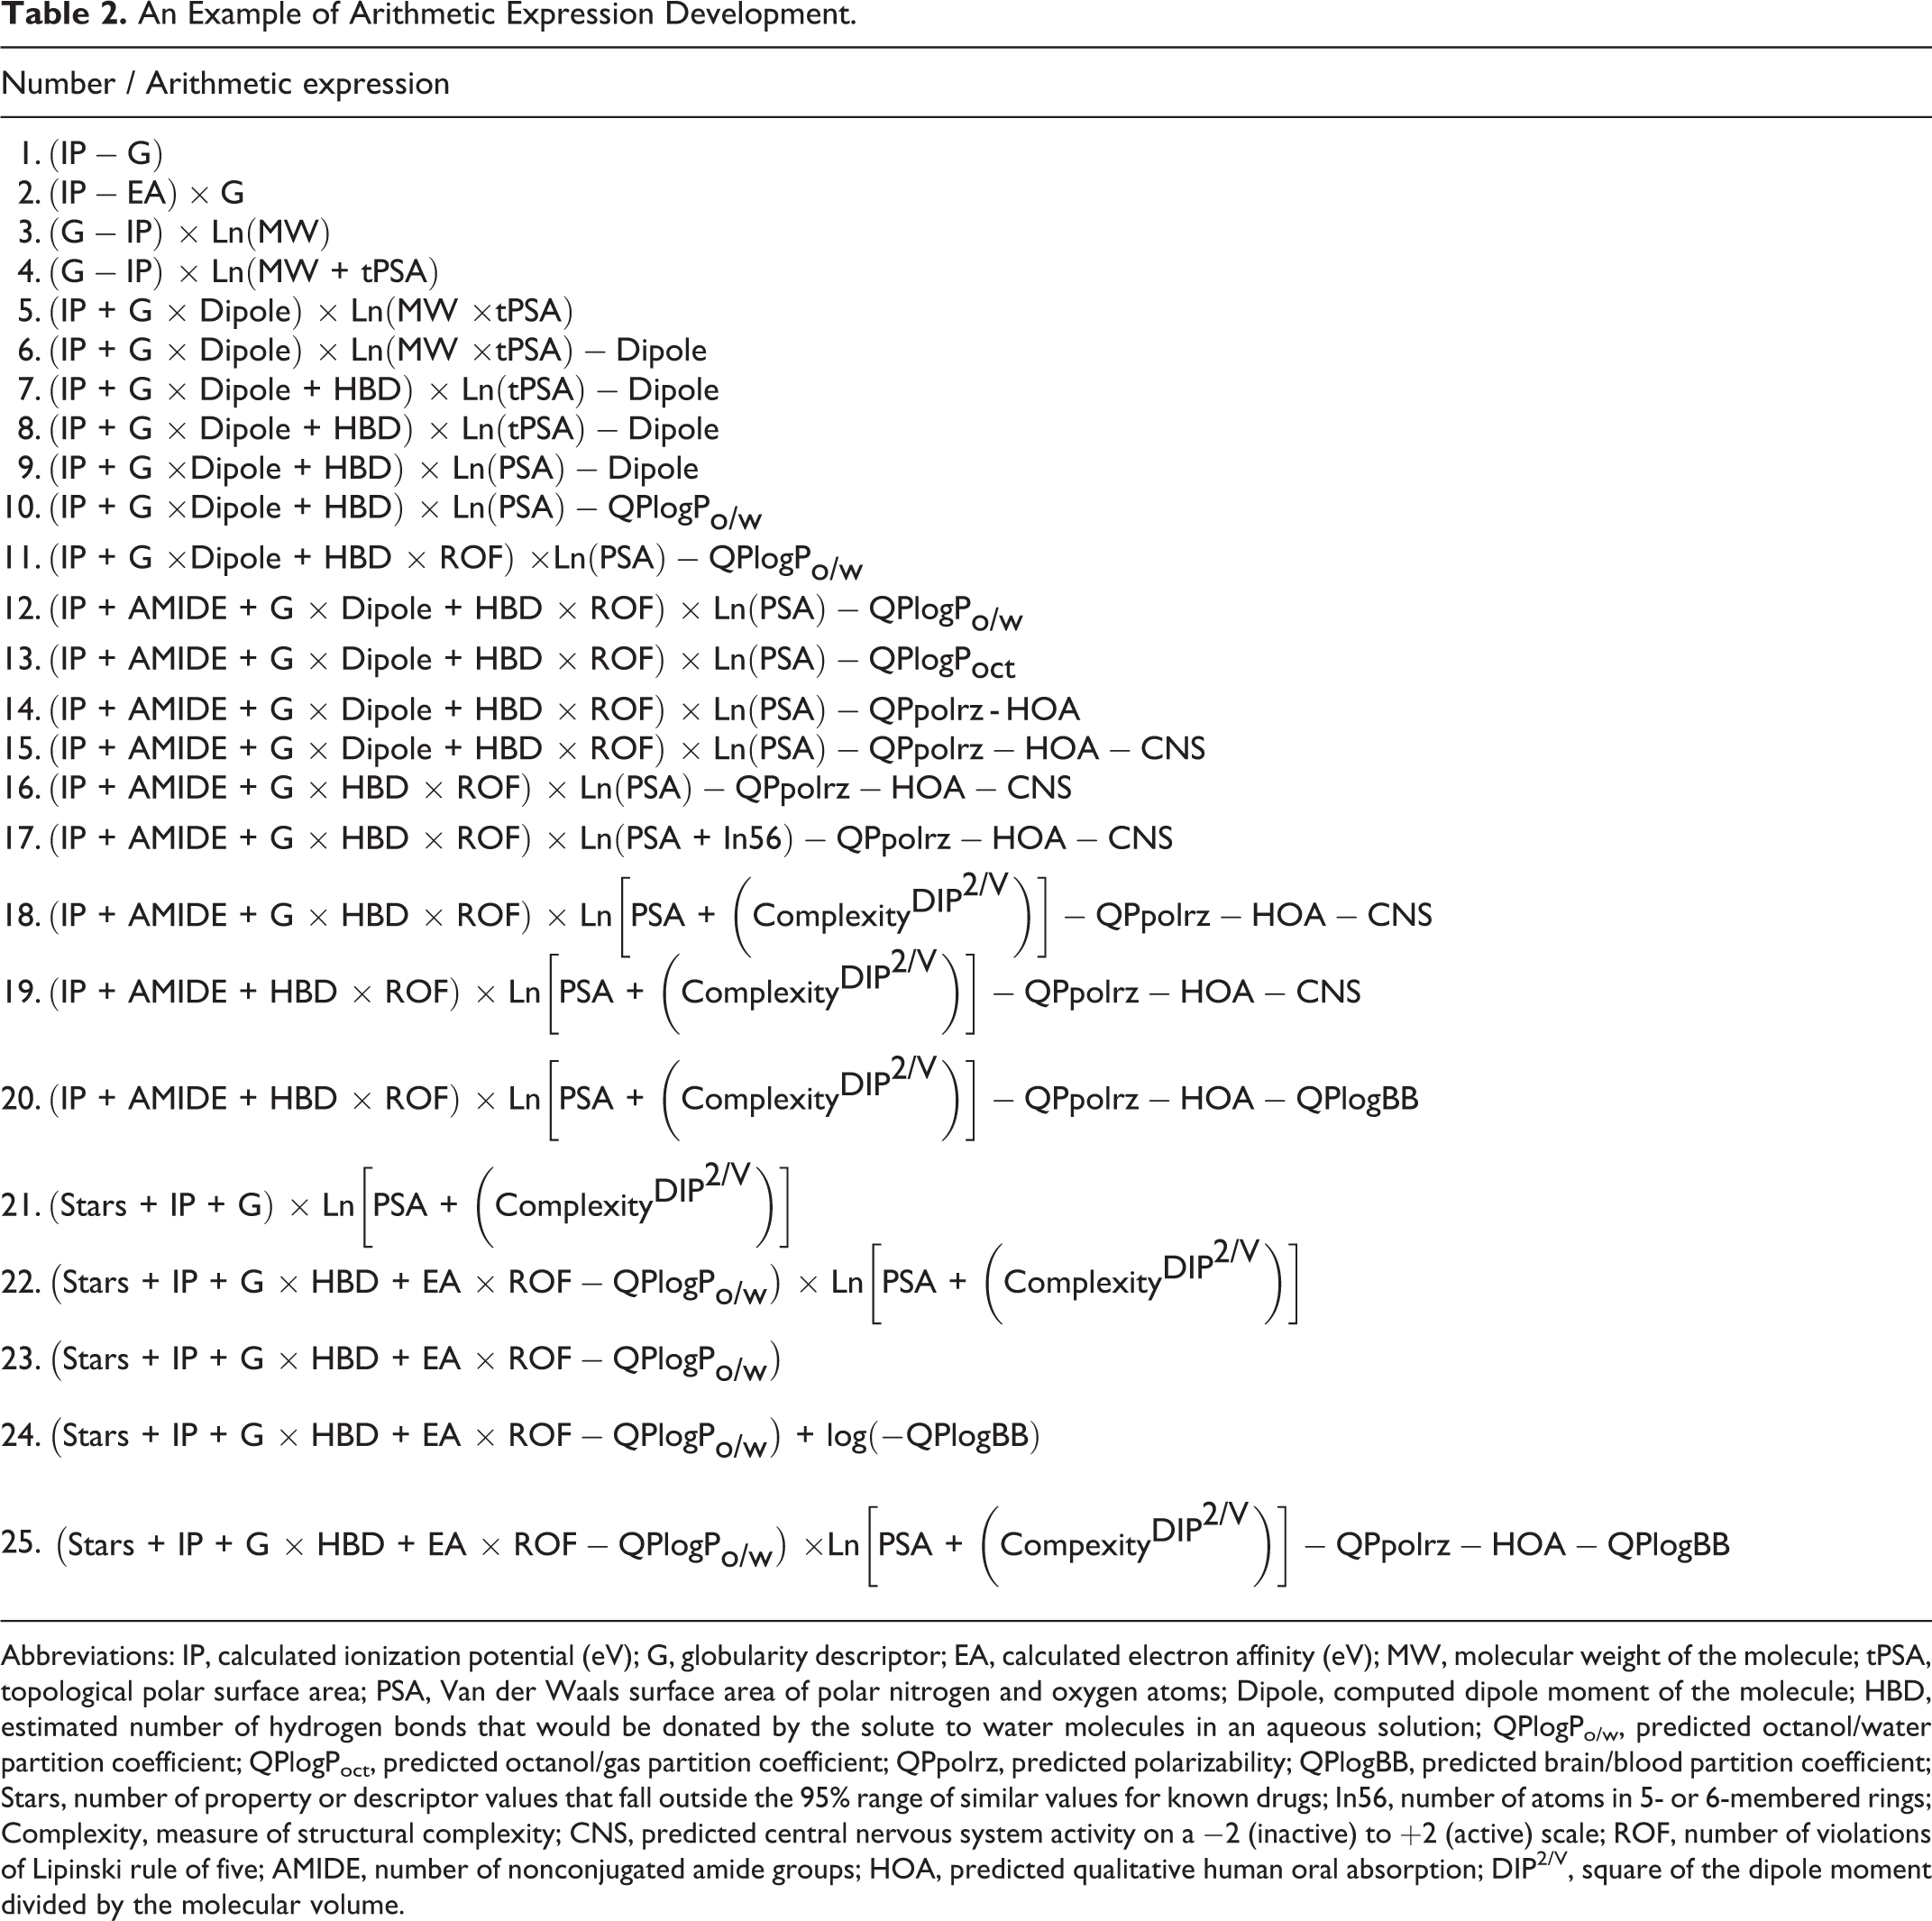
Abbreviations: IP, calculated ionization potential (eV); G, globularity descriptor; EA, calculated electron affinity (eV); MW, molecular weight of the molecule; tPSA, topological polar surface area; PSA, Van der Waals surface area of polar nitrogen and oxygen atoms; Dipole, computed dipole moment of the molecule; HBD, estimated number of hydrogen bonds that would be donated by the solute to water molecules in an aqueous solution; QPlogPo/w, predicted octanol/water partition coefficient; QPlogPoct, predicted octanol/gas partition coefficient; QPpolrz, predicted polarizability; QPlogBB, predicted brain/blood partition coefficient; Stars, number of property or descriptor values that fall outside the 95% range of similar values for known drugs; In56, number of atoms in 5- or 6-membered rings; Complexity, measure of structural complexity; CNS, predicted central nervous system activity on a −2 (inactive) to +2 (active) scale; ROF, number of violations of Lipinski rule of five; AMIDE, number of nonconjugated amide groups; HOA, predicted qualitative human oral absorption; DIP2/V, square of the dipole moment divided by the molecular volume.
Values of Parameters Used in Equation Number 24 From Table 2.
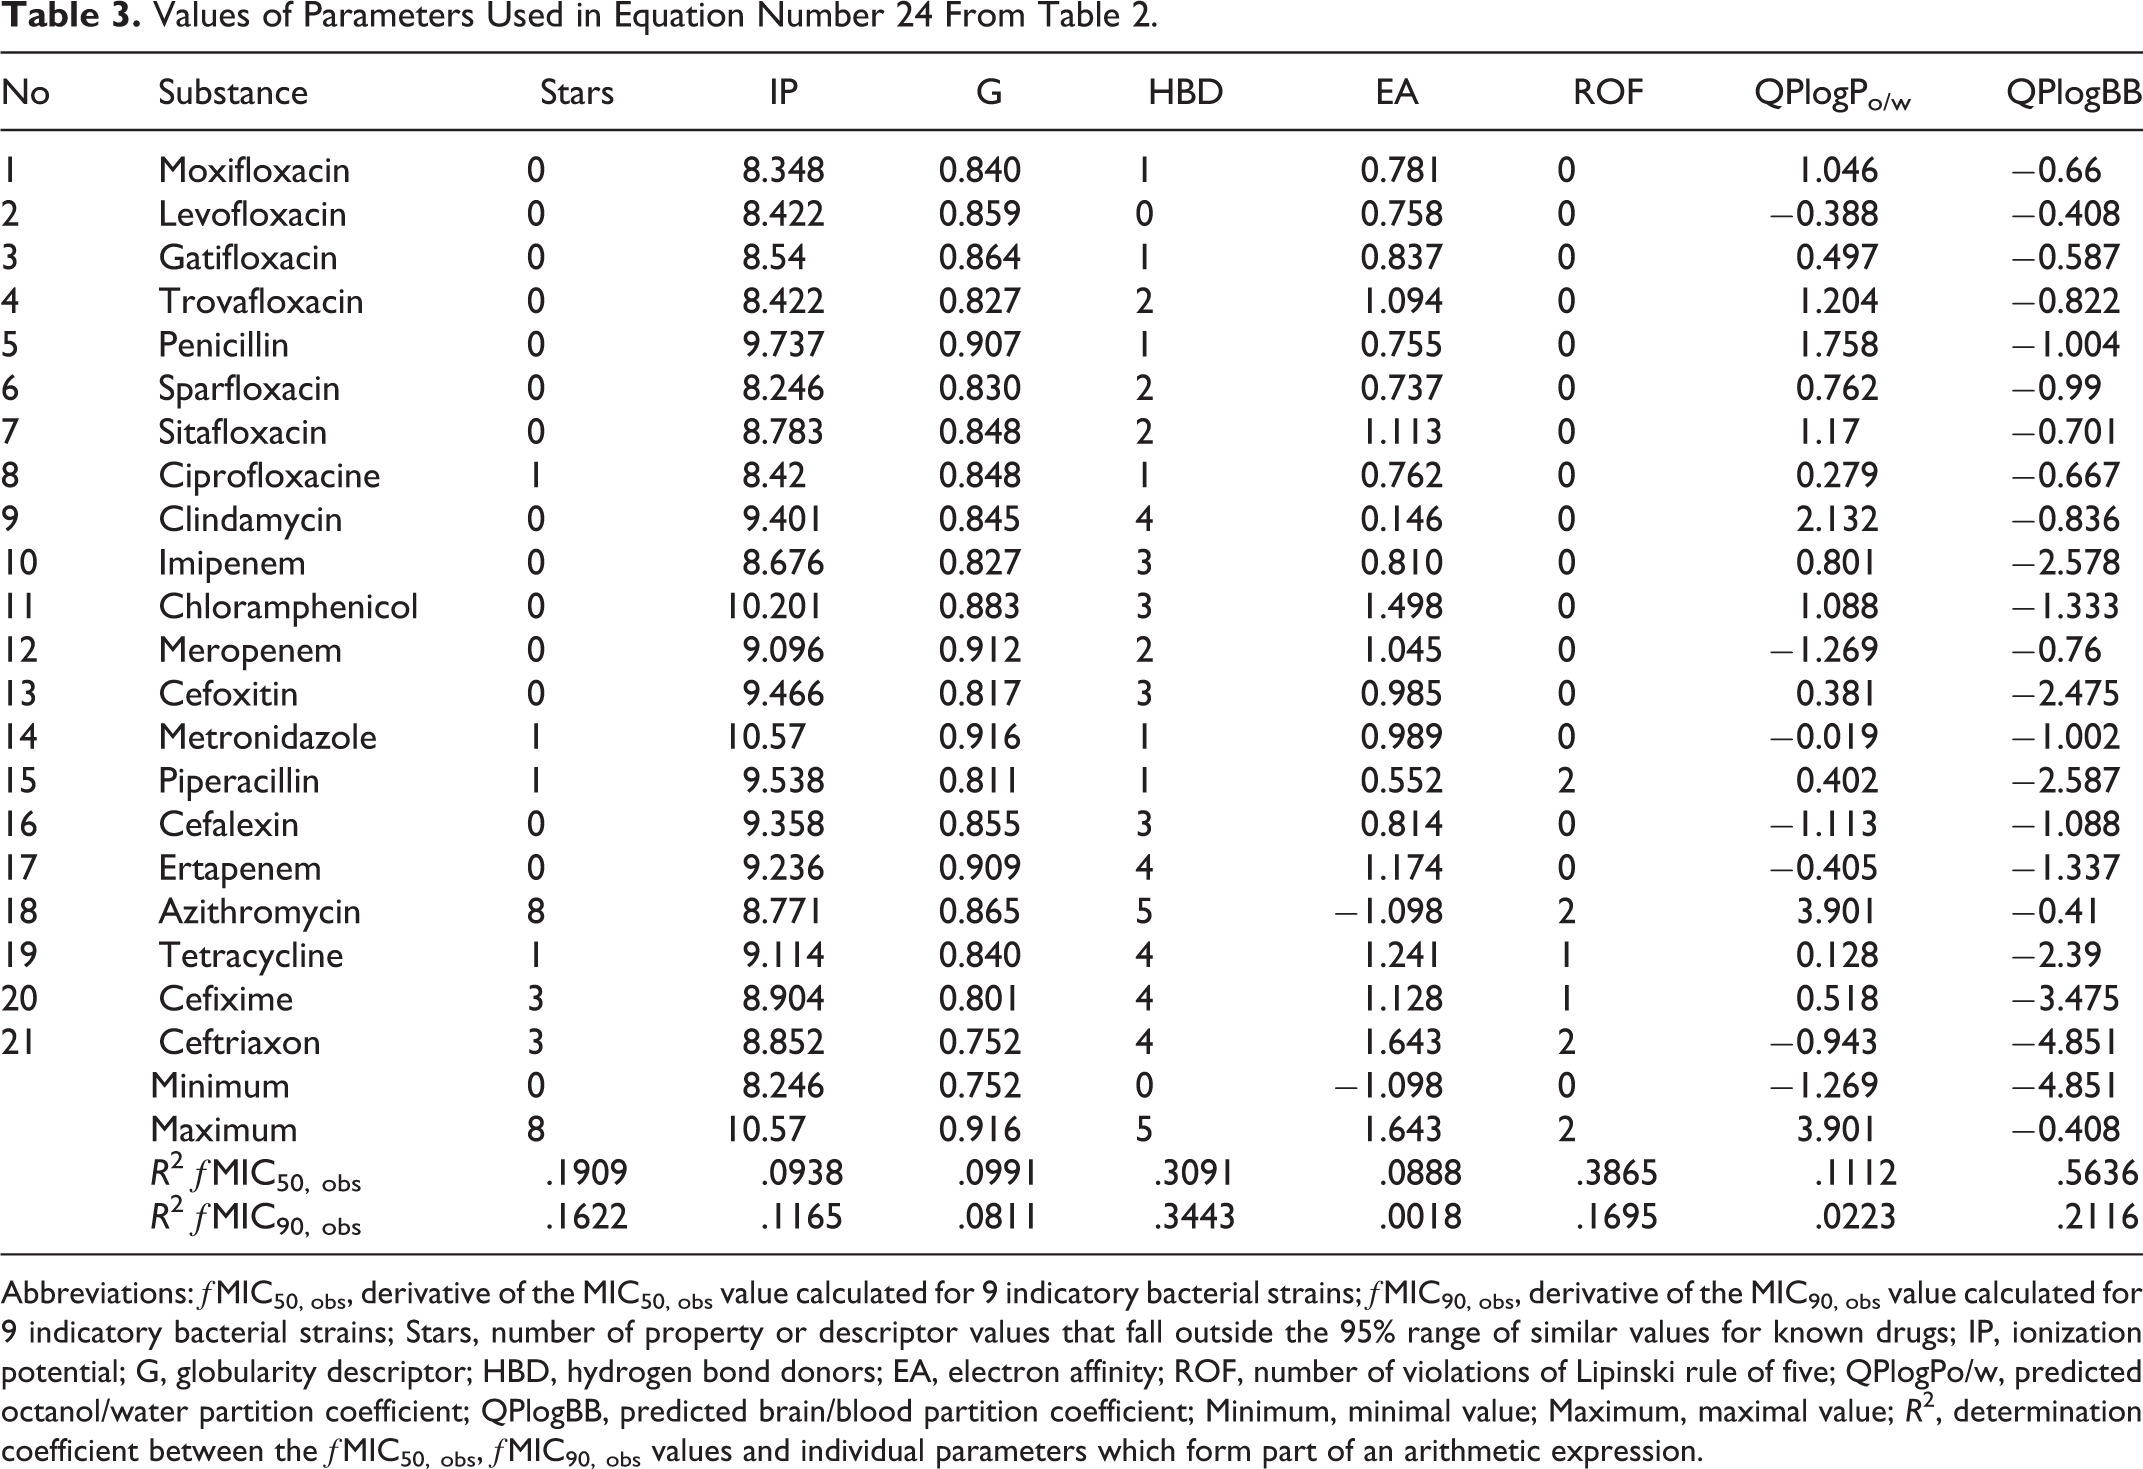
Abbreviations: ƒMIC50, obs, derivative of the MIC50, obs value calculated for 9 indicatory bacterial strains; ƒMIC90, obs, derivative of the MIC90, obs value calculated for 9 indicatory bacterial strains; Stars, number of property or descriptor values that fall outside the 95% range of similar values for known drugs; IP, ionization potential; G, globularity descriptor; HBD, hydrogen bond donors; EA, electron affinity; ROF, number of violations of Lipinski rule of five; QPlogPo/w, predicted octanol/water partition coefficient; QPlogBB, predicted brain/blood partition coefficient; Minimum, minimal value; Maximum, maximal value; R 2, determination coefficient between the ƒMIC50, obs, ƒMIC90, obs values and individual parameters which form part of an arithmetic expression.
Validation Parameters of Arithmetic Expressions Created for Selected Physiochemical Parameters of 21 Antibacterial Substances and Their Correlation With the ƒMIC50, obs Value.
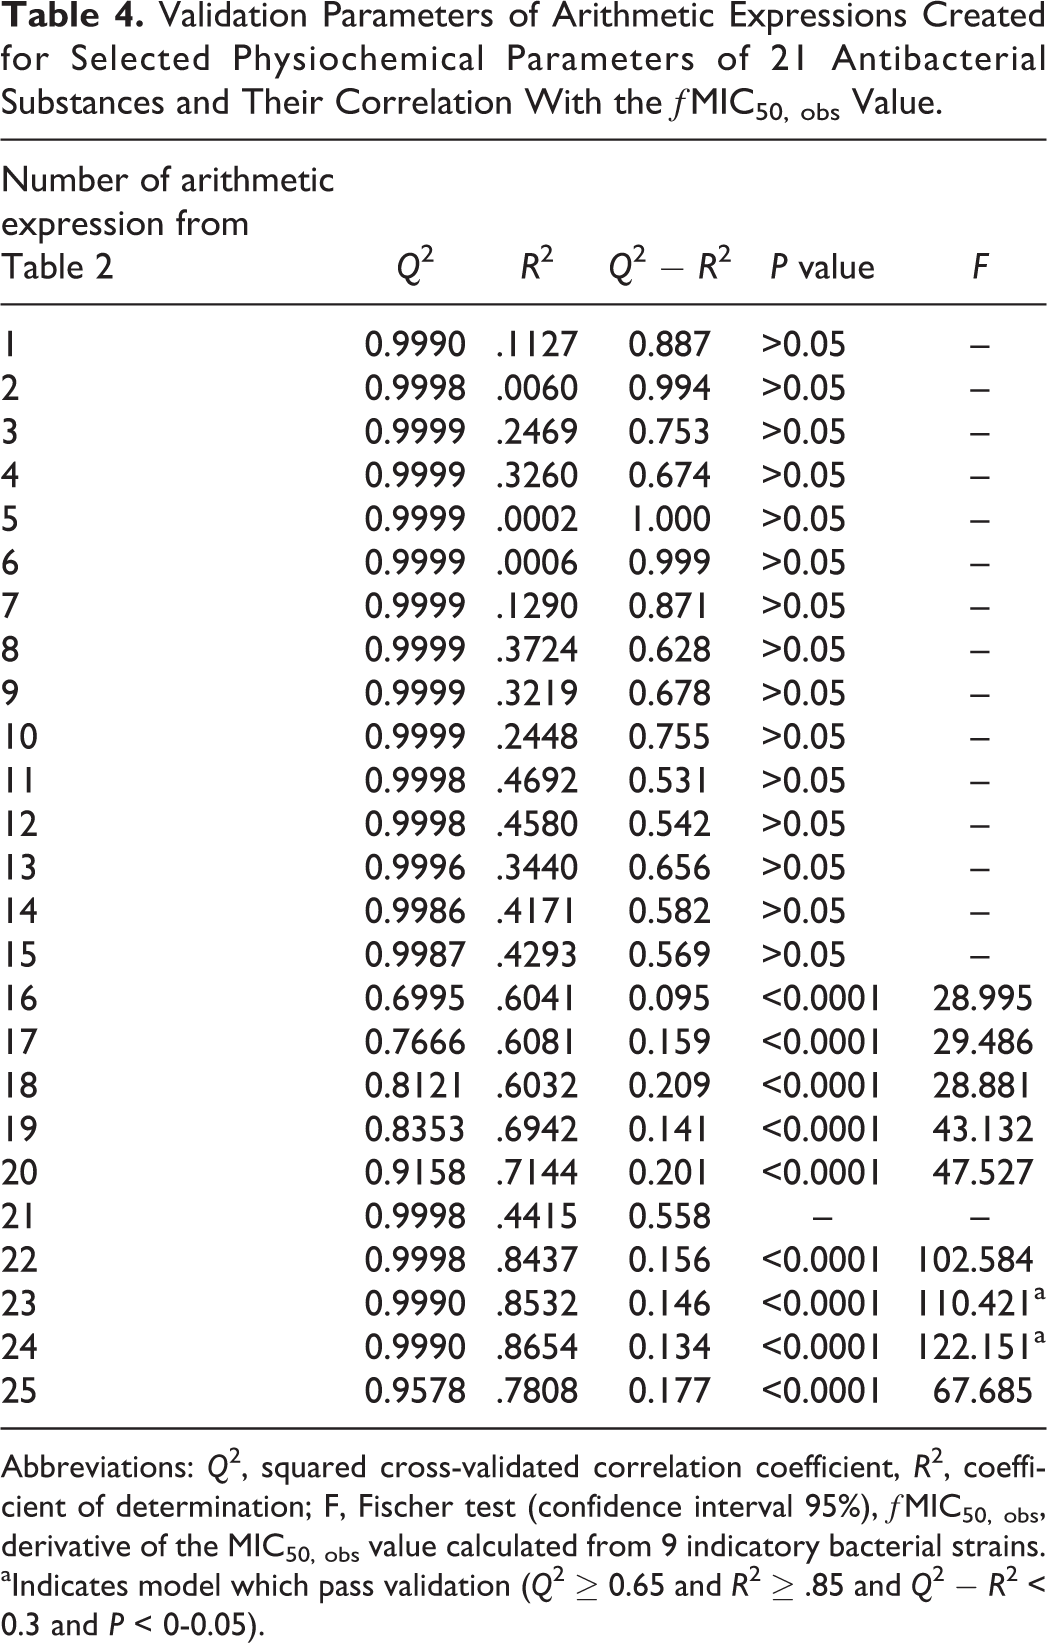
Abbreviations: Q 2, squared cross-validated correlation coefficient, R 2, coefficient of determination; F, Fischer test (confidence interval 95%), ƒMIC50, obs, derivative of the MIC50, obs value calculated from 9 indicatory bacterial strains.
aIndicates model which pass validation (Q 2 ≥ 0.65 and R 2 ≥ .85 and Q 2 − R 2 < 0.3 and P < 0-0.05).
In the case of the ƒMIC90, obs, a close slope of the fit curve was observed. However, the coefficient of determination for this relationship had a very low value (Figure 1B). As a result, it was one of the factors that prevented the validation of the relationship model between the chemical structure of the analyzed drugs and the ƒMIC90, obs derivative. Also, in the case of other tested expressions, the validation of the relationship model between the chemical structure of the analyzed drugs and the ƒMIC90, obs derivative was not possible.
Discussion
A search for relationships between chemical structure and the ƒMIC50, obs and ƒMIC90, obs derivatives in the tested group of drugs was conducted. This has been demonstrated for derivative ƒMIC50, obs and the expression number 24. The required validation parameters were also obtained. 20 -22 Currently, general approach to establish a microbiological ADI describes Food and Drug Administration (FDA) guidance adopted and implemented in 2012. 10 The method of analysis presented in this article for determining the microbiological ADI is based upon recommendations from an FDA guidance that was adopted and implemented in 2012. 10 The relationship between chemical structure and the ƒMIC values was thus based on the resultant values of the MIC for 9 strains of bacteria, which are currently regarded as indicatory organisms. In the case of the FDA guideline, the reference point in the analysis of ADI is the back calculated value of the arithmetic mean for the MIC50, obs. 10 This study proposes another much easier way of unification of the values: MIC50, obs and MIC90, obs expressed in derivatives, which are also based on the arithmetic mean’s logarithm of the MIC value. In the tested group of compounds, the relationship between the chemical structure of the analyzed substances was demonstrated only in relation to the ƒMIC50, obs derivative. In the case of the ƒMIC90, obs, such relation was not established. In the case of the ƒMIC90, obs, arithmetic expression, which adequately reflected the relation with regard to the ƒMIC50, obs, did not meet the validation requirements. The reason for this state of affairs is probably that with the increasing value of MIC, pharmacodynamic processes can be observed, where the course of them is nonlinear and often significantly curved. 1 As seen from the available literature, parameters reflecting pharmacodynamics and toxicodynamics usually have a nonlinear course. 24 -26 For various substances, the characteristics and scope of nonlinearity are in this case completely different. Hence, in the relation between chemical structure and the ƒMIC90, obs, a similar trend and slope was stated. However, a significant variability of the individual values made it impossible to validate the model. During the project, no other arithmetic expression was found which would allow the validation of the model of relations with the ƒMIC90, obs. Based on the above-mentioned analysis, it cannot be concluded that such a relation with regard to the ƒMIC90, obs could be associated with the influence of other physicochemical characteristics on its pharmacodynamic properties. The difference between the results of model validation (MIC derivatives and expression number 24) allows one to question which value of MIC actually allows to obtain best suited model and thus to obtain validation parameters at the highest level. Currently, available data on the MIC of bacteria indicator strains include only MIC50, obs and MIC90, obs. Hence, it is not possible to trace changes in the parameters of validation for the expression number 24, for example, ƒMIC10, obs, ƒMIC20, obs, ƒMIC30, obs, ƒMIC40, obs up to ƒMIC90, obs. Validation of multiple models would allow one to ascertain which value of the MIC is the best suited end point. The difference between the correlations that has been designated for both derivatives of the MIC allows one to raise the question of the limits within which the MIC can be a precise point of reference in the structure–activity relationship analysis. The study demonstrated that it is possible to determine the relationship between the chemical structure of the drug and a group of the MIC values representing in this case the toxicodynamic end point. It was also proven that it is possible to determine such dependencies that allow qualitative and quantitative analysis.
Conclusion
This article establishes that, in order to find a correlation between the chemical structure and the derivatives of the MIC values for 9 indicatory bacterial strains, it is necessary to employ a number of physicochemical parameters in combination. Only an arithmetic expression composed of many features illustrating the chemical structure of the molecule can be linked to the ƒMIC50, obs value. This article does not answer the question whether the determination of microbiological ADI can be replaced with in silico analysis in the future. However, it does demonstrate that, despite the complexity of the MIC value used as the end point, it is possible to validate the model in a limited extent. Furthermore, the study showed that the correlation of in silico relating to the ƒMIC50, obs and ƒMIC90, obs values and the same arithmetic expression have a completely different character.
Footnotes
Acknowledgments
The authors thank Professor Witold Gumułka for critical reading of the manuscript. Special thanks are expressed to Karolina Flejszman for correcting grammar and language of the manuscript.
Authors’ Contribution
Grabowski Tomasz, Jaroszewski Jerzy Jan, and Shayne Cox Gad contributed to conception and design and analysis, drafted the manuscript, critically revised the manuscript, gave final approval, and agreed to be accountable for all aspects of work ensuring integrity and accuracy. Feder Marcin contributed to conception and design and analysis, drafted the manuscript, critically revised the manuscript, and agreed to be accountable for all aspects of work ensuring integrity and accuracy.
Declaration of Conflicting Interests
The author(s) declared no potential conflicts of interest with respect to the research, authorship, and/or publication of this article.
Funding
The author(s) received no financial support for the research, authorship, and/or publication of this article.