
Abstract
Exposure to cigarette smoke (CS) is linked to the development of respiratory diseases, and there is a need to understand the mechanisms whereby CS causes damage. Although animal models have provided valuable insights into smoking-related respiratory tract damage, modern toxicity testing calls for reliable in vitro models as alternatives for animal experimentation. We report on a repeated whole mainstream CS exposure of nasal and bronchial organotypic tissue cultures that mimic the morphological, physiological, and molecular attributes of the human respiratory tract. Despite the similar cellular staining and cytokine secretion in both tissue types, the transcriptomic analyses in the context of biological network models identified similar and diverse biological processes that were impacted by CS-exposed nasal and bronchial cultures. Our results demonstrate that nasal and bronchial tissue cultures are appropriate in vitro models for the assessment of CS-induced adverse effects in the respiratory system and promising alternative to animal experimentation.
Introduction
Cigarette smoke (CS) is a primary cause of respiratory tract cancers and chronic obstructive pulmonary disease (COPD) worldwide. 1 Although the most reliable insights come from longitudinal clinical and epidemiological observations, toxicological assessments have often made use of various animal models to elucidate exposure effects and disease mechanisms because of fewer restrictions in exposure, easier sampling, and shorter times to disease. However, the principles of the 3 Rs, “Replace, Reduce, Refine,” in animal testing 2 necessitate the development of relevant in vitro models.
Three-dimensional organotypic pseudostratified bronchial tissue cultures with differentiated epithelial cells have been created to better mimic the morphological, physiological, and molecular attributes of human airway epithelium compared to primary cells or immortalized cell lines grown as submerged monolayers. 3 -5 Organotypic bronchial tissue models recapitulate the cell type composition, that is, ciliated, nonciliated, goblet, and basal cells, mucociliary phenotype, and operational tight junctions of the human airway. Moreover, the transcriptome of these cultures closely resembles that of in vivo brushed bronchial cells. 6 The interactions between epithelial cells and fibroblasts are also important in lung injury and repair. 7,8 EpiAirway® (MatTek, www.mattek.com) and MucilAir® (Epithelix Sarl, www.epithelix.com) models of airway epithelial cells cultured with fibroblasts have been developed to better mimic the in vivo situation. In the MucilAir model, the fibroblasts are cultured as a monolayer on a porous membrane on the opposite side of the epithelial cells, whereas in the EpiAirway model, the fibroblasts are placed just below the epithelial cell in a collagen matrix.
Organotypic bronchial models are scalable and amenable to the simultaneous screening of multiple compounds. 5,9,10 The VITROCELL® whole CS exposure system (VITROCELL® Systems GmbH, Waldkirch, Germany) enables exposure to whole CS, instead of smoke fractions, directly at the apical surface or the epithelial culture grown at air-liquid interface. 11,12
In addition to its impact on the lower airways, CS passes through the upper respiratory tract including the nasal epithelium and can trigger damage. 13 -17 These harmful effects can mirror the injuries seen in the lower and distal airways in smokers with and without COPD. 18 -23 Recent findings also suggest that smoking is associated with an inflammatory phenotype in the nasal airway of asymptomatic smokers. 24
Similar to the bronchus, the nasal respiratory area is composed of pseudostratified columnar epithelium, namely basal, goblet, nonciliated, and ciliated columnar cells. 25 Gene expression profiling has also demonstrated a remarkably similar transcriptomic response to CS in both nasal and bronchial tissues from current and never smokers. 26,27 With respect to DNA damage and repair, the nasal mucosa of smokers was found to have 34% more DNA adducts than the bronchial mucosa. 28,29 A recent study also showed the association of DNA adducts and daily smoking dose as well as polymorphisms in several genes linked to lung cancer risk. 30
In culture, bronchial and nasal cells show almost identical morphology and ciliary activity. 31,32 McDougall et al. further demonstrated a similar constitutive expression of cell surface receptors on both nasal and bronchial cells. Although the release of inflammatory mediators was quite different between resting cells of the 2 tissue types, the degree of increase in secretion of mediators, such as vascular endothelial growth factor (VEGF), interleukin (IL) 8, and matrix metalloproteinase (MMP) 9, was similar in the two cell types upon stimulation with proinflammatory cytokines.
This study used bronchial and nasal organotypic culture models that were reconstituted using epithelial cells and fibroblasts to better mimic the in vivo situation and repeatedly exposed them to whole smoke. We extended our previous analysis 33 with another set of donors for bronchial and nasal epithelial cells reconstituted into organotypic cultures and with more detailed analysis of biological impact of whole CS exposure. We also compared the differential gene expression between organotypic in vitro cultures exposed to CS and bronchial brushings from smokers.
Materials and Methods
Organotypic Tissue Culture Models
MucilAir human fibroblasts (HF) bronchial and MucilAir HF nasal tissue models based on primary human respiratory epithelial cells cocultured with primary human airway fibroblasts were purchased from Epithelix Sárl (Geneva, Switzerland) and maintained according to the manufacturer’s instructions. To derive healthy bronchial tissue cultures, the cells were obtained from a healthy nonsmoking 67-year-old caucasian female autopsy donor with written consent from the donor/family, and the nasal cultures were derived from a healthy nonsmoking 65-year-old caucasian male. The fibroblasts used for the creation of both nasal and bronchial tissue models were isolated from a healthy nonsmoking 61-year-old caucasian male autopsy donor. Both tissue models were cultured at the air-liquid interface in 0.7 mL media in separate 24-well cell culture inserts. The organotypic tissue cultures were maintained in house at 37°C for 14 days at the air-liquid interface, and fresh medium was added every 2 days.
VITROCELL® System Whole CS Exposure Set-Up
A dose range-finding study was conducted to determine the concentration of CS that allowed 80% survival of cells within the 2 tissue types 48 hours after initial repeated exposure (data not shown). Based on these findings, the tissues were exposed in triplicate at the air-liquid interface to 16.7% (vol/vol) mainstream CS of 4 reference 3R4F cigarettes (6-7 minutes per cigarette) with 1-hour rest between each cigarette or 60% humidified air (controls) in the VITROCELL® system. The 3R4F reference cigarettes were obtained from the University of Kentucky (www.ca.uky.edu/refcig) and were smoked on a 30-port carousel smoking machine (SM2000, Philip Morris, Int, Neuchatel Switzerland) according to a modified Health Canada regimen (ie, 55-mL puff over 2 seconds, twice a minute, and 8 seconds pump exhaust time). 34 After exposure, the tissues were incubated with fresh culture medium for 0, 4, 24, and 48 hours until further analysis. The deposition of total particulate matter (TPM) on the tissues was measured inside the exposure chamber as described by Adamson et al. 35 -39
Tissue Toxicity Assay
The integrity of the tissue inserts was controlled by (1) microscopic examination and (2) the absence of medium leakage. Cytotoxicity and cell viability of nasal and bronchial tissues were assessed in 50 µL cell culture medium 24 and 48 hours after CS exposure or after treatment of the positive control tissues for 2 hours with 10% Triton X-100 in water (cat. #93443-100ML; Sigma-Aldrich, Buchs, Switzerland) using the CytoTox-ONE Homogeneous Membrane Integrity Assay (cat. #: G7891; Promega, Dübendorf, Switzerland) based on the release of lactate dehydrogenase (LDH) from cells with a damaged membrane. Toxicity was assessed in inserts that were used later for gene expression analyses. Tissue integrity 48 hours after CS exposure was detected by measurement of cellular transepithelial-electrical resistance (TEER) using chopstick electrodes (STX-2) connected to the EVOMTM epithelial voltohmmeter (World Precision Instruments, Berlin, Germany) after the addition of 200 μL of media to the apical side of the tissue culture.
Histological Analysis
At 48 hours postexposure to CS, human nasal and bronchial tissue cultures were washed in phosphate-buffered saline (PBS) and fixed in 4% paraformaldehyde for 1 hour and then washed again 3 times with PBS. The fixed tissues were embedded in paraffin and used for histology and immunostaining. Tissue staining was outsourced to Epithelix (Geneva, Switzerland). Briefly, for histological analysis, the sections were stained with Alcian Blue (1% solution in 3% acetic acid, pH 2.5) for 40 minutes, then washed 3 times with PBS, and counterstained with hematoxylin and eosin (H&E) for 15 minutes at room temperature. Slides were then washed further 3 times with PBS, mounted with coverslips, and the stained cells/areas were quantified.
Antibody labeling was performed using a Benchmark robot (Ventana-Roche, Basel, Switzerland) with the Ultraview DAB kit (Ventana-Roche, Basel, Switzerland) for revelation. First, the paraffin was removed from tissue sections and were incubated with buffer containing Tris/EDTA, pH 8.4, at 95°C for 1 hour (anti-p63) or 30 minutes (anti-Muc-5 AC and anti-Ki67). Tissue sections were then incubated for 1 hour at 37°C with primary antibodies against p63 (1:100 dilution, cat #: Ab111449, batch #: GR94056-1; Abcam, Paris, France) for detection of basal cells, anti-Muc-5AC (1:800 dilution, cat #: Ab3649, batch #: GR10125-1; Abcam) for detection of mucins and a marker of the mucus layer of the epithelium, and anti-Ki-67 (1:100 dilution, Clone MIB-1, cat #: M7240, batch #: 00087479; Dako, Les Ulis Cedex, France) for detection of proliferating cells. Tissue sections were counterstained with hematoxylin for 4 minutes and mounted with coverslips. All quantifications were performed using the Image Pro Plus program from Media Cybernetics (version 6.2, Rockvillle, Maryland).
Measurement of Proinflammatory Markers
The release of inflammatory markers 24 hours after CS exposure of nasal and bronchial tissues was measured in 100 µL of medium stored at −80°C. Secretion of granulocyte colony-stimulating factor (G-CSF), granulocyte macrophage CSF (GM-CSF), IL-10, IL-1A, IL-1B, IL-6, IL-8, monocyte chemoattractant protein 1 (MCP-1), macrophage inflammatory protein 1 (MIP-1A), VEGF, eotaxin, regulated on activation, normal T-cell expressed and secreted (RANTES; Milliplex MAP Human cytokine/chemokine magnetic bead panel, HCYTOMAG-60 K; Millipore), MMP-1, and MMP-9 (Milliplex MAP Human MMP magnetic bead panel 2, HMMP2MAG-55 K; Millipore) were measured by Luminex-based technology according to Milliplex instructions (Millipore). The cytokine heat map was generated using the heatmap.2 function in the “gplots” R package. 40 Hierarchical clustering was performed using the hclust function in the “stats” R package. 41
RNA Isolation and Microarray Hybridization
Exposed tissues were harvested immediately (0), 4, 24, and 48 hours postexposure and were first washed 3 times with ice-cold PBS and lysed using Qiazol lysis reagent (miRNeasy Mini Kit cat #217004; Qiagen, Hombrechtikon, Switzerland) and then frozen at −80°C for up to 1 week. The miRNeasy Mini Kit (cat #217004; Qiagen) was used to extract and purify messenger RNAs (mRNAs). Total RNA quantities were measured by NanoDrop ND1000 (PeqLab, Erlangen, Germany) and the quality was verified by an Agilent 2100 Bioanalyzer profile (Agilent, Waldbronn, Germany). An RIN number >8 was required for an acceptable quality. For mRNA analysis, 100 ng of total RNA was processed as described in the GeneChip HT 3’ IVT Express User Manual (Affymetrix, Santa Clara, California), and Genechip Human Genome U133 Plus 2 Arrays (Affymetrix) were used for hybridization.
Microarray Data Processing and Analysis
Raw .CEL files were background corrected, normalized, and summarized using the GCRMA (Guanine Cytosine Robust Multi-Array Analysis) algorithm.
42
All chips passed the quality control check performed with R packages from the Bioconductor (affyPLM (probe-level model)).
43,44
Gene expression data were submitted to ArrayExpress (http://www.ebi.ac.uk/arrayexpress/) under accession number E-MTAB-2250. For every postexposure time, 3 replicates for each tissue were available, R1, R2, and R3 for air-exposed cultures and R*1, R*2, and R*3 for CS-exposed cultures. To identify probe sets with a modulated expression following CS treatment, the linear model described subsequently (Equation 1) was computed for each postexposure time:

where ε corresponds to normally distributed random noise. The coefficient β1 that represents the effects of CS treatment described earlier was estimated using the limma R package. 45
Quantification of Network Perturbation Amplitudes
Transcriptomic data were analyzed in the context of hierarchically structured network models describing the molecular mechanisms underlying essential biological processes in nondiseased lung cells. The network perturbation amplitude (NPA) values and their associated Uncertainty and Specificity statistics were calculated using the Geometric Perturbation Index metric and the DPH (down-weighing promiscuous HYPs) method for downweighting promiscuous network nodes. 46,47 The Uncertainty statistic quantifies the variability of an NPA value resulting from the variability of differential gene expression profiles across the experimental replicates. The Specificity statistic tests whether an NPA value is truly a consequence of the perturbation of the biological process described by the network model. It compares the true NPA value with the background distribution of NPA values obtained by replacing the genes underlying the network model with suitably stratified randomly chosen nonrelated genes. 47 The Specificity statistic is expressed as a P value, which corresponds to the fraction of the calculated background NPA values that are more extreme than the true NPA value, and its significance threshold is taken at 5%. The background distribution of the NPA values is also used to calculate the normalized NPA values, which enable a fair between-network comparison of the exposure effects for a given treatment. The normalized NPA values were obtained by standardizing the true NPA values using the sampling distribution of the background NPA values, the size of which was taken as 10 000 to ensure robust estimation of its mean and standard deviation. If the background distribution of the NPA values is close to normal, which is generally the case, then the (−2, +2) interval of normalized NPA values corresponds approximately to the 2.5th to 97.5th percentile range and thus provides a practical way to characterize an NPA value with significant specificity statistic.
Any network model perturbed with a significant specificity statistic usually implies that some, but not necessarily all, of its subnetwork models also display significant specificity statistics. Conversely, a significant specificity statistic for a subnetwork model does not always guarantee that its overarching network model also has a significant specificity statistic. This is because a perturbation specific to the biological mechanisms described by a subnetwork usually becomes less specific when evaluated with respect to the wider assembly of biological processes, which might not be perturbed, described by the overarching network model. 47
Enrichment Analysis
To compare the in vivo smoking versus nonsmoking effects on nasal and bronchial samples (GSE16008) with the in vitro organotypic expression profiles over various postexposure time points, gene set analysis was performed for all estimated effects. 48 Gene-level statistics used the 2-sample t-statistic Zi, and the gene set enrichment statistic was chosen as the “maxmean statistic” rather than the Kolmogorov-Smirnov statistics used in gene set enrichment analysis. 49 Both gene sampling and label permutation tests were used to test gene set significance. Gene set scores with an associated false discovery rate of <0.05 were considered to be statistically significant. The heat maps were generated by using the heatmap.2 function in the “gplots” R package. The row hierarchical clustering was performed using the hclust function in the “stats” R package 41 with complete agglomeration and Euclidean distance metrics.
Results
Repeated Exposure Design and Biological Endpoints
To mimic repeated exposure to mainstream CS in humans, we exposed organotypic nasal and bronchial cultures 4 times to 16.7% of whole smoke with a 1 hour recovery period between each exposure (Figure 1). Summary of the end point measurements is shown in Supplementary Table 1. The TPM deposition on the tissues was measured inside the exposure chamber and reached an average of 4.6 μg/cm2 per cigarette (Supplementary Figure 1). Whole CS applied to the nasal and bronchial tissue cultures did not induce considerable impairment of tissue integrity determined by the TEER measurements (data not shown) or cell cytotoxicity assessed by the release of LDH in the media at various postexposure time points (0, 4, 24, and 48 hours) compared with Triton X-100-treated tissues (Supplementary Figure 2).
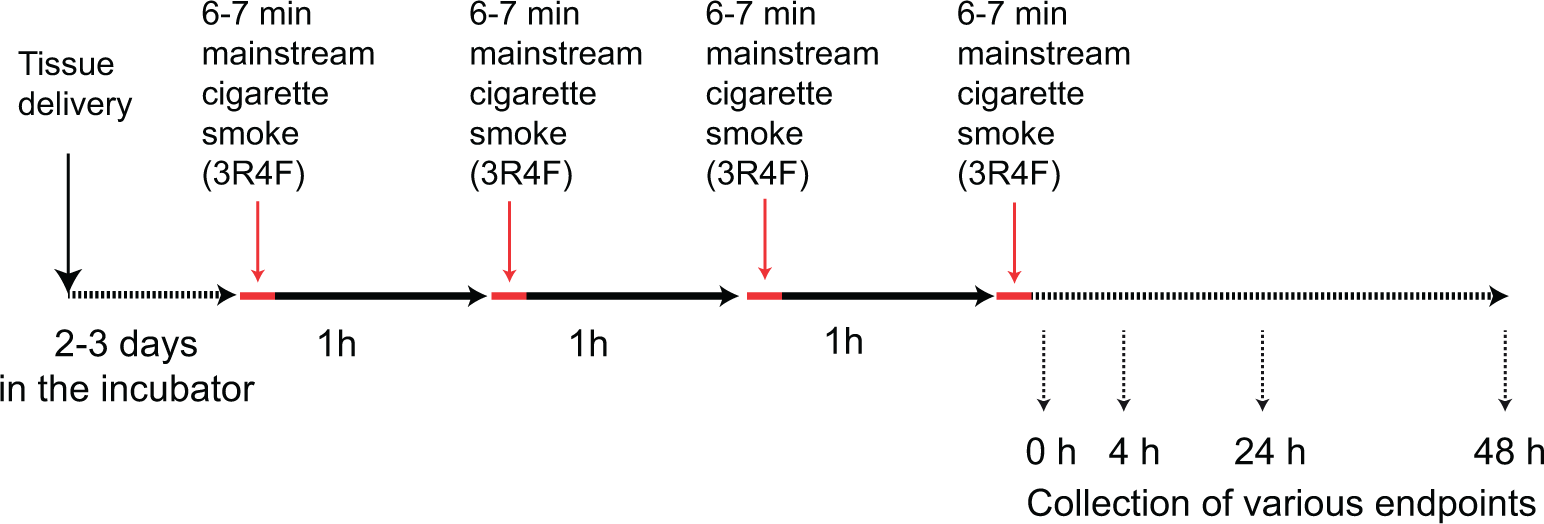
Design of the repeated whole mainstream cigarette smoke (CS) exposure of nasal and bronchial organotypic tissue cultures. Organotypic nasal and bronchial cultures were exposed repeatedly to whole CS with a one hour recovery period between exposures. The cultures were analyzed for gene expression changes immediately (0), 4, 24, and 48 hours after CS exposure, for histology at 24 hours and for cytokine secretion at 24 hours after the last CS exposure.
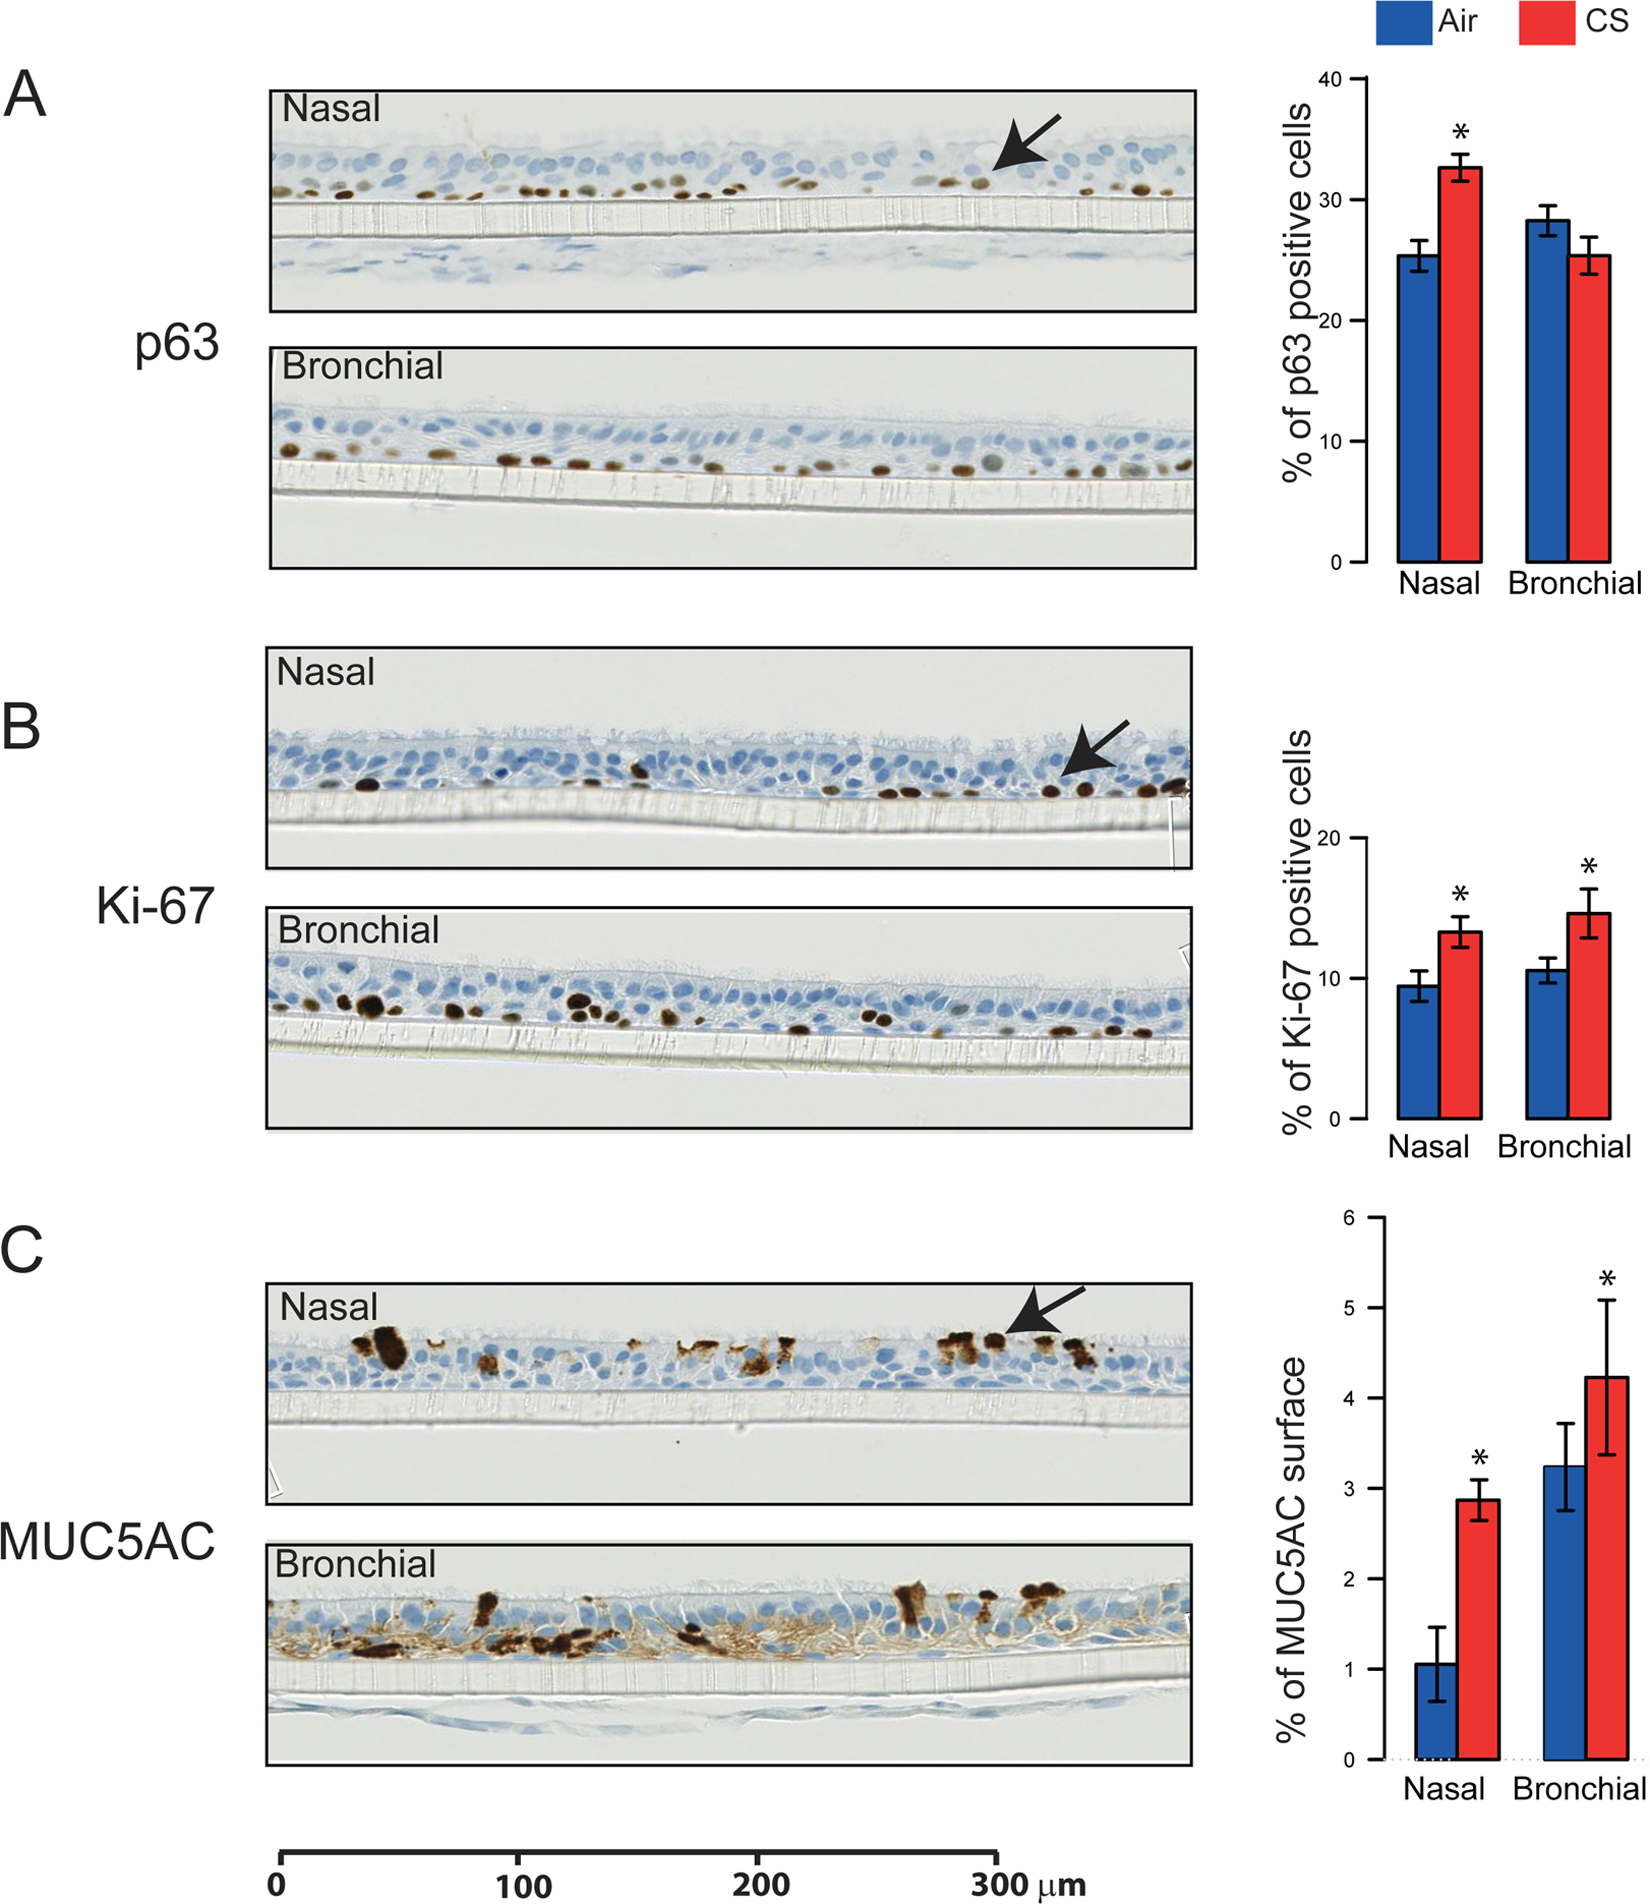
Histology and staining of specific cell types in the nasal and bronchial cultures following cigarette smoke (CS) exposure. A representative section of nasal (top) and bronchial (bottom) cultures 48 hours after the last CS exposure stained for p63 (A), Ki-67 (B), and MUC5AC (C). Arrows indicate the positively stained cells. Quantification of the staining as a percentage (median ± standard error of the median) of all nuclei in the tissue sections for p63 and Ki-67 (percentage of stained nuclei), and the area occupied by positive cells for MUC5AC is shown on the right. * indicates a statistically significant difference between the median of the CS group beneath it and the median of the air group for the same tissue. The Wilcoxon rank-sum test calculated the significance level as 5%.
Histology and Staining of Specific Cell Types Following Smoke Exposure
To detect changes in the composition of the nasal and bronchial organotypic tissue cultures, we identified basal cells, the fraction of proliferating cells, and mucus-producing cells by immunostaining at 48 hours after the last CS exposure. Histological examination of the stained organotypic tissue cultures demonstrated a remarkable similarity in the nasal and bronchial cultures with the nuclei of the epithelial cells positioned at different levels, giving the impression of cellular stratification, which is characteristic of this pseudostratified epithelium also in vivo (Figure 2). There was a small but significant increase in the number of p63-stained (basal) cells in nasal epithelial cultures (Figure 2A) and a small nonsignificant decrease in the number of p63-stained cells in the bronchial cultures 48 hours after the last exposure. There was also a small but significant increase in the number of Ki-67-stained cells in both bronchial and nasal cultures at the same time point (Figure 2B).
Bronchial and nasal epithelial cultures exposed to CS showed an increased production of MUC5AC, which is secreted by goblet cells in the airway epithelium (Figure 2C). Although the proportions of basal cells and proliferating cells were relatively equal in the nasal and bronchial cultures, nasal tissue produced less MUC5AC in the absence of smoke exposure. By contrast, the small increase observed in the area stained with Alcian blue, which marks acidic glycans and is considered a marker for goblet cells, was not significant in CS-exposed nasal and bronchial tissue cultures (data not shown). In summary, CS exposure resulted in very small changes in cellular distribution in the organotypic nasal and bronchial cultures.
Secretion of Inflammatory Mediators From CS-Exposed Nasal and Bronchial Organotypic Tissue Cultures
We also measured several inflammatory mediators in the culture medium of bronchial and nasal organotypic tissue cultures at the 24 hours postexposure time point. The observed changes in the cytokine secretion (MMP-1, IL-8, VEGF, G-CSF, MCP-1, GM-CSF, and IP-10) supported a viable innate immune response to CS exposure in these organotypic cultures (Supplementary Figure 3).
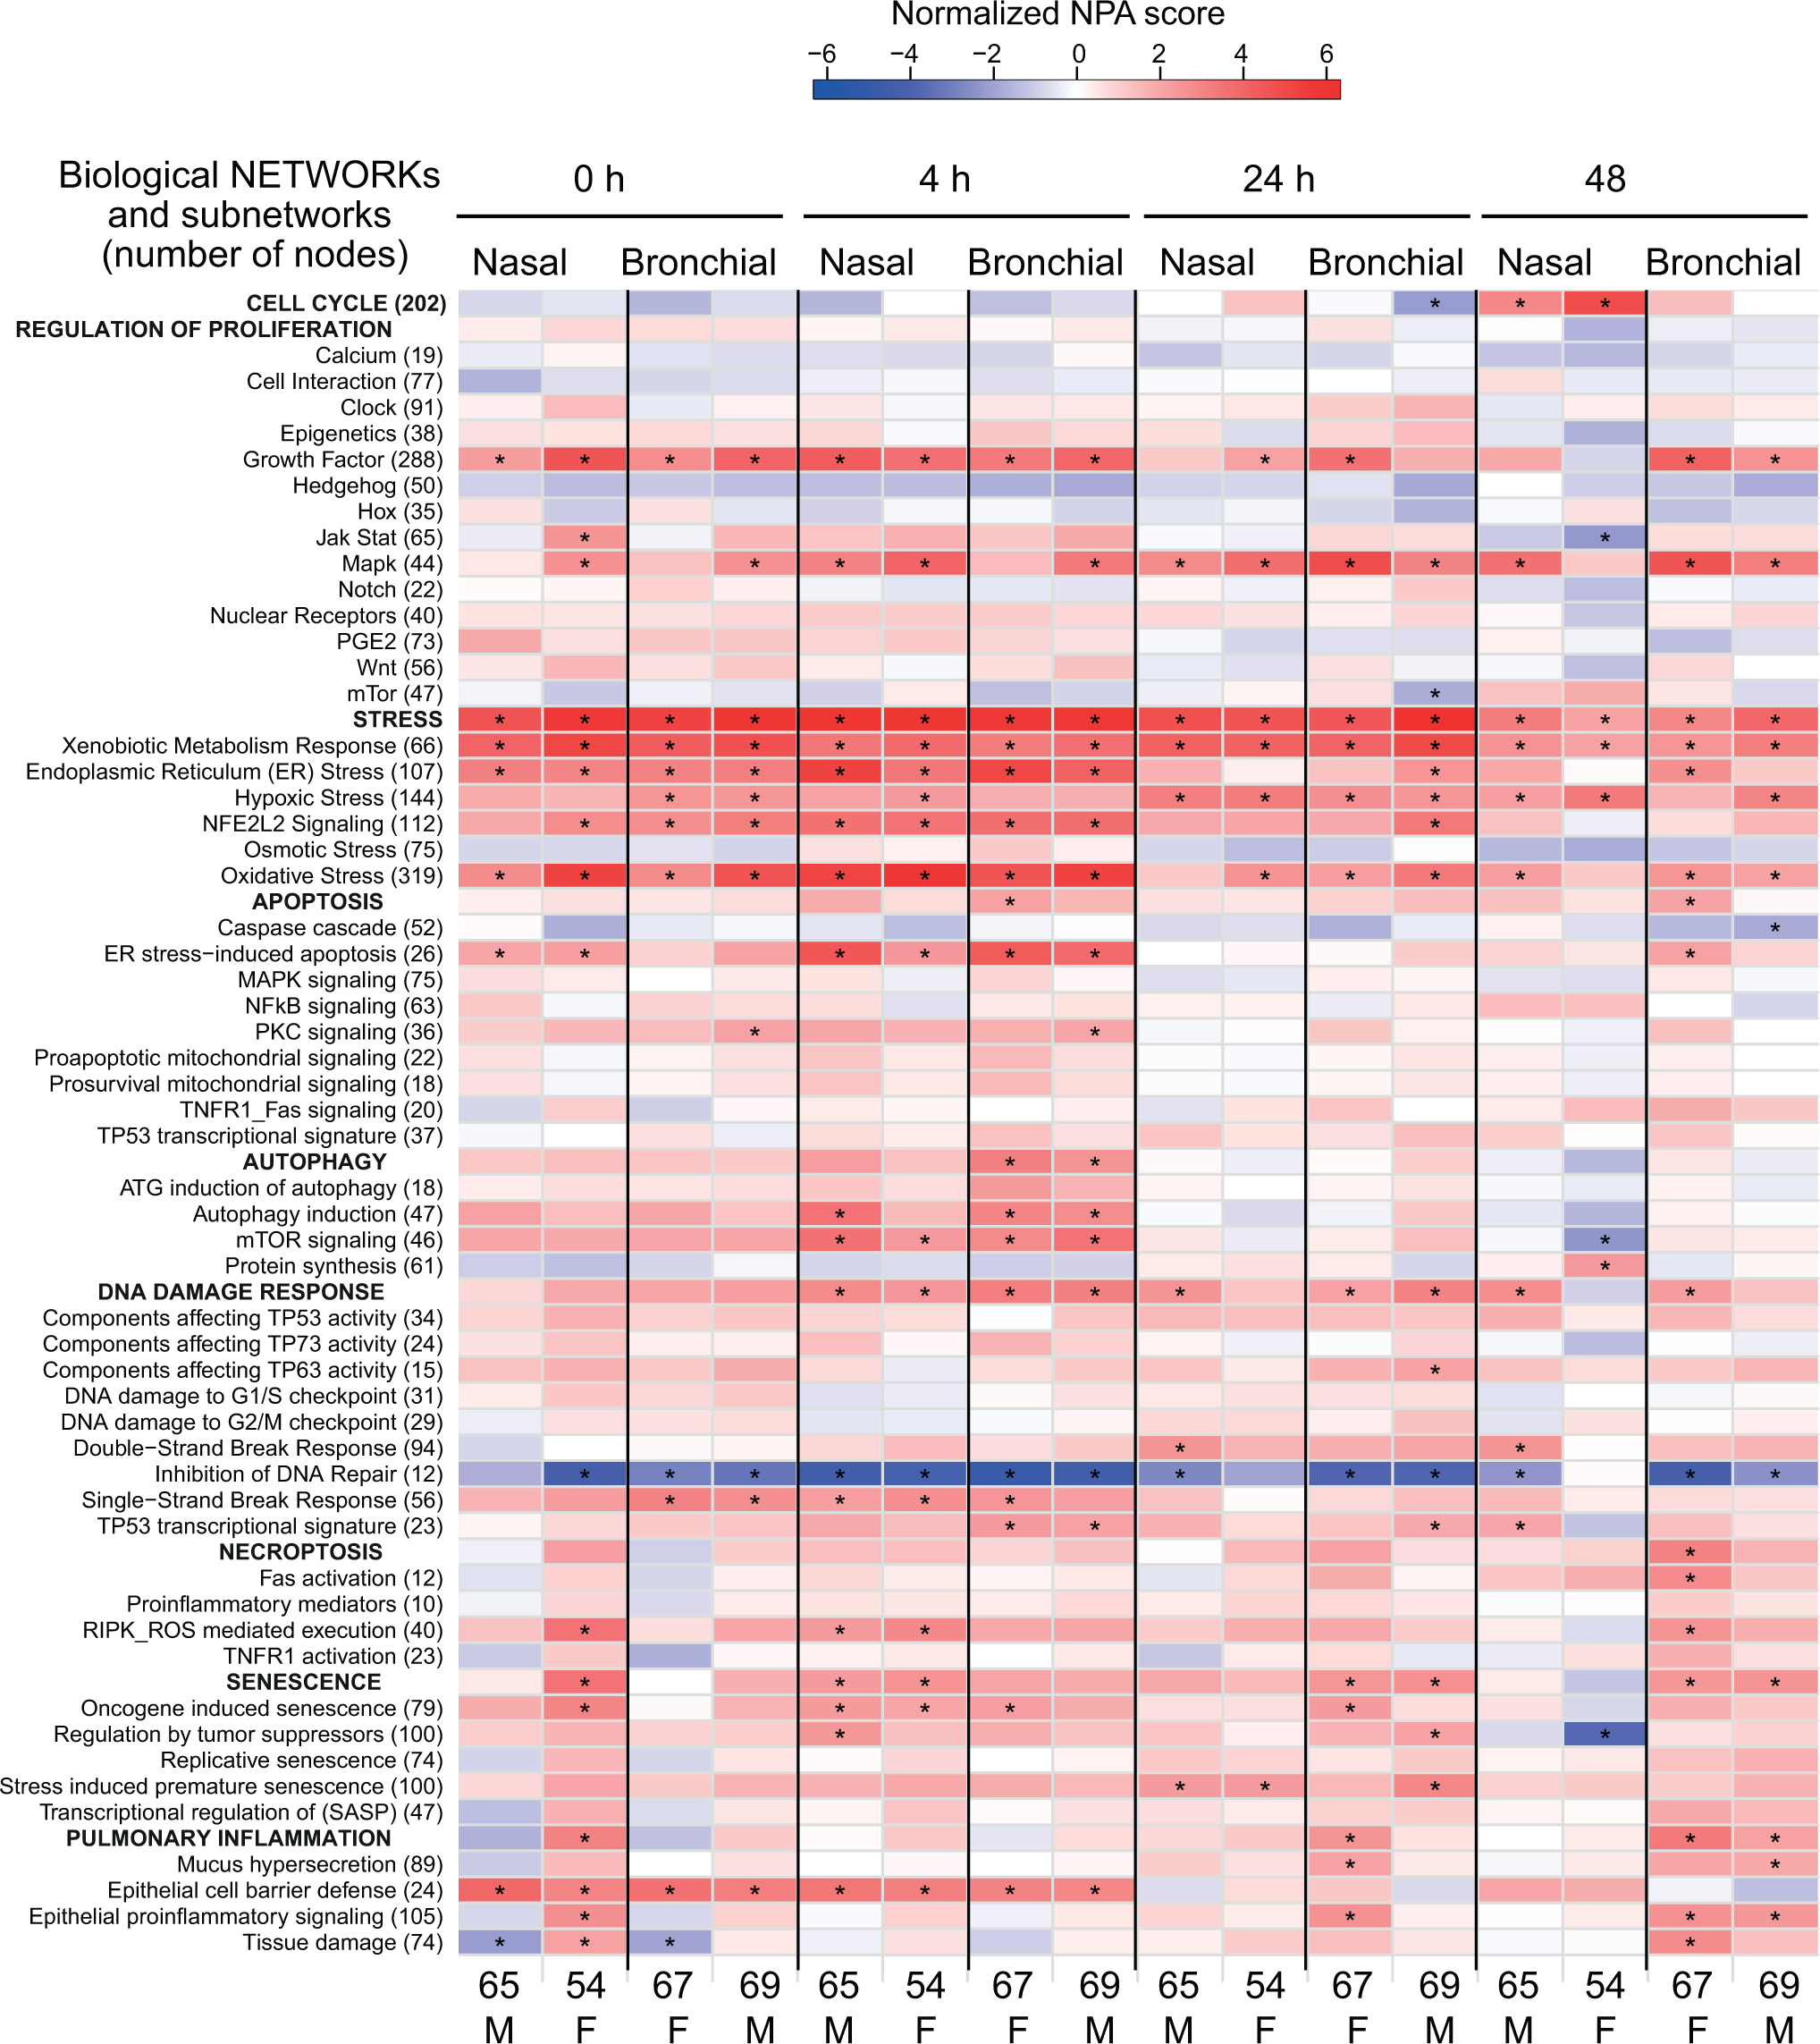
Network perturbation in the nasal and bronchial cultures in response to whole cigarette smoke (CS) exposure. The heat map shows the perturbation of the biological networks and subnetworks at each postexposure time point in nasal and bronchial organotypic tissue cultures in response to CS exposure. The biological networks (uppercase) and their respective subnetworks with the number of nodes in each network (in parenthesis) are listed on the left. Shown are the results from two independent experiments conducted on the tissue cultures from different donors (current study and study of Iskandar et al 33 ). The colors of the heat map indicate the normalized network perturbation amplitudes (NPA) score with blue for a negative and red for a positive normalized NPA score. Normalized NPA score takes into account both the magnitude of network perturbation and the specificity statistics (asterisk, see “Quantification of network perturbation amplitudes” in “Materials and Methods” section ) and enable fair comparisons of the perturbation amplitudes across subnetworks of unequal sizes. Donor’s age and gender are indicated for each tissue for each experiment below the heat map. ER indicates endoplasmic reticulum; RIPK, receptor-interacting serine–threonine kinase; F, female; M, male; SASP, senescence-associated secretory phenotype.
Network-Based Transcriptomic Analysis of CS-Exposed Nasal and Bronchial Organotypic Tissue Cultures
We next analyzed the changes in gene expression profiles in the CS-exposed bronchial and nasal tissue cultures at different postexposure time points. To pinpoint the robust changes in the organotypic cultures exposed to CS, we have compared the gene expression profiles from the current and the previous whole CS exposure study (E-MTAB-1721). 33 Supplementary Figure 4 shows the comparison of the two experiments and reveals a similar pattern of differentially expressed genes at 4 and 24 hours postexposure time points.
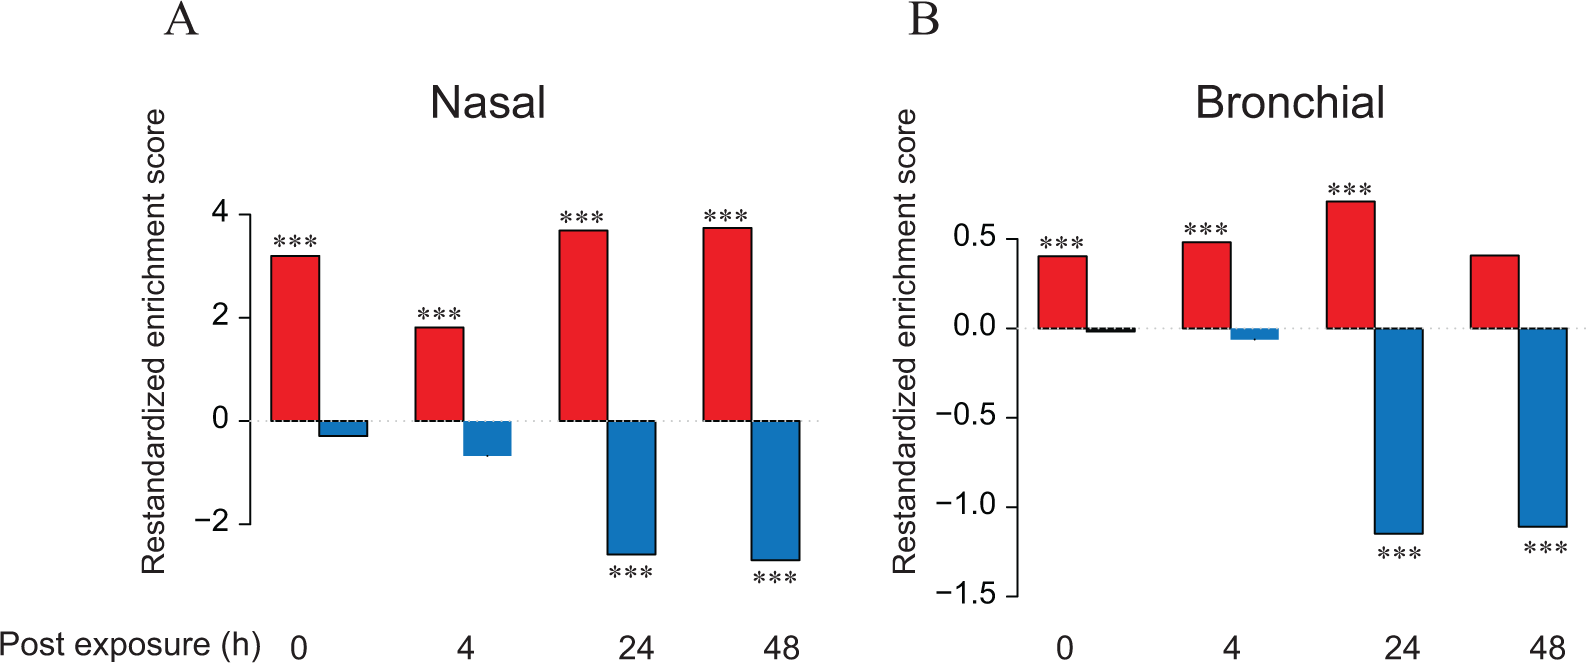
The differentially expressed genes in the human smoker bronchial and nasal epithelial cells that were enriched in the bronchial and nasal organotypic tissue cultures exposed to whole smoke. Comparison of cigarette smoke exposure response in vivo (GSE16008) and in vitro in nasal (A) and bronchial (B) tissue cultures. Red and blue bars denote restandardized enrichment score for the up- or downregulated genes, respectively, from the human samples in our in vitro organotypic nasal and bronchial tissue cultures. Restandardized enrichment score is the maximum mean statistics standardized by the gene-wise mean and standard deviation (Efron et al 48 ). ***False discovery rate (FDR) 0.001.
We used appropriate cell type-specific network models 50 -53 and quantitative algorithms to assess which biological processes were most perturbed in the nasal and bronchial cultures at each postexposure time point. 54,56 Although the network models were built to represent lung context, we believe that they can capture many perturbations also in cells derived from the nasal epithelium as previously shown for xenobiotic metabolism response. 31
Although the cellular staining suggested that nasal and bronchial tissue cultures were only mildly affected by repeated whole CS exposure (Figure 2), the analysis of transcriptomic data showed that whole CS exposure had a clear impact on biological networks in both nasal and bronchial cultures. Figure 3 shows the biological processes that were perturbed in CS-exposed tissue cultures compared with air-exposed tissue cultures at different postexposure time points in the current and the previous whole CS exposure study (E-MTAB-1721). 31
Growth factor and mitogen-activated protein kinase (MAPK) signaling, modeled as regulators of proliferation and described previously, 52 were activated with a slight shift in timing during recovery in both studies. The cellular stress response clearly dominated in both tissue cultures throughout the postexposure period, and as expected, the result of a xenobiotic metabolism response, endoplasmic reticulum (ER) stress, nuclear factor (erythroid-derived 2)-like 2 signaling, and oxidative stress. 51 The ER stress-induced apoptosis 50 coincided with and was reproducibly perturbed in both studies, and mammalian target of rapamycin signaling modeled under autophagy appeared perturbed in both nasal and bronchial tissues at 4 hours after exposure. DNA repair was inhibited in both tissues consistently at early postexposure time points but remained perturbed only in the bronchial tissue at late postexposure time points. Although the perturbation of the inflammatory network 53 as a whole failed to reach significance in CS-exposed tissue cultures, some individual processes were predicted to be activated based on the transcriptomic profile. These included the epithelial barrier defense both immediately and at 4 hours after CS exposure (Figure 3). Although cell cycle became activated in the nasal cultures at 48 hours after exposure, bronchial cultures reproducibly showed the activation of epithelial proinflammatory signaling at this postexposure time point (Figure 3).
Differentially Expressed Genes in Human Smoker Nasal and Bronchial Epithelial Cells Were Enriched in Nasal and Bronchial Organotypic Tissue Cultures Exposed to Whole CS
To probe the similarities between the responses of the two organotypic tissue cultures to CS and human nasal and bronchial brushings from smokers, we assessed the enrichment of differentially expressed genes from human samples in our in vitro culture models. Since there are not many gene expression data sets on smoker nasal epithelial cells, we decided to use a public data set (GSE16008) that contains gene expression data for both nasal and bronchial brushings. 27 In this data set, the number of differentially expressed genes from in vivo bronchial brushings was much higher than that from the nasal scrapes. We computed the restandardized enrichment score for the gene sets derived from GSE16008 in the CS-exposed in vitro bronchial and nasal tissues as shown in Figure 4. The higher gene set score for the nasal tissue is due to the very high t value of cytochrome P (CYP) 1A1. The lists of genes driving the enrichment score for the nasal and bronchial in vitro–in vivo comparisons are shown in Supplementary Table 2.
Discussion
Although the lung parenchyma and the pulmonary airways are the main focal points for examining the effects of smoking, inhaled contaminants such as CS affect the entire respiratory tract from the nasal mucosa down to the distal airways and alveolar space. As presented here, the state-of-the-art organotypic tissue culture models are a promising system to study inhalation toxicology in the upper and lower airways.
Although the cellular changes can be assessed to some extent by antibody staining of the exposed cultures or by the accumulation of secreted cytokines in the culture medium, mechanistic understanding on the impact of whole CS on the organotypic cultures calls for a systems approach, such as gene expression profiling. Unlike traditional pathway analysis often used to interpret gene expression data, network approach assesses the perturbation of specific mechanisms based on the differential gene expression of downstream genes that are known to be regulated by these mechanisms. 50 -53,54,55 We previously reported that the organotypic nasal and bronchial tissue cultures responded similarly to whole CS exposure in the context of the xenobiotic metabolism network. 33 Comparison of the gene expression profiling from 2 independent experiments with nasal and bronchial cultures from different donors and using a large selection of relevant biological network models, we identified several biological processes that were impacted by CS exposure. Although the toxicity measurements and morphology indicated that the whole smoke concentrations applied were well tolerated, the epithelial barrier defense was activated at early postexposure time points in both nasal and bronchial cultures. We previously demonstrated that several nodes in this network were highlighted in the bronchial brushing from smokers compared with nonsmokers. 53 Others have demonstrated that CS disturbs tight junctions in cultured lung epithelial cells 57 -59 and that the defect in barrier function is epidermal growth factor receptor dependent. 58 It is not surprising that the cellular stress response and apoptotic pathways following prolonged stress were also robustly activated, and the network model describing DNA repair was predicted to be downregulated after repeated CS exposure in the organotypic nasal and bronchial cultures. These processes have been shown to be impacted by CS in various experimental models. 27,60,61
We also identified the perturbation of growth factor and MAPK signaling at early postexposure time points in both nasal and bronchial cultures, possibly leading to an increased number of proliferating cells as also demonstrated by the staining of Ki-67-positive cells. MAPK signaling is also thought to be involved in MUC5AC secretion in normal human airway epithelial cells. 62 -65 MUC5AC is one of the major oligomeric mucins present in airway mucus and is a marker of the goblet cell population, although not all goblet cells produce MUC5AC in the nasal epithelium. 66,67 It also has a similar distribution in normal human upper and lower airways. 68 Our findings are in line with previous studies, which showed that CS stimulated MUC5AC production by lung cells. 69 -71 Using immortalized human bronchial epithelial cells differentiated into a mucociliary epithelium, Haswell et al showed that CS and acrolein increased the percentage of goblet cells in an in vitro model of human airway epithelium. 72 Exposure to CS also resulted in an increased number of goblet cells in the bronchial and nasal epithelium of rats 73 -78 and human smokers. 79 -82 Our findings are in line with observations that have been reported for human smoker bronchial and nasal brushings, where processes such as detoxification and oxidative stress are impacted as a common airway-wide response to tobacco exposure. 26,27
Although the nasal and bronchial epithelial cells were cultured in the presence of fibroblasts from the same donor, we were able to identify the unique processes that were elicited in the 2 respiratory cultures in response to whole CS exposure. The activation of epithelial proinflammatory signaling occurred transiently in the nasal cultures immediately after the last exposure and was unique to the bronchial cultures at 48-hour postexposure time point. At this late postexposure time point, the nasal cultures showed the activation of the cell cycle, which could not be detected in the bronchial cultures. These variances may be caused by subtle signaling differences between nasal and bronchial epithelial cells that were not captured in our networks, which mainly reflect lung cell biology. The nasal cells may also be primed differently because they are positioned in the human upper respiratory tract and are readily exposed to various airborne contaminants and may respond differently to direct CS exposure in an in vitro setting exposed directly to CS. This is further supported by the gene enrichment analysis that showed the enrichment of differentially expressed genes in the smoker nasal and bronchial epithelium in the in vitro cultures exposed to CS. Compared with the bronchial tissue, the gene set was much smaller for the nasal tissue, and the high enrichment score was driven by CYP1A1. It should be noted that the variability in the in vivo nasal data set was large and hence the signal weaker compared to the bronchial data set.
Although the nasal epithelium seems to mirror the pulmonary airway epithelium, 26,27 our findings may further help to understand the remaining differences between nasal and bronchial brushings in the context of CS exposure in humans. This would lead to a more accurate interpretation of the effects observed in nasal tissue and a better prediction of the CS effects in the lower respiratory tract.
The benefits of the nasal organotypic cultures presented here are numerous. Smoking is linked to nasal disease, 13,17 yet despite ample research, mechanistic understanding related to nasal tissue repair remains poor. 83 Such nasal cultures could be also used for toxicity testing of aerosols of environmental contaminants, the safety assessment of inhaled nebulizers as well as drug discovery and development. 84 Organotypic nasal cultures have already been used for nasal drug absorption studies, 85 studies on nasal colonization by Staphylococcus aureus, 86 and preventative drugs against bacterial-induced colonization. 87 For the full benefit, high-throughput molecular profiling should always be included as an end point to elucidate the biological impact beyond the cell viability and gross morphology observed by histology and to leverage the benefits of a systems approach according to the paradigms of “21st-century toxicology.” 88
For both bronchial and nasal systems, the establishment of stable cultures that can be maintained for prolonged periods would allow chronic or repeated in vitro exposures to be carried out to understand the mechanistic impact of respiratory insults, such as smoking, allergens, and repeated drug dosing. The development of even more complex culture models, such as the combination of the organotypic epithelial model with immune cells, would better mimic the inflammatory situation in the respiratory tract challenged with such stimuli. 89
A clear shortcoming with this type of study is the limited number of donors that can be tested simultaneously. It should be noted, however, that the commonly used immortalized cell lines or cancer cells represent a single biological replicate. Moreover, immortalized cells are largely phenotypically and genotypically compromised and lack many differentiated characteristics of the airway epithelium. 89 Therefore, we believe that the studies on organotypic cultures even with one or two donors, as presented here, are more relevant for toxicity testing. Further testing of the inter donor variation with such cultures is an important aspect that needs to be bear in mind when evaluating any impact that a given test substance might have.
Toxicological in vitro assessment has come a long way from simplistic cytotoxicity, 90 mouse lymphoma, 91 or Salmonella mutation 92 assays. Even single end point measurements in a relevant biological system seem inferior to the more mechanistic and global approaches necessitated by the principles of 21st Century Toxicology. 90 The state-of-the-art organotypic nasal and bronchial tissue cultures are a promising system to study inhalation toxicology; they provide a relevant alternative to animal experimentation and cells grown on a monolayer. These organotypic tissue culture models have the potential to significantly reduce or even justify the elimination of animal experimentation in the area of respiratory toxicology.
Footnotes
Acknowledgments
The authors acknowledge Sandra Wagner, Abdelkader Benyagoub, Rémi Dulize, Emmanuel Guedj, Karine Baumer, Dariusz Peric, and for technical assistance and Epithelix for the cellular staining of the organotypic tissue cultures. We would also like to acknowledge Gregory Vuillaume for statistical support and Walter K. Schlage, Anita Iskandar, and Maciej Cabanski for critical review of the manuscript.
Author Contributions
Talikka contributed to interpretation, drafted the manuscript, critically revised the manuscript, gave final approval, and agrees to be accountable for all aspects of work ensuring integrity and accuracy. Kostadinova contributed to design, analysis, and interpretation, drafted the manuscript, critically revised the manuscript, gave final approval, and agrees to be accountable for all aspects of work ensuring integrity and accuracy. Xiang contributed to design and analysis, critically revised the manuscript, and gave final approval. Mathis contributed to design, interpretation, critically revised the manuscript, and gave final approval. Sewer contributed to design and analysis, critically revised the manuscript, and gave final approval. Majeed contributed to acquisition, critically revised the manuscript, and gave final approval. Kuehn contributed to acquisition and analysis, critically revised the manuscript, and gave final approval. Frentzel contributed to interpretation, critically revised the manuscript, and gave final approval. Merg contributed to acquisition and analysis, critically revised the manuscript, and gave final approval. Geertz contributed to acquisition and analysis, critically revised the manuscript, and gave final approval. Martin contributed to design and analysis, critically revised the manuscript, and gave final approval. Ivanov contributed to acquisition, critically revised the manuscript, and gave final approval. Peitsch contributed to conception, critically revised the manuscript, and gave final approval. Hoeng contributed to conception, design and interpretation, critically revised the manuscript, and gave final approval.
Authors’ Note
Marja Talikka and Radina Kostadinova contributed equally.
Declaration of Conflicting Interests
The author(s) declared no potential conflicts of interest with respect to the research, authorship, and/or publication of this article.
Funding
The author(s) disclosed receipt of the following financial support for the research, authorship, and/or publication of this article: This work was funded by Philip Morris International.
References
Supplementary Material
Please find the following supplemental material available below.
For Open Access articles published under a Creative Commons License, all supplemental material carries the same license as the article it is associated with.
For non-Open Access articles published, all supplemental material carries a non-exclusive license, and permission requests for re-use of supplemental material or any part of supplemental material shall be sent directly to the copyright owner as specified in the copyright notice associated with the article.