
Abstract
The cytotoxic effects of 4 industrially important chlorinated organic solvents, dichloromethane (DCM), 1,2-dichloroethane (DCE), trichloroethylene (TCE), and tetrachloroethylene (PERC) in vitro, were investigated. Jurkat T cells were exposed to the solvents individually for 72 hours and changes in reactive oxygen species (ROS) formation, cell proliferation, intracellular free calcium concentration ([Ca2+]), and caspase-3 activity were measured. There was a concentration-dependent increase in the ROS formation and intracellular free [Ca2+] following exposure to each of the solvents. This was accompanied by a decrease in the cell proliferation. Solvent potency decreased in the following order: PERC > TCE > DCM > DCE. Caspase-3 activity was increased in a concentration-dependent manner by TCE and PERC but was not significantly altered by DCM or DCE. n-Acetyl-
Introduction
Chlorinated organic solvents are widely used as dry cleaning, metal-degreasing agents and also in industrial processes and so have become major environmental contaminants. 1 Dichloromethane (DCM), 1,2-dichloroethane (DCE), trichloroethylene (TCE), and tetrachloroethylene (PERC) are 4 commonly used chlorinated solvents and are listed in the 33 priority hazardous air pollutants in the US Environmental Protection Agency’s Integrated Urban Air Toxics Strategy. 2 Exposure is likely through occupational use, but the presence of these chlorinated solvents in the ambient air will result in exposure of the general population, particularly in urban areas. 3 The DCM is also present in consumer products such as paint strippers, hairspray aerosols, and room deodorants, and so there is potential for low-level exposure from indoor use of such products.
Like their nonchlorinated counterparts, chlorinated solvents are known to have general effects on the central nervous system. However, they also have specific effects including liver, kidney, and reproductive toxicity and carcinogenicity.4–6 Both TCE and PERC are classified as group 2A carcinogens by the International Agency for Research on Cancer, 7 while DCE and DCM are group 2B carcinogens. A recent study has also linked TCE to the development of Parkinson disease. 8
These compounds have been studied for many years due to their widespread use and their carcinogenic properties. A number of in vivo and in vitro studies have shown the potential for volatile organic solvents to adversely affect the immune system.9–11 Although there are few data to date regarding the impact of exposure to chlorinated organic solvents on the human immune system, a recent study suggested that even low concentrations of TCE and PERC may affect the immune response, and exposure may accelerate the increase of allergic diseases. 1 Chronic occupational and environmental exposure to TCE has been implicated in the development of some autoimmune diseases including systemic lupus erythematosus and systemic sclerosis.12,13
Reactive oxygen species (ROS) play a role in a number of cellular processes from apoptosis and necrosis to cell proliferation and carcinogenesis. 14 The biological consequences of oxidative stress in an organism exceeding background levels can have effects on apoptosis and cell proliferation, contributing to the pathophysiology of a number of diseases, including cancer. 15 Previous studies have shown that solvent exposure results in ROS formation in vitro.16–18 Cells undergo apoptosis during the normal cell cycle, but it can also be initiated by a number of different stimuli, including oxidative stress, ionizing radiation, and chemical treatment. Previous studies have shown that activation of the caspase cascade is involved in chemical- and agent-induced apoptosis. 19 It is well established that intracellular Ca2+ regulates many physiological cellular processes as well as initiates pathological events such as cell injury and death. 20 Ca2+ homeostasis is tightly regulated by numerous channels, stores, and pumps, and disruption of this can be damaging to the cell. 21 It has also been suggested that there is a close connection between the intracellular Ca2+ signaling and the formation and action of ROS. 22
To test this proposal and because both Ca2+ signaling and apoptosis lead to cell death, albeit by different mechanisms, we examined the potential toxicity of DCM, DCE, TCE, and PERC in Jurkat T cells using ROS formation, intracellular free calcium concentration ([Ca2+]), caspase-3 activity, and cell proliferation as biochemical endpoints. A validated system was used to expose cells to the 4 chlorinated solvents individually for 72 hours.
23
The antioxidant n-acetyl-
Materials and Methods
Chemicals and Reagents
2′,7′-Dichlorodihydrofluorescein diacetate (DCFH-DA) and Fura-2-acetoxymethyl ester (AM) were from Molecular Probes (Leiden, the Netherlands). Aluminum crimp caps, caspase-3 assay kit, dimethyl sulfoxide (DMSO), fetal bovine serum (FBS), 20 mL glass headspace vials,
Preparation of Stock Solutions
Stock solutions were made up on a gravimetric basis using glass chromatography vials (2.0 mL). The vial was filled with methanol and the desired volume of solvent. Both additions were determined gravimetrically. The vials were immediately sealed with a Teflon-faced butyl rubber septum and aluminum cap. The tightness of the seal was checked manually. Stocks were stored at room temperature (18-20°C) for a maximum of 1 month.
Cell Culture and Exposure Protocol
Jurkat E6.1 cells were cultured in RPMI-1640, supplemented with 10% FBS, 1%
Headspace Gas Chromatography
Headspace gas chromatography was used to determine the equilibrium gas (CG)-phase solvent concentration in the exposure vessels. 23 Solvent levels were measured at the beginning and following 72 hours of exposure.
Calculation of Medium/Air Partition Coefficient
Medium/air partition coefficients (K) for DCM, DCE, TCE, and PERC were determined according to the method described by McIntosh and Heffron 24 and McDermott et al. 23 The partition coefficients were determined over concentration ranges used in this study. Equilibrium liquid-phase solvent concentrations were calculated based on these medium/air partition coefficient values. The coefficients were PERC 2.83, TCE 4.02, DCM 8.72, and DCE 15.8.
The ROS Fluorimetry
Following 72 hours of solvent exposure, total formation of ROS by the cells was estimated using DCFH-DA. Jurkat T cells were suspended in phosphate-buffered saline (PBS, pH 7.4), loaded with DCFH-DA (10 μmol/L) for 40 minutes at 37°C, washed twice in PBS, and resuspended in RPMI-1640 culture medium. Fluorescence due to oxidized dye (excitation at 485 nm and emission at 535 nm) was measured using a Tecan Infinite M200 plate reader and Tecan i-Control software (Unitech Ltd, Dublin, Ireland). 2′,7′-Dichlorofluorescein (DCF) fluorescence was normalized to controls using corresponding resazurin reduction data.
Resazurin Proliferation Assay
Reduction of the redox dye resazurin to resorufin was used to measure the proliferation of cell cultures. 25 After solvent exposure, resazurin (final concentration 44 μmol/L) was added to cell suspensions, and resorufin formation was measured fluorometrically at 560 and 590 nm using a Tecan Infinite M200 plate reader and Tecan i-Control software.
Measurement of Intracellular-Free [Ca2+]
Following 72 hours of exposure, the cells were washed twice in PBS and resuspended in physiological buffer (pH 7.4) containing (in mmol/L), NaCl 115, KCl 5, NaHCO3 10, Hepes 25, MgCl2 0.5, CaCl2 1, and glucose 5.6. Fura-2AM (from a 1-mmol/L stock in DMSO) of 3 μmol/L was added to the cell suspension and then incubated for 30 minutes at 37°C, protected from light to prevent photobleaching. The cells were then centrifuged, washed in PBS, and resuspended to 1 × 10⁶ cells/mL in physiological buffer for the measurement of dye fluorescence.
Fluorescence intensity of Fura-2 loaded cells was measured using a Cary Eclipse fluorescence spectrometer (Agilent Technologies Ireland Ltd, Cork, Ireland), with excitation at 340 and 380 nm and emission at 510 nm. To correct for dye leakage, 50 μmol/L MnCl2 was added to the cuvette immediately before measuring the fluorescence ratio. 26
Caspase-3 Activity
Caspase-3 activity was measured using a fluorimetric caspase-3 assay kit (Sigma Aldrich Ltd, Dublin, Ireland). Sample preparation and measurement were carried out according to the manufacturer’s instructions. Briefly, following exposure, Jurkat T cells were pelleted and washed with PBS by centrifugation at 600g for 5 minutes at 4°C. The cell pellet was then resuspended in 1× lysis buffer at a concentration of 1 × 10⁶ cells/50 µL and incubated on ice for 30 minutes. Samples were centrifuged at 13 000g for 15 minutes at 4°C. Supernatant of 5 µL was added to 200 µL of reaction mixture in a 96-well plate. Inhibitor-treated lysate controls were also included to determine the nonspecific hydrolysis of the substrate. Plates were incubated at room temperature protected from light for 1 hour. Fluorescence was measured at 360 nm excitation and 460 nm emission using a Tecan Infinite M200 plate reader and Tecan i-Control software. Values are given as percentage of control.
Statistical Analysis
Results are expressed as mean ± standard deviation. Data were analyzed using one-way analysis of variance with the Tukey-Kramer multiple comparisons test or unpaired t-test, using Graphpad Instat software (GraphPad Software Inc., San Diego, California). Significance levels were defined as P < 0.05 (*), P < 0.01 (**), and P < 0.001 (***).
Results
Jurkat T cells were exposed to DCM (178-1426 µmol/L), DCE (177-1417 µmol/L), TCE (40-520 µmol/L), or PERC (13-257 µmol/L) for 72 hours. The ability of these chlorinated solvents in increased ROS formation was assessed using the fluorescent dye DCFH-DA. There was a concentration-dependent increase in DCF fluorescence in Jurkat T cells following exposure to each of the solvents (Figure 1). Jurkat T cells treated with the vehicle (methanol) for the same duration showed no significant change in DCF fluorescence (data not shown). Solvent potency in terms of lowest observed-adverse-effect levels was found to be PERC > TCE > DCM > DCE. The rank order of solvent hydrophobicity as predicted by octanol water partition coefficients for each of the solvents (3.40, 2.40, 2.0, and 1.48 for PERC, TCE, DCM, and DCE, respectively) corresponds to the rank order seen here.
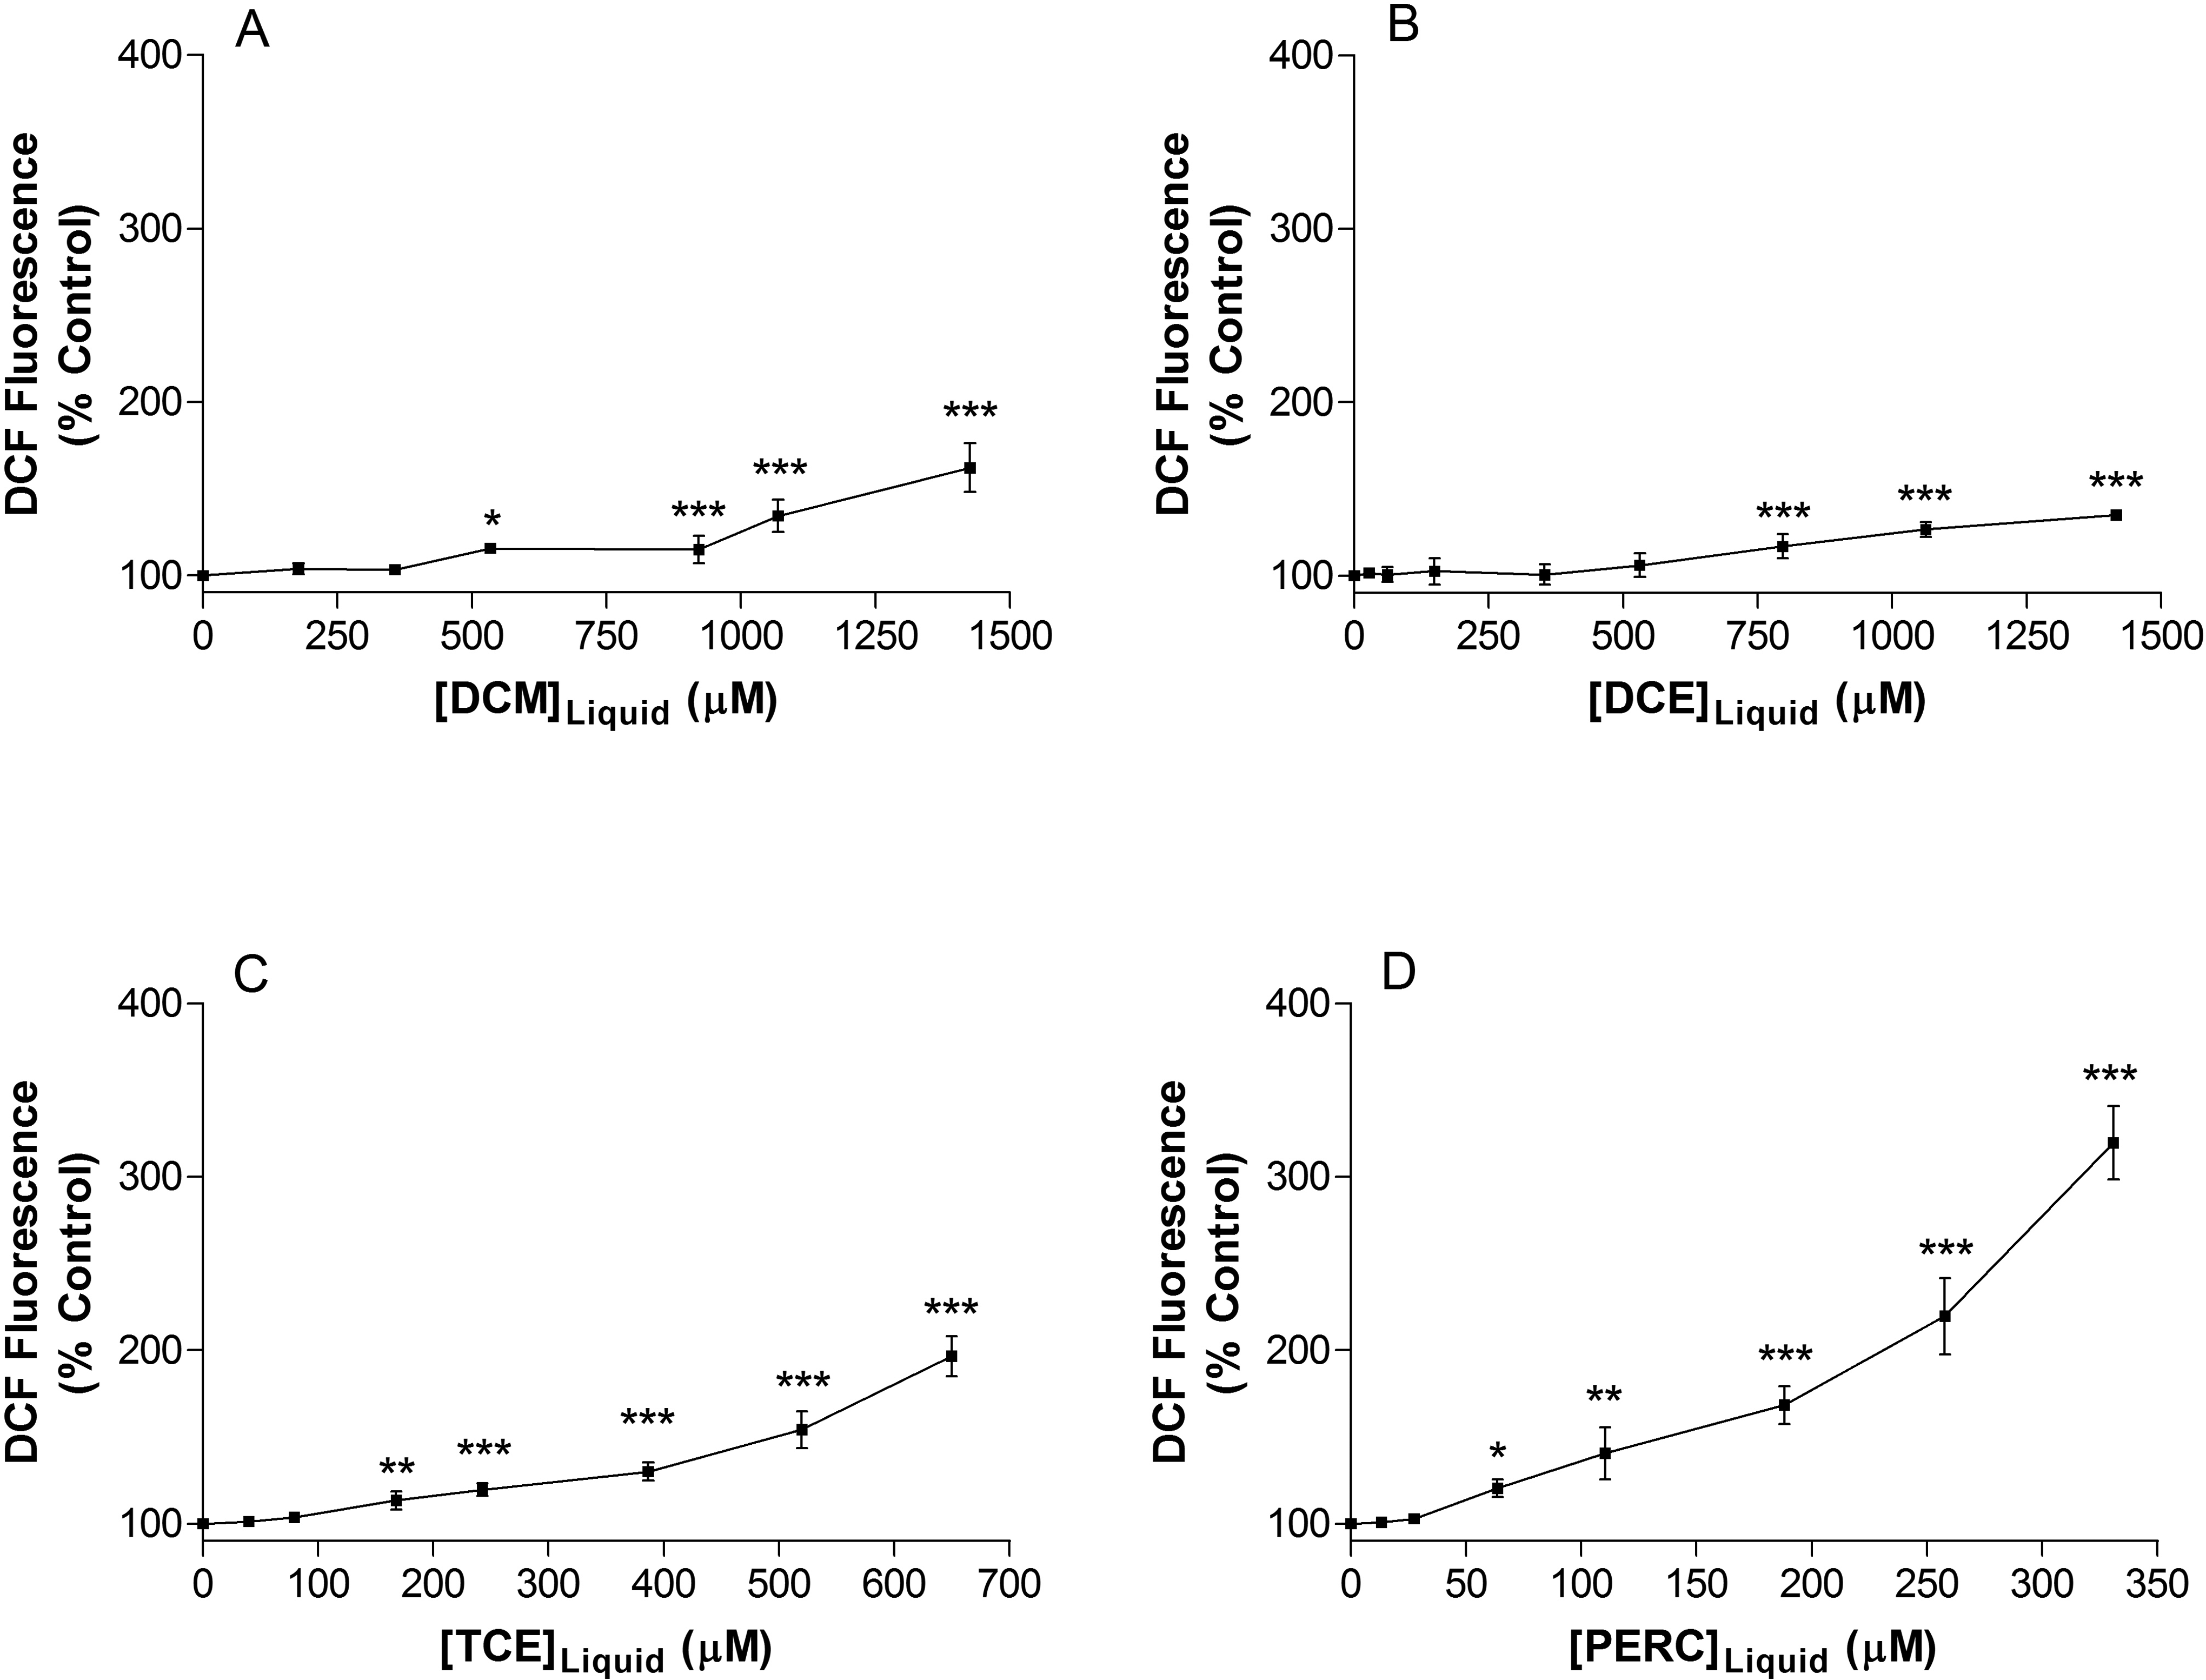
Increased reactive oxygen species formation in Jurkat T cells following 3 days exposure to (A) dichloromethane, (B) 1,2-dichloroethane, (C) trichloroethylene, and (D) tetrachloroethylene. Data are expressed as mean ± standard deviation of 5 determinations. Significance levels were defined as P < 0.05 (*), P < 0.01 (**), and P < 0.001 (***).
Evaluation of Cell Proliferation Following Solvent Exposure
The effect of chlorinated solvent exposure on cell proliferation was assessed using the resazurin reduction assay which measures the ability of the cells to reduce resazurin to highly fluorescent resorufin. Exposure to the vehicle (methanol) did not significantly alter Jurkat T cell proliferation (data not shown). Following 72 hours of exposure to DCM, DCE, TCE, and PERC, there was a concentration-dependent decrease in Jurkat T-cell proliferation (Figure 2). Again the rank order of solvent toxicity was PERC > TCE > DCM ∼ DCE.
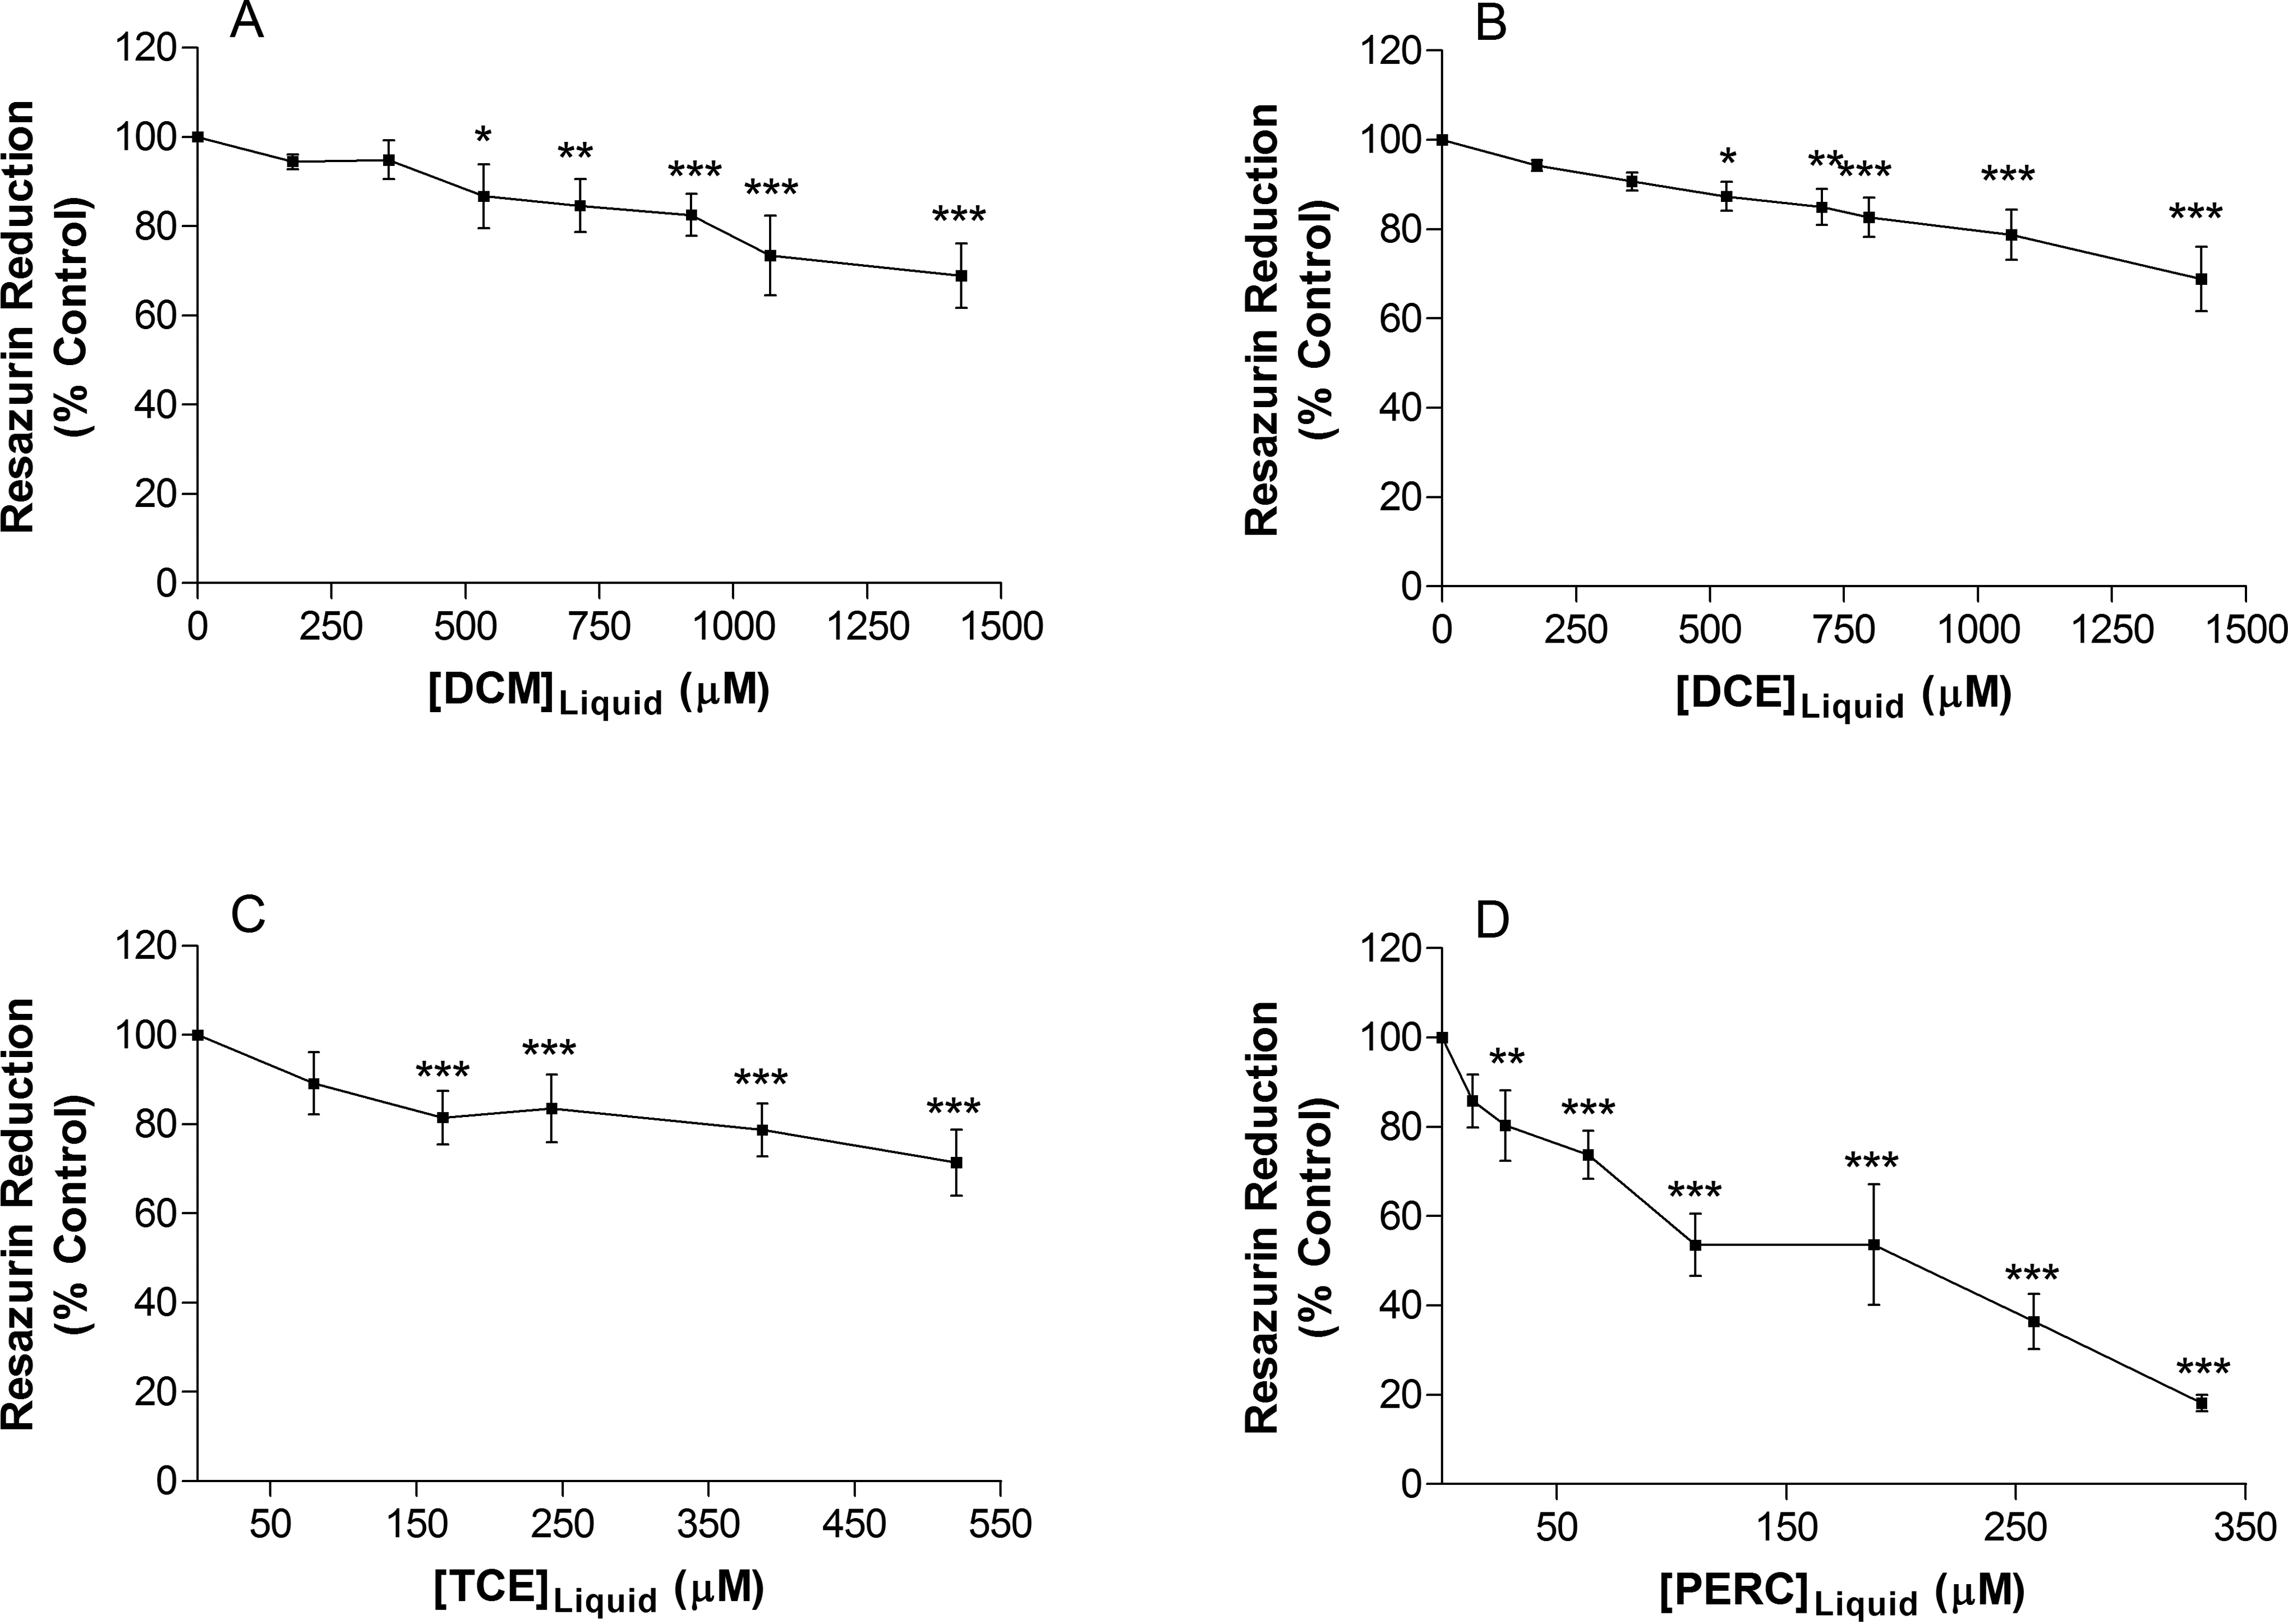
Exposure to (A) dichloromethane, (B) 1,2-dichloroethane, (C) trichloroethylene, and (D) tetrachloroethylene decreases resazurin reduction in Jurkat T cells after 3 days exposure, indicating a decrease in cell proliferation. Data are expressed as mean ± standard deviation of 4 determinations. Significance levels were defined as P < 0.05 (*), P < 0.01 (**), and P < 0.001 (***).
Changes in Intracellular Free [Ca2+] Following Solvent Exposure
We previously found that exposure to some organic solvents including tolune, n-hexane, and methyl ethyl ketone can result in increased intracellular free [Ca2+], 10 and so to determine whether the chlorinated solvents used in this study produced a similar effect, 2 concentrations of each solvent were selected which produced significant effects in terms of the other end points measured. These solvent concentrations were assessed for their ability to increase the intracellular free [Ca2+]. Solvent exposure resulted in leakage of Fura-2 from loaded cells, and so Mn2+ was added to quench extracellular fluorescence. All solvent concentrations studied produced a significant increase in the intracellular free [Ca2+] (Figure 3). Methanol exposure (10 µL) did not significantly alter intracellular free [Ca2+] (P > 0.05; data not shown).
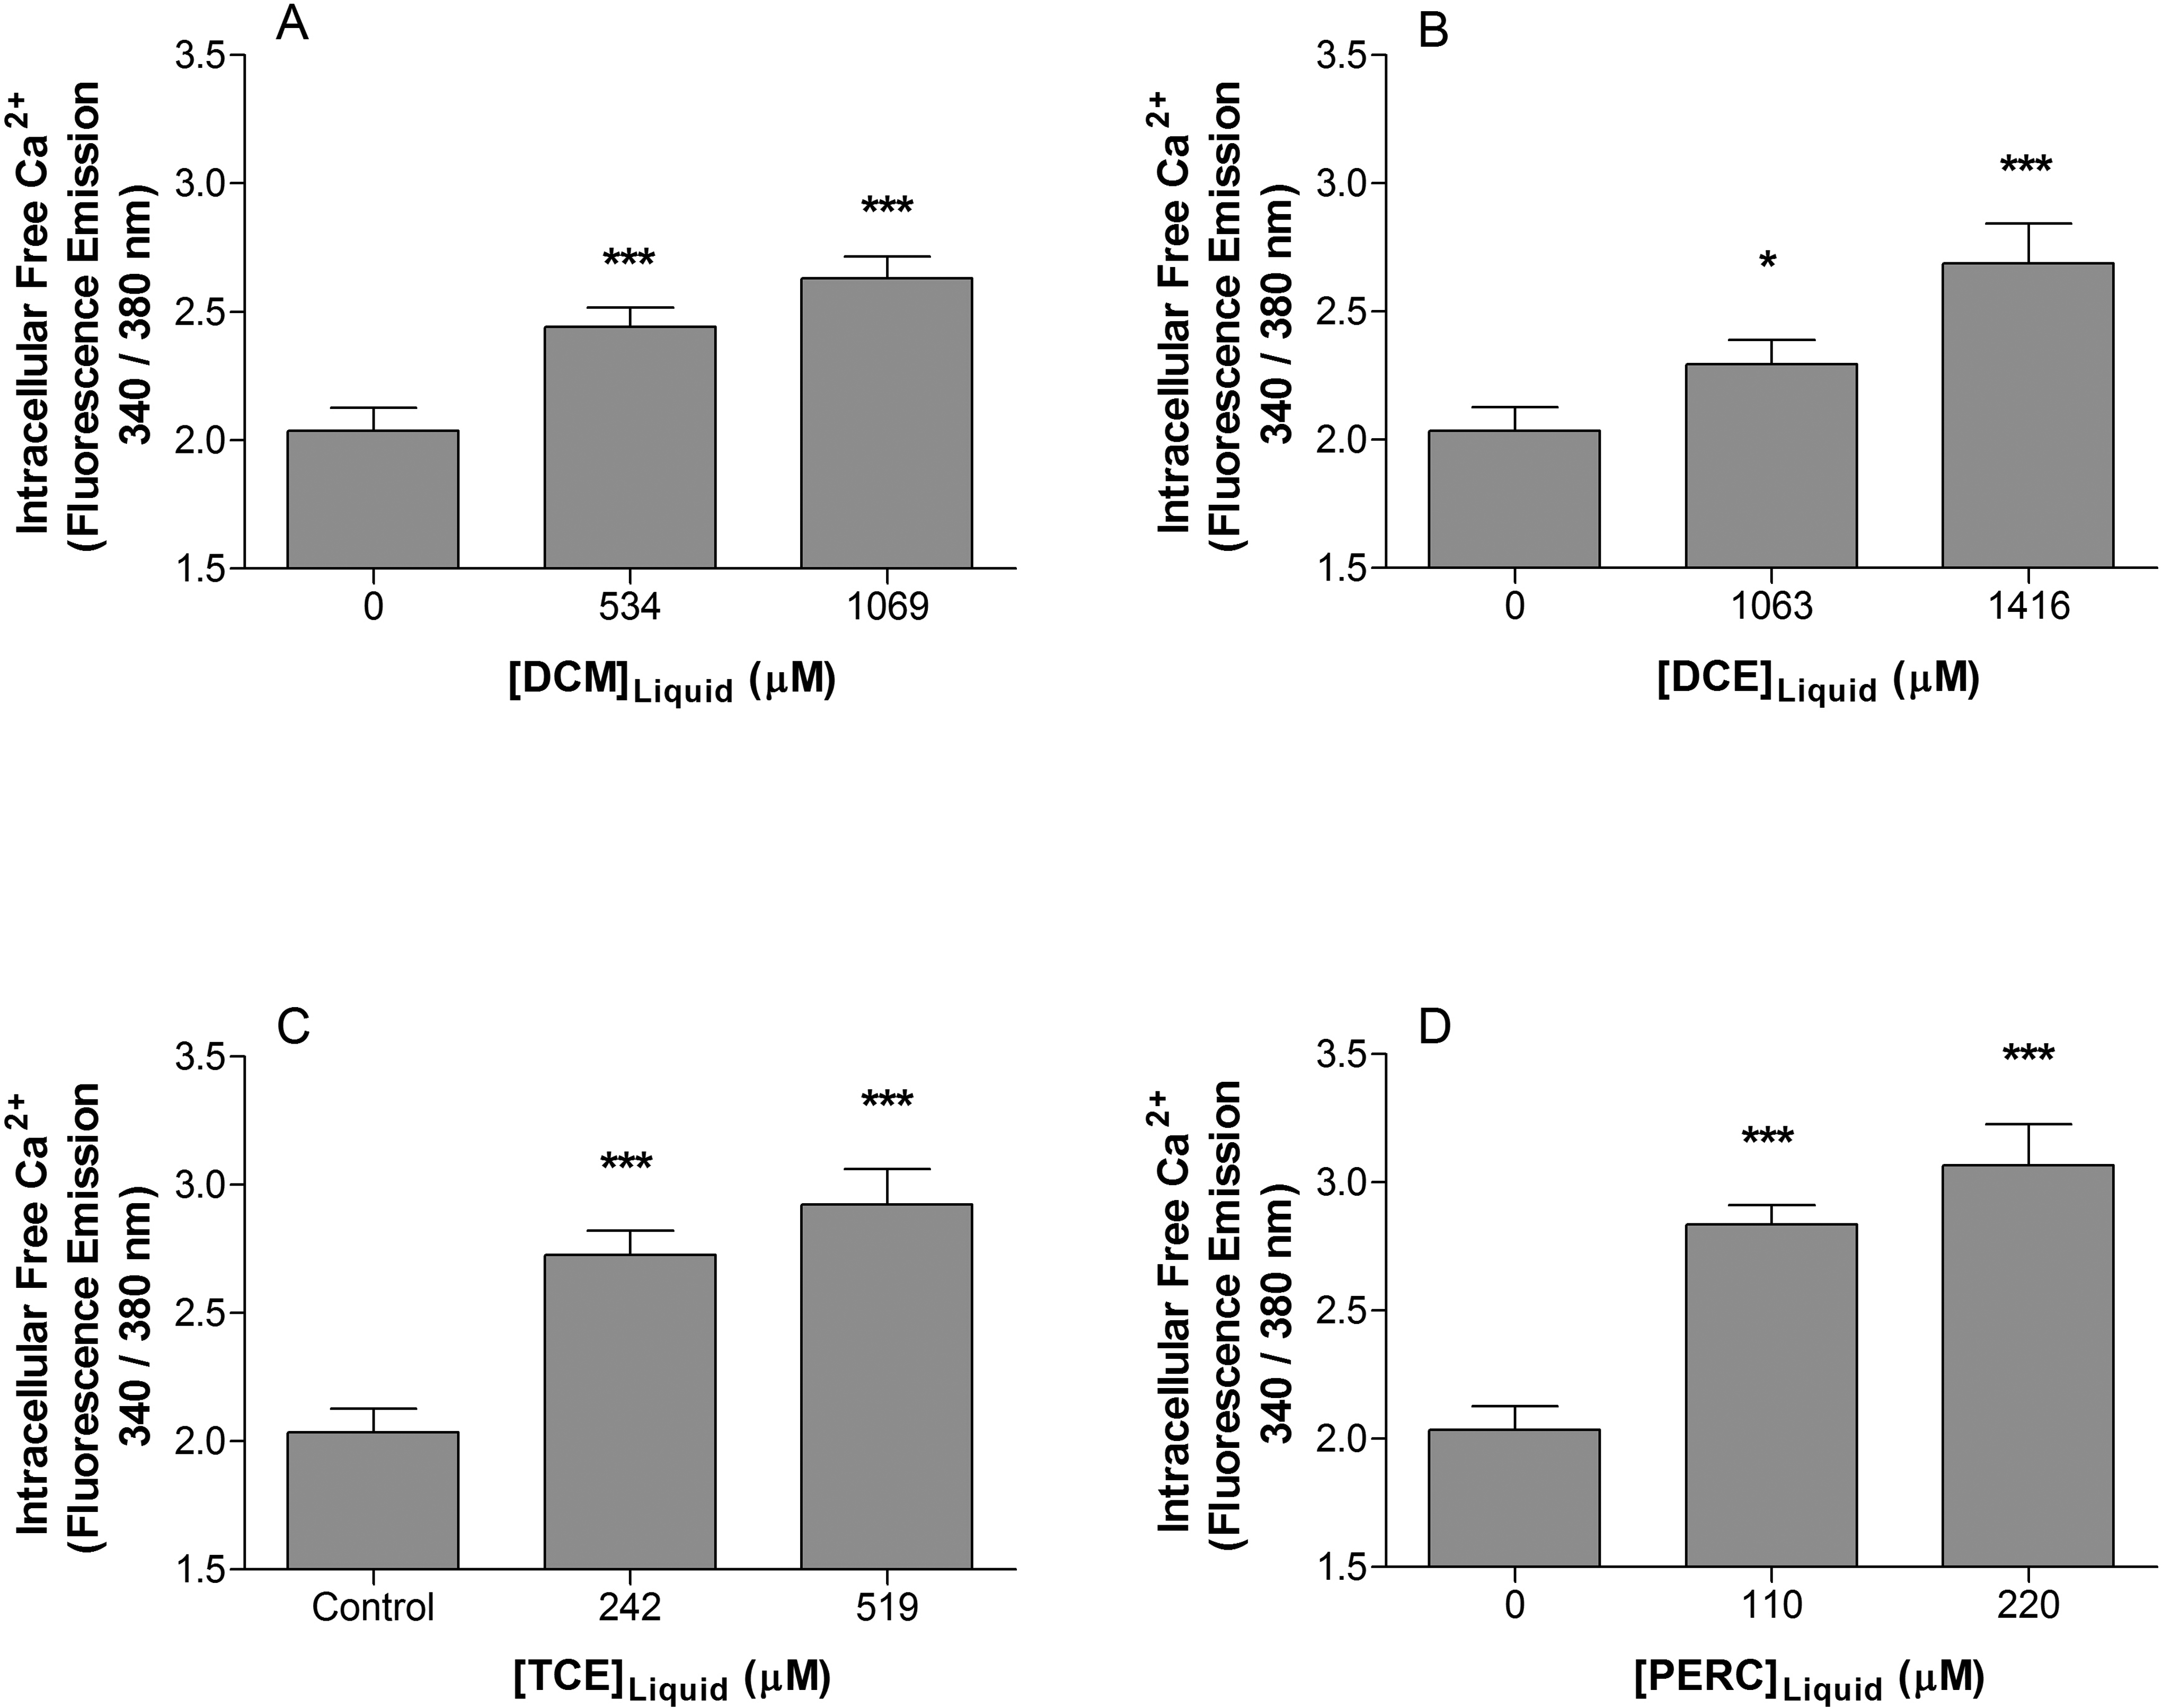
Intracellular free Ca2+ increased in Jurkat T cells following exposure to (A) dichloromethane, (B) 1,2-dichloroethane, (C) trichloroethylene, and (D) tetrachloroethylene for 3 days. Data of 4 determinations are expressed as mean ± standard deviation. Significance levels were defined as P < 0.05 (*), P < 0.01 (**), and P < 0.001 (***).
Caspase-3 Activity Following Chlorinated Solvent Exposure
Activated caspase-3 exists as an inactive procaspase-3 in the cytoplasm and is converted to the active form by cleavage events in cells undergoing apoptosis. 27 Here, we assessed the level of caspase-3 activity in Jurkat T cells following 72 hours exposure to DCM, DCE, TCE, and PERC. No significant change was observed in the level of caspase-3 activity in Jurkat T cells following exposure to DCM or DCE (Figure 4A and B). However, both TCE and PERC produced a significant concentration-dependent increase in caspase-3 activity from concentrations of 80 and 28 µmol/L, respectively (Figure 4C and D). This suggests that Jurkat T cells exposed to TCE or PERC are undergoing apoptosis. Each experiment included a vehicle control (10 µL methanol for 72 hours) and a positive control, which consisted of cells exposed to 1 µg/mL staurosporine for 2.5 hours. Treatment with staurosporine produced an increase of 1614% over the untreated control, while the highest concentrations of TCE and PERC tested resulted in 226% and 232% increases, respectively.
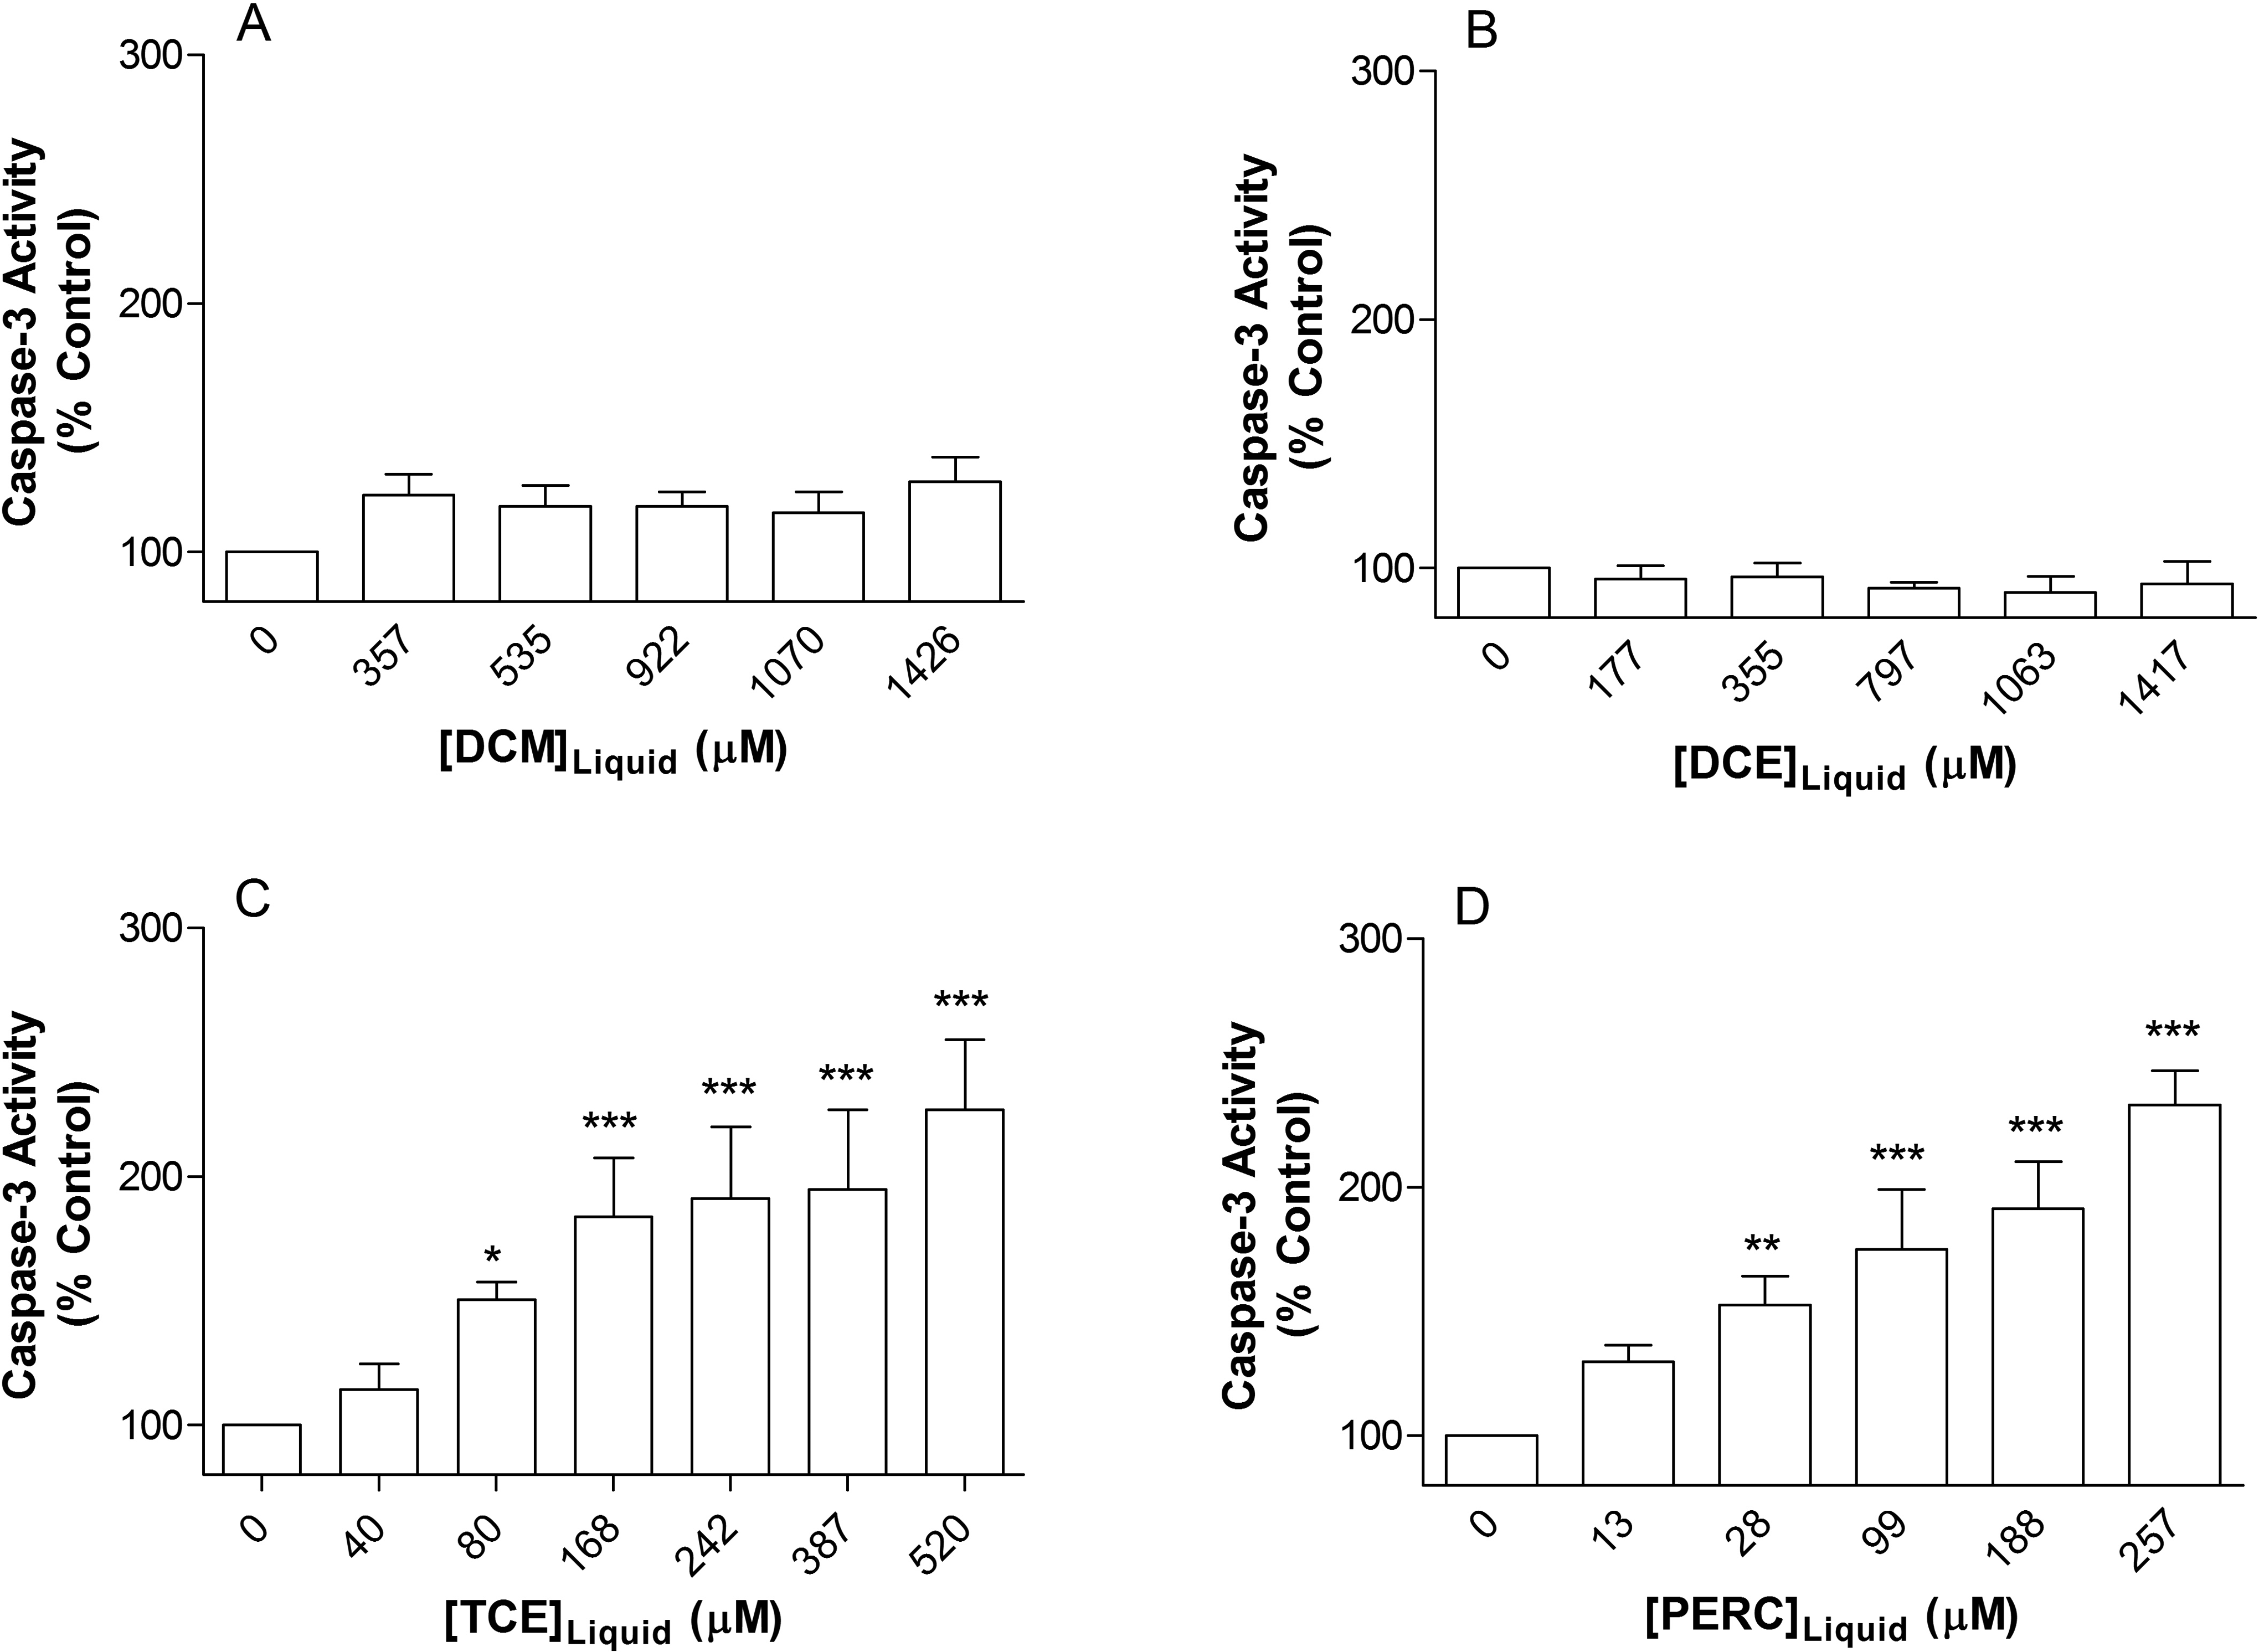
Effect of 3 days exposure to (A) DCM, (B) DCE, (C) TCE, and (D) PERC on caspase-3 activity in Jurkat T-cells. TCE and PERC exposure significantly increase caspase-3 levels, while levels in DCM- and DCE-treated cells were unaffected. Data are expressed as mean ± standard deviation of 4 determinations. Significance levels were defined as P < 0.05 (*), P < 0.01 (**), and P < 0.001 (***). DCM indicates dichloromethane; DCE, 1,2-dichloroethane; TCE, trichloroethylene; PERC, tetrachloroethylene.
Role of ROS in Chlorinated Solvent Toxicity
Jurkat T cells were pretreated with 250 µmol/L NAC for 1 hour prior to exposure to the chlorinated solvents to determine whether the increase in ROS formation was responsible for the solvent-induced changes in cell proliferation, intracellular free [Ca2+], and caspase-3 activation. In preliminary experiments, NAC was tested over a range of concentrations (100 µmol/L to 5 mmol/L; data not shown) to determine the optimal concentration capable of reducing the ROS signal following treatment with 0.1 mmol/L H2O2 to untreated control levels as detected using DCFH-DA.
To determine whether the ROS formation observed following exposure to DCM, DCE, TCE, or PERC plays a causal role in the decreased Jurkat T-cell proliferation, cells were treated with NAC prior to exposure. The NAC had a protective effect on cells exposed to all concentrations of DCM, DCE, and TCE studied and returned resazurin reduction levels to control (Figure 5A-C). Although the antioxidant returned cell proliferation to control at 110 µmol/L of PERC, it failed to protect Jurkat T cells from alterations in cell proliferation at PERC concentrations ≥188 µmol/L (Figure 5D).
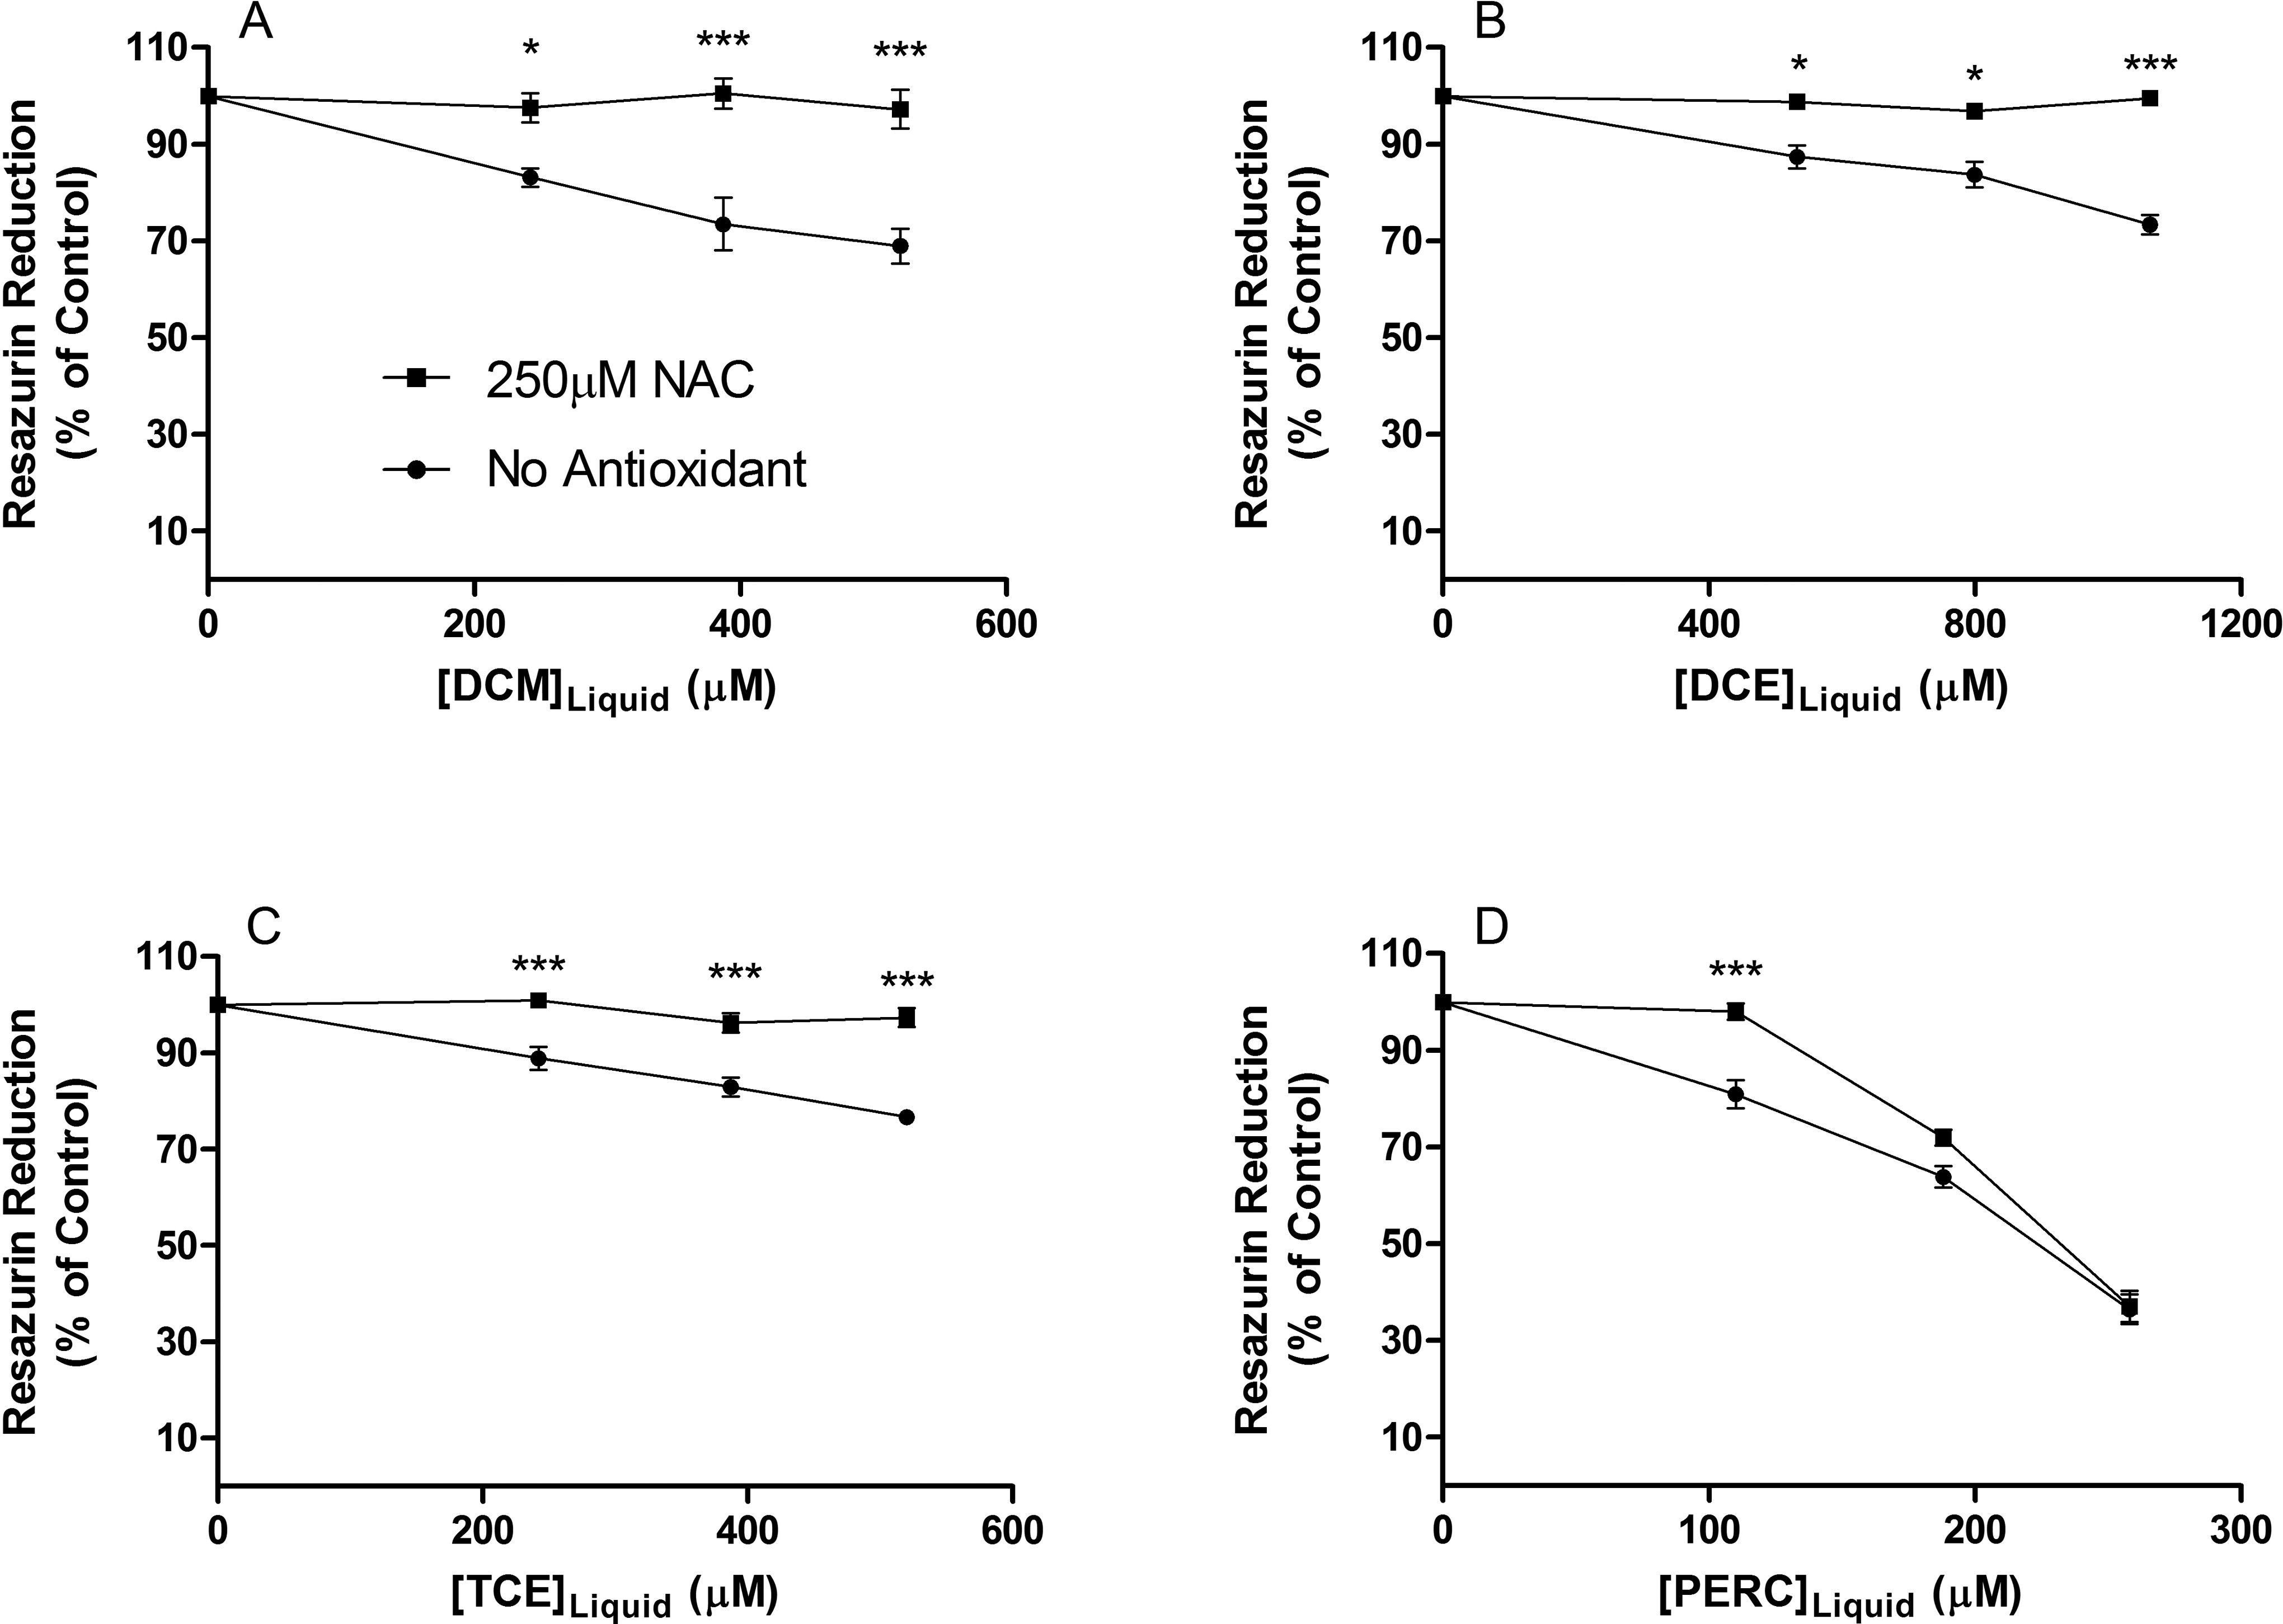
Effect of 250 µmol/L NAC pretreatment on 3-day exposure to (A) DCM, (B) DCE, (C) TCE, and (D) PERC on resazurin reduction in Jurkat T-cells. NAC had a protective effect on cells exposed to all concentrations of DCM, DCE, and TCE but only at the lowest PERC concentration tested. Data are expressed as mean ± standard deviation (SD) of 4 determinations. Significance levels were defined as P < 0.05 (*), P < 0.01 (**), and P < 0.001 (***). DCM indicates dichloromethane; DCE, 1,2-dichloroethane; TCE, trichloroethylene; PERC, tetrachloroethylene; NAC, n-acetyl-
Pretreatment with NAC did not significantly alter the solvent-induced increases in intracellular free [Ca2+] observed, which suggests that the perturbations in intracellular free [Ca2+] caused by DCM, DCE, TCE, and PERC are independent of ROS formation (Figure 6A). There was no significant change in caspase-3 activity in NAC pretreated samples exposed to 520 µmol/L of TCE or 188 µmol/L of PERC when compared to samples exposed to the solvents in the absence of the antioxidant (Figure 6B). This result indicates that ROS formation does not play a causal role in solvent-induced increases in caspase-3 activity.
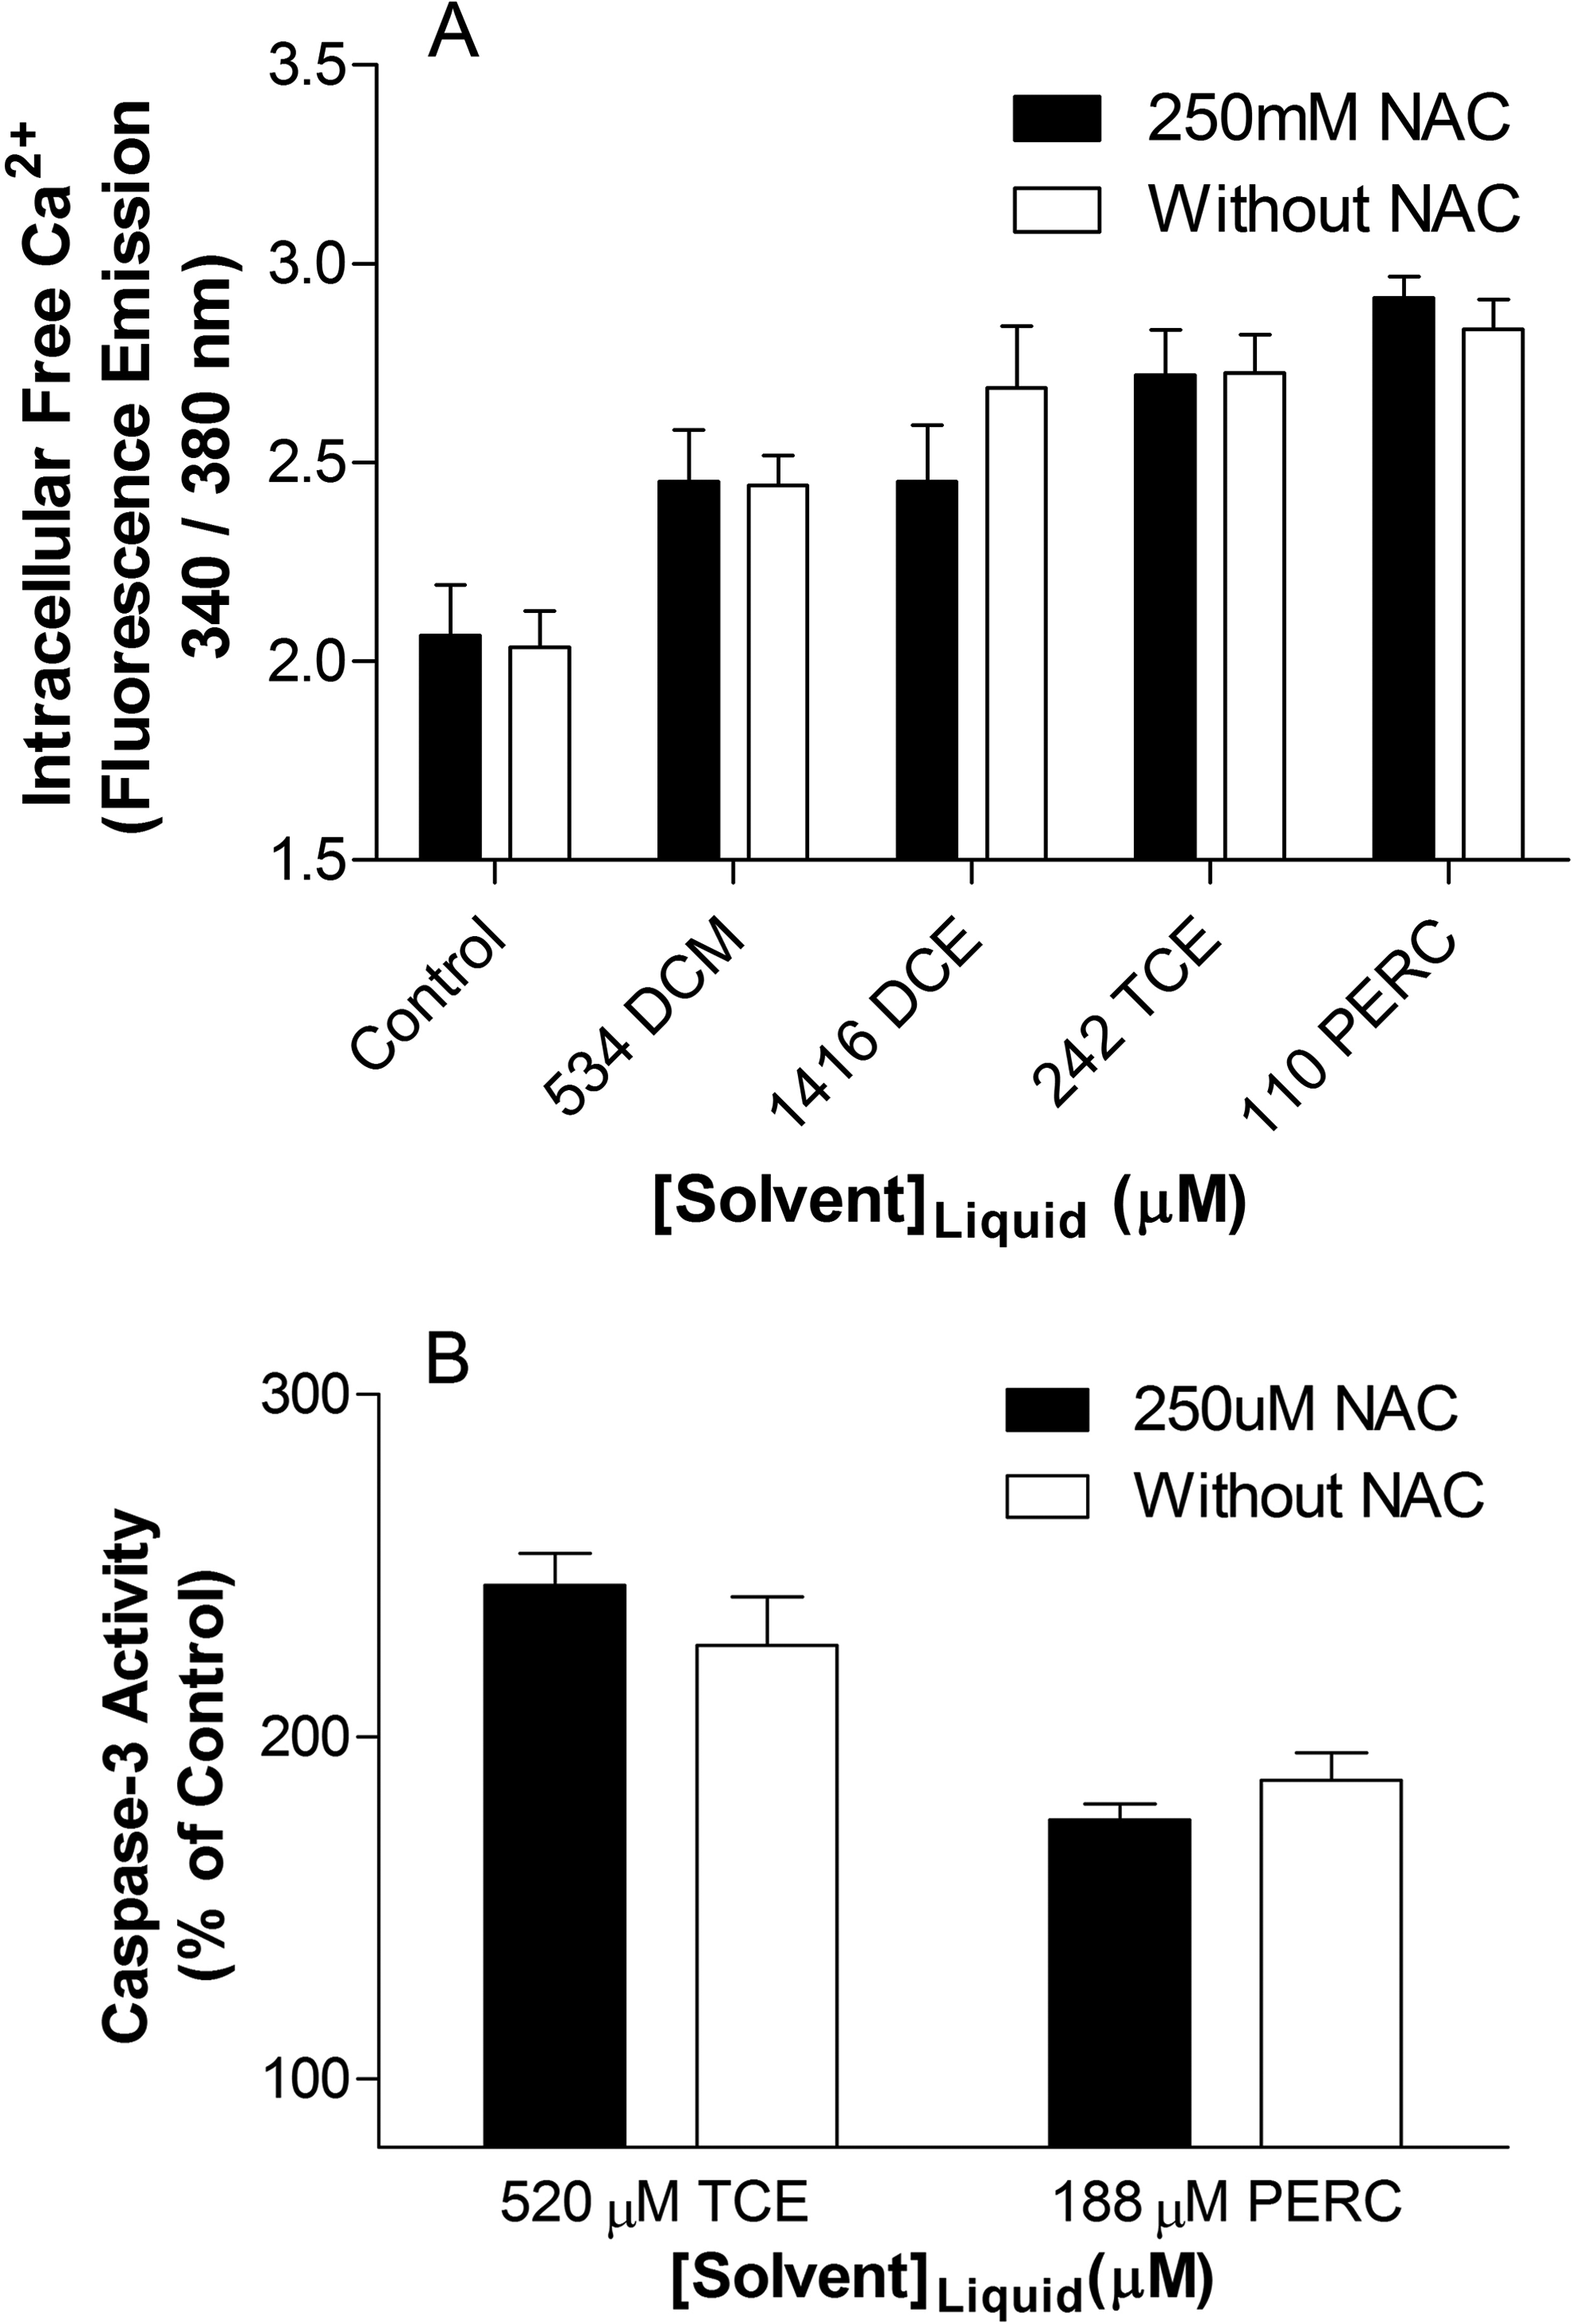
Effect of 250 µmol/L of NAC pretreatment on effects of 3-day exposure to dichloromethane, 1,2-dichloroethane, trichloroethylene, and tetrachloroethylene on (A) intracellular free Ca2+ and (B) caspase-3 activity in Jurkat T-cells. NAC did not significantly affect solvent-induced changes in intracellular free Ca2+ or caspase-3 activity. Data are expressed as mean ± standard deviation (SD) of 4 determinations. NAC, n-acetyl-
Discussion
The majority of in vitro studies are usually short ranging from 1 to 24 hours. However, human exposure to organic solvents whether it be in the home, workplace, or general outdoor environment is usually prolonged and at low concentrations. Indeed, with industrially relevant solvents such as those used in this study, human exposure is likely to be prolonged particularly for those exposed occupationally. As the majority of in vitro studies concentrate on acute high-level exposures, it is difficult to extrapolate to the chronic situation, where consequences of exposure are likely to be different. This highlights the need to assess longer exposure times that are more likely to reflect changes that would occur in in vivo occupational exposure. In addition, there is growing concern that long-term exposure to organic solvents may adversely affect the human immune system with immunotoxic effects evident from in vitro and in vivo studies.1,11,13 Hence, Jurkat T cells were chosen as an in vitro model for the human immune system as they have been used previously for in vitro solvent toxicity studies.10,17,23 Therefore, we assessed the effects of 72-hour exposure to DCM, DCE, TCE, and PERC on Jurkat T cells and found that exposure produced concentration-dependent changes in ROS formation, cell proliferation, and intracellular free [Ca2+]. Caspase-3 activity was also increased following exposure to TCE and PERC but not DCM or DCE.
Reactive oxygen species formation as been implicated as a causative factor in the toxicity of several environmental pollutants.8,16,17,28 Our results show that exposure to chlorinated solvents caused a concentration-dependent increase in ROS formation in Jurkat T cells. The NAC is a thiol compound which regulates the redox status of the cell by acting as a precursor for reduced glutathione and directly scavenging free radicals. The NAC has been shown to act as an antioxidant over a range of concentrations (0.1-30 mmol/L) in vitro. 29 The role of ROS in the development of chlorinated solvent toxicity was assessed here using NAC and results show that while ROS played a causal role in solvent-induced changes in cell proliferation, the changes in intracellular free [Ca2+] and caspase-3 activity were independent of ROS. Oxidative and nitrosative stress, which develop in TCE-exposed mice causing lipid peroxidation, are involved in the induction of autoimmune response.30,31 We previously studied the role of ROS formation in n-hexane toxicity and found that increased ROS formation preceded the membrane damage and decreased proliferation observed in n-hexane-exposed cells. 17
Alterations in intracellular [Ca2+] is one of the most fundamental intracellular signaling mechanisms found in eukaryotic cells controlling a variety of functions from cell proliferation and differentiation to cell death. 32 There is evidence that some chemicals target calcium signaling with subsequent cell death. 33 Here, we found that DCM, DCE, TCE, and PERC caused an increase in intracellular free [Ca2+] in exposed cells. Perturbations in intracellular Ca2+ homeostasis are associated with the development of toxicity in hepatocytes exposed to oxidative stress. 34 The ROS have been shown to affect ion transport mechanisms, 35 for example the activity of ryanodine receptors, and channels that regulate the release of Ca2+ from intracellular Ca2+ stores is altered by changes in cellular redox status.36 However, the increase in [Ca2+] noted in this study was independent of ROS formation. We previously found that exposure to organic solvents resulted in increased intracellular free [Ca2+] in vitro, and we proposed that this may be due to the movement of Ca2+ through solvent-damaged membranes. 10 We later found that solvent-induced membrane damage was caused by ROS formation,17 but the changes in intracellular free [Ca2+] seen here was independent of ROS, suggesting that the increase in [Ca2+] was not due to influx or release of Ca2+ through damaged membranes. Alternatively, the solvents may be acting on Ca2+ transport mechanisms. Shafer et al recently showed that TCE, PERC, and toluene disrupt voltage-sensitive Ca2+ channel function in exposed cells by altering steady-state activation and inactivation. 37 Solvents have been shown to alter the membrane adenosine triphosphatase (ATPase) activity 38 and an inability of Ca2+-ATPase to extrude or sequester Ca2+ could explain the increase seen. The involvement of Ca2+ in apoptosis is well documented. 39 It has been shown that Ca2+-activated proteases are involved in the modification of the cytoskeleton resulting in cytoplasmic bleb formation. 40
Apoptosis is long recognized as an important process in biological systems under both physiological and pathological conditions. Caspases are a family of cysteine proteases that play an essential role in apoptosis. A recent in vivo study found there were significantly higher levels of caspase-3 in TCE-exposed groups compared to controls. 8 Here, we assessed solvent-induced changes in caspase-3 activity, an executioner caspase whose activation typically ensures the completion of the apoptotic process. 41 There was no significant change in caspase-3 activity in Jurkat T cells following exposure to DCM or DCE. However, both TCE and PERC produced significant increases in caspase-3 activation, suggesting that Jurkat T cells were undergoing apoptosis. Caspase-3 can be activated by a variety of stimuli including ROS. 42 However, the increase in caspsase-3 activation in solvent-exposed Jurkat T cells was independent of ROS formation.
To see how the liquid-phase solvent concentrations used in this study compare with actual exposure situations, we looked at blood solvent concentration arising from inhalational exposure. The biological exposure indices for PERC is 0.5 mg/L (3.02 µmol/L) of venous blood collected prior to last shift of workweek. The corresponding threshold limit value (TLV) for PERC is 25 ppm. Four hours exposure to 72 ppm PERC results in a peak venous blood PERC concentration of 30.2 µmol/L. 43 Exposure to TCE at its TLV of 50 ppm for 6 hours produced a peak TCE blood concentration of 9.82 µmol/L. 44 Two hours exposure to 300 ppm TCE resulted in a blood TCE concentration of 36.9 µmol/L. 45
The prevalence of organic solvents including DCM, DCE, TCE, and PERC in the ambient air makes the exposure of the general population likely. Although the levels of these compounds in the ambient air are generally low, levels in the occupational setting can be substantially higher (TCE recorded up to 97 ppm; PERC up to 1.9 ppm). 46 In addition, residences above or adjacent to dry cleaning facilities tend to have significantly higher indoor air levels of PERC than other residences. 46 The potential for long-term, low-level exposure to these chlorinated solvents to result in immunotoxicity is of significant public and occupational health concern.
This study shows that while ROS formation as a result of solvent exposure reduces cell proliferation, changes in intracellular [Ca2+] are not triggered by ROS by either permeabilizing the cell membrane or altering the calcium transport mechanisms. The finding of elevated intracellular [Ca2+] triggered by all 4 solvents, independent of ROS formation, suggests that the solvents act on 1 or more intracellular Ca2+ store—the endoplasmic reticulum (ER) or mitochondrion. Most probable is the ER since it has already been shown that the anesthetic halothane, a chlorinated derivative of ethane, causes release of Ca2+ from the sarcoplasmic reticulum, the muscle analog of ER, by direct action on the ryanodine receptor Ca2+ release channel. 47 A similar ryanodine receptor exists in the ER of lymphocytes. Our results, therefore, indicate that there is no close connection between ROS formation and Ca2+ signaling as suggested by others. 22 Unlike the findings of Ca2+ release induced by all 4 solvents, the response of the apoptosis indicator enzyme caspase-3 was limited to the 2 most chlorinated solvents TCE and PERC and this was ROS-insensitive also.
Footnotes
Declaration of Conflicting Interests
The author(s) declared no potential conflicts of interest with respect to the research, authorship, and/or publication of this article.
Funding
The author(s) disclosed receipt of the following financial support for the research, authorship, and/or publication of this article: Supported by the Higher Education Authority (HEA), of Ireland, under the Programme for Research in Third Level Institutions, Grant number 3443.